pacbasin recalibrating valuations
TRANSCRIPT
abcGlobal Research
“Things change quickly in this business, Coco… As long as you have a seat at the table,
you have a chance. The greatest value in shipping is option value” – The Shipping Man
Time to reassess: We have been underweight on Pacific Basin since end-2012 as we saw at
least two years of earnings disappointment at the time. The earnings compression was worse
than we thought but is about to pass. We are still 33-40% below consensus on 2015-16e EPS
and believe the Street’s optimism doesn’t factor in the ease of supply creation in the sector. On
the positive side, however, we beliepve a volatile path to mid-single-digit RoE is intact since
the worst of supply growth is over. A PB of 0.8x also appears to be attractive relative to the
stock’s historical valuation.
Resilience of valuations: Our target prices in the past two years have been in the range of
a 0.5-0.6x PB, which we deemed appropriate for a low-single-digit RoE firm with a cost
of equity of c.8%. But the stock has held onto its typical post-crisis PB range of 0.8-1.1x
despite much weaker fundamentals. One of the reasons why this has happened could be
the stock’s good record of return generation when acquired at a PB of less than 0.67x.
Market-wide multiple expansion could be another reason – our analysis shows a clear
uplift in multiples even in stocks with no earnings improvement.
The value of volatility: There could be one more reason for the higher valuations.
Investors possibly appreciate the value that an unanticipated surge in freight rates can
create. It’s not just the possibility of windfall profits but also of beefy stock returns. Much
like the freight rate spike in 4Q13, short-term rallies masquerade as a recovery and are even
priced like a one. This volatility adds an option to bulk equities – it’s an option which
prices the known unknowns and known unknowns are rather frequent in bulk markets.
Raise TP to HKD4.93 (from HKD3.0) at a PB of 1.0x; upgrade to OW from UW: The
complex nature of demand and supply and the inability to forecast near-term rates crystallize
investor focus on valuations. Multiple expansion and a consistent post-crisis trading range have
raised the PB floor to 0.8x. Investors can argue that a target PB of 1.0x looks excessive for a
single-digit RoE company. But, we believe this is true only till one discovers that volatility has
a value too. We think the current low rates will trigger slow-steaming and yet another rate
spike as well as a rerating towards the top of the trading band of 0.8-1.1x.
Pacific Basin (2343 HK)
Upgrade to OW: Recalibrating valuations
We have been right on earnings for the last two years…
…but wrong on valuation, so we are changing our approach
Upgrade to Overweight from Underweight with TP of HKD4.93 (from HKD3.0), implying a 2015e PB of 1.0x
Industrials Marine Equity – Hong Kong
Company report
Index^ HANG SENG INDEXIndex level 22,933RIC 2343.HKBloomberg 2343 HK
Source: HSBC
Overweight Target price (HKD) 4.93 Share price (HKD) 3.98 Forecast dividend yield (%) 2.0 Potential return (%) 25.9
Note: Potential return equals the percentage difference between the current share price and the target price, plus the forecast dividend yield
Dec 2013 a 2014 e 2015 e
HSBC EPS 0.00 -0.01 0.03 HSBC PE 18.8
Performance 1M 3M 12M
Absolute (%) -16.2 -17.1 -24.2 Relative^ (%) -7.5 -14.9 -23.3
Enterprise value (USDm) 1575Free float (%) 98Market cap (USDm) 993Market cap (HKDm) 7,709
Source: HSBC
6 October 2014
Shishir Singh* Analyst The Hongkong and Shanghai Banking Corporation Limited +852 2822 4292 [email protected]
Mark Webb* Head of Conglomerate and Transport Research, Asia Pacific The Hongkong and Shanghai Banking Corporation Limited +852 2996 6574 [email protected]
View HSBC Global Research at: http://www.research.hsbc.com
*Employed by a non-US affiliate of HSBC Securities (USA) Inc, and is not registered/qualified pursuant to FINRA regulations
Issuer of report: The Hongkong and Shanghai Banking Corporation Limited
Disclaimer & Disclosures This report must be read with the disclosures and the analyst certifications in the Disclosure appendix, and with the Disclaimer, which forms part of it
2
Pacific Basin (2343 HK) Marine 6 October 2014
abc
Financials & valuation Financial statements
Year to 12/2013a 12/2014e 12/2015e 12/2016e
Profit & loss summary (USDm)
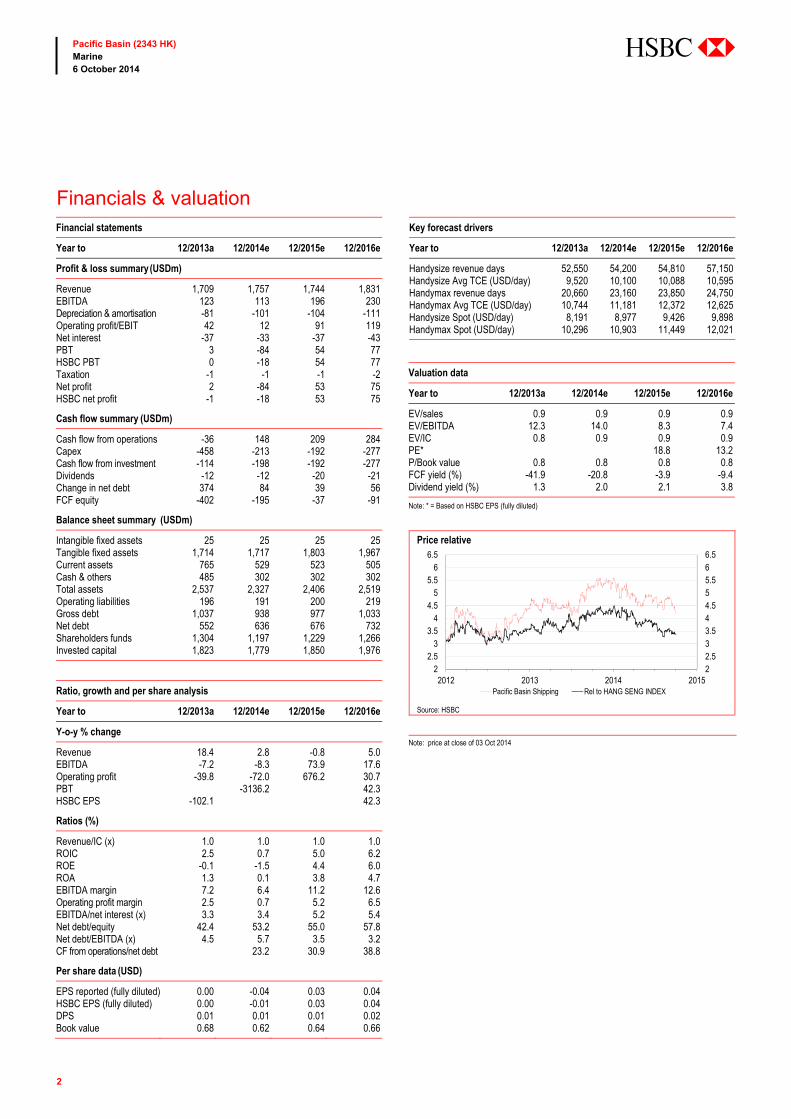
Revenue 1,709 1,757 1,744 1,831EBITDA 123 113 196 230Depreciation & amortisation -81 -101 -104 -111Operating profit/EBIT 42 12 91 119Net interest -37 -33 -37 -43PBT 3 -84 54 77HSBC PBT 0 -18 54 77Taxation -1 -1 -1 -2Net profit 2 -84 53 75HSBC net profit -1 -18 53 75
Cash flow summary (USDm)
Cash flow from operations -36 148 209 284Capex -458 -213 -192 -277Cash flow from investment -114 -198 -192 -277Dividends -12 -12 -20 -21Change in net debt 374 84 39 56FCF equity -402 -195 -37 -91
Balance sheet summary (USDm)
Intangible fixed assets 25 25 25 25Tangible fixed assets 1,714 1,717 1,803 1,967Current assets 765 529 523 505Cash & others 485 302 302 302Total assets 2,537 2,327 2,406 2,519Operating liabilities 196 191 200 219Gross debt 1,037 938 977 1,033Net debt 552 636 676 732Shareholders funds 1,304 1,197 1,229 1,266Invested capital 1,823 1,779 1,850 1,976
Ratio, growth and per share analysis
Year to 12/2013a 12/2014e 12/2015e 12/2016e
Y-o-y % change
Revenue 18.4 2.8 -0.8 5.0EBITDA -7.2 -8.3 73.9 17.6Operating profit -39.8 -72.0 676.2 30.7PBT -3136.2 42.3HSBC EPS -102.1 42.3
Ratios (%)
Revenue/IC (x) 1.0 1.0 1.0 1.0ROIC 2.5 0.7 5.0 6.2ROE -0.1 -1.5 4.4 6.0ROA 1.3 0.1 3.8 4.7EBITDA margin 7.2 6.4 11.2 12.6Operating profit margin 2.5 0.7 5.2 6.5EBITDA/net interest (x) 3.3 3.4 5.2 5.4Net debt/equity 42.4 53.2 55.0 57.8Net debt/EBITDA (x) 4.5 5.7 3.5 3.2CF from operations/net debt 23.2 30.9 38.8
Per share data (USD)
EPS reported (fully diluted) 0.00 -0.04 0.03 0.04HSBC EPS (fully diluted) 0.00 -0.01 0.03 0.04DPS 0.01 0.01 0.01 0.02Book value 0.68 0.62 0.64 0.66
Key forecast drivers
Year to 12/2013a 12/2014e 12/2015e 12/2016e
Handysize revenue days 52,550 54,200 54,810 57,150Handysize Avg TCE (USD/day) 9,520 10,100 10,088 10,595Handymax revenue days 20,660 23,160 23,850 24,750Handymax Avg TCE (USD/day) 10,744 11,181 12,372 12,625Handysize Spot (USD/day) 8,191 8,977 9,426 9,898Handymax Spot (USD/day) 10,296 10,903 11,449 12,021
Valuation data
Year to 12/2013a 12/2014e 12/2015e 12/2016e
EV/sales 0.9 0.9 0.9 0.9EV/EBITDA 12.3 14.0 8.3 7.4EV/IC 0.8 0.9 0.9 0.9PE* 18.8 13.2P/Book value 0.8 0.8 0.8 0.8FCF yield (%) -41.9 -20.8 -3.9 -9.4Dividend yield (%) 1.3 2.0 2.1 3.8
Note: * = Based on HSBC EPS (fully diluted)
Price relative
Source: HSBC Note: price at close of 03 Oct 2014
22.533.544.555.566.5
22.5
33.5
44.5
55.5
66.5
2012 2013 2014 2015Pacific Basin Shipping Rel to HANG SENG INDEX
3
Pacific Basin (2343 HK) Marine 6 October 2014
abc
Earnings compression passes; off to mid-single-digit RoEs now
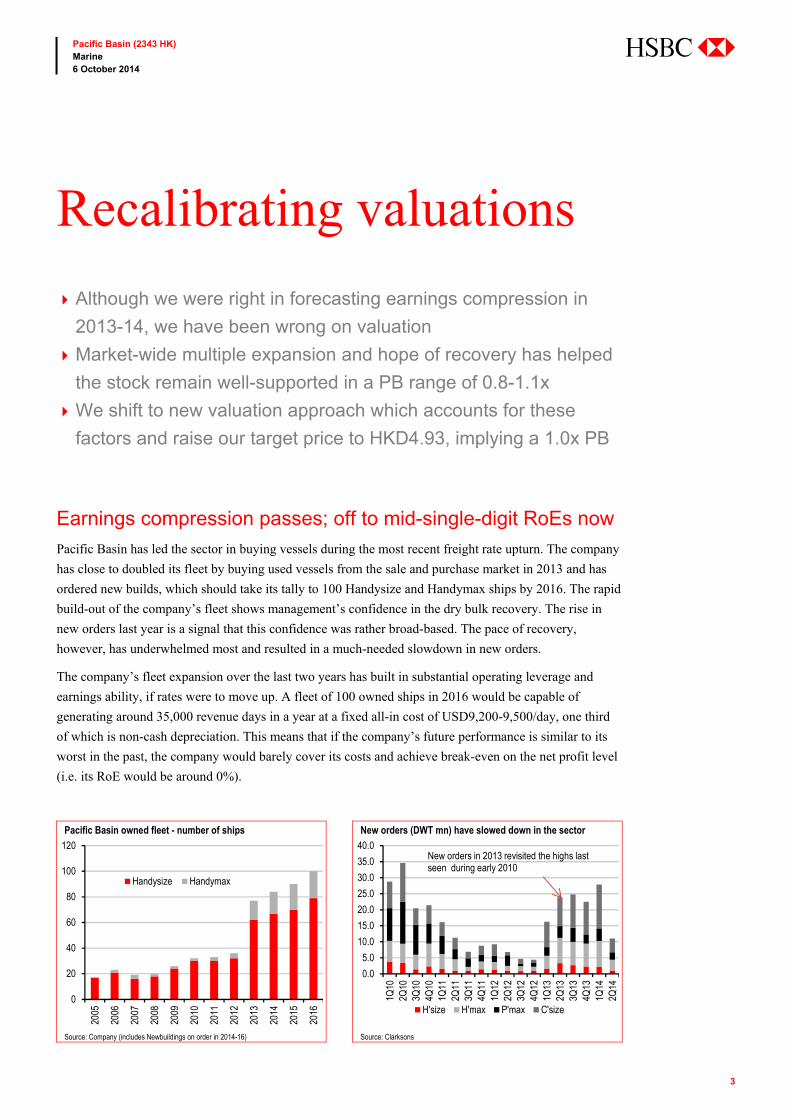
Pacific Basin has led the sector in buying vessels during the most recent freight rate upturn. The company
has close to doubled its fleet by buying used vessels from the sale and purchase market in 2013 and has
ordered new builds, which should take its tally to 100 Handysize and Handymax ships by 2016. The rapid
build-out of the company’s fleet shows management’s confidence in the dry bulk recovery. The rise in
new orders last year is a signal that this confidence was rather broad-based. The pace of recovery,
however, has underwhelmed most and resulted in a much-needed slowdown in new orders.
The company’s fleet expansion over the last two years has built in substantial operating leverage and
earnings ability, if rates were to move up. A fleet of 100 owned ships in 2016 would be capable of
generating around 35,000 revenue days in a year at a fixed all-in cost of USD9,200-9,500/day, one third
of which is non-cash depreciation. This means that if the company’s future performance is similar to its
worst in the past, the company would barely cover its costs and achieve break-even on the net profit level
(i.e. its RoE would be around 0%).
Recalibrating valuations
Although we were right in forecasting earnings compression in
2013-14, we have been wrong on valuation
Market-wide multiple expansion and hope of recovery has helped
the stock remain well-supported in a PB range of 0.8-1.1x
We shift to new valuation approach which accounts for these
factors and raise our target price to HKD4.93, implying a 1.0x PB
Pacific Basin owned fleet - number of ships New orders (DWT mn) have slowed down in the sector
Source: Company (includes Newbuildings on order in 2014-16) Source: Clarksons
0
20
40
60
80
100
120
2005
2006
2007
2008
2009
2010
2011
2012
2013
2014
2015
2016
Handysize Handymax
0.0
5.0
10.0
15.0
20.0
25.0
30.0
35.0
40.0
1Q10
2Q10
3Q10
4Q10
1Q11
2Q11
3Q11
4Q11
1Q12
2Q12
3Q12
4Q12
1Q13
2Q13
3Q13
4Q13
1Q14
2Q14
H'size H'max P'max C'size
New orders in 2013 revisited the highs lastseen during early 2010
4
Pacific Basin (2343 HK) Marine 6 October 2014
abc
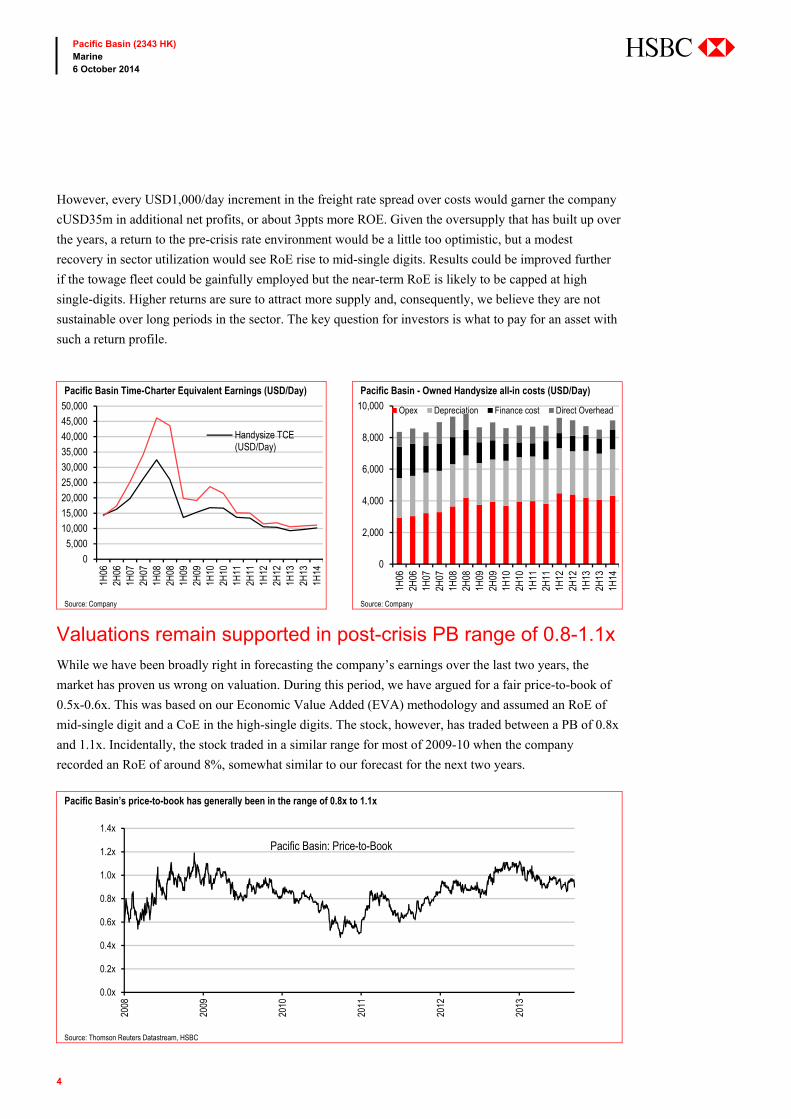
However, every USD1,000/day increment in the freight rate spread over costs would garner the company
cUSD35m in additional net profits, or about 3ppts more ROE. Given the oversupply that has built up over
the years, a return to the pre-crisis rate environment would be a little too optimistic, but a modest
recovery in sector utilization would see RoE rise to mid-single digits. Results could be improved further
if the towage fleet could be gainfully employed but the near-term RoE is likely to be capped at high
single-digits. Higher returns are sure to attract more supply and, consequently, we believe they are not
sustainable over long periods in the sector. The key question for investors is what to pay for an asset with
such a return profile.
Valuations remain supported in post-crisis PB range of 0.8-1.1x
While we have been broadly right in forecasting the company’s earnings over the last two years, the
market has proven us wrong on valuation. During this period, we have argued for a fair price-to-book of
0.5x-0.6x. This was based on our Economic Value Added (EVA) methodology and assumed an RoE of
mid-single digit and a CoE in the high-single digits. The stock, however, has traded between a PB of 0.8x
and 1.1x. Incidentally, the stock traded in a similar range for most of 2009-10 when the company
recorded an RoE of around 8%, somewhat similar to our forecast for the next two years.
Pacific Basin Time-Charter Equivalent Earnings (USD/Day) Pacific Basin - Owned Handysize all-in costs (USD/Day)
Source: Company Source: Company
Pacific Basin’s price-to-book has generally been in the range of 0.8x to 1.1x
Source: Thomson Reuters Datastream, HSBC
0
5,000
10,000
15,000
20,000
25,000
30,000
35,000
40,000
45,000
50,000
1H06
2H06
1H07
2H07
1H08
2H08
1H09
2H09
1H10
2H10
1H11
2H11
1H12
2H12
1H13
2H13
1H14
Handysize TCE(USD/Day)
0
2,000
4,000
6,000
8,000
10,0001H
062H
061H
072H
071H
082H
081H
092H
091H
102H
101H
112H
111H
122H
121H
132H
131H
14
Opex Depreciation Finance cost Direct Overhead
0.0x
0.2x
0.4x
0.6x
0.8x
1.0x
1.2x
1.4x
2008
2009
2010
2011
2012
2013
Pacific Basin: Price-to-Book
5
Pacific Basin (2343 HK) Marine 6 October 2014
abc
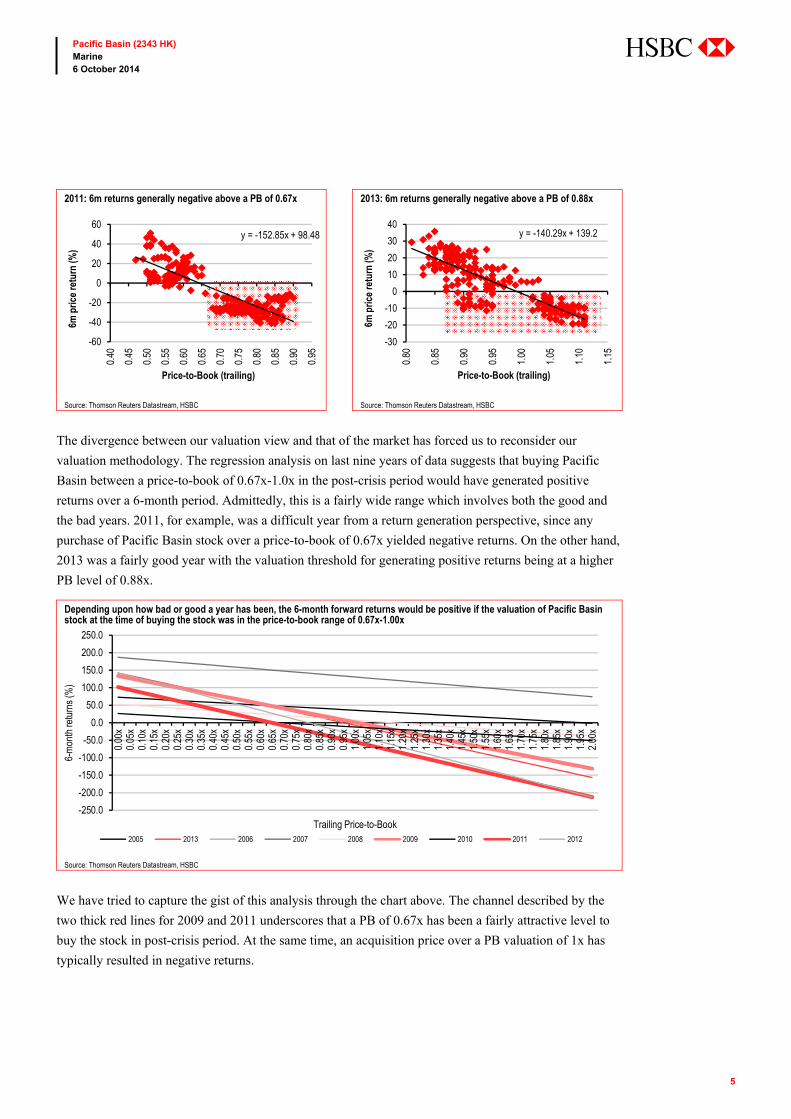
The divergence between our valuation view and that of the market has forced us to reconsider our
valuation methodology. The regression analysis on last nine years of data suggests that buying Pacific
Basin between a price-to-book of 0.67x-1.0x in the post-crisis period would have generated positive
returns over a 6-month period. Admittedly, this is a fairly wide range which involves both the good and
the bad years. 2011, for example, was a difficult year from a return generation perspective, since any
purchase of Pacific Basin stock over a price-to-book of 0.67x yielded negative returns. On the other hand,
2013 was a fairly good year with the valuation threshold for generating positive returns being at a higher
PB level of 0.88x.
We have tried to capture the gist of this analysis through the chart above. The channel described by the
two thick red lines for 2009 and 2011 underscores that a PB of 0.67x has been a fairly attractive level to
buy the stock in post-crisis period. At the same time, an acquisition price over a PB valuation of 1x has
typically resulted in negative returns.
2011: 6m returns generally negative above a PB of 0.67x 2013: 6m returns generally negative above a PB of 0.88x
Source: Thomson Reuters Datastream, HSBC Source: Thomson Reuters Datastream, HSBC
Depending upon how bad or good a year has been, the 6-month forward returns would be positive if the valuation of Pacific Basin stock at the time of buying the stock was in the price-to-book range of 0.67x-1.00x
Source: Thomson Reuters Datastream, HSBC
y = -152.85x + 98.48
-60
-40
-20
0
20
40
60
0.40
0.45
0.50
0.55
0.60
0.65
0.70
0.75
0.80
0.85
0.90
0.95
6m p
rice
retu
rn (%
)
Price-to-Book (trailing)
y = -140.29x + 139.2
-30
-20
-10
0
10
20
30
40
0.80
0.85
0.90
0.95
1.00
1.05
1.10
1.15
6m p
rice
retu
rn (%
)Price-to-Book (trailing)
-250.0
-200.0
-150.0
-100.0
-50.0
0.0
50.0
100.0
150.0
200.0
250.0
0.00
x0.
05x
0.10
x0.
15x
0.20
x0.
25x
0.30
x0.
35x
0.40
x0.
45x
0.50
x0.
55x
0.60
x0.
65x
0.70
x0.
75x
0.80
x0.
85x
0.90
x0.
95x
1.00
x1.
05x
1.10
x1.
15x
1.20
x1.
25x
1.30
x1.
35x
1.40
x1.
45x
1.50
x1.
55x
1.60
x1.
65x
1.70
x1.
75x
1.80
x1.
85x
1.90
x1.
95x
2.00
x
6-m
onth
retu
rns
(%)
Trailing Price-to-Book 2005 2013 2006 2007 2008 2009 2010 2011 2012
6
Pacific Basin (2343 HK) Marine 6 October 2014
abc
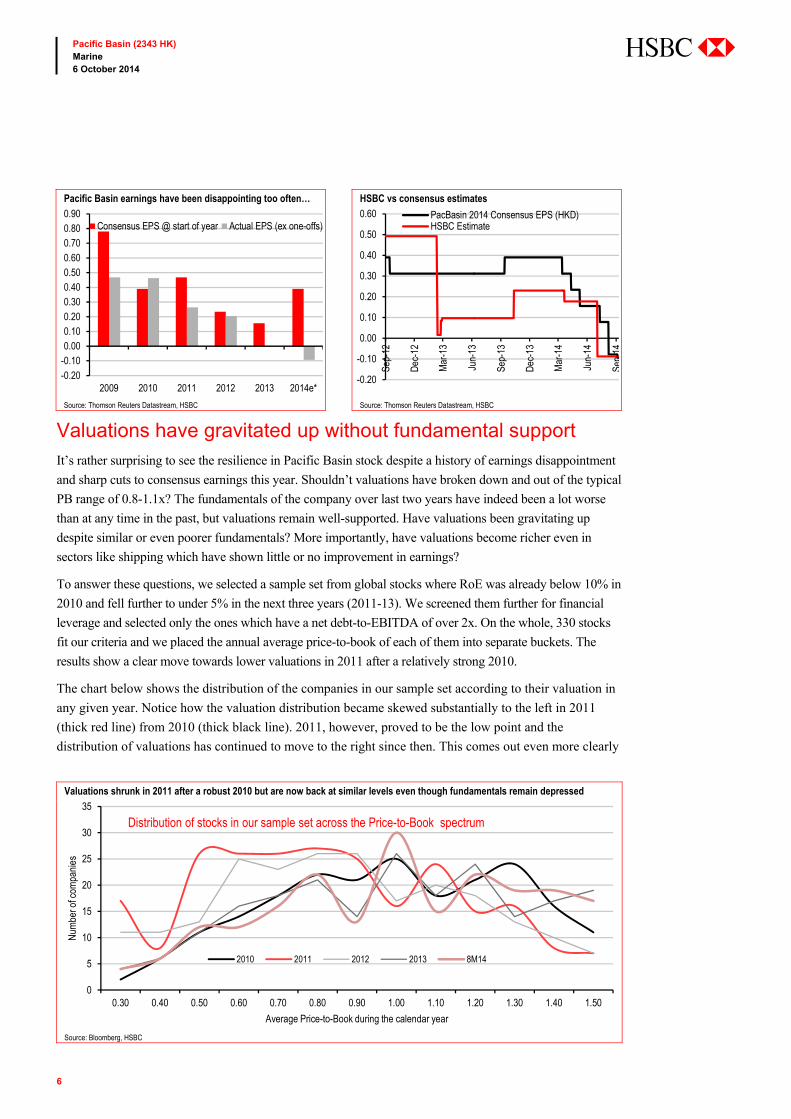
Valuations have gravitated up without fundamental support It’s rather surprising to see the resilience in Pacific Basin stock despite a history of earnings disappointment
and sharp cuts to consensus earnings this year. Shouldn’t valuations have broken down and out of the typical
PB range of 0.8-1.1x? The fundamentals of the company over last two years have indeed been a lot worse
than at any time in the past, but valuations remain well-supported. Have valuations been gravitating up
despite similar or even poorer fundamentals? More importantly, have valuations become richer even in
sectors like shipping which have shown little or no improvement in earnings?
To answer these questions, we selected a sample set from global stocks where RoE was already below 10% in
2010 and fell further to under 5% in the next three years (2011-13). We screened them further for financial
leverage and selected only the ones which have a net debt-to-EBITDA of over 2x. On the whole, 330 stocks
fit our criteria and we placed the annual average price-to-book of each of them into separate buckets. The
results show a clear move towards lower valuations in 2011 after a relatively strong 2010.
The chart below shows the distribution of the companies in our sample set according to their valuation in
any given year. Notice how the valuation distribution became skewed substantially to the left in 2011
(thick red line) from 2010 (thick black line). 2011, however, proved to be the low point and the
distribution of valuations has continued to move to the right since then. This comes out even more clearly
Valuations shrunk in 2011 after a robust 2010 but are now back at similar levels even though fundamentals remain depressed
Source: Bloomberg, HSBC
Pacific Basin earnings have been disappointing too often… HSBC vs consensus estimates
Source: Thomson Reuters Datastream, HSBC Source: Thomson Reuters Datastream, HSBC
0
5
10
15
20
25
30
35
0.30 0.40 0.50 0.60 0.70 0.80 0.90 1.00 1.10 1.20 1.30 1.40 1.50
Num
ber o
f com
pani
es
Average Price-to-Book during the calendar year
2010 2011 2012 2013 8M14
Distribution of stocks in our sample set across the Price-to-Book spectrum
-0.20-0.100.000.100.200.300.400.500.600.700.800.90
2009 2010 2011 2012 2013 2014e*
Consensus EPS @ start of year Actual EPS (ex one-offs)
-0.20
-0.10
0.00
0.10
0.20
0.30
0.40
0.50
0.60
Sep-
12
Dec
-12
Mar
-13
Jun-
13
Sep-
13
Dec
-13
Mar
-14
Jun-
14
Sep-
14
PacBasin 2014 Consensus EPS (HKD)HSBC Estimate
7
Pacific Basin (2343 HK) Marine 6 October 2014
abc
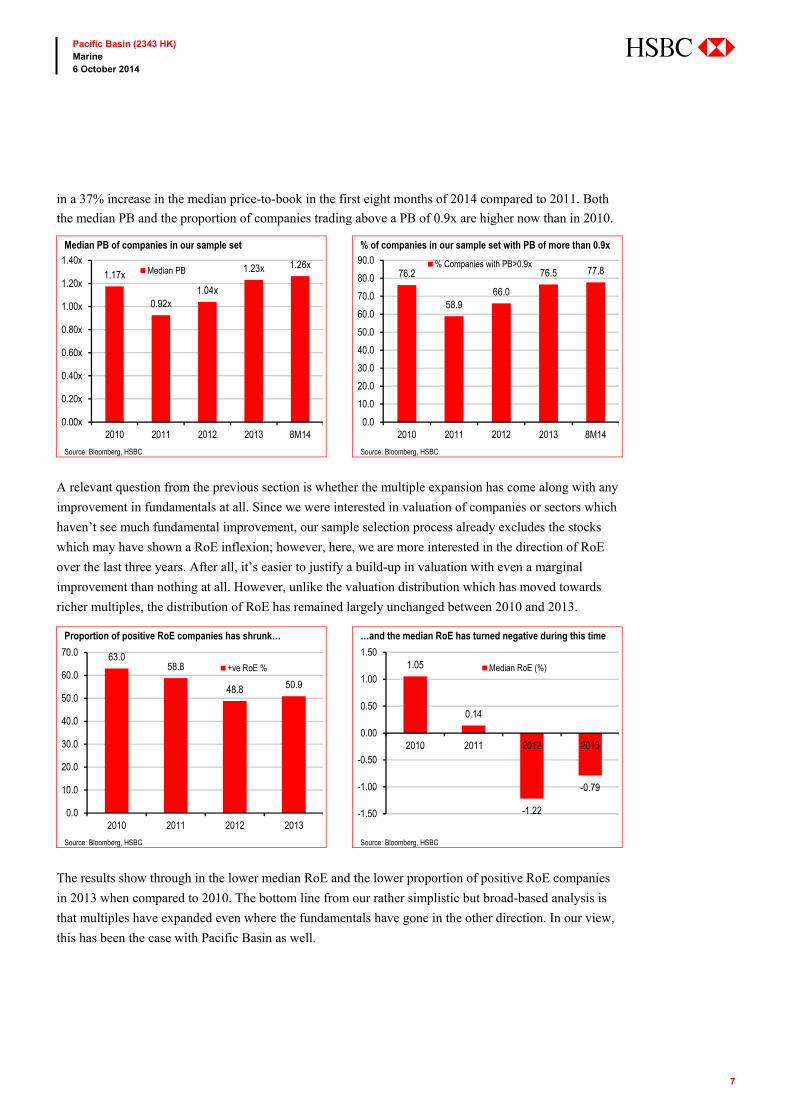
in a 37% increase in the median price-to-book in the first eight months of 2014 compared to 2011. Both
the median PB and the proportion of companies trading above a PB of 0.9x are higher now than in 2010.
A relevant question from the previous section is whether the multiple expansion has come along with any
improvement in fundamentals at all. Since we were interested in valuation of companies or sectors which
haven’t see much fundamental improvement, our sample selection process already excludes the stocks
which may have shown a RoE inflexion; however, here, we are more interested in the direction of RoE
over the last three years. After all, it’s easier to justify a build-up in valuation with even a marginal
improvement than nothing at all. However, unlike the valuation distribution which has moved towards
richer multiples, the distribution of RoE has remained largely unchanged between 2010 and 2013.
The results show through in the lower median RoE and the lower proportion of positive RoE companies
in 2013 when compared to 2010. The bottom line from our rather simplistic but broad-based analysis is
that multiples have expanded even where the fundamentals have gone in the other direction. In our view,
this has been the case with Pacific Basin as well.
Median PB of companies in our sample set % of companies in our sample set with PB of more than 0.9x
Source: Bloomberg, HSBC Source: Bloomberg, HSBC
Proportion of positive RoE companies has shrunk… …and the median RoE has turned negative during this time
Source: Bloomberg, HSBC Source: Bloomberg, HSBC
1.17x
0.92x1.04x
1.23x 1.26x
0.00x
0.20x
0.40x
0.60x
0.80x
1.00x
1.20x
1.40x
2010 2011 2012 2013 8M14
Median PB 76.2
58.966.0
76.5 77.8
0.0
10.0
20.0
30.0
40.0
50.0
60.0
70.0
80.0
90.0
2010 2011 2012 2013 8M14
% Companies with PB>0.9x
63.058.8
48.8 50.9
0.0
10.0
20.0
30.0
40.0
50.0
60.0
70.0
2010 2011 2012 2013
+ve RoE % 1.05
0.14
-1.22
-0.79
-1.50
-1.00
-0.50
0.00
0.50
1.00
1.50
2010 2011 2012 2013
Median RoE (%)
8
Pacific Basin (2343 HK) Marine 6 October 2014
abc
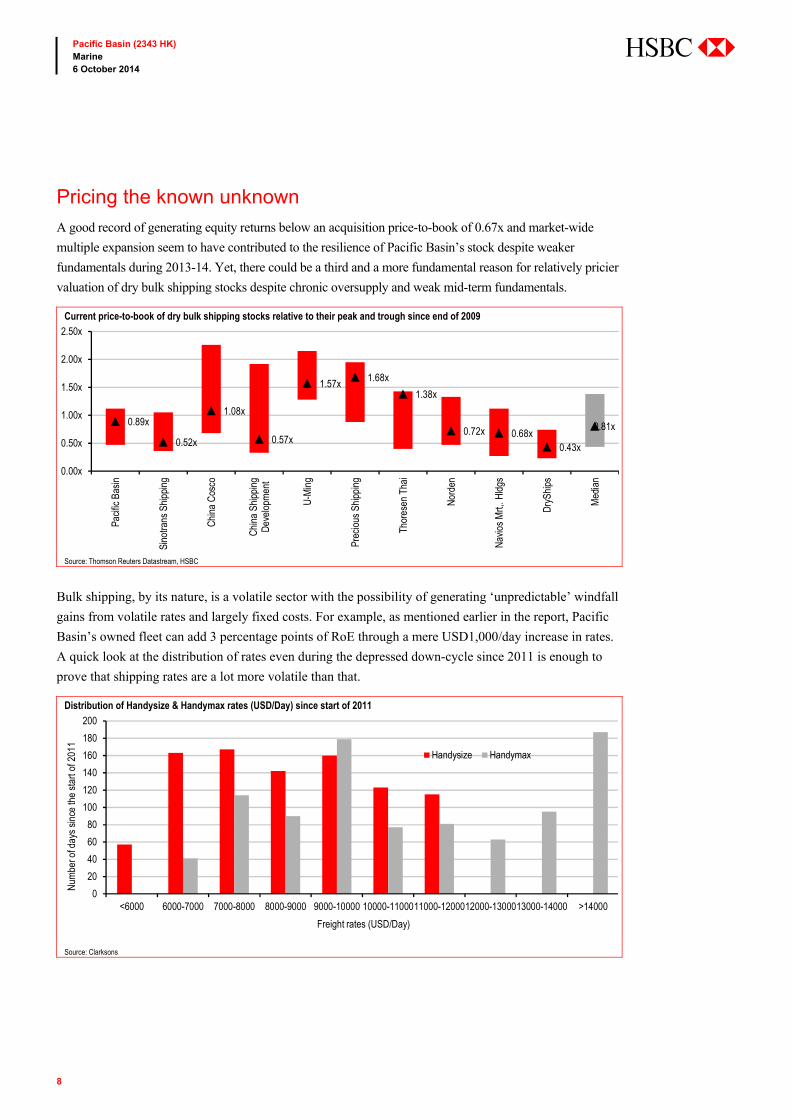
Pricing the known unknown
A good record of generating equity returns below an acquisition price-to-book of 0.67x and market-wide
multiple expansion seem to have contributed to the resilience of Pacific Basin’s stock despite weaker
fundamentals during 2013-14. Yet, there could be a third and a more fundamental reason for relatively pricier
valuation of dry bulk shipping stocks despite chronic oversupply and weak mid-term fundamentals.
Current price-to-book of dry bulk shipping stocks relative to their peak and trough since end of 2009
Source: Thomson Reuters Datastream, HSBC
Bulk shipping, by its nature, is a volatile sector with the possibility of generating ‘unpredictable’ windfall
gains from volatile rates and largely fixed costs. For example, as mentioned earlier in the report, Pacific
Basin’s owned fleet can add 3 percentage points of RoE through a mere USD1,000/day increase in rates.
A quick look at the distribution of rates even during the depressed down-cycle since 2011 is enough to
prove that shipping rates are a lot more volatile than that.
Distribution of Handysize & Handymax rates (USD/Day) since start of 2011
Source: Clarksons
0.89x
0.52x
1.08x
0.57x
1.57x1.68x
1.38x
0.72x 0.68x0.43x
0.81x
0.00x
0.50x
1.00x
1.50x
2.00x
2.50x
Paci
fic B
asin
Sino
trans
Shi
ppin
g
Chi
na C
osco
Chi
na S
hipp
ing
Dev
elop
men
t
U-M
ing
Prec
ious
Shi
ppin
g
Thor
esen
Tha
i
Nor
den
Nav
ios
Mrt,
. Hld
gs
Dry
Ship
s
Med
ian
0
20
40
60
80
100
120
140
160
180
200
<6000 6000-7000 7000-8000 8000-9000 9000-10000 10000-1100011000-1200012000-1300013000-14000 >14000
Num
ber o
f day
s si
nce
the
star
t of 2
011
Freight rates (USD/Day)
Handysize Handymax
9
Pacific Basin (2343 HK) Marine 6 October 2014
abc
Investors need to recognize that bulk shipping rates are determined by the confluence of two complex factors:
Demand represented by multiple commodities spread across multiple geographic locations, and
Supply of ships, which is anything but constant due to slow-steaming and idling
It is true that the current oversupply in the sector, the ease of supply creation and availability of low-cost
credit are likely to cap a sustained increase in sector RoE, but it is also true that the above-mentioned
factors make forecasting rates and RoE in the short term nearly impossible. Add the persistent hopes of a
recovery to this inability to forecast near-term rates and it is easy to understand why many rate spikes in
the past have triggered a re-pricing of bulk equities. Much like the freight rate rally in 4Q13, short-term
deviations from the trend of single-digit RoE masquerade as a recovery and are even priced like a
recovery even though over-supply keeps reinforcing the longer-term trend.
We believe the unpredictable rate and return volatility warrants that the valuation in this sector be looked
in two parts:
Value of an equity generating mid-single-digit RoE, say, priced at a PB of 0.8x
Value of a call option on a higher RoE equity exercisable at a PB of 0.8x
Simplistically and alternatively, investors can view the valuation through a lens of probabilities:
Say, a 70% chance that they end up holding a mid-single-digit RoE equity over the next 12 months
And, a 30% chance that they end up holding a double-digit RoE equity
In our view, there is little merit in the precise quantification of the option value and the true benefit to the
investor is simply in cognizance of these two separate value components. Before we close this rather
academic-looking section, we must mention two important points on assessing the value of the call option:
The value of the call option is influenced by likely volatility of freight rates in the ‘future’ (not
historical volatility).
Oversupply curbs volatility and, hence, reduces the value of the option i.e. the greater the number of
ships relative to demand, the lesser the chances of an unpredictable surge in rates.
10
Pacific Basin (2343 HK) Marine 6 October 2014
abc
Recalibrating valuations: Accounting for historical range, multiple expansion and the optionality in shipping equities
Given the lack of success of our EVA valuation methodology over the last two years, we discard it in
favour of a new approach based on factors identified in prior sections. In doing so, we wish to bridge the
difference between our view on Pacific Basin’s valuations and that of the market. At the expense of
repetition, these three factors are:
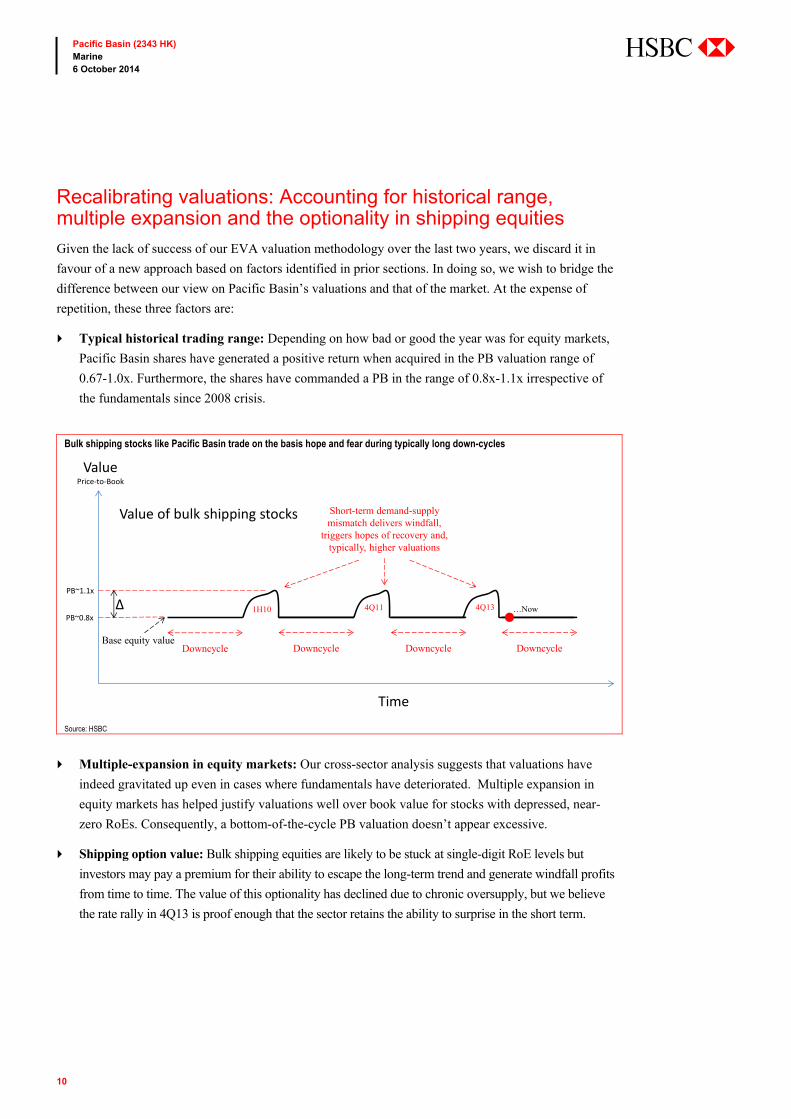
Typical historical trading range: Depending on how bad or good the year was for equity markets,
Pacific Basin shares have generated a positive return when acquired in the PB valuation range of
0.67-1.0x. Furthermore, the shares have commanded a PB in the range of 0.8x-1.1x irrespective of
the fundamentals since 2008 crisis.
Multiple-expansion in equity markets: Our cross-sector analysis suggests that valuations have
indeed gravitated up even in cases where fundamentals have deteriorated. Multiple expansion in
equity markets has helped justify valuations well over book value for stocks with depressed, near-
zero RoEs. Consequently, a bottom-of-the-cycle PB valuation doesn’t appear excessive.
Shipping option value: Bulk shipping equities are likely to be stuck at single-digit RoE levels but
investors may pay a premium for their ability to escape the long-term trend and generate windfall profits
from time to time. The value of this optionality has declined due to chronic oversupply, but we believe
the rate rally in 4Q13 is proof enough that the sector retains the ability to surprise in the short term.
Bulk shipping stocks like Pacific Basin trade on the basis hope and fear during typically long down-cycles
Source: HSBC
ValuePrice-to-Book
Downcycle Downcycle Downcycle Downcycle
Short-term demand-supply mismatch delivers windfall,
triggers hopes of recovery and, typically, higher valuations
Base equity value
Value of bulk shipping stocks
Time
4Q13 …NowPB~0.8x
PB~1.1x
Δ 4Q111H10
11
Pacific Basin (2343 HK) Marine 6 October 2014
abc
The equity and the option
Taking all of the above into account, a fair price-to-book for the company can be thought of as 0.8x+Δ.
The base PB multiple of 0.8x should be thought of as the fair value of an equity offering mid-single-digit
RoE in the current environment of generous multiples. The Δ should be thought of as the value of the call
option described above. If one accepts the constraints imposed by the stock’s typical post-crisis PB range
of 0.8x-1.1x, then Δ could be anywhere between a PB of 0 to 0.3x.
Unfortunately, we can’t think of a precise way of estimating Δ’s value but, intuitively, Δ would inflate if
recovery hopes return on the back of another one of the bulk shipping’s unexpected bounces. On the other
hand, if all recovery hopes were to recede, say, during a non-peak season, the option value would go to zero.
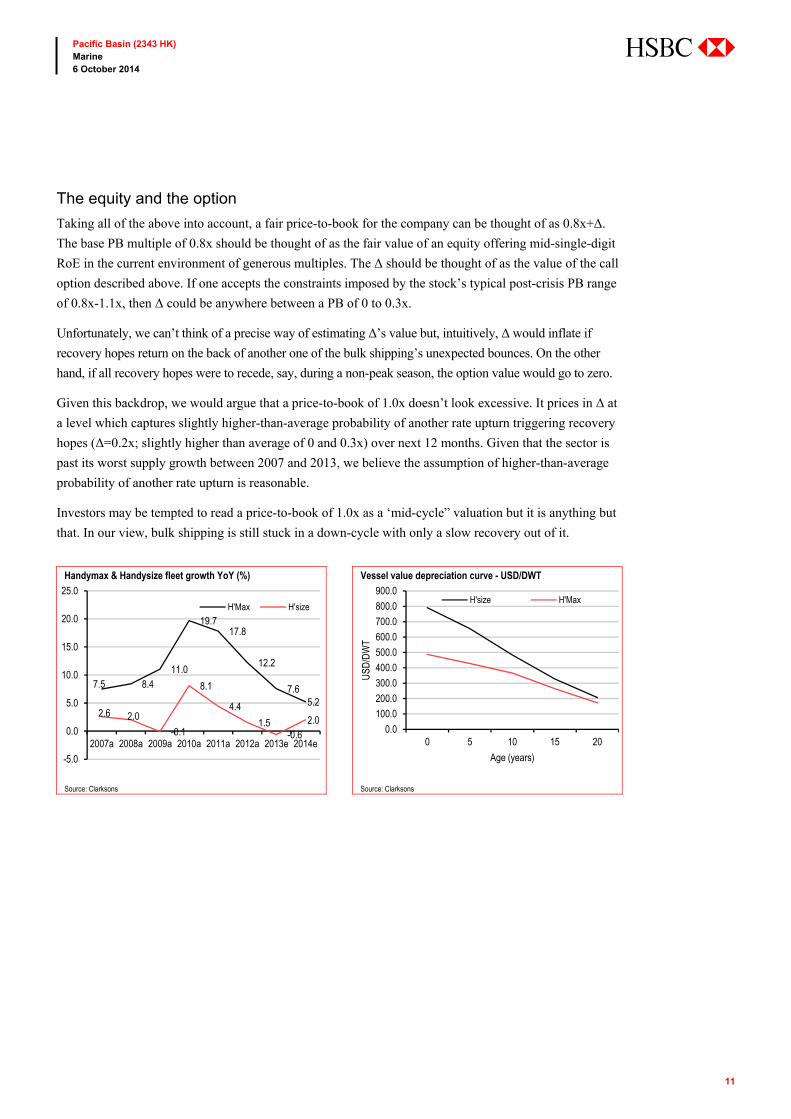
Given this backdrop, we would argue that a price-to-book of 1.0x doesn’t look excessive. It prices in Δ at
a level which captures slightly higher-than-average probability of another rate upturn triggering recovery
hopes (Δ=0.2x; slightly higher than average of 0 and 0.3x) over next 12 months. Given that the sector is
past its worst supply growth between 2007 and 2013, we believe the assumption of higher-than-average
probability of another rate upturn is reasonable.
Investors may be tempted to read a price-to-book of 1.0x as a ‘mid-cycle” valuation but it is anything but
that. In our view, bulk shipping is still stuck in a down-cycle with only a slow recovery out of it.
Handymax & Handysize fleet growth YoY (%) Vessel value depreciation curve - USD/DWT
Source: Clarksons Source: Clarksons
7.5 8.411.0
19.717.8
12.2
7.65.2
2.6 2.0
-0.1
8.1
4.4
1.5-0.6
2.0
-5.0
0.0
5.0
10.0
15.0
20.0
25.0
2007a 2008a 2009a 2010a 2011a 2012a 2013e 2014e
H'Max H'size
0.0
100.0
200.0
300.0
400.0
500.0
600.0
700.0
800.0
900.0
0 5 10 15 20
USD
/DW
T
Age (years)
H'size H'Max
12
Pacific Basin (2343 HK) Marine 6 October 2014
abc
Fleet value-based approach is more of an art than science
Another way to look at valuations is through the value of company’s fleet, as indicated by current sale
and purchase market. Based on Clarksons data on asset values, we estimate the company’s dry bulk fleet
has a value of close to USD1.8bn. The towage fleet is valued at a book value of HKD0.55/share or
USD137m, taking the total enterprise value to USD1.9bn including the yet-to-be-delivered newbuildings. Pacific Basin fleet value (Sep 2014) at current asset prices excluding any contribution from chartered fleet
Dry Bulk Fleet Value (Aug-2014) USDm USD/Vsl
Handymax (Owned) 350 23.3 Handymax New Buildings (Owned) 163 27.2 Handysize (Owned) 900 14.1 Handysize Newbuildings (Owned) 367 28.2 Total 1,779 Less: Current Net Debt (all allocated to dry bulk) -655 Less: Current Capex Commitments -410 Current Market Value (USD m) – Dry Bulk Fleet 714 Current MV/share (HKD) - Dry bulk 2.87 Current MV/share (HKD) – Towage – at book value 0.55 Fleet Value/Share (HKD) 3.41
Source: Clarksons, HSBC estimates
We reduce the company’s net debt of USD655m and its capex commitments of USD410m to arrive at a
market value for its fleet of HKD3.41/share. Although these estimates suggest that the company’s equity
is trading at a substantial premium to its fleet value, we must caution that two factors are debatable: 1) Is
the secondary market value a reliable assessment? 2) Should there be a value of the chartered fleet?
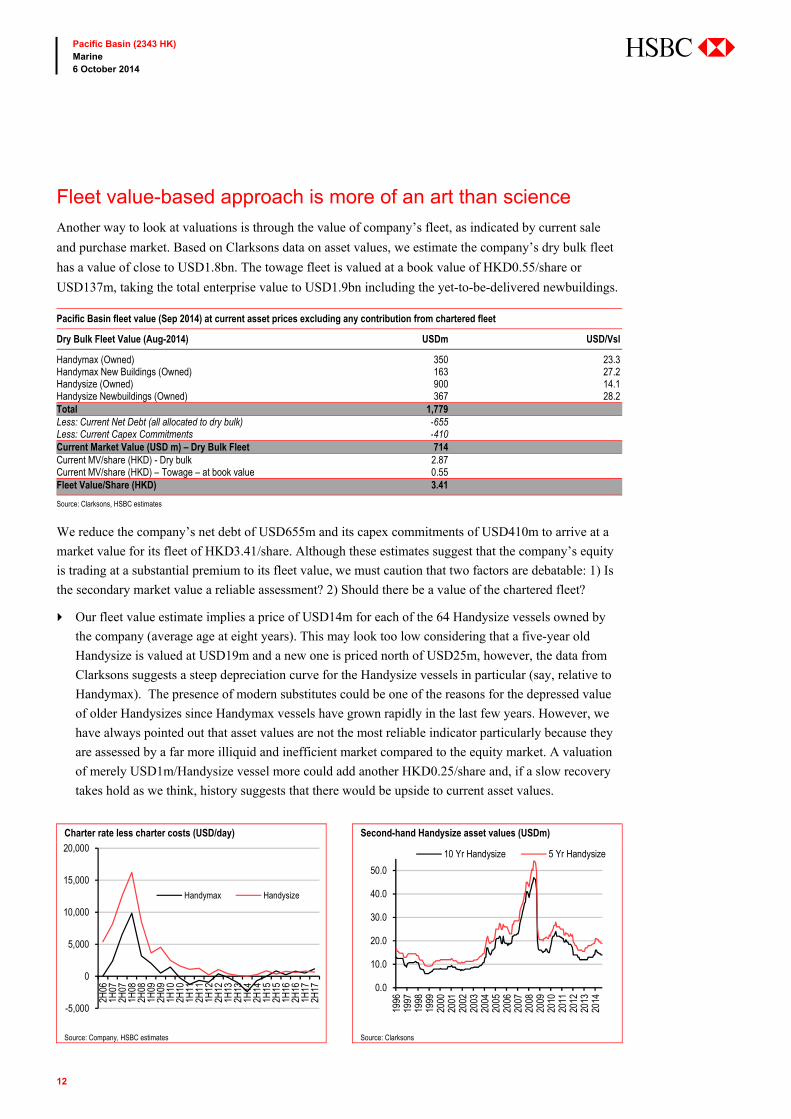
Our fleet value estimate implies a price of USD14m for each of the 64 Handysize vessels owned by
the company (average age at eight years). This may look too low considering that a five-year old
Handysize is valued at USD19m and a new one is priced north of USD25m, however, the data from
Clarksons suggests a steep depreciation curve for the Handysize vessels in particular (say, relative to
Handymax). The presence of modern substitutes could be one of the reasons for the depressed value
of older Handysizes since Handymax vessels have grown rapidly in the last few years. However, we
have always pointed out that asset values are not the most reliable indicator particularly because they
are assessed by a far more illiquid and inefficient market compared to the equity market. A valuation
of merely USD1m/Handysize vessel more could add another HKD0.25/share and, if a slow recovery
takes hold as we think, history suggests that there would be upside to current asset values.
Charter rate less charter costs (USD/day) Second-hand Handysize asset values (USDm)
Source: Company, HSBC estimates Source: Clarksons
-5,000
0
5,000
10,000
15,000
20,000
2H06
1H07
2H07
1H08
2H08
1H09
2H09
1H10
2H10
1H11
2H11
1H12
2H12
1H13
2H13
1H14
2H14
1H15
2H15
1H16
2H16
1H17
2H17
Handymax Handysize
0.0
10.0
20.0
30.0
40.0
50.0
1996
1997
1998
1999
2000
2001
2002
2003
2004
2005
2006
2007
2008
2009
2010
2011
2012
2013
2014
10 Yr Handysize 5 Yr Handysize
13
Pacific Basin (2343 HK) Marine 6 October 2014
abc
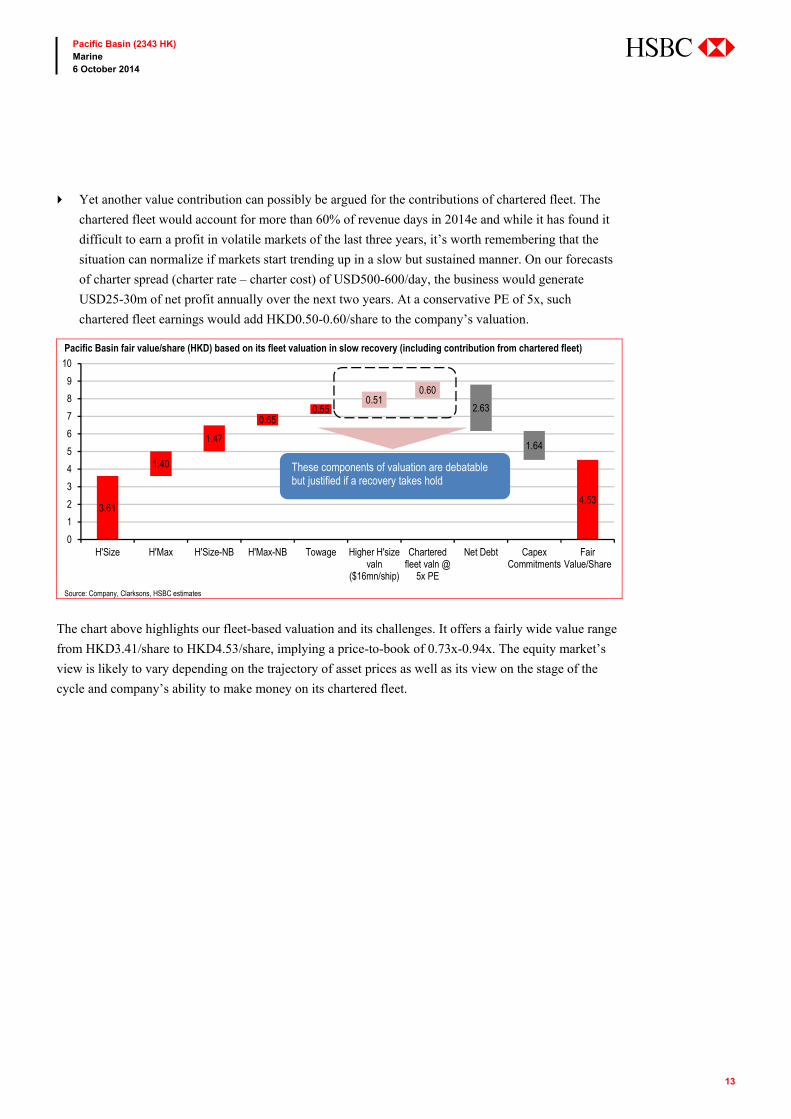
Yet another value contribution can possibly be argued for the contributions of chartered fleet. The
chartered fleet would account for more than 60% of revenue days in 2014e and while it has found it
difficult to earn a profit in volatile markets of the last three years, it’s worth remembering that the
situation can normalize if markets start trending up in a slow but sustained manner. On our forecasts
of charter spread (charter rate – charter cost) of USD500-600/day, the business would generate
USD25-30m of net profit annually over the next two years. At a conservative PE of 5x, such
chartered fleet earnings would add HKD0.50-0.60/share to the company’s valuation.
Pacific Basin fair value/share (HKD) based on its fleet valuation in slow recovery (including contribution from chartered fleet)
Source: Company, Clarksons, HSBC estimates
The chart above highlights our fleet-based valuation and its challenges. It offers a fairly wide value range
from HKD3.41/share to HKD4.53/share, implying a price-to-book of 0.73x-0.94x. The equity market’s
view is likely to vary depending on the trajectory of asset prices as well as its view on the stage of the
cycle and company’s ability to make money on its chartered fleet.
3.61
1.40
1.47
0.650.55
0.510.60
2.63
1.64
4.53
0
1
2
3
4
5
6
7
8
9
10
H'Size H'Max H'Size-NB H'Max-NB Towage Higher H'sizevaln
($16mn/ship)
Charteredfleet valn @
5x PE
Net Debt CapexCommitments
FairValue/Share
These components of valuation are debatable but justified if a recovery takes hold
14
Pacific Basin (2343 HK) Marine 6 October 2014
abc
We account for multiple expansion; raise TP and upgrade rating
Given the lack of success of EVA valuation methodology, we discard it in favour of the approach
accounting for historical trading range, market-wise multiple expansion and the optionality in shipping
equities. As discussed earlier, this implies a target 2015e price-to-book of 1.0x and a target price of
HKD4.93 (HKD3.0 earlier).
We also note that the new target price is at a 9% premium to the higher end of our fleet value-based range
of HKD3.41-4.53. This, in our view, prices in a modest recovery (higher asset prices and chartered fleet
value) in dry bulk markets which would see the company’s RoE go towards 7% in 2016e.
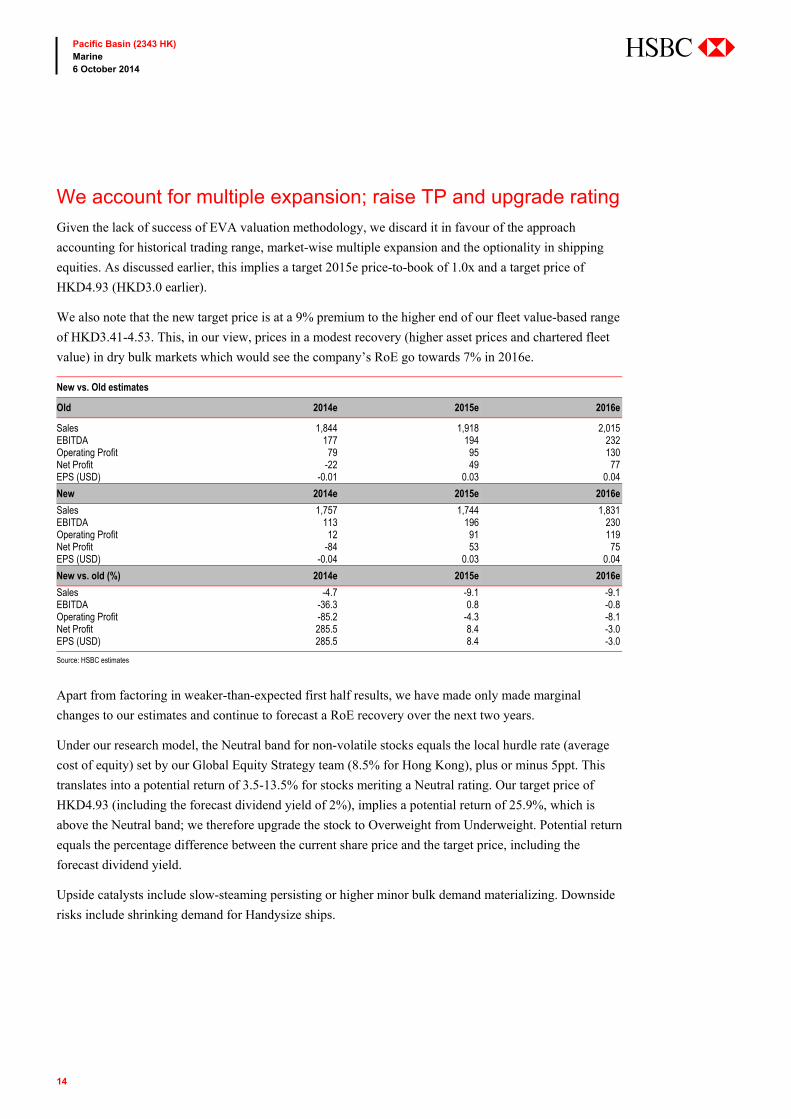
New vs. Old estimates
Old 2014e 2015e 2016e
Sales 1,844 1,918 2,015 EBITDA 177 194 232 Operating Profit 79 95 130 Net Profit -22 49 77 EPS (USD) -0.01 0.03 0.04
New 2014e 2015e 2016e
Sales 1,757 1,744 1,831 EBITDA 113 196 230 Operating Profit 12 91 119 Net Profit -84 53 75 EPS (USD) -0.04 0.03 0.04
New vs. old (%) 2014e 2015e 2016e
Sales -4.7 -9.1 -9.1 EBITDA -36.3 0.8 -0.8 Operating Profit -85.2 -4.3 -8.1 Net Profit 285.5 8.4 -3.0 EPS (USD) 285.5 8.4 -3.0
Source: HSBC estimates
Apart from factoring in weaker-than-expected first half results, we have made only made marginal
changes to our estimates and continue to forecast a RoE recovery over the next two years.
Under our research model, the Neutral band for non-volatile stocks equals the local hurdle rate (average
cost of equity) set by our Global Equity Strategy team (8.5% for Hong Kong), plus or minus 5ppt. This
translates into a potential return of 3.5-13.5% for stocks meriting a Neutral rating. Our target price of
HKD4.93 (including the forecast dividend yield of 2%), implies a potential return of 25.9%, which is
above the Neutral band; we therefore upgrade the stock to Overweight from Underweight. Potential return
equals the percentage difference between the current share price and the target price, including the
forecast dividend yield.
Upside catalysts include slow-steaming persisting or higher minor bulk demand materializing. Downside
risks include shrinking demand for Handysize ships.
15
Pacific Basin (2343 HK) Marine 6 October 2014
abc
Disclosure appendix Analyst Certification The following analyst(s), economist(s), and/or strategist(s) who is(are) primarily responsible for this report, certifies(y) that the opinion(s) on the subject security(ies) or issuer(s) and/or any other views or forecasts expressed herein accurately reflect their personal view(s) and that no part of their compensation was, is or will be directly or indirectly related to the specific recommendation(s) or views contained in this research report: Shishir Singh and Mark Webb
Important disclosures
Equities: Stock ratings and basis for financial analysis
HSBC believes that investors utilise various disciplines and investment horizons when making investment decisions, which depend largely on individual circumstances such as the investor's existing holdings, risk tolerance and other considerations. Given these differences, HSBC has two principal aims in its equity research: 1) to identify long-term investment opportunities based on particular themes or ideas that may affect the future earnings or cash flows of companies on a 12 month time horizon; and 2) from time to time to identify short-term investment opportunities that are derived from fundamental, quantitative, technical or event-driven techniques on a 0-3 month time horizon and which may differ from our long-term investment rating. HSBC has assigned ratings for its long-term investment opportunities as described below.
This report addresses only the long-term investment opportunities of the companies referred to in the report. As and when HSBC publishes a short-term trading idea the stocks to which these relate are identified on the website at www.hsbcnet.com/research. Details of these short-term investment opportunities can be found under the Reports section of this website.
HSBC believes an investor's decision to buy or sell a stock should depend on individual circumstances such as the investor's existing holdings and other considerations. Different securities firms use a variety of ratings terms as well as different rating systems to describe their recommendations. Investors should carefully read the definitions of the ratings used in each research report. In addition, because research reports contain more complete information concerning the analysts' views, investors should carefully read the entire research report and should not infer its contents from the rating. In any case, ratings should not be used or relied on in isolation as investment advice.
Rating definitions for long-term investment opportunities
Stock ratings HSBC assigns ratings to its stocks in this sector on the following basis:
For each stock we set a required rate of return calculated from the cost of equity for that stock’s domestic or, as appropriate, regional market established by our strategy team. The price target for a stock represents the value the analyst expects the stock to reach over our performance horizon. The performance horizon is 12 months. For a stock to be classified as Overweight, the potential return, which equals the percentage difference between the current share price and the target price, including the forecast dividend yield when indicated, must exceed the required return by at least 5 percentage points over the next 12 months (or 10 percentage points for a stock classified as Volatile*). For a stock to be classified as Underweight, the stock must be expected to underperform its required return by at least 5 percentage points over the next 12 months (or 10 percentage points for a stock classified as Volatile*). Stocks between these bands are classified as Neutral.
Our ratings are re-calibrated against these bands at the time of any 'material change' (initiation of coverage, change of volatility status or change in price target). Notwithstanding this, and although ratings are subject to ongoing management review, expected returns will be permitted to move outside the bands as a result of normal share price fluctuations without necessarily triggering a rating change.
16
Pacific Basin (2343 HK) Marine 6 October 2014
abc
*A stock will be classified as volatile if its historical volatility has exceeded 40%, if the stock has been listed for less than 12 months (unless it is in an industry or sector where volatility is low) or if the analyst expects significant volatility. However, stocks which we do not consider volatile may in fact also behave in such a way. Historical volatility is defined as the past month's average of the daily 365-day moving average volatilities. In order to avoid misleadingly frequent changes in rating, however, volatility has to move 2.5 percentage points past the 40% benchmark in either direction for a stock's status to change.
Rating distribution for long-term investment opportunities
As of 03 October 2014, the distribution of all ratings published is as follows: Overweight (Buy) 45% (30% of these provided with Investment Banking Services)
Neutral (Hold) 37% (30% of these provided with Investment Banking Services)
Underweight (Sell) 18% (20% of these provided with Investment Banking Services)
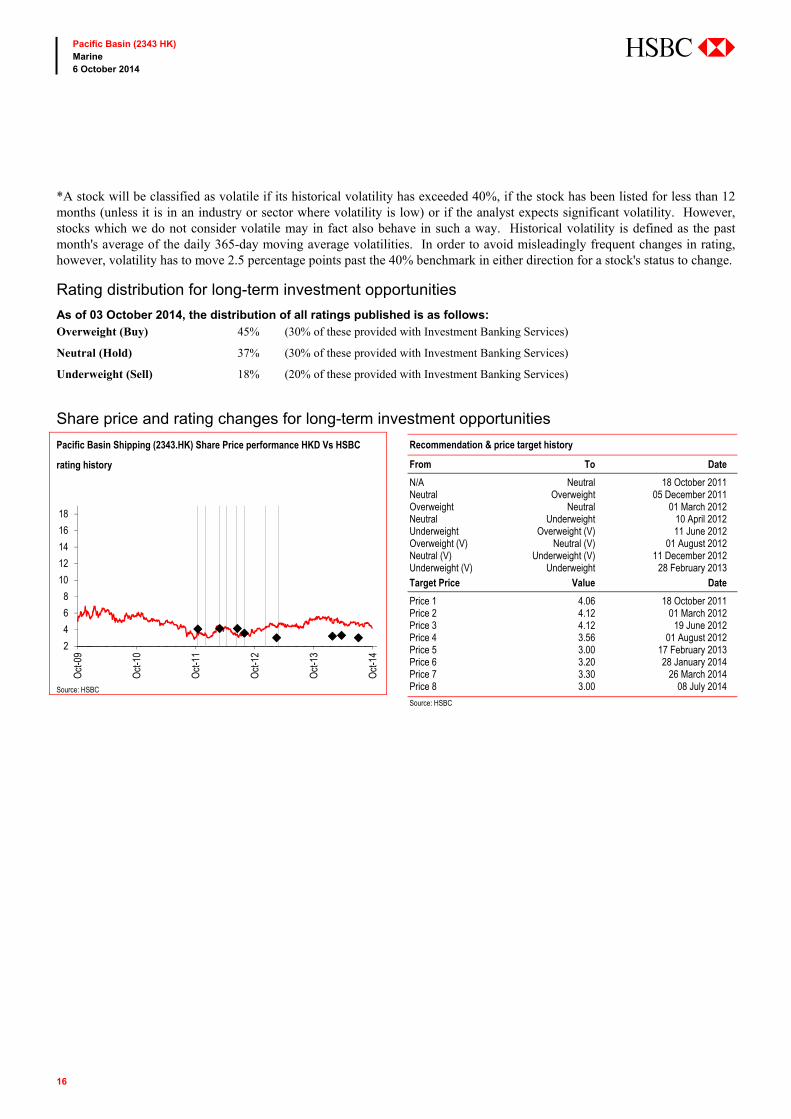
Share price and rating changes for long-term investment opportunities
Pacific Basin Shipping (2343.HK) Share Price performance HKD Vs HSBC
rating history
Recommendation & price target history
From To Date
N/A Neutral 18 October 2011 Neutral Overweight 05 December 2011 Overweight Neutral 01 March 2012 Neutral Underweight 10 April 2012 Underweight Overweight (V) 11 June 2012 Overweight (V) Neutral (V) 01 August 2012 Neutral (V) Underweight (V) 11 December 2012 Underweight (V) Underweight 28 February 2013 Target Price Value Date
Price 1 4.06 18 October 2011 Price 2 4.12 01 March 2012 Price 3 4.12 19 June 2012 Price 4 3.56 01 August 2012 Price 5 3.00 17 February 2013 Price 6 3.20 28 January 2014 Price 7 3.30 26 March 2014 Price 8 3.00 08 July 2014
Source: HSBC
Source: HSBC
2
4
6
8
10
12
14
16
18
Oct
-09
Oct
-10
Oct
-11
Oct
-12
Oct
-13
Oct
-14
17
Pacific Basin (2343 HK) Marine 6 October 2014
abc
HSBC & Analyst disclosures Disclosure checklist
Company Ticker Recent price Price Date Disclosure
PACIFIC BASIN SHIPPING 2343.HK 4.20 01-Oct-2014 4, 6, 7
Source: HSBC
1 HSBC has managed or co-managed a public offering of securities for this company within the past 12 months. 2 HSBC expects to receive or intends to seek compensation for investment banking services from this company in the next
3 months. 3 At the time of publication of this report, HSBC Securities (USA) Inc. is a Market Maker in securities issued by this
company. 4 As of 31 August 2014 HSBC beneficially owned 1% or more of a class of common equity securities of this company. 5 As of 31 August 2014, this company was a client of HSBC or had during the preceding 12 month period been a client of
and/or paid compensation to HSBC in respect of investment banking services. 6 As of 31 August 2014, this company was a client of HSBC or had during the preceding 12 month period been a client of
and/or paid compensation to HSBC in respect of non-investment banking securities-related services. 7 As of 31 August 2014, this company was a client of HSBC or had during the preceding 12 month period been a client of
and/or paid compensation to HSBC in respect of non-securities services. 8 A covering analyst/s has received compensation from this company in the past 12 months. 9 A covering analyst/s or a member of his/her household has a financial interest in the securities of this company, as
detailed below. 10 A covering analyst/s or a member of his/her household is an officer, director or supervisory board member of this
company, as detailed below. 11 At the time of publication of this report, HSBC is a non-US Market Maker in securities issued by this company and/or in
securities in respect of this company HSBC and its affiliates will from time to time sell to and buy from customers the securities/instruments (including derivatives) of companies covered in HSBC Research on a principal or agency basis.
Analysts, economists, and strategists are paid in part by reference to the profitability of HSBC which includes investment banking revenues.
Whether, or in what time frame, an update of this analysis will be published is not determined in advance.
For disclosures in respect of any company mentioned in this report, please see the most recently published report on that company available at www.hsbcnet.com/research.
Additional disclosures 1 This report is dated as at 06 October 2014. 2 All market data included in this report are dated as at close 03 October 2014, unless otherwise indicated in the report. 3 HSBC has procedures in place to identify and manage any potential conflicts of interest that arise in connection with its
Research business. HSBC's analysts and its other staff who are involved in the preparation and dissemination of Research operate and have a management reporting line independent of HSBC's Investment Banking business. Information Barrier procedures are in place between the Investment Banking and Research businesses to ensure that any confidential and/or price sensitive information is handled in an appropriate manner.
18
Pacific Basin (2343 HK) Marine 6 October 2014
abc
Disclaimer * Legal entities as at 30 May 2014 ‘UAE’ HSBC Bank Middle East Limited, Dubai; ‘HK’ The Hongkong and Shanghai Banking Corporation Limited, Hong Kong; ‘TW’ HSBC Securities (Taiwan) Corporation Limited; 'CA' HSBC Bank Canada, Toronto; HSBC Bank, Paris Branch; HSBC France; ‘DE’ HSBC Trinkaus & Burkhardt AG, Düsseldorf; 000 HSBC Bank (RR), Moscow; ‘IN’ HSBC Securities and Capital Markets (India) Private Limited, Mumbai; ‘JP’ HSBC Securities (Japan) Limited, Tokyo; ‘EG’ HSBC Securities Egypt SAE, Cairo; ‘CN’ HSBC Investment Bank Asia Limited, Beijing Representative Office; The Hongkong and Shanghai Banking Corporation Limited, Singapore Branch; The Hongkong and Shanghai Banking Corporation Limited, Seoul Securities Branch; The Hongkong and Shanghai Banking Corporation Limited, Seoul Branch; HSBC Securities (South Africa) (Pty) Ltd, Johannesburg; HSBC Bank plc, London, Madrid, Milan, Stockholm, Tel Aviv; ‘US’ HSBC Securities (USA) Inc, New York; HSBC Yatirim Menkul Degerler AS, Istanbul; HSBC México, SA, Institución de Banca Múltiple, Grupo Financiero HSBC; HSBC Bank Brasil SA – Banco Múltiplo; HSBC Bank Australia Limited; HSBC Bank Argentina SA; HSBC Saudi Arabia Limited; The Hongkong and Shanghai Banking Corporation Limited, New Zealand Branch incorporated in Hong Kong SAR; The Hongkong and Shanghai Banking Corporation Limited, Bangkok Branch
Issuer of report
The Hongkong and Shanghai Banking Corporation Limited Level 19, 1 Queen’s Road Central
Hong Kong SAR
Telephone: +852 2843 9111
Telex: 75100 CAPEL HX
Fax: +852 2596 0200
Website: www.research.hsbc.com
This document has been issued by The Hongkong and Shanghai Banking Corporation Limited (“HSBC”) in the conduct of its Hong Kong regulated business for the information of its institutional and professional investor (as defined by Securities and Future Ordinance (Chapter 571)) customers; it is not intended for and should not be distributed to retail customers in Hong Kong. The Hongkong and Shanghai Banking Corporation Limited is regulated by the Hong Kong Monetary Authority. All enquires by recipients in Hong Kong must be directed to your HSBC contact in Hong Kong. If it is received by a customer of an affiliate of HSBC, its provision to the recipient is subject to the terms of business in place between the recipient and such affiliate. This document is not and should not be construed as an offer to sell or the solicitation of an offer to purchase or subscribe for any investment. HSBC has based this document on information obtained from sources it believes to be reliable but which it has not independently verified; HSBC makes no guarantee, representation or warranty and accepts no responsibility or liability as to its accuracy or completeness. Expressions of opinion are those of the Research Division of HSBC only and are subject to change without notice. HSBC and its affiliates and/or their officers, directors and employees may have positions in any securities mentioned in this document (or in any related investment) and may from time to time add to or dispose of any such securities (or investment). HSBC and its affiliates may act as market maker or have assumed an underwriting commitment in the securities of companies discussed in this document (or in related investments), may sell them to or buy them from customers on a principal basis and may also perform or seek to perform investment banking or underwriting services for or relating to those companies. HSBC Securities (USA) Inc. accepts responsibility for the content of this research report prepared by its non-US foreign affiliate. All U.S. persons receiving and/or accessing this report and wishing to effect transactions in any security discussed herein should do so with HSBC Securities (USA) Inc. in the United States and not with its non-US foreign affiliate, the issuer of this report. In the UK this report may only be distributed to persons of a kind described in Article 19(5) of the Financial Services and Markets Act 2000 (FinancialPromotion) Order 2005. The protections afforded by the UK regulatory regime are available only to those dealing with a representative of HSBC Bank plc in the UK. In Singapore, this publication is distributed by The Hongkong and Shanghai Banking Corporation Limited, Singapore Branch for the general information of institutional investors or other persons specified in Sections 274 and 304 of the Securities and Futures Act (Chapter 289) (“SFA”) and accredited investors and other persons in accordance with the conditions specified in Sections 275 and 305 of the SFA. This publication is not a prospectus as defined in the SFA. It may not be further distributed in whole or in part for any purpose. The Hongkong and Shanghai Banking Corporation Limited Singapore Branch is regulated by the Monetary Authority of Singapore. Recipients in Singapore should contact a "Hongkong and Shanghai Banking Corporation Limited, Singapore Branch" representative in respect of any matters arising from, or in connection with this report. In Australia, this publication has been distributed by The Hongkong and Shanghai Banking Corporation Limited (ABN 65 117 925 970, AFSL 301737) for the general information of its “wholesale” customers (as defined in the Corporations Act 2001). Where distributed to retail customers, this research is distributed by HSBC Bank Australia Limited (AFSL No. 232595). These respective entities make no representations that the products or services mentioned in this document are available to persons in Australia or are necessarily suitable for any particular person or appropriate in accordance with local law. No consideration has been given to the particular investment objectives, financial situation or particular needs of any recipient. This publication is distributed in New Zealand by The Hongkong and Shanghai Banking Corporation Limited, New Zealand Branch incorporated in Hong Kong SAR. In Japan, this publication has been distributed by HSBC Securities (Japan) Limited. It may not be further distributed in whole or in part for any purpose. In Korea, this publication is distributed by The Hongkong and Shanghai Banking Corporation Limited, Seoul Securities Branch ("HBAP SLS") for the general information of professional investors specified in Article 9 of the Financial Investment Services and Capital Markets Act (“FSCMA”). This publication is not a prospectus as defined in the FSCMA. It may not be further distributed in whole or in part for any purpose. HBAP SLS is regulated by the Financial Services Commission and the Financial Supervisory Service of Korea. In Canada, this document has been distributed by HSBC Bank Canada and/or its affiliates. Where this document contains market updates/overviews, or similar materials (collectively deemed “Commentary” in Canada although other affiliate jurisdictions may term “Commentary” as either “macro-research” or “research”), the Commentary is not an offer to sell, or a solicitation of an offer to sell or subscribe for, any financial product or instrument (including, without limitation, any currencies, securities, commodities or other financial instruments). © Copyright 2014, The Hongkong and Shanghai Banking Corporation Limited, ALL RIGHTS RESERVED. No part of this publication may be reproduced, stored in a retrieval system, or transmitted, on any form or by any means, electronic, mechanical, photocopying, recording, or otherwise, without the prior written permission of The Hongkong and Shanghai Banking Corporation Limited. MICA (P) 157/06/2014, MICA (P) 171/04/2014 and MICA (P) 077/01/2014
abc
Industrials Colin Gibson Global Sector Head, Industrials +44 20 7991 6592 [email protected]
Sean McLoughlin Analyst +44 20 7991 3464 [email protected]
Michael Hagmann Analyst +44 20 7991 2405 [email protected]
Mark Webb Analyst +852 2996 6574 [email protected]
Parash Jain Analyst +852 2996 6717 [email protected]
Shishir Singh Analyst +852 2822 4292 [email protected]
Walden Shing Analyst +852 2996 6751 [email protected]
Stephen Wan Analyst +852 2996 6566 [email protected]
Thomas Zhu, CFA Analyst +852 2822 4325 [email protected]
Carrie Liu Analyst +8862 6631 2864 [email protected]
Brian Cho Head of Research, Korea +822 3706 8750 [email protected]
Paul Choi Analyst +822 3706 8758 [email protected]
Yeon Lee Analyst +822 3706 8778 [email protected]
Sinyoung Park Analyst +822 3706 8770 [email protected]
Incheol Yu Associate +822 3706 8756 [email protected]
Thilan Wickramasinghe Analyst +65 6658 0609 [email protected]
Kristy Lee Analyst +65 6658 0616 [email protected]
Puneet Gulati Analyst +91 22 2268 1235 [email protected]
Joerg-Andre Finke Analyst +49 211 910 3722 [email protected]
Richard Schramm Analyst +49 211 910 2837 [email protected]
Juergen Siebrecht Analyst +49 211 910 3350 [email protected]
Autos Niels Fehre Analyst +49 211 910 3426 [email protected]
Horst Schneider Analyst +49 211 910 3285 [email protected]
Carson Ng Analyst +852 2822 4397 [email protected]
Yogesh Aggarwal Analyst +91 22 2268 1246 [email protected]
Transportation Andrew Lobbenberg Analyst +44 20 7991 6816 [email protected]
Joe Thomas Analyst +44 20 7992 3618 [email protected]
Wei Sim Analyst +852 2996 6602 [email protected]
Shishir Singh +852 2822 4292 [email protected]
Achal Kumar Analyst +91 80 3001 3722 [email protected]
Rajani Khetan Analyst +852 3941 0830 [email protected]
Jingyuan Zhai Associate +852 3941 7009 [email protected]
Aric Hui Associate +852 2822 3165 [email protected]
Construction & Engineering Neel Sinha Head of Equity Research, South East Asia +65 6658 0606 [email protected]
Pierre Bosset Head of French Research +33 1 56 52 43 10 [email protected]
Tarun Bhatnagar Analyst +65 6658 0614 [email protected]
John Fraser-Andrews Analyst +44 20 7991 6732 [email protected]
Jeffrey Davis Analyst +44 207 991 6837 [email protected]
Ivan Enriquez +52 55 5721 2397 [email protected]
Claudia Navarrete Analyst +52 55 5721 2422 [email protected]
Anderson Chow Analyst +852 2996 6669 [email protected]
Lesley Liu Analyst +852 2822 4524 [email protected]
Raj Sinha Analyst +971 4423 6932 [email protected]
Levent Bayar Analyst +90 212 376 46 17 [email protected]
Ashutosh Narkar Analyst +91 22 2268 1474 [email protected]
Tobias Loskamp Analyst +49 211 910 2828 [email protected]
Specialist Sales Rod Turnbull +44 20 7991 5363 [email protected]
Oliver Magis +49 21 1910 4402 [email protected]
Billal Ismail +44 20 7991 5362 [email protected]
Jean Gael Tabet 44 20 7991 5342 [email protected]
Global Industrials Research Team