p 06 lab notes lab book.docx · web viewphysics lab notes for electricity, magnetism and optics...
TRANSCRIPT

PHYSICS LAB NOTES
FOR
ELECTRICITY, MAGNETISM
AND
OPTICS
EXPERIMENTS
PHYSICS 7
Los Angeles Harbor College


ELECTRICAL SAFETYSince we use electrical apparatus daily, we should understand the elements of electrical safety.
Electricity can kill a person in two ways: it can cause the muscles of the heart and lungs (or other vital organs) to malfunction or it can cause fatal burns.
Even a small electric current can seriously disrupt cell functions in that portion of the body through which it flows. When the electric current is 0.001A or higher, a person can feel the sensation of shock. At currents 10 times larger, 0.01A, a person is unable to release the electric wire held in his hand because the current causes his hand muscles to contract violently. Currents larger than 0.02A passing through the torso paralyze the respiratory muscle and stop breathing. Unless artificial respiration is started at once, the victim will suffocate. Of course, the victim must be freed from the voltage source before he can be touched safely; otherwise the rescuer, too, will be in great danger. A current of about 0.1A passing through the region of the heart will shock the heart muscle into rapid erratic contractions (ventricular fibrillation) so the heart can no longer function. Finally, currents of 1A and higher through the body cause serious burns.
The important quantity to control in preventing injury is electric current. Voltage is important only because it can cause current to flow. Even though your body can be charged to a potential thousands of volts higher than the metal of an automobile by simply sliding across the car seat, you feel only a harmless shock as you touch the door handle. Your body cannot hold much charge on itself, and the current flowing through your hand to the door handle is short-lived and the effect on your body cells is negligible.
In some circumstances, the 120-V house circuit is almost certain to cause death. One of the two wires of the circuit is almost always attached to the ground, so it is at the same potential as the water pipes in a house. Suppose a person is soaking in a bathtub; his body is effectively connected to the ground through the water and piping. If his hand accidentally touches the high-potential wire of the house circuit (by touching an exposed wire on a radio or heater for example), current will flow through his body to the ground. Because of the large, efficient contact his body makes with the ground, the resistance of his body circuit is low. Consequently the current flowing through his body is so large that he will be electrocuted.
Similar situations exist elsewhere. For example, if you accidentally touch an exposed wire while standing on the ground with wet feet you are in far greater danger than if you are on a dry, insulating surface. The electrical circuit through your body to the ground has a much higher resistance if your feet are dry. Similarly, if you sustain an electrical shock by touching a live wire or a faulty appliance, the shock is greater if your other hand is touching the faucet on the sink or is in the dishwater.
As you can see from these examples, the danger from electrical shock can be eliminated by avoiding a current path through the body. When the voltage is greater than about 50 V, avoid touching any exposed metal portion of the circuit. If a high-voltage wire must be touched (for example, in case of a power line accident when help is not immediately available) use a dry stick or some other substantial piece of insulating material to move it. When in doubt about safety, avoid all contacts or close approaches to metal or to the wet earth. Above all do not let your body become the connecting link between two objects that have widely different electric potentials. Reference: "Physics for Scientists and Engineers" by F. Beuche
EFFECTS OF A 60 Hz ELECTRIC SHOCKCurrent
(held one second)Effect
(current applied to skin, unless otherwise noted)20 mA
1 mA5 mA
1-10 mA10-20 mA
30 mA75-300 mA
5 A
Ventricular fibrillation if applied directly to the heartSensationMaximum harmless currentMild to moderate painMay cause muscular contractions, preventing release from shock sourceBreathing may stopVentricular fibrillation may occur
Burns tissues


TABLE OF CONTENTS
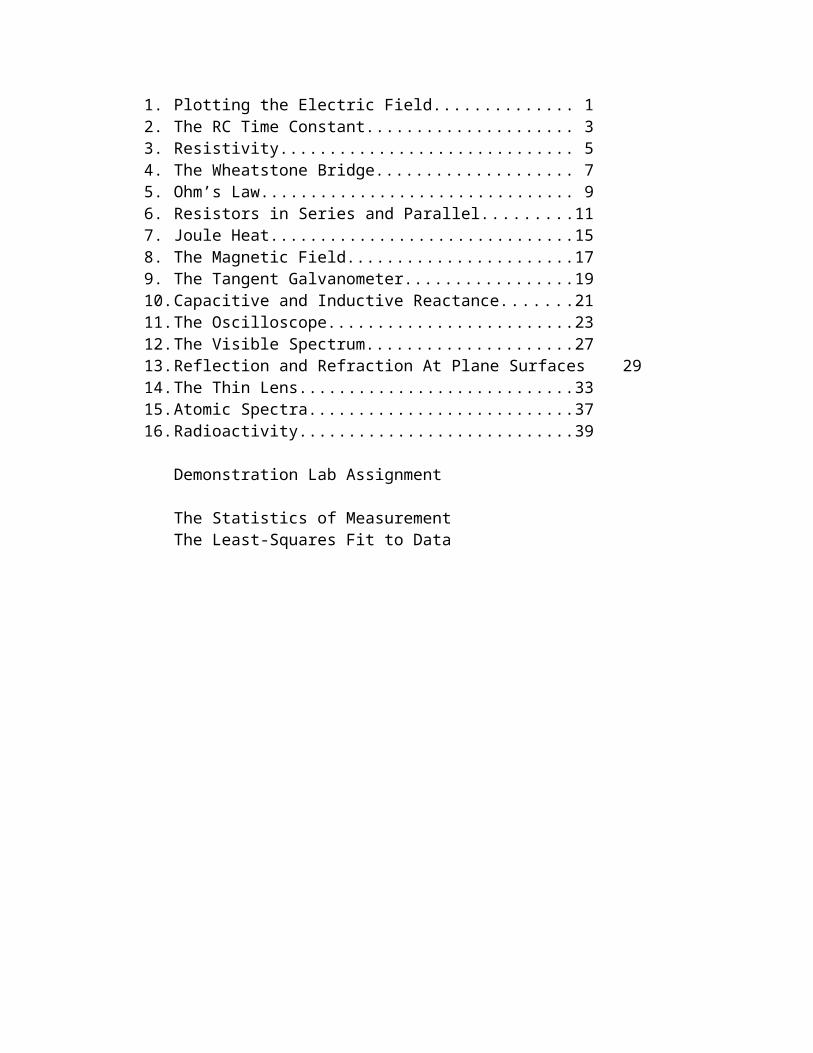
1. Plotting the Electric Field.................................................. 12. The RC Time Constant..................................................... 33. Resistivity......................................................................... 54. The Wheatstone Bridge.................................................... 75. Ohm’s Law........................................................................ 96. Resistors in Series and Parallel........................................117. Joule Heat........................................................................158. The Magnetic Field...........................................................179. The Tangent Galvanometer..............................................19
10. Capacitive and Inductive Reactance................................2111. The Oscilloscope..............................................................2312. The Visible Spectrum.......................................................2713. Reflection and Refraction At Plane Surfaces....................2914. The Thin Lens...................................................................3315. Atomic Spectra.................................................................3716. Radioactivity.....................................................................39
Demonstration Lab Assignment
The Statistics of MeasurementThe Least-Squares Fit to Data

Experiment 1: PLOTTING THE ELECTRIC FIELD
PURPOSE:
The purpose of this experiment is to map the electric field around several electrode configurations.
INTRODUCTION:
In this experiment, we will determine the shape of the electric field arising from three electrode configurations, namely, the dipole, the capacitor and the lightning rod. The method used will involve the determination of equipotential lines (lines of constant voltage). Having established the equipotential lines, the electric field lines can then be drawn, since they are always at right angles to the equipotential lines.
SUPPLIES & EQUIPMENT:
Electric field plotting apparatus DC Power supplyLeads and connectors Digital voltmeterRuler & French curve Plain and carbon paper
PROCEDURE:
1. Set up the apparatus as shown below:
2. Locate ten to fifteen points at 2 volts by making a slight impression with the probe. Space the points about one centimeter apart. Avoid punching holes in the resistive paper.
3. Repeat step two for 4V, 6V, and 8V points.
1

4. Trace the outline of the electrode configuration. Mark these electrodes as plus and minus to indicate their polarity. Connect equipotential points of the same voltage marked on the plain paper with a smooth line using a French curve or flexible ruler.
5. Draw the electric field lines (about 12 of them) using a French curve. Remember that these lines have to be at right angles to the equipotential lines. Indicate the direction of the electric field lines with arrows.
Shown below are representative electric field lines emerging from the positive electrode and terminating on the surface of the negative electrode in the dipole configuration:
6. Calculate the charge (q) on the positive electrode of the dipole system by applying the definition V = kq/r, where r is the (shortest) distance between the center of the positive electrode and the 2-volt equipotential line and k is the electrostatic constant, 9 X 10⁹ Nm2/C2.
Print the charge q in units of coulombs onto your field drawings.
7. Repeat the above procedure for two other electrode configurations.
2

Experiment 2: THE RC TIME CONSTANTPURPOSE: a) To determine the discharge rate of a capacitor.
b) To determine the time constant of an RC circuit.
INTRODUCTION:
The rate of charging and discharging a capacitor in an RC circuit is dependent upon the magnitude of the resistance and capacitance in the circuit.
The time constant () of an RC circuit is the time required to charge a capacitor to 63% of its maximum capacity, and the time required to reduce the charge to 37% of its maximum value. In an RC circuit, the time constant is equal to ReqC (unit is the second).
We will determine the time constant of an RC circuit from its discharge curve.
Voltage and Current Across R Voltage Across C Charge On C
VR CR
Vo Qo
0 00t (sec)t (sec)t (sec)
CHARGING A CAPACITOR
Vo, Io
Vo Qo
t (sec)t (sec)t (sec)
DISCHARGING A CAPACITOR
Vo, Io
CR
Switch
VR, I VC Q
VR, I VC Q
3

Voltage and Current Across R Voltage Across C Charge On CSUPPLIES & EQUIPMENT:
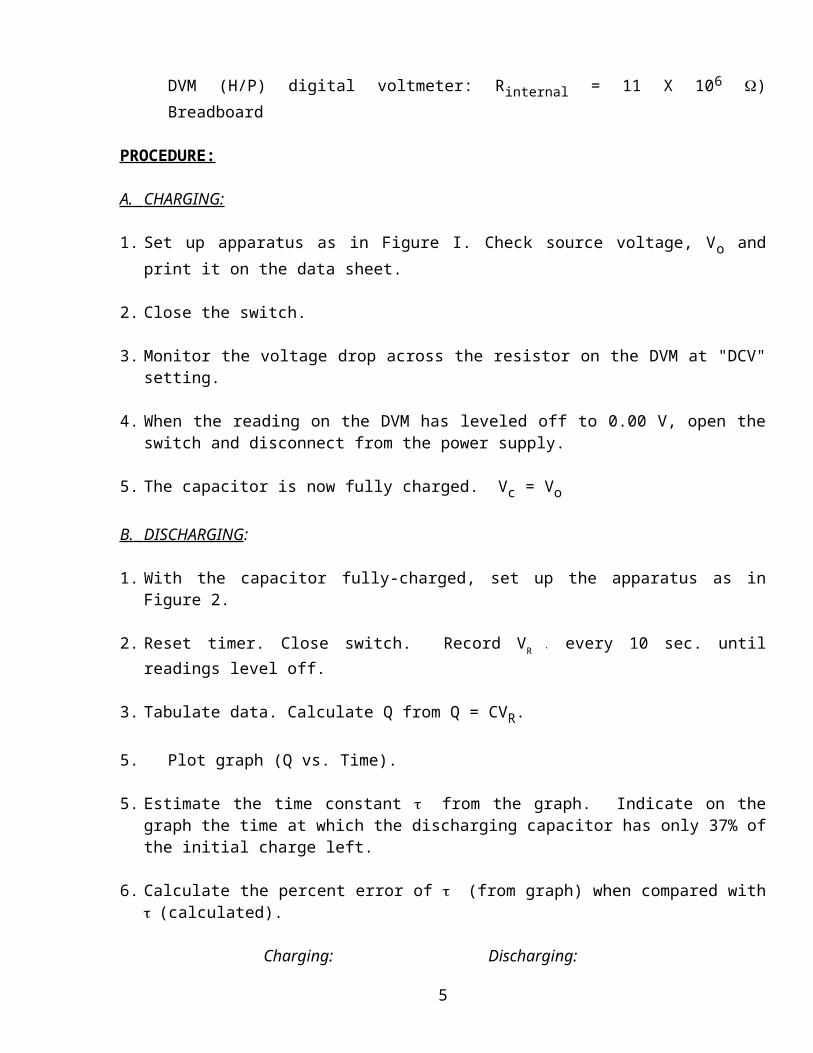
DC power supply 6 V = Vo. Timer Composition resistor (20 M)Capacitor (10 F or 6 F) Conducting leadsDVM (H/P) digital voltmeter: Rinternal = 11 X 106 ) Breadboard
PROCEDURE:
A. CHARGING:
1. Set up apparatus as in Figure I. Check source voltage, Vo and print it on the data sheet.
2. Close the switch.
3. Monitor the voltage drop across the resistor on the DVM at "DCV" setting.
4. When the reading on the DVM has leveled off to 0.00 V, open the switch and disconnect from the power supply.
5. The capacitor is now fully charged. Vc = Vo
B. DISCHARGING :
1. With the capacitor fully-charged, set up the apparatus as in Figure 2.
2. Reset timer. Close switch. Record VR ` every 10 sec. until readings level off.
3. Tabulate data. Calculate Q from Q = CVR.
5. Plot graph (Q vs. Time).
5. Estimate the time constant from the graph. Indicate on the graph the time at which the discharging capacitor has only 37% of the initial charge left.
6. Calculate the percent error of (from graph) when compared with (calculated).
Charging: Discharging:
0 00
4

Fig. 1 Fig. 2
Experiment 3: RESISTIVITY PURPOSE:
The purpose of this experiment is to determine the resistivity of copper and German silver wires.
INTRODUCTION:
There are three factors that influence the resistance of an ohmic resistor (one which follows Ohm's law). These factors are the physical shape of the resistor, the material characteristics of the resistor and the temperature. In this laboratory exercise we shall investigate how the material makeup of the resistor affects its resistance.
If a uniform metal conductor is considered, it is found that its resistance is directly proportional to its length, that is, the impeding effects of the resistor increase as the length of the resistor increases. It is also found that resistance is inversely proportional to the cross-sectional area of the resistor. A good analogy of these effects is water flowing through a pipe. As the length of the pipe increases, the frictional effects of the pipe wall and the friction generated by the water itself increase as the length of the pipe increases, thereby decreasing water flow, which is analogous to the current in a circuit. Also, it is seen that the volume flow of water increases as the radius of the pipe increases, suggesting that the resistance to current flow has decreased.
This dependence of the resistance on the length and cross-sectional area of the resistor can be stated as follows:
R =
LA
where , the constant of proportionality, called the resistivity, is characteristic of the material of which the conductor is made.
In this experiment, the value of the resistivity for copper and German silver shall be determined. The literature value of the resistivity for these is:
German Silver: = 33 X 10-6 -cm Copper: = 1.70 X 10⁻⁶ -cm
5
SUPPLIES & EQUIPMENT:
Voltmeter Rheostat, 20 Power supply, 3 VDCAmmeter Leads & connectors Wire spools
PROCEDURE:
1. Set up the apparatus as shown in the diagram below.
2. For the nickel silver, determine the voltage drop across it and the current through it. Use the rheostat to keep the current in the wire below 0.30 ampere. From these data, compute the resistance using Ohm's law. V = IR
3. Record the length and the wire gauge of the wire.
4. Determine the experimental resistivity from = RA/L. Compare this to the literature value.
5. Repeat the procedure for two other voltage and current settings.
6. Repeat steps 1 through 4 for the copper wire.
6

Experiment 4: THE WHEATSTONE BRIDGEPURPOSE: To measure resistance using a null (zeroing) method.
INTRODUCTION:
The Wheatstone bridge is a circuit designed to measure an unknown resistance by comparison with other known resistances. It is called a "bridge" circuit because a galvanometer is bridged across two parallel branches. (abd and acd in Figure 2.) In the balanced condition, there is zero deflection on the galvanometer. By making use of the ratio of resistance on the two branches, the value of the unknown resistance can be determined.
Furthermore, referring to the diagrams below, we have:
Vab = Vac When Vb = Vc
and no current goes through
I1 Rs = I2 RL
I1 =
I 2RLRs
When Vb = Vc
Then Vbd = Vcd
I1Rx = I2RR
Rx =
I 2RRI1
Rx =
I 2RRI 2RL/ R s
Wheatstone Bridge
Fig. 1
7

Rx = R sRRRL
Since: RR = ρLRA
and RL = ρLLA
Rx = R sLRLL Eq.1
Fig. 2
SUPPLIES & EQUIPMENT:
Galvanometer "Unknown resistors"Wheatstone bridge Composition 47Standard Resistor 50 &100 Decade box 20 - 80 Leads & connectors Rheostat, 20 DC supply 3V Spool of wire #30 copper
PROCEDURE:
1. Set up apparatus as in Figure 1.
2. Start with the composition resistor as Rx.
3. Balance the bridge by zeroing/nulling so that the galvanometer reads zero. current.
4. Record Rs, LL, LR in the data table.
5. Calculate Rx using Eq. 1.
6. Repeat steps 1 through 5 for the other unknowns.
Note that:Cu = 1.72 X10⁻⁶ -cmDiameter of #30 Wire = 0.02548 cmSpool length = 2000 cm
8

Experiment 5: OHM'S LAW
PURPOSE: 1. To learn about simple DC circuit elements and Ohm's Law (V = IR).2. To determine the power consumption of a resistor.
INTRODUCTION:
Ohm's law states the relation between the electrical potential difference, the current and the resistance in a circuit. This is one of the most frequently used relationships in practical electricity and electronics.
In this experiment, we will generate a set of current readings corresponding to a set of voltage readings. The functional relationship between the current and the voltage will then be determined from a graph of the data. The slope of the graph is then related to Ohm's law.
SUPPLIES & EQUIPMENT:
Voltmeter Ammeter Leads & connectorsDC power supply, 3 Volts Rheostat, 20 Decade resistance box
PROCEDURE:
1. Set up apparatus as shown in Figure 1.
9

Fig. 1
= DVM (digital voltmeter to measure VR (parallel wiring).
= VOM (volt-ohmmeter) to measure I (series wiring).
VR = DC power supply = 3 Volts.
Rh = rheostat to regulate VR and I.
2. Set R at 50 .
3. Regulate the voltage across R by adjusting the rheostat.
4. Start with the maximum voltage across R. Record the current I (ammeter reading) and VR.
5. Decrease VR by 0.5 V. Record I and VR.
6. Repeat step 5 for 5 more sets of readings.
7. Plot VR vs. and compute R from the slope of the line.
8. Compare to known value of R set on decade box. Calculate the percent difference.
9. Repeat steps 3 through 8 for R set at 500 on the decade resistance box.
10

Exp. 6: RESISTORS IN SERIES AND PARALLELPURPOSE:
To learn to wire simple series and parallel circuits on a breadboard and to verify the rules pertaining to these circuits.
INTRODUCTION:
Breadboards allow an experimenter to build and modify circuits very easily, without soldering. The Protoboard.10 that you will be using contains sockets that are connected together in the following arrangement:
Each vertical line represents a set of five sockets that are permanently wired together under the breadboard. Each of the eight horizontal lines represents 25 sockets wired together. Banana wires can be attached to the three terminals in the upper-right of
11

the breadboard, and short wires can be run from the base of these terminals to the horizontal sockets to provide sources of voltage and a ground. Short wires can then connect different sets of sockets together, with circuit devices such as resistors and integrated circuits plugged in as well.
SERIES CIRCUIT GEOMETRY AND EQUATIONS:
Io = I1 = I2 = I3 Vo = V1 + V2 + V3
Req = R1 + R2 + R3
Vo = Io·Req
Fig. 1a
PARALLEL CIRCUIT GEOMETRY AND EQUATIONS:
Io = I1 + I2 + I3
Vo = V1 = V2 = V3
Req =
11R1
+ 1R2
+ 1R 3
Vo = Io·Req
Fig. 1b.APPARATUS:
Hewlett-Packard multimeter Breadboard (protoboard.10) Power Supply 6 VDCCarbon resistors (1000, 470, 270) Leads and connectors MultimeterSPST switch Colored pencils
PROCEDURE:
1. Set the DigiTec multimeter to function as an ohmmeter, plug it into the V1 and GND terminals, insert the exposed end of each of two short wires through the hole at the base of the two terminals and screw them tightly in place. By inserting these two short wires into various sockets, convince yourself that the sockets are connected to each other as described in the Introduction. Unplug the ohmmeter.
12

2. Determine the nominal resistance of each carbon resistor by using the color code bands. For example, yellow-violet-brown-silver becomes 4-7-1-10%, so the resistance of the resistor is 47 X 101 = 470 ± 47.
Resistor Color Code
Black = 0Brown = 1
Red = 2Orange = 3Yellow = 4Green = 5Blue = 6Violet = 7Grey = 8
White = 9
Silver 10% toleranceGold 5% tolerance
3. Before you plug into the DC power supply, set up the circuit as in Figure 2a with the switch open. Then plug into the DC power supply and close the switch. Use alligator clip adaptors over the banana plugs of the patch cords.
4. Repeat step 3 for the other seven circuits.
5. Calculate R = V/I, from Ohm’s law. Disconnect the breadboard from the power supply, and set one of the multimeters to act as an ohmmeter. Measure the resistance of each resistor and of the two combinations directly with the ohmmeter, and calculate the percent difference of this reading from the value calculated from Ohm’s law.
Fig. 2a Fig. 2b
13

Fig. 2c Fig. 2d
Fig. 3a Fig. 3b
14

Fig. 3c Fig. 3d
Experiment 7: JOULE HEAT
PURPOSE:
The object of this experiment is to verify that the electrical equivalent of heat is 4.186 joules per calorie.
INTRODUCTION:
When an electric current flows in a conductor with a finite resistance, there is always some loss of energy due to free electron interaction with the lattice ions in the conductor. This so-called joule heat can be a desired effect such as in an electric toaster or electric heater or it can be an undesired side effect such as the heat generated in the windings of an electric motor.
If it is assumed that the resistance of the heating coil which we are using has a constant resistance over a small temperature range, then for a constant voltage, V, and a
15

constant current, I, the energy expended per unit time or the power, P, is given by: P = V I. Since we have a constant power, multiplication of the power by the time interval gives the energy expended in the heating coil in joules:
Electrical energy (J) = P X t = V X I X t Eq. 1
Since the medium to which this electrical energy flows is, in our case, an insulated calorimeter cup containing water, we can apply the conservation of energy to this isolated system and say that the energy dissipated in the conductor is equal to the energy gained by the water, calorimeter cup, and stirrer-coil-lid combination.
Electrical energy (joules) Heat energy (calories) Eq. 2
The heat energy in calories, gained by a substance is given by the product of its mass, m, specific heat, c , and the temperature difference, T. Stated in equation form:
Heat energy (cal) = mwcwT + (W.E.)cw T + mcccT Eq. 3
Combining Eq. 1 and Eq. 3, we obtain:
V I t = mwcwT + (W.E.)cw T + mcccT Eq. 4
______ joules = ______ calories
Where the subscripts w and c stand for water and cup respectively and W.E. stands for the water equivalent of the lid assembly in grams and is indicated on the lid. From Eq. 4, the electrical equivalent of heat in joules per calorie can be calculated.
SUPPLIES & EQUIPMENT:
Double wall calorimeter Thermometer & glycerine Ice cubesAmmeter & voltmeter Leads & connectors 10 V DCBattery charger Electronic balance Stop clock
PROCEDURE:
1. Weigh the inner cup (without insulating ring) of the calorimeter and record the result. Record the water equivalent of the lid.
2. Fill the inner cup of the calorimeter about ⅔ full with chilled water about 8oC below ambient temperature. Weigh and record the mass of the cup and water.
3. Calculate the mass of the water.
16

4. Set up the apparatus as shown below with the rheostat at its maximum resistance. Make sure that the heating coil is totally immersed.
5. Measure and record the initial temperature of the water just before closing the switch.
6. Activate the circuit and start the timer. Stir occasionally throughout the run.
7. Record the current and voltage used during the run. When the temperature of the contents of the cup is about 8oC above ambient temperature, disconnect the power, stop the timer, stir the water, then record the final temperature of the contents of the cup.
8. Calculate the electrical energy for heating in joules.
9. Calculate the heat energy absorbed in calories.
10. Calculate the electrical equivalent of heat and compare this value to the literature value of 4.186 J/cal.
Experiment 8: THE MAGNETIC FIELD
PURPOSE: 1) To determine the shape of magnetic fields around magnetic poles.2) To map the magnetic field around a bar magnet.
INTRODUCTION:
The shape of a magnetic field is determined the lines of magnetic flux. Since the needle of a magnetic compass will align itself along such a flux line. It is a simple matter to construct a magnetic field line by marking the positions of alignment of a compass needle. Another way of determining the field shape of a magnet is to sprinkle iron filings in the region where one wishes to see the shape of the field. The filings will then be aligned with the flux lines, thereby delineating the shape of the field.
In this experiment we shall use both methods to determine the shapes of various fields.
17

Since the magnetic field is a vector field, there should be a point where the Earth's magnetic field vector just cancels the magnetic field vector of the magnet. This balance point is called the neutral point. We shall have an opportunity to find this point in this experiment.
SUPPLIES & EQUIPMENT:
2 Bar magnets 2 Horse shoe magnets Iron filings 18 Ruler8 ½ X 11 paper 22 X 34 paper Small compass 12 RulerPlexiglas sheet French curve Plywood board
PROCEDURE: Part I: SHAPE OF THE MAGNETIC FIELD USING IRON FILINGS
1. Place a sheet of 8½ X 11paper on the Plexiglas sheet away from all magnets.
2. Sprinkle a very thin layer of iron filings evenly over the paper.
3. Put the Plexiglas sheet over the first magnet arrangement in Figure 1.
4. Tap sides of paper lightly until the field lines gradually show up.
Fig. 1. Magnet Pole Arrangements
5. Repeat steps 1 - 4 for the other two pole arrangements in Figure 1.
6. Sketch the magnetic poles and field lines.
Part II: SHAPE OF THE MAGNETIC FIELD USING A MAGNETIC COMPASS
1. Tape the large paper on the wooden board and align the edge of the paper along the NS axis, with a compass. Tape the bar magnet on the paper as shown in Figure 2.
2. Draw lines AA, BB and CC as shown below:
18

Fig. 2: Experimental Setup For Part II
3. Start with line BB approximately 10 cm away from the bar magnet and mark the position of the tip and tail of the compass needle.
4. Move the tail of the needle to coincide with the tip of the previous compass position. Continue the process until the field line terminates at each pole of the magnet.
5. Join the dots that mark the changing positions of the compass needle tip with a smooth line. Repeat the process for positions of 20 and 40 cm.
6. Repeat steps 4 and 5 for lines AA and CC.
7. Explain any irregularities from the expected dipole field in your conclusion.
Part III: DETERMINATION OF THE NEUTRAL POINT
1. Make sure the North pole of the magnet is still aligned with the Earth's magnetic South pole (geographic North). Find the neutral point by sliding the compass slowly along the BB line. At the neutral point, the magnetic force due to Earth's magnetic poles are balanced by the magnetic force of the bar magnet. Sketch a vector diagram indicating why there should be a neutral point.
Experiment 9: THE TANGENT GALVANOMETER
PURPOSE:
In this experiment we will measure the magnitude of the horizontal component of the Earth's Magnetic field by the use of an instrument called a tangent galvanometer.
INTRODUCTION:
A tangent galvanometer consists of a number of turns of copper wire wound on a hoop. At the center of the hoop a compass is mounted. When a direct current flows through the wires, a magnetic field is induced in the space surrounding the loops of wire.
19

This magnetic flux is designated by Bi . The strength of the magnetic field induced by the current at the center of the loops of wire is given by Amperes law:
Induced Bi =
μoN I2 R .
where o is the permeability of free space and has the value of 4 x 10⁻⁷ N/A2, N is the number of turns of wire, I is the current through the wire, and R is the radius of the loop.
When the wire loops of the tangent galvanometer are aligned with the magnetic field of the Earth, and a current is sent through the wire loops, then the compass needle will align with the vector sum of the field of the Earth and the induced field as shown in Figure 1.
Fig. 1
The horizontal component of the magnetic field of the Earth is easily calculated from the following relation:
B of Earth =
B itanθ .
SUPPLIES & EQUIPMENT:
Tangent galvanometer Ammeter Leads & connectorsReversing switch Ruler Rheostat, 20 DC supply, 6 V Plywood board
PROCEDURE:
1. Set up the apparatus on a board between tables as shown in Figure 2. Be sure to orient the loops exactly in the North-South direction. Orient the compass so that the needle is pointing to zero degrees.
20

Fig. 2: Apparatus Wiring Diagram
Binding posts configuration
2. Supply power to the 10-turns binding posts and adjust the rheostat until a deflection of 45o is indicated on the compass. Reverse the current to obtain a 45o deflection on the other side of the compass. Record the exact current for each deflection.
3. Sketch a vector diagram for the situation where there is a 45o deflection. Calculate the magnitude of the horizontal component of the Earth's magnetic field. The SI unit for B is the Tesla (T). There are 104 gauss per Tesla.
4. Repeat steps 2 and 3 for a 63.5o deflection. What is the relationship between the Earth's field and the field of the loop for this case? Draw a vector diagram.
5. Repeat the entire procedure for the 15-turns binding posts. What conclusion can you draw about the magnetic field of the loop from this part of the experiment?
Experiment 10: CAPACITIVE AND INDUCTIVE REACTANCE
PURPOSE:
In this experiment we will study the effects of inductors and capacitors in a series alternating current circuit. From the observation of these effects, the concepts of high pass and low pass filters will be apparent.
INTRODUCTION: 21

In an AC circuit containing resistance and either inductance or capacitance, the resistive effect of these circuit elements is called the inductive reactance XL and capacitive reactance XC respectively. These reactances are given theoretically by:
XL = 2 fL, XC = 1
2 π fC . (Unit is the ohm.)
These impedances are proportional to the frequency at which the circuit is driven. Experimentally, we can obtain a value for these reactances from the following equation:
XL = VL/I XC = VC/I
Since the voltages across the inductor and capacitor are out of phase with the voltage across the resistor VR by 90o, it is necessary to add the voltages vectorially to obtain the voltage across either the inductor or the capacitor:
VL = √V s2− V R2
. (where Vs = source voltage)
The current in the circuit is given by: I = VR/R
SUPPLIES & EQUIPMENT:
AC generator Frequency counterDigital voltmeter DVM, ACV 2-Volt rangeInductance coil, 10 mHComposition resistor, 470
(yellow, violet, brown, silver)Ruler & French curveDecade capacitor box
PROCEDURE:
Part A. Inductive Reactance
1. Set up the apparatus as shown in Figure 1.
22

Fig. 1
2. Set the function generator (Vs) to approximately 2 Volts and set the frequency to 1000 Hz. (Check Vs with the DVM set at ACV, 2V and check the frequency with the frequency counter.)
3. Record the source voltage and the voltage across the resistor on the data table.
4. Determine VL from VL =√V s2− V R2
I from I = VR / R
XL from XL = VL / I
5. Repeat steps 2 through 4 for f = 1500 Hz to 4500 Hz in steps of 500 Hz.
6. Compare the experimental reactance with the theoretical reactance.
7. Plot XL versus frequency.
Part B: Capacitive Reactance
1. Repeat the above procedure only this time use a 0.5 F capacitor as the element instead of the inductor.
Experiment 11: THE OSCILLOSCOPEPURPOSE: a) Introduce the principles of operation
b) Measure AC voltages and frequenciesc) Observe Lissajous Figures
INTRODUCTION:
23

The oscilloscope (shown schematically in Figure 1) is an essential instrument in the study of AC signals and circuits.
Fig. 1. The Oscilloscope
Fig. 2
A) Power on/off and intensity J) Type of signal for channel 2.B) Horizontal position of both traces, K) Channel trigger settings.
pull switch for 10X horizontal L) Channel 1, vertical amplitudeC) Trigger setting for channel 2. M) Chooses type of display for channels 1 & 2D) Beam focusing N) Channel 2, vertical amplitudeE) Time per screen division = 1 cm O) Signal input for channel 1.F) Knob making time/division variable. P) Vertical positioning of trace of channel 1.G) Screen scale illumination. Pull switch for 5X vertical.H) x-y setting for Lissajous Figures. Q) Vertical positioning of trace of channel 2.I) Type of signal for channel 1. R) Signal input for channel 2.
Pull switch for 5X vertical.SUPPLIES & EQUIPMENT:
Hitachi dual trace oscilloscope V-550B 1000 carbon resistor Function generator (F. G.) Simpson # 420 Test leads as neededDigital voltmeter Digetec, model 2180 Frequency counter,Power outlet strip Tenma, model # 72-460BNC to banana adaptor
24

PROCEDURE:
PART I: OSCILLOSCOPE SETUP
A. Adjustments to obtain trace: 1) Intensity -Low knobs/lever: A,G2) Trigger -Ext C3) Position -Center B, P, Q4) Coupling -AC I, J5) Focus -Sharp D, G6) Sweep -1 msec/cm E7) Deflection -1 V/cm L, N
Refer to Figure 2.
PART II: MEASURING AN AC (SINE WAVE) VOLTAGE
1. Set up the apparatus as shown in Figure 3.
Fig. 3
2. Adjust the function generator to 100 Hz at 6 V peak-to-peak.
3 Compute Vrms ( = 0.707 Vo).4 Record the sweep rate in ms/cm and centimeter per cycle. From the oscilloscope trace,
estimate the number of centimeters per cycle.
Calculate the period (time for 1 cycle).
5. Read the root mean square voltage from digital multimeter and compare to the root mean square voltage estimated on the oscilloscope trace. See Fig. 4.
25
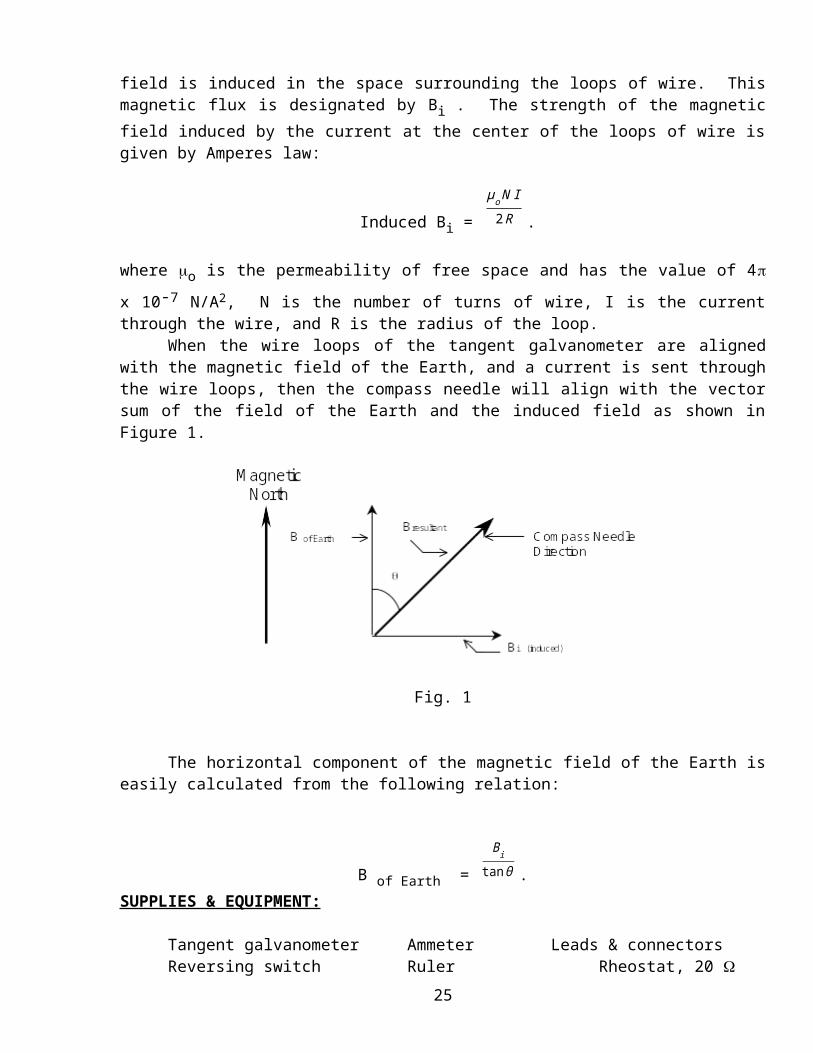
Fig. 4
6. Sketch a trace of the 200 Hz AC signal seen on the oscilloscope. Indicate Vpp, Vo and Vrms on the reticule in the data sheet.
PART III: LISSAJOUS FIGURES
1. Set up apparatus as in Figure 5.
2. Adjust function generator # 2 (F.G. 2) to the same frequency and voltage as function generator # 1 (F.G. 1).
3. Observe lissajous figures when F.G. 2 frequency is 2, 3, and 4 times that of F.G. 1
4. Observe the lissajous figures when F.G. 1 frequency is 2, 3, and 4 times that of F.G. 2.
5. Sketch all lissajous figures.
Fig. 5
26

Experiment 12: THE VISIBLE SPECTRUM
PURPOSE:
The wavelengths of electromagnetic waves in the visible range will be determined with a diffraction grating.
27

INTRODUCTION:
A diffraction grating consists of a number of closely spaced parallel lines ruled on a glass surface. It is a useful device for separating out the various wavelengths in a spectrum. It has the same effect as a prism but with greater resolving power.
According to the theory of interference, the condition for constructive interference is given by: = n= d sin where is the path difference,n is the order number, is the wavelength, d is the slit separation and is the diffraction angle.
Fig. 1
= n
= d sin
n = d sin
and =
The diffraction grating spacing d will be determined with a helium-neon laser beam of 633 nm wavelength ().
tan =
= tan-1( ΔxL )
Fig. 2
SUPPLIES & EQUIPMENT:
Helium-neon laser 11 X 17 paper Laboratory jackGrating stand & holder Two-meter stick One-meter stickLarge replica grating 2 ring stands Masking tapeIncandescent light source 2 buret clamps Color pencilsLarge cardboard Laser safety goggles
PROCEDURE:
PART A: DETERMINATION OF THE GROOVE SEPARATION d
1. Set up the grating and helium-neon laser. See Figure 3. Set the grating at exactly two meters from the chalkboard (L = 2.00). Measure the distance x for the 1 st and 2nd order (n = 1 and 2) bright fringes from the central spot. Determine an average value for the groove spacing d from your data. The wavelength of the laser light is 633 nm.
28
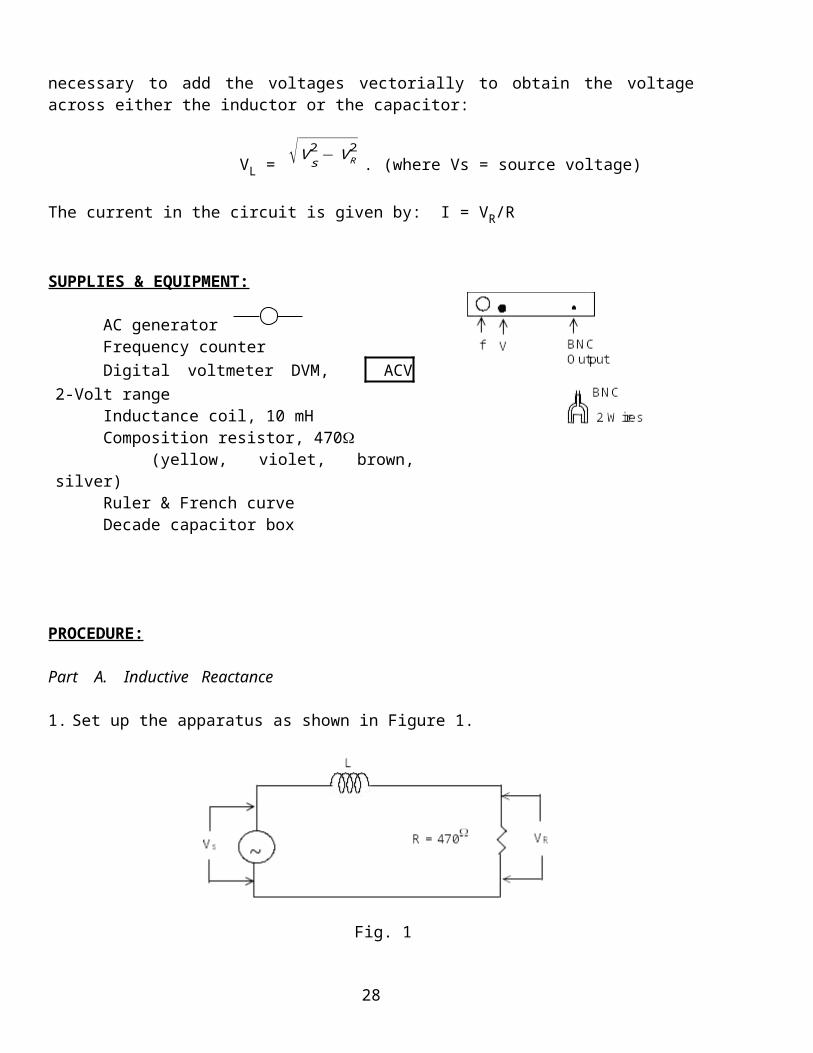
Fig. 3
PART B: DETERMINATION OF THE WAVELENGTH RANGES FOR VISIBLE LIGHT
1. Set up the apparatus as shown in Figure 4, replacing the laser with the incandescent source.
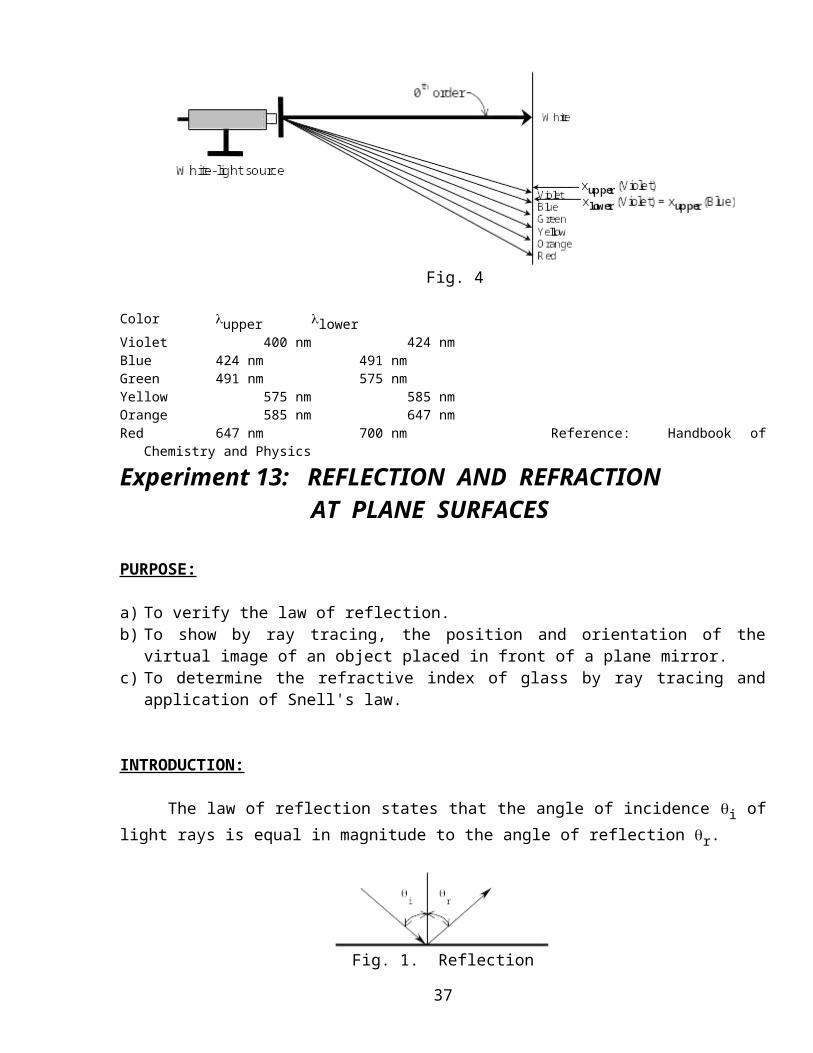
2. Record L. Record xupper and xlower for the upper and lower limit of each color band, as shown in Figure 4.
3. Calculate .
Fig. 4
Color upper lowerViolet 400 nm 424 nmBlue 424 nm 491 nmGreen 491 nm 575 nmYellow 575 nm 585 nmOrange 585 nm 647 nmRed 647 nm 700 nm Reference: Handbook of Chemistry and Physics
Experiment 13: REFLECTION AND REFRACTIONAT PLANE SURFACES
PURPOSE:
a) To verify the law of reflection.b) To show by ray tracing, the position and orientation of the virtual image of an object
placed in front of a plane mirror.
29

c) To determine the refractive index of glass by ray tracing and application of Snell's law.
INTRODUCTION:
The law of reflection states that the angle of incidence i of light rays is equal in magnitude to the angle of reflection r.
Fig. 1. Reflection
The law of refraction, Snell's law, states that: n1 sin 1 = n2 sin 2.
Fig. 2. Refraction
where n1 and n2 are the refractive indices of two different mediums. The refractive index of a medium is defined as the ratio of the velocity of light in air, c = 3.00 X 10⁸ m/s, to its velocity in that medium. The refractive index of air is 1.000. The refractive index of any medium can be determined by measuring the angle of incidence, 1, the angle of refraction 2 and applying Snell's law.
SUPPLIES & EQUIPMENT:
Cork board Plane mirror Long common pins Wood blockPlate glass 11 X 17 paper Colored pencils Masking tapeRefraction cube Ruler & protractor
PROCEDURE:
PART A: REFLECTION
1. Draw a straight line across the middle of the paper and then draw a triangle with vertices A, B and C. Tape the mirror to a block and set it vertically on the line so that the reflecting surface (back side) is on the line. The setup is shown in Figure 3 below:
30
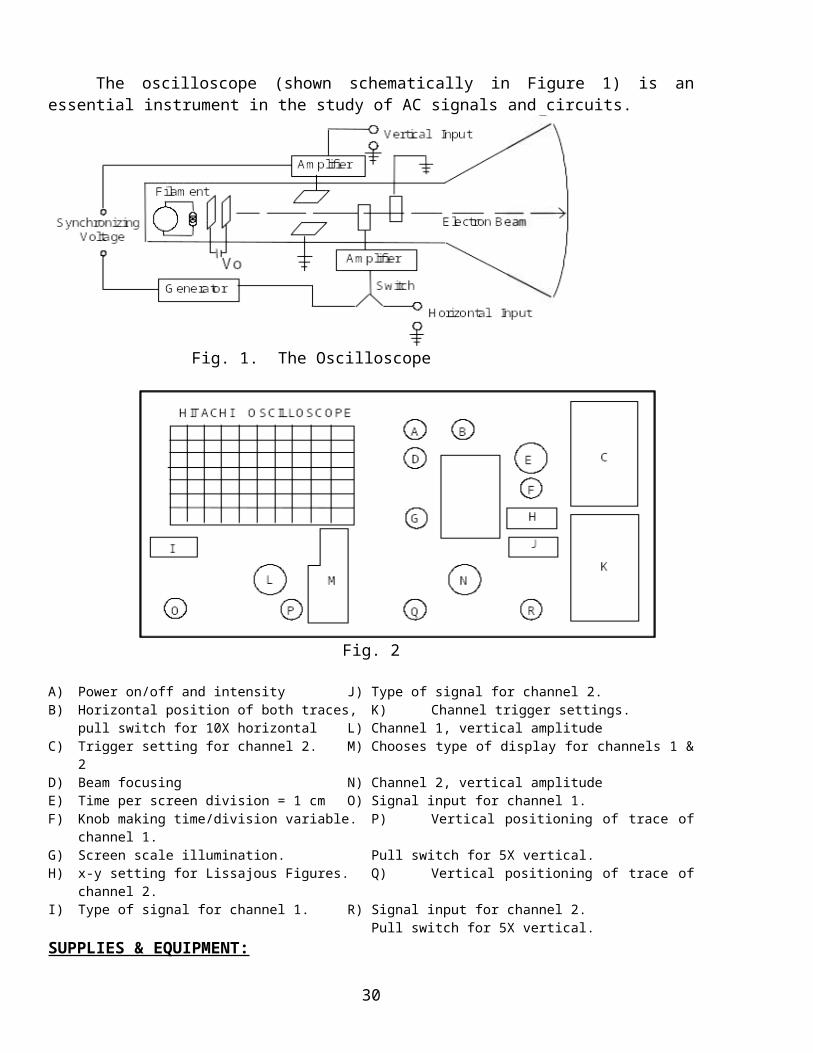
Fig. 3
2. Place a pin at vertex A. From the right side of this triangle, look into the mirror for the image of pin A in the mirror. Regard the image in the mirror as A. Place a pin R1 in front of this image, A. Along your line of sight *, place another pin R2 in front of R1 so that A and R1 both appear to be right behind it. Draw a line joining the points R2 and R1 and extend this line to the mirror surface. Remove pins R1 and R2.
* Make sure that your eye level and the pins are on the same plane.
3. Repeat the same procedure to the left side of the triangle. With pin A still in place, locate L1 in front of A and L2 in front of L1. Join points L1 and L2 and extend the line to the mirror surface. Remove pin A.
4. Place a pin at B. Repeat steps 2 and 3 for points RB1 and RB2, LB1 and LB2. Extend lines RB1 RB2 and LB1 LB2 to the surface of the mirror.
5. Place a pin at C, repeat steps 2 and 3 for point C.
6. Remove the mirror and extrapolate the lines until they intersect at A, B and C. Join points A, B and C to reconstruct the mirror image (virtual). Fold the paper along the mirror line and hold it against the light to see if the object ( ABC) and the image ( ABC) can be superimposed on each other.
7. For the vertex A only, draw a line from vertex A to the point where the line R1R2 meets the mirror. Construct a normal to the mirror at this point. Measure the angles of incidence and reflection with a protractor. See Figure 3.
PART A: REFRACTION
1. Using another sheet of paper, draw two straight lines perpendicular to each other. Measure and draw the three angles 1, 2, and 3. Make your angles 15o, 30o and 45o
31

respectively from the normal. The setup is shown in Figure 4. Place the glass cube along the horizontal line and trace the outline of the glass cube.
Fig. 4
2. Place pins A and R as shown in Figure 4. Use a locater pin L to line up A and R that are on the 15o line. Pins L and R should be as close to the glass surface as possible. Repeat the procedure for the 30o and 45o angles.
3. Measure the angle of refraction for each incident angle. Use Snell’s law to compute the index of refraction of the glass for each incident and refracted ray. Average three suitable values and report an average index of refraction for the glass. Look up the literature value of the index of refraction for plate glass. Compare your result to this value.
32

Experiment 14: THE THIN LENS
PURPOSE:
The purpose of this laboratory exercise is to investigate the way in which the image distance, object distance and focal length for a thin lens are related.
33

INTRODUCTION:
The lens equation which relates the object distance, do, image distance, di, and the focal length, f, for a glass lens is:
1do
+ 1d i
= 1f Eq. 1
In this experiment, we will use an optical bench to align a lighted object, a lens and a
screen. Light rays from the object, , which pass through the lens will form real images that can be focused on the screen. Observations will be made as to the nature of the image, that is, whether it is real or virtual, erect or inverted, and magnified or reduced. Image location can be estimated with the use of ray diagrams.
Examples of ray diagrams for convex and concave lenses.
Convex lens Concave lens
SUPPLIES & EQUIPMENT:
Optical bench & accessories 20 cm double concave lensRuler 20 cm double convex lens
PROCEDURE:
1. Determine the focal length of the convex lens that you are using by mounting the lens in a stand at a distance from a window. Adjust the distance from the lens to a paper screen until the image of an object outside the window is in sharp focus. Deduce the focal length of your lens by using equation (1), with do = ∞.
34

2. Mount the lens at the midpoint of the optical bench and mount the screen and object lamp on opposite sides of the lens.
3. Place the object at a position that is somewhat greater than twice the focal length of the lens (do > 2f). Move the screen until you get a sharp focus. Describe the characteristics of the image. Record the image distance and the object distance. Calculate the image distance using Eq. 1.
4. Repeat step 3 for the object at exactly twice the focal length (do = 2f).
5. Repeat step 3 for the object at somewhere between twice the focal length and the focal length (2f > do > f).
6. Repeat step 3 for the object at exactly the focal length (do = f).
7. Place the object at a distance that is within the focal length. Look through the lens and describe the nature of the image (do < f).
8. Replace the biconvex lens with one that is biconcave. Look through the lens at the object and describe what you observe.
9. Calculate the image distance di for images seen through the biconcave lens using the lens equation.
10.Calculate the image height hi using the magnification equation.
| M | = | - di / do| = hi / ho
hi = ho | di / do|
11. On the graph paper, draw ray diagrams to scale. Indicate the scale used.
1.0 cm = ________ cm
RAY DIAGRAMS FOR CONVEX LENSES:
35

RAY DIAGRAMS FOR CONCAVE LENSES:
36

Experiment 15: ATOMIC SPECTRA
PURPOSE:
The purpose of this experiment is to measure the wavelengths of light emitted by atoms of different elements.
INTRODUCTION:
The electrons of gases can be raised to excited states if the atoms of the gas absorb specific quanta of energy. The electrons are said to have been raised from their ground state to higher energy levels. When these electrons fall back to the ground state or to another lower level, light is emitted. These photons have unique wavelengths corresponding to the difference in energy between the two states of the electron as it falls.
In this experiment, high voltage supplies the energy to the atoms in the gas discharge tube. The electrons are excited and fall to a lower state almost immediately. The mixture of light produced can be separated using a diffraction grating and then the wavelength can be calculated from the equation = d sin.
SUPPLIES & EQUIPMENT:
37
Spectrum tube power supply Ar, He, H Spectrum tubes 2 ringstands2 One-meter sticks 2 Buret clamps GratingGrating holder & stand Small reading lamp
PROCEDURE:
1. Set up the apparatus as shown in Figure 2.
2. Adjust your eyes in a position such that you can locate the first order spectral lines.
3. Determine the x and L for each spectral line for argon, helium and hydrogen
4. Determine tan = ΔxL and = tan-1( ΔxL ) .
5. Determine the wavelength, of the spectral lines. The grating has 600 grooves per millimeter. The grating constant, d, is the distance between the grooves on the grating.
For our gratings, d = 1
600 000 in units of nanometers.
6. Compare these wavelengths with the known spectral line values given.
Fig. 1
38

Fig. 2
Selected spectral line wavelengths ( in nm, See Handbook for complete description)
Helium Argon Hydrogen Red 668 nm Red 697 nm Red 656 nmYellow 588 nm Orange 642 nm Turquoise 486 nmGreen 502 nm Green 523 nm Purple 434 nmBlue 447 nm Blue-Violet 452 nm Violet 410 nmViolet 403 nm
Experiment 16: RADIOACTIVITY
PURPOSE:
To learn about the operation and the use of a geiger counter in the detection of radiation.
INTRODUCTION: The Geiger Counter
39

SUPPLIES & EQUIPMENT: Geiger counter Geiger tube
40