ozone layer monitoring - · ozone layer monitoring ... amsterdam island cape grim lauder izaña...
TRANSCRIPT
World Meteorological Organization Working together in weather, climate and water
Geir O. Braathen, WMO, Research Department
Ozone Layer Monitoring Geir O. Braathen
Atmospheric Environment Research Division, Research Department, WMO
Brewer Biennial Workshop, Santa Cruz de Tenerife, 24-28 March 2014. 2
Monitoring matters!
Brewer Biennial Workshop, Santa Cruz de Tenerife, 24-28 March 2014. 3
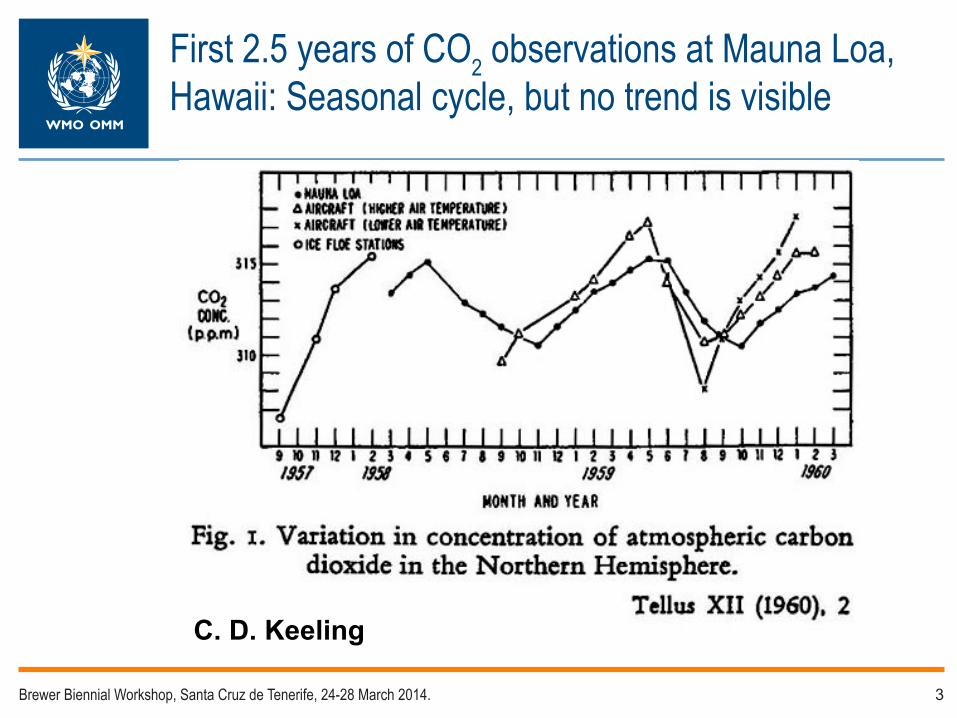
C. D. Keeling
First 2.5 years of CO2 observations at Mauna Loa, Hawaii: Seasonal cycle, but no trend is visible

Brewer Biennial Workshop, Santa Cruz de Tenerife, 24-28 March 2014. 4
After 55 years of continuous observations: The amount of CO2 in the atmosphere is increasing ex-ponentially (approx. 0.5%/yr)
Brewer Biennial Workshop, Santa Cruz de Tenerife, 24-28 March 2014. 5
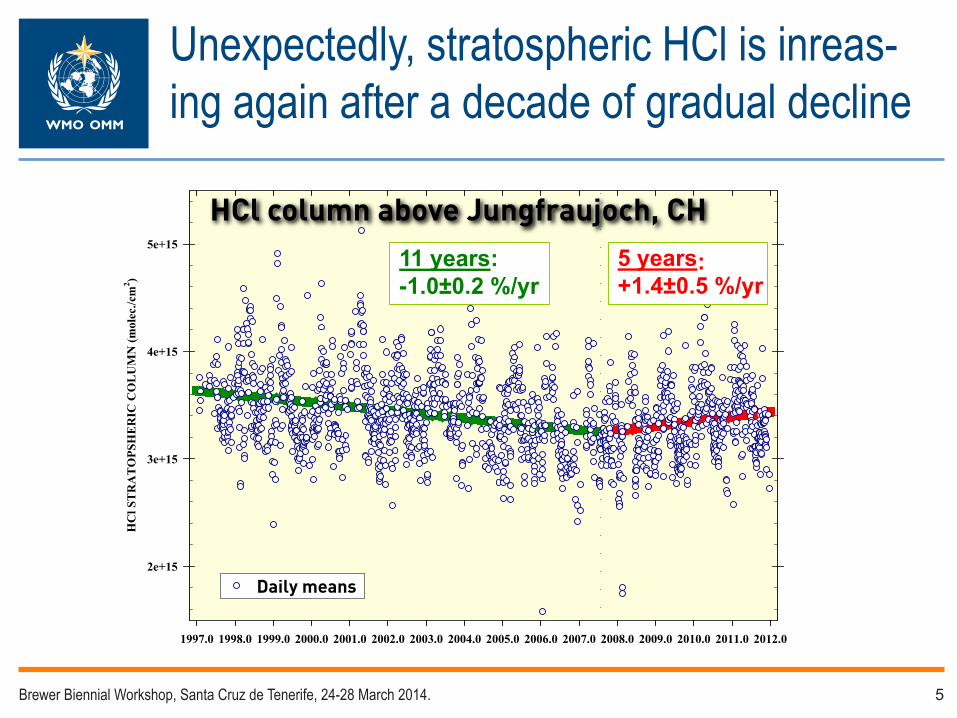
1997.0 1998.0 1999.0 2000.0 2001.0 2002.0 2003.0 2004.0 2005.0 2006.0 2007.0 2008.0 2009.0 2010.0 2011.0 2012.0
HC
l ST
RA
TO
PSH
ER
IC C
OL
UM
N (m
olec
./cm
2 )
2e+15
3e+15
4e+15
5e+15
Daily means
HCl column above Jungfraujoch, CH11 years1.0 0.2 %/yr
:- ±
5 years+1.4 0.5 %/yr
:±
Unexpectedly, stratospheric HCl is inreas-ing again after a decade of gradual decline
Brewer Biennial Workshop, Santa Cruz de Tenerife, 24-28 March 2014. 6
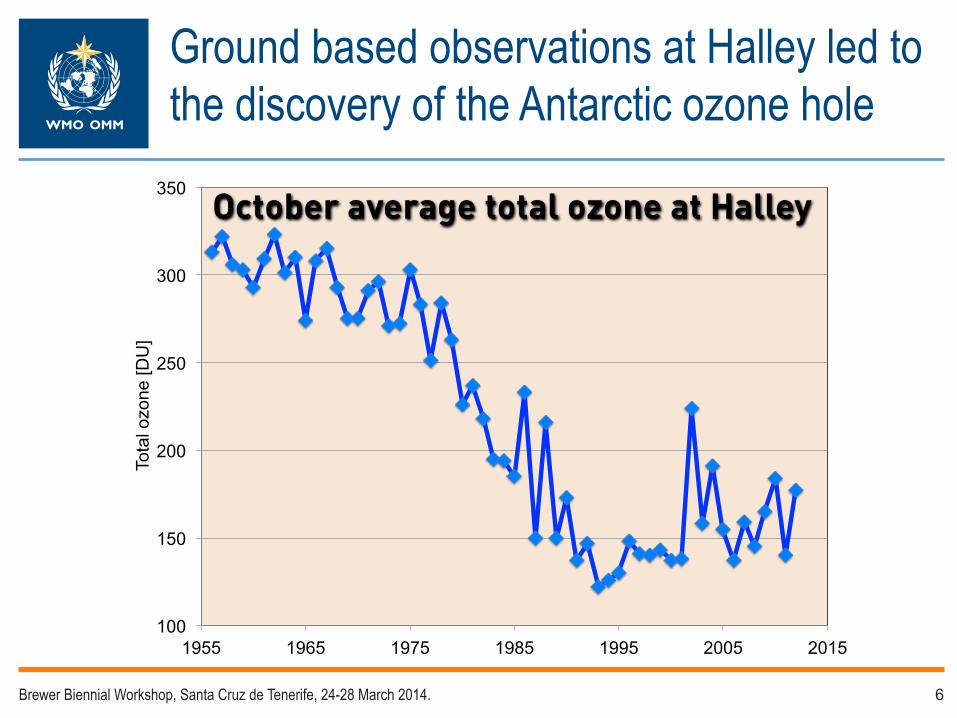
Ground based observations at Halley led to the discovery of the Antarctic ozone hole
100
150
200
250
300
350
1955 1965 1975 1985 1995 2005 2015
Tota
l ozo
ne [D
U]
October average total ozone at Halley
Brewer Biennial Workshop, Santa Cruz de Tenerife, 24-28 March 2014. 7
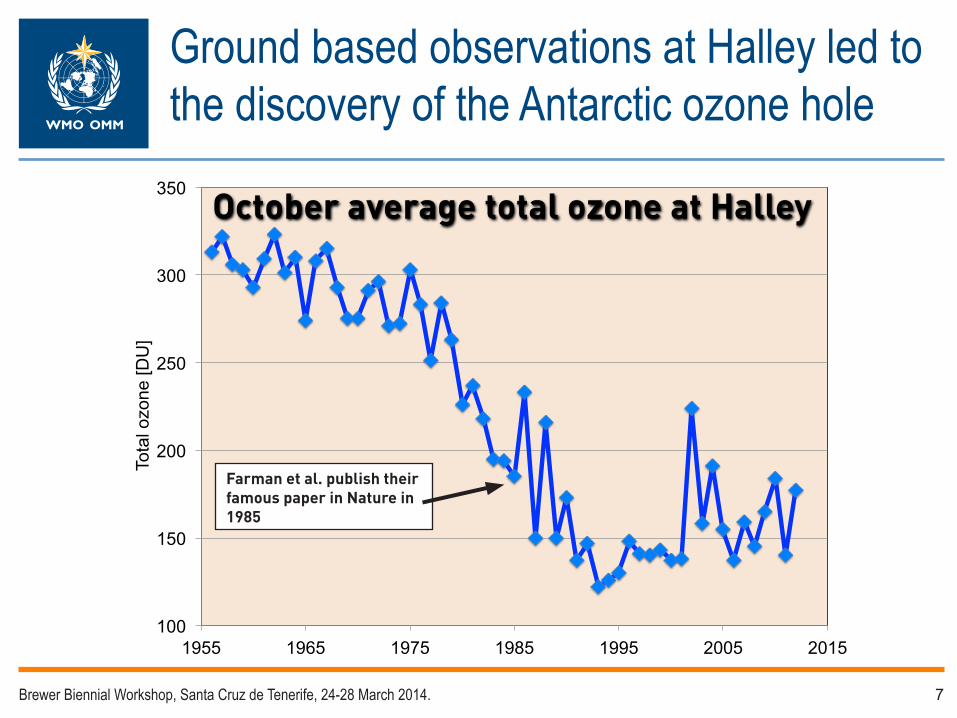
Ground based observations at Halley led to the discovery of the Antarctic ozone hole
100
150
200
250
300
350
1955 1965 1975 1985 1995 2005 2015
Tota
l ozo
ne [D
U]
October average total ozone at Halley
Farman et al. publish their famous paper in Nature in 1985
Brewer Biennial Workshop, Santa Cruz de Tenerife, 24-28 March 2014. 8
290
300
310
320
330
340
350
360
1925 1935 1945 1955 1965 1975 1985 1995 2005 2015
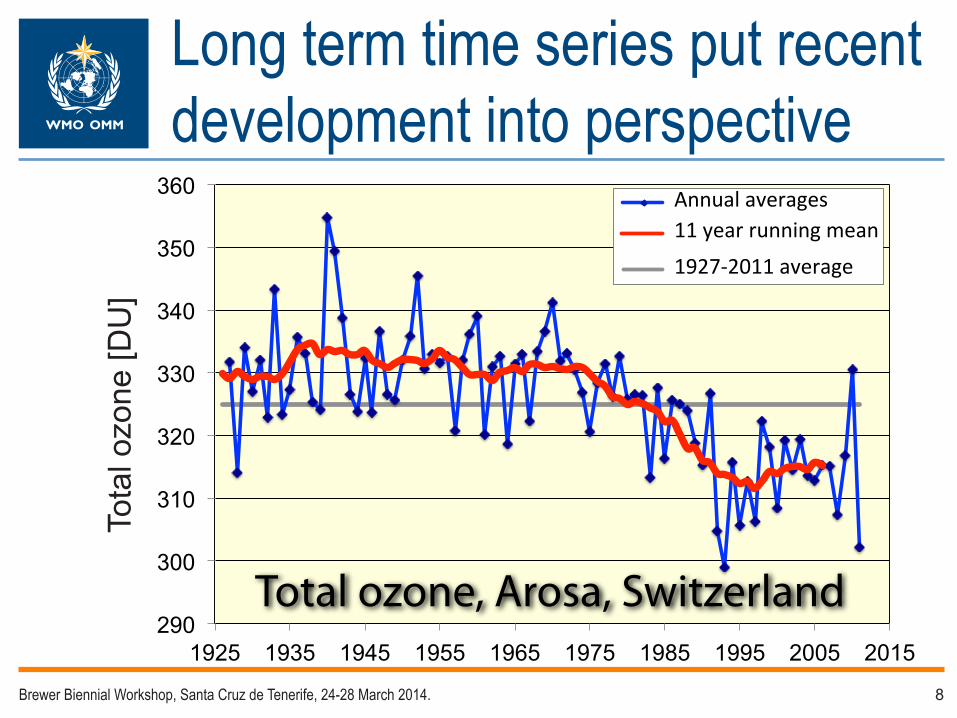
Total ozone, Arosa, Switzerland
Annual averages 11 year running mean
1927-2011 average
Tota
l ozo
ne [D
U]
Long term time series put recent development into perspectiveTo
tal o
zone
[DU
]
TCCON
World Data Centres
GAW stations & GAWSIS
CAS Open ProgrammeArea Group
EPAC
SAG
s GAW Secretariat
Environmental Pollution & Atmospheric Chemistry
Satellites & AircraftAlert
South Pole
Mace Head
Ny-ÅlesundPallas/Sodankylä
Zugspitze/Hohenpeißenberg
Mt. Waliguan
Mt. Kenya
Trinidad Head
Pt. Barrow
Mauna Loa
Arembepe
Ushuaia
Neumayer
Cape Point
Samoa
Amsterdam Island Cape GrimLauder
Izaña
Cape Verde
Jungfraujoch
Danum Valley
Minamitorishima
Bukit Koto Tabang
Assekrem /Tamanrasset
Pyramid
Monte Cimone
Halley
Central Calibration LaboratoriesWorld & Regional Calibration Centres
Joint Steering Committee
Host GAW World Reference Standards
Ozone UV
Aerosols
Precipitation chemistryGreenhouse Gases
Reactive gases
Contributing networks
BSRN
NOAA ESRL/GMD(USA) FZJülich (DE)
NIST(USA)
Environment Canada
NOAA ESRL/GMD
(USA)WORCC
(CH)EMPA (CH)
Total O3
IMK-IFU (DE) IFT (DE)
SUNY Albany(USA)
WOUDCOzone & UV
IGACO-Ozone
IGACO-GHG
IGACO-AerosolsIGACO-Air Quality
GHG BulletinsO3 BulletinsAssessmentsGlobal fields
products
CO2, CH4, N2OCO, Dobson O3
Brewer total O3
In situ O3
Ozone-sondes
GHG N2O VOC
Precip.chem.
Physical aerosol
properties
In situO3, CO,
CH4
3 WCC (US, CA, RU)6 Dobson RCC (JP, AU, ZA, AR, DE, CZ)1 Brewer RCC (ES)
Optical depth
O3
Sondes
FZJülich (DE)
Environment Canada (CA)
Greenhouse gases
WDCGG
JMA (JP)
AerosolsWDCA
NILU (NO)
RadiationWRDC
MGO (RU)
WDCPCPrecip. chem.
SUNY Albany (USA)
Quality Assurance & Science Activity Centres
CH4
JMA (JP)
GURME
IGACO-Aircraft
WDC-RSATSatellite data
DLR (DE)
CARIBICCAPMoN
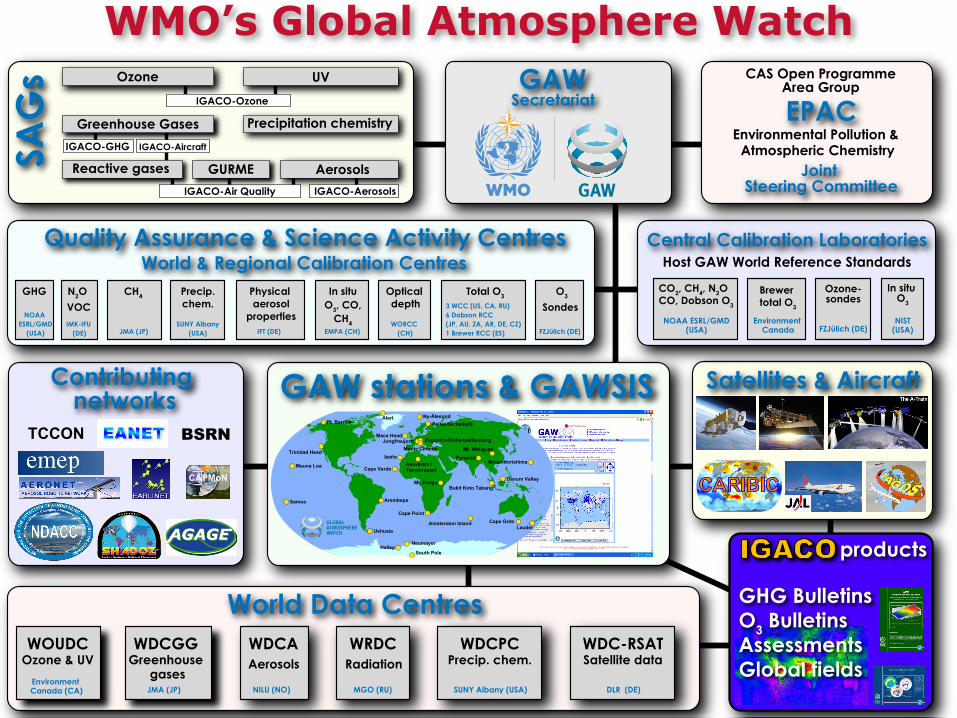
WMO’s Global Atmosphere Watch
Brewer Biennial Workshop, Santa Cruz de Tenerife, 24-28 March 2014. 10
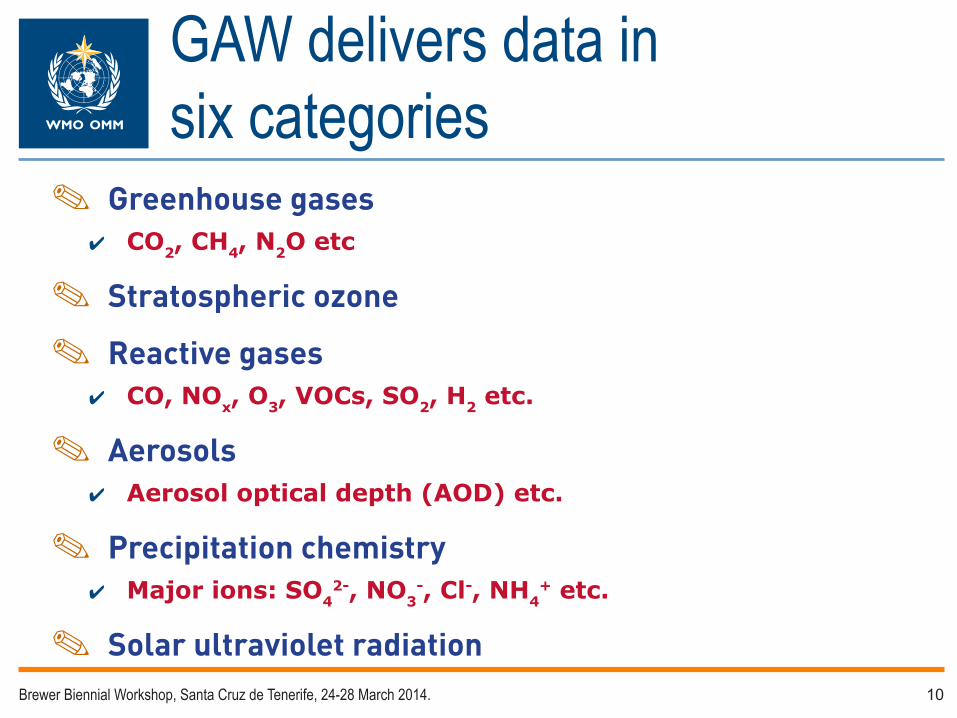
GAW delivers data in six categories
�� Greenhouse gases✔✔ CO2, CH4, N2O etc
�� Stratospheric ozone
�� Reactive gases✔✔ CO, NOx, O3, VOCs, SO2, H2 etc.
�� Aerosols✔✔ Aerosol optical depth (AOD) etc.
�� Precipitation chemistry✔✔ Major ions: SO4
2-, NO3-, Cl-, NH4
+ etc.
�� Solar ultraviolet radiation
World Data Centres
GAW stations & GAWSIS
CAS Open ProgrammeArea Group
EPAC
SAG
s GAW Secretariat
Environmental Pollution & Atmospheric Chemistry
Satellites & AircraftAlert
South Pole
Mace Head
Ny-ÅlesundPallas/Sodankylä
Zugspitze/Hohenpeißenberg
Mt. Waliguan
Mt. Kenya
Trinidad Head
Pt. Barrow
Mauna Loa
Arembepe
Ushuaia
Neumayer
Cape Point
Samoa
Amsterdam Island Cape GrimLauder
Izaña
Cape Verde
Jungfraujoch
Danum Valley
Minamitorishima
Bukit Koto Tabang
Assekrem /Tamanrasset
Pyramid
Monte Cimone
Halley
Central Calibration LaboratoriesWorld & Regional Calibration Centres
Joint Scientific Steering Committee
Host GAW World Reference Standards
Ozone UV
Contributing networks
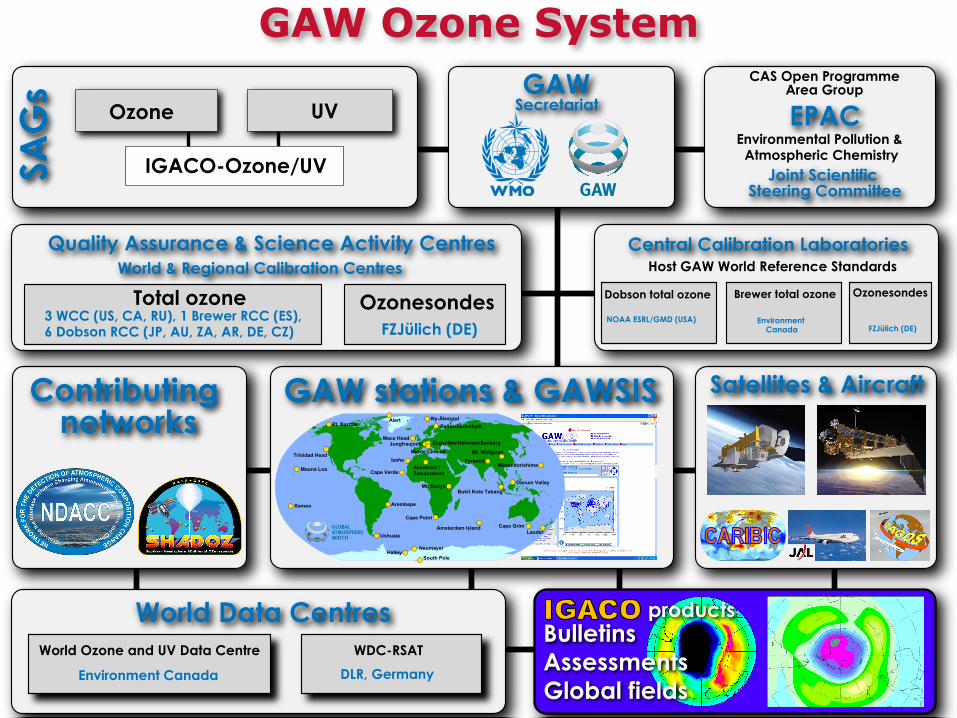
NOAA ESRL/GMD (USA)FZJülich (DE)
Environment Canada
Total ozone
World Ozone and UV Data Centre
IGACO-Ozone/UV
BulletinsAssessmentsGlobal fields
products
Dobson total ozone Brewer total ozone Ozonesondes
3 WCC (US, CA, RU), 1 Brewer RCC (ES), 6 Dobson RCC (JP, AU, ZA, AR, DE, CZ)
OzonesondesFZJülich (DE)
Environment Canada
Quality Assurance & Science Activity Centres
WDC-RSATDLR, Germany
Alert
South Pole
Mace Head
Ny-ÅlesundPallas/Sodankylä
Zugspitze/Hohenpeißenberg
Mt. Waliguan
Mt. Kenya
Trinidad Head
Pt. Barrow
Mauna Loa
Arembepe
Ushuaia
Neumayer
Cape Point
Samoa
Amsterdam Island Cape GrimLauder
Izaña
Cape Verde
Jungfraujoch
Danum Valley
Minamitorishima
Bukit Koto Tabang
Assekrem /Tamanrasset
Pyramid
Monte Cimone
Halley
GAW Ozone System
Brewer Biennial Workshop, Santa Cruz de Tenerife, 24-28 March 2014. 12
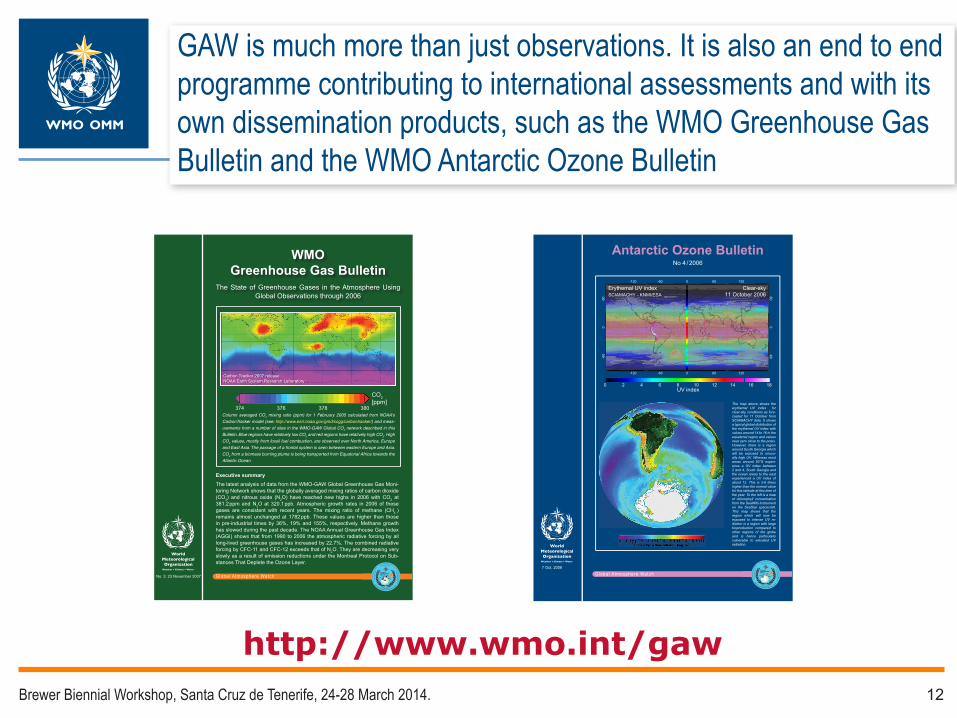
GAW is much more than just observations. It is also an end to end programme contributing to international assessments and with its own dissemination products, such as the WMO Greenhouse Gas Bulletin and the WMO Antarctic Ozone Bulletin
No. 3: 23 November 2007
Column averaged CO2 mixing ratio (ppm) for 1 February 2005 calculated from NOAA's
CarbonTracker model (see: http://www.esrl.noaa.gov/gmd/ccgg/carbontracker/) and meas-
urements from a number of sites in the WMO-GAW Global CO2 network described in this
Bulletin. Blue regions have relatively low CO2 and red regions have relatively high CO2. High
CO2 values, mostly from fossil fuel combustion, are observed over North America, Europe
and East Asia. The passage of a frontal system is seen between eastern Europe and Asia.
CO2 from a biomass burning plume is being transported from Equatorial Africa towards the
Atlantic Ocean.
374 376 378 380
CO2 [ppm]
WMO Greenhouse Gas Bulletin
The State of Greenhouse Gases in the Atmosphere Using Global Observations through 2006
Executive summaryThe latest analysis of data from the WMO-GAW Global Greenhouse Gas Moni-toring Network shows that the globally averaged mixing ratios of carbon dioxide (CO2) and nitrous oxide (N2O) have reached new highs in 2006 with CO2 at 381.2 ppm and N2O at 320.1 ppb. Atmospheric growth rates in 2006 of these gases are consistent with recent years. The mixing ratio of methane (CH4 ) remains almost unchanged at 1782 ppb. These values are higher than those in pre-industrial times by 36%, 19% and 155%, respectively. Methane growth has slowed during the past decade. The NOAA Annual Greenhouse Gas Index (AGGI) shows that from 1990 to 2006 the atmospheric radiative forcing by all long-lived greenhouse gases has increased by 22.7%. The combined radiative forcing by CFC-11 and CFC-12 exceeds that of N2O. They are decreasing very slowly as a result of emission reductions under the Montreal Protocol on Sub-stances That Deplete the Ozone Layer.
Carbon Tracker 2007 releaseNOAA Earth System Research Laboratory
Globa l A tmosphere Watch
7 Oct. 2006
Antarctic Ozone BulletinNo 4 /2006
-120 -60 0 60 120
-120 -60 0 60 120
-60
060
-600
60
0 2 4 6 8 10 12 14 16 18
Erythemal UV indexSCIAMACHY - KNMI/ESA
Clear-sky11 October 2006
UV index
The map above shows the erythemal UV index for clear-sky conditions as fore-casted for 11 October from SCIAMACHY data. It shows a typical global distribution of the erythemal UV index with values around 14 to 16 in the equatorial region and values near zero close to the poles. However, there is a region around South Georgia which will be exposed to unusu-ally high UV. Whereas most areas around 50°S experi-ence a UV index between 2 and 4, South Georgia and the ocean areas to the east experienced a UV index of about 12. This is 3-6 times higher than the normal value for this latitude at this time of the year. To the left is a map of chlorophyll concentration from the SeaWifs instrument on the SeaStar spacecraft. This map shows that the region which will now be exposed to intense UV ra-diation is a region with large bioproduction compared to other regions of the globe and is hence particularly vulnerable to elevated UV radiation.
Globa l A tmosphere Watch
http://www.wmo.int/gaw
Brewer Biennial Workshop, Santa Cruz de Tenerife, 24-28 March 2014. 14
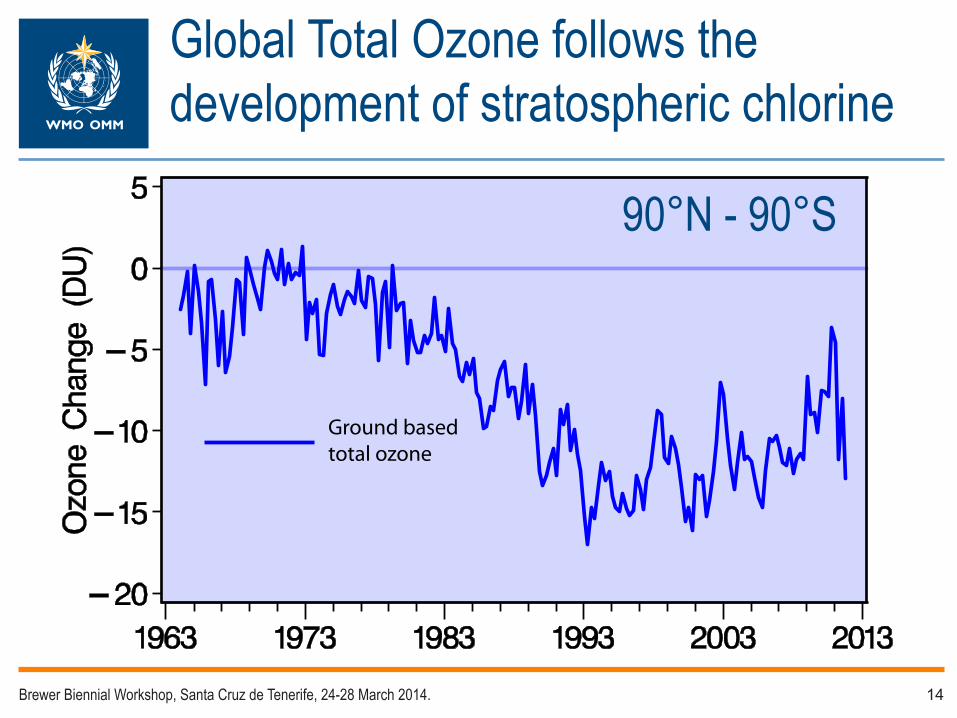
Global Total Ozone follows the development of stratospheric chlorine
Ground basedtotal ozone
90°N - 90°S
Brewer Biennial Workshop, Santa Cruz de Tenerife, 24-28 March 2014. 15
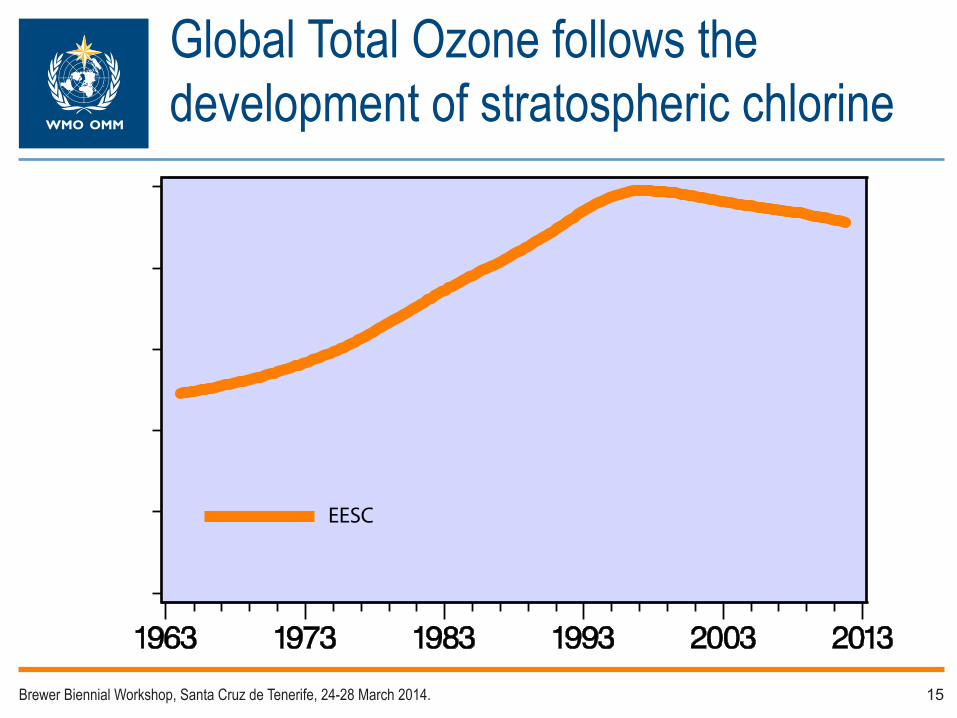
EESC
Global Total Ozone follows the development of stratospheric chlorine
Brewer Biennial Workshop, Santa Cruz de Tenerife, 24-28 March 2014. 16
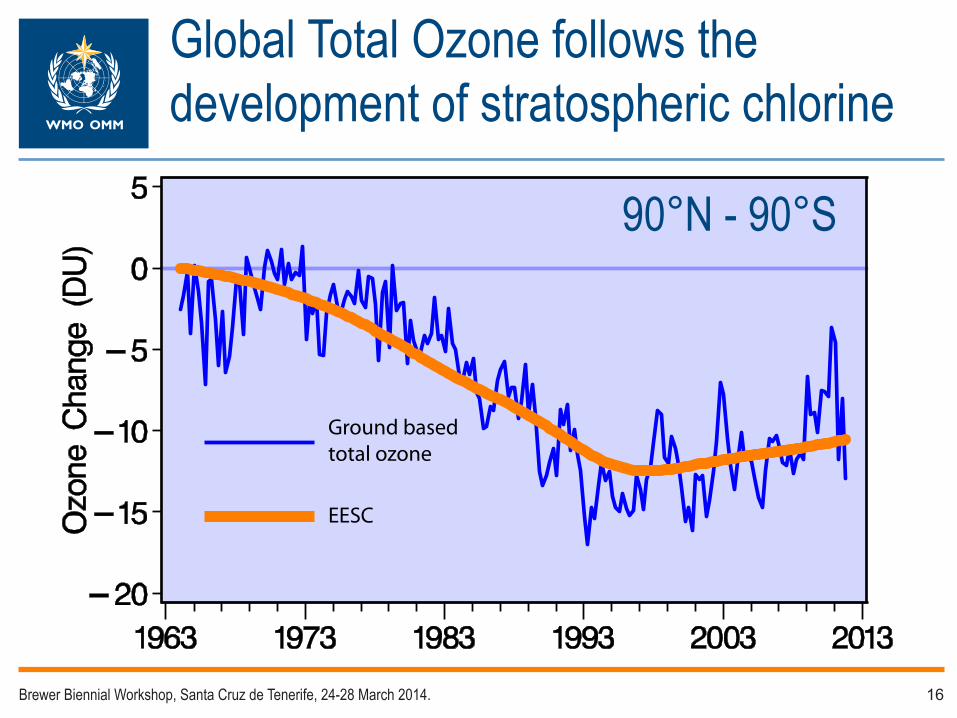
Ground basedtotal ozone
EESC
90°N - 90°S
Global Total Ozone follows the development of stratospheric chlorine
Brewer Biennial Workshop, Santa Cruz de Tenerife, 24-28 March 2014. 17
1980 1985 1990 1995 2000 2005 2010 2015
-505
35 to
45
km o
zone
ano
mal
y [%
]
-20-15-10-505
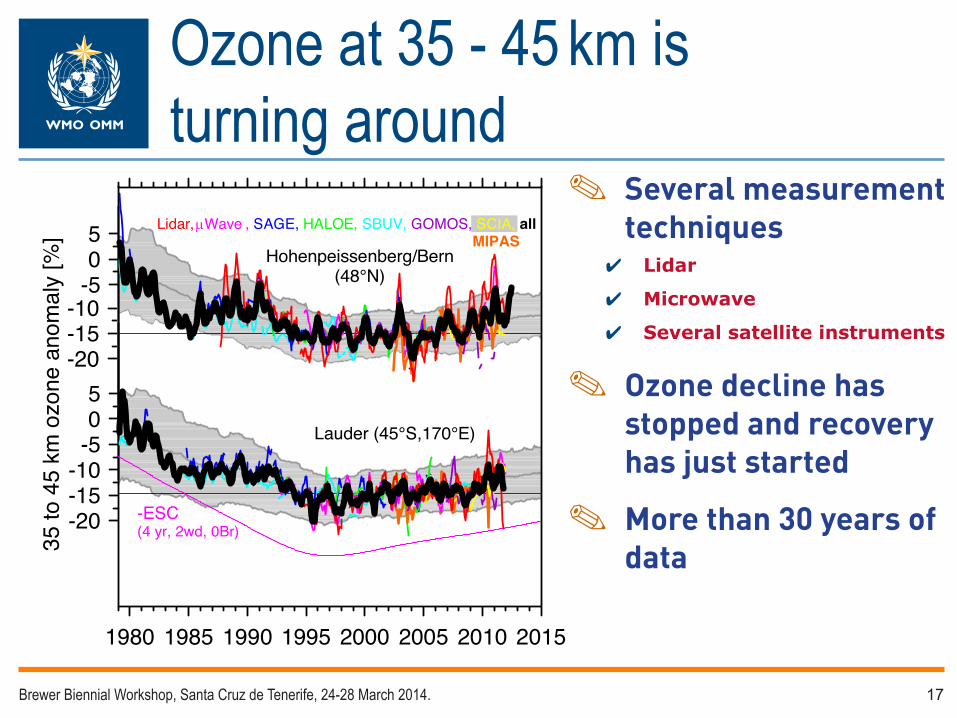
Lidar, µWave , SAGE, HALOE, SBUV, GOMOS, SCIA, allMIPAS
Hohenpeissenberg/Bern(48°N)
Lauder (45°S,170°E)
-ESC(4 yr, 2wd, 0Br)
-20-15-10
Ozone at 35 - 45 km is turning around
�� Several measurement techniques✔✔ Lidar
✔✔ Microwave
✔✔ Several satellite instruments
�� Ozone decline has stopped and recovery has just started
�� More than 30 years of data
Brewer Biennial Workshop, Santa Cruz de Tenerife, 24-28 March 2014. 18
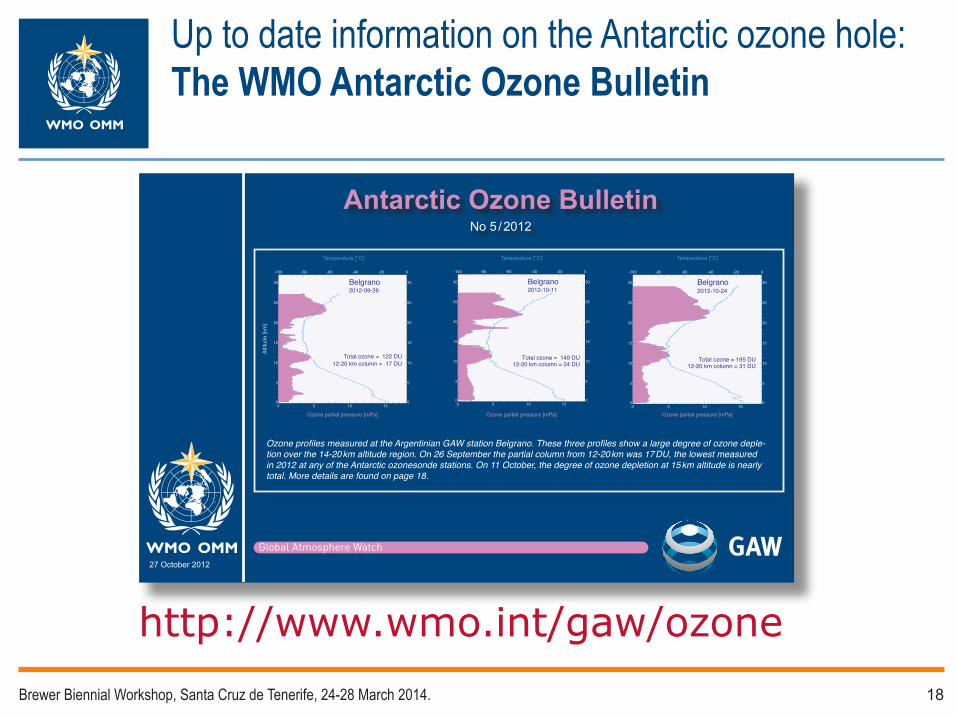
Up to date information on the Antarctic ozone hole: The WMO Antarctic Ozone Bulletin
27 October 2012
Antarctic Ozone BulletinNo 5 / 2012
Global Atmosphere Watch
Alti
tude
[km
]
Ozone partial pressure [mPa]
Temperature [°C]
Ozone partial pressure [mPa] Ozone partial pressure [mPa]
Temperature [°C] Temperature [°C]
0 5 10 150
5
10
15
20
25
30
0
5
10
15
20
25
30
-100 -80 -60 -40 -20 0
Belgrano2012-10-24
Total ozone = 195 DU12-20 km column = 31 DU
0 5 10 150
5
10
15
20
25
30
0
5
10
15
20
25
30
-100 -80 -60 -40 -20 0
Belgrano2012-09-26
Total ozone = 122 DU12-20 km column = 17 DU
0 5 10 150
5
10
15
20
25
30
0
5
10
15
20
25
30
-100 -80 -60 -40 -20 0
Belgrano2012-10-11
Total ozone = 149 DU12-20 km column = 24 DU
Ozone profiles measured at the Argentinian GAW station Belgrano. These three profiles show a large degree of ozone deple-tion over the 14-20 km altitude region. On 26 September the partial column from 12-20 km was 17 DU, the lowest measured in 2012 at any of the Antarctic ozonesonde stations. On 11 October, the degree of ozone depletion at 15 km altitude is nearly total. More details are found on page 18.
http://www.wmo.int/gaw/ozone
Brewer Biennial Workshop, Santa Cruz de Tenerife, 24-28 March 2014. 19
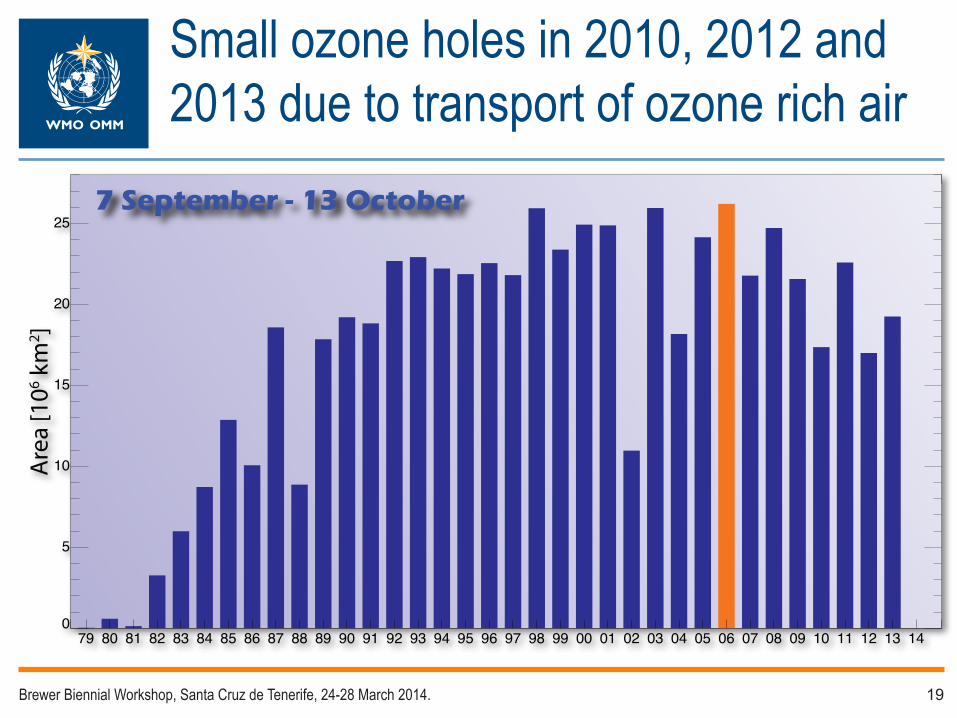
7 September - 13 October
Are
a [1
06 km
2 ]
0
5
10
15
20
25
79 80 81 82 83 84 85 86 87 88 89 90 91 92 93 94 95 96 97 98 99 00 01 02 03 04 05 06 07 08 09 10 11 12 13 14
Small ozone holes in 2010, 2012 and 2013 due to transport of ozone rich air
Brewer Biennial Workshop, Santa Cruz de Tenerife, 24-28 March 2014. 20
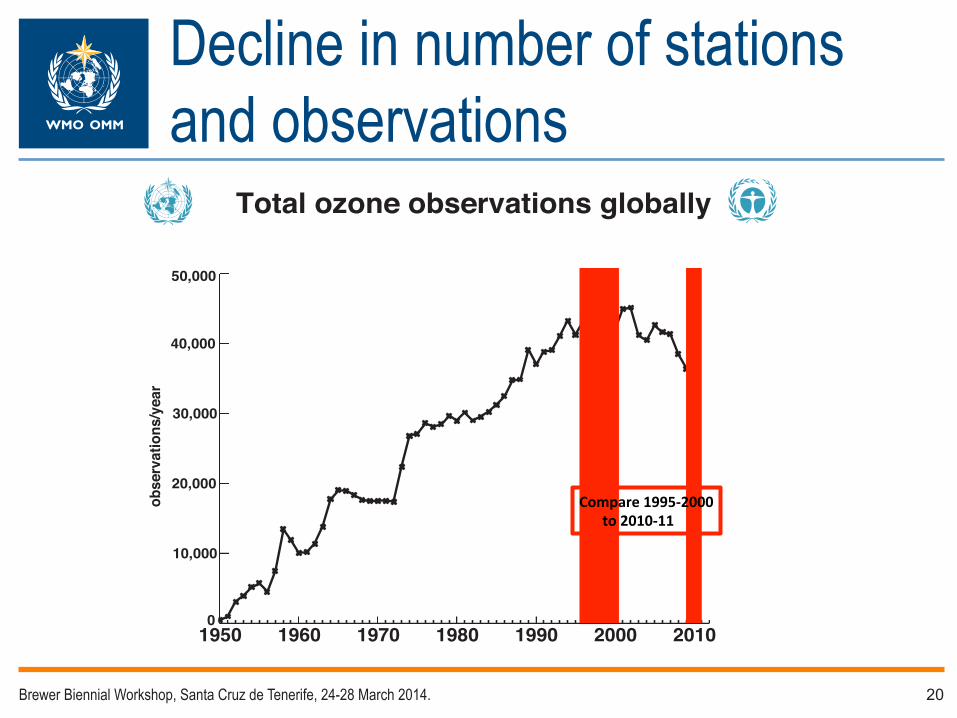
Decline in number of stations and observations
0
50,000
40,000
obse
rvat
ions
/yea
r
30,000
20,000
10,000
Total ozone observations globally
1950 1960 1970 1980 1990 2000 2010
Compare 1995-2000to 2010-11
Brewer Biennial Workshop, Santa Cruz de Tenerife, 24-28 March 2014. 21
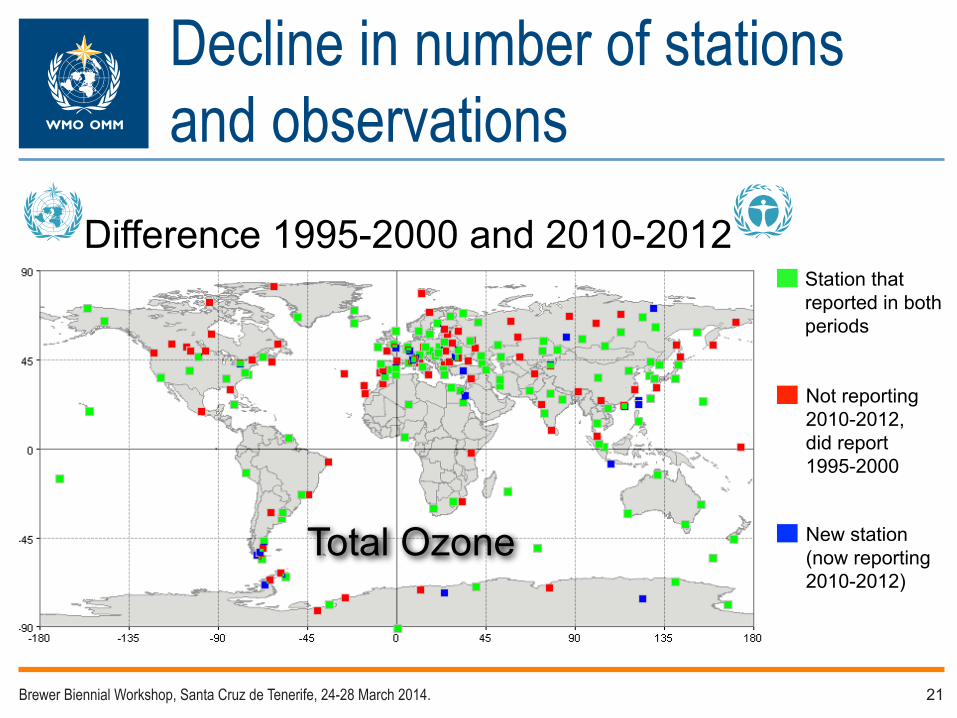
Decline in number of stations and observations
Difference 1995-2000 and 2010-2012 Station that reported in both periods
Not reporting 2010-2012, did report 1995-2000
New station (now reporting 2010-2012)
Total Ozone
Brewer Biennial Workshop, Santa Cruz de Tenerife, 24-28 March 2014. 22
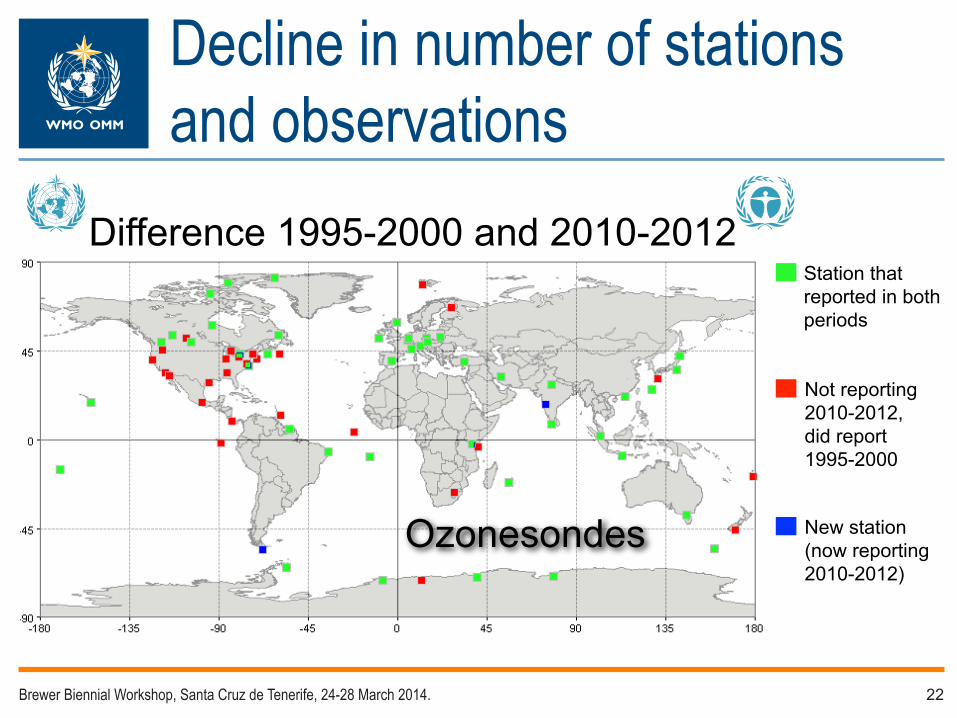
Decline in number of stations and observations
Difference 1995-2000 and 2010-2012 Station that reported in both periods
Not reporting 2010-2012, did report 1995-2000
New station (now reporting 2010-2012)
Ozonesondes
Brewer Biennial Workshop, Santa Cruz de Tenerife, 24-28 March 2014. 23
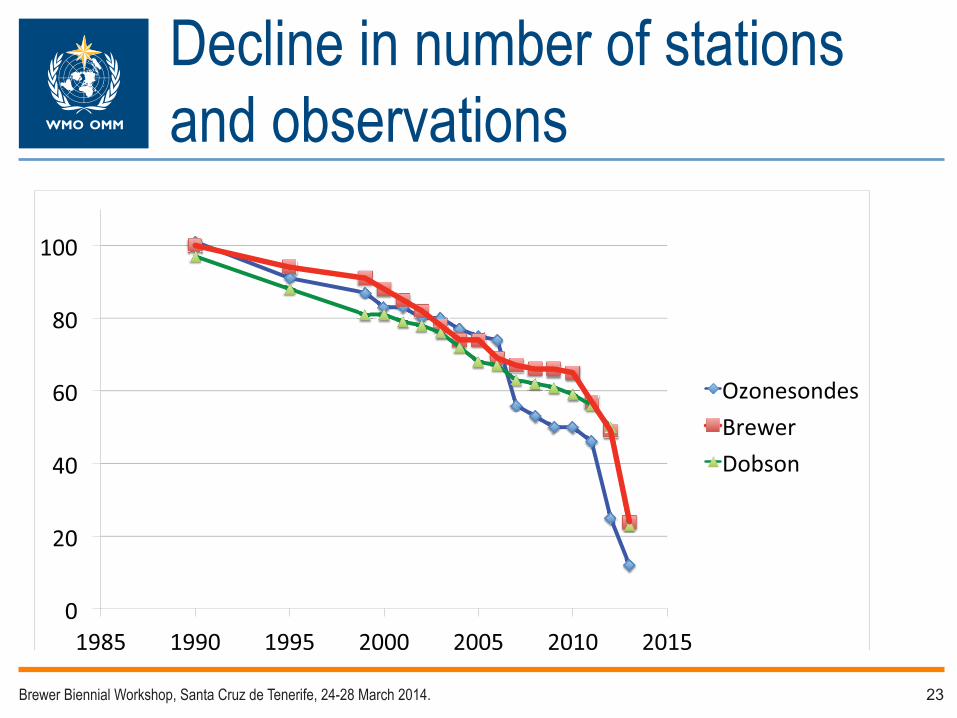
Decline in number of stations and observations

Brewer Biennial Workshop, Santa Cruz de Tenerife, 24-28 March 2014. 24
�� Example:✔✔ Lidar stations are far
apart
✔✔ Loss of such stations will be detrimental to our understanding of changes in the atmosphere
Especially important to protect remote stations
8000 km
9700 km
3700 km
3000 km
Brewer Biennial Workshop, Santa Cruz de Tenerife, 24-28 March 2014. 25
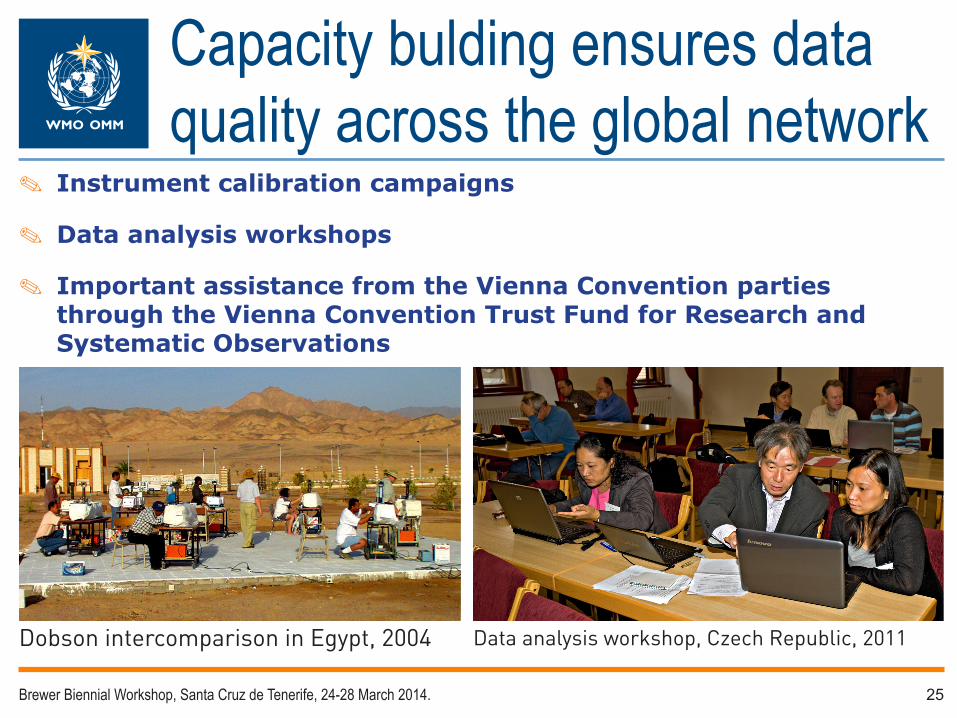
Capacity bulding ensures data quality across the global network
✔� Instrument calibration campaigns
✔� Data analysis workshops
✔� Important assistance from the Vienna Convention parties through the Vienna Convention Trust Fund for Research and Systematic Observations
Dobson intercomparison in Egypt, 2004 Data analysis workshop, Czech Republic, 2011
Brewer Biennial Workshop, Santa Cruz de Tenerife, 24-28 March 2014. 26
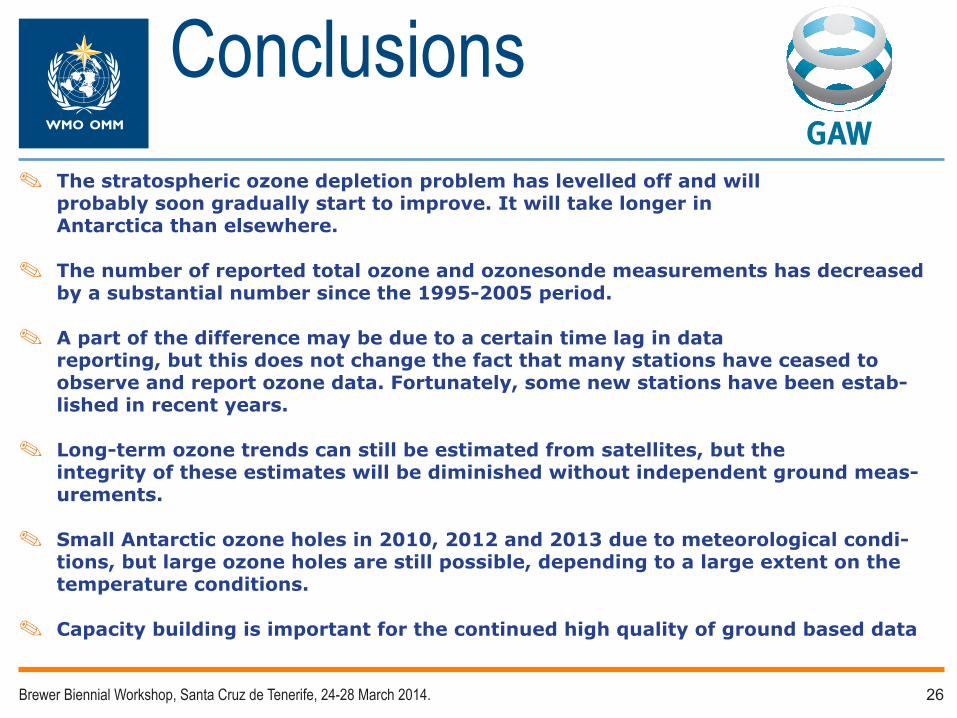
Conclusions✔� The stratospheric ozone depletion problem has levelled off and will
probably soon gradually start to improve. It will take longer in Antarctica than elsewhere.
✔� The number of reported total ozone and ozonesonde measurements has decreased by a substantial number since the 1995-2005 period.
✔� A part of the difference may be due to a certain time lag in data reporting, but this does not change the fact that many stations have ceased to observe and report ozone data. Fortunately, some new stations have been estab-lished in recent years.
✔� Long-term ozone trends can still be estimated from satellites, but the integrity of these estimates will be diminished without independent ground meas-urements.
✔� Small Antarctic ozone holes in 2010, 2012 and 2013 due to meteorological condi-tions, but large ozone holes are still possible, depending to a large extent on the temperature conditions.
✔� Capacity building is important for the continued high quality of ground based data
World Meteorological Organization Working together in weather, climate and water
Geir O. Braathen, WMO, Research Department
Thank you for your attention!
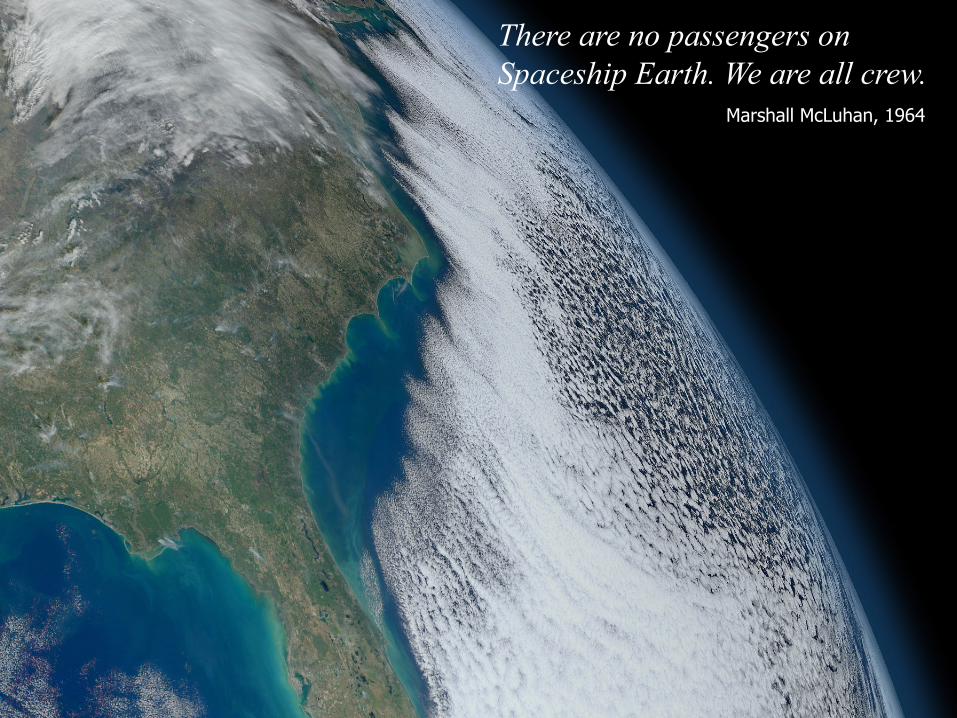
There are no passengers on Spaceship Earth. We are all crew.
Marshall McLuhan, 1964