oxford economics global data servicesservices.oxfordeconomics.com/docs/databank user...
TRANSCRIPT

Oxford Economics Global Data Services
User Guide
An introduction to Oxford Economics Global Data Services
User Guide v2.4 9 August 2013
Oxford Economics Global Data Services User Guide
Page 1
Prerequisites
The latest version of either Google Chrome, Firefox, Safari, and Internet Explorer (IE7+)
We recommend using Internet Explorer with the Google Chrome plug-in
We recommend a minimum screen resolution of 1024 x 768
An active internet connection
If you use IE and do not have Chrome Frame installed, you will be prompted to install it when you
access the Oxford Economics Global Data Services. In order to see the prompt, you must turn off any
popup blockers you may have installed or opt to allow popups for the website.
Oxford Economics Global Data Services will not function correctly in IE version 6 or lower unless
you install Chrome Frame.
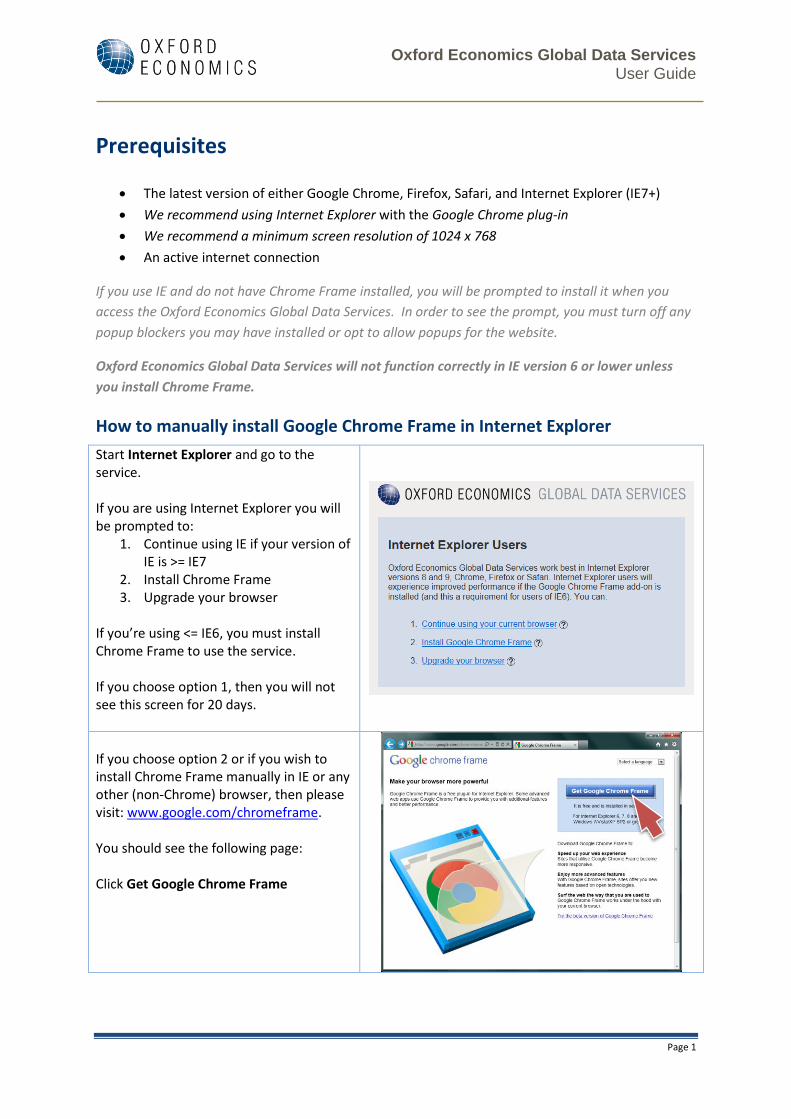
How to manually install Google Chrome Frame in Internet Explorer
Start Internet Explorer and go to the service. If you are using Internet Explorer you will be prompted to:
1. Continue using IE if your version of IE is >= IE7
2. Install Chrome Frame 3. Upgrade your browser
If you’re using <= IE6, you must install Chrome Frame to use the service. If you choose option 1, then you will not see this screen for 20 days.
If you choose option 2 or if you wish to install Chrome Frame manually in IE or any other (non-Chrome) browser, then please visit: www.google.com/chromeframe. You should see the following page: Click Get Google Chrome Frame
Oxford Economics Global Data Services User Guide
Page 2
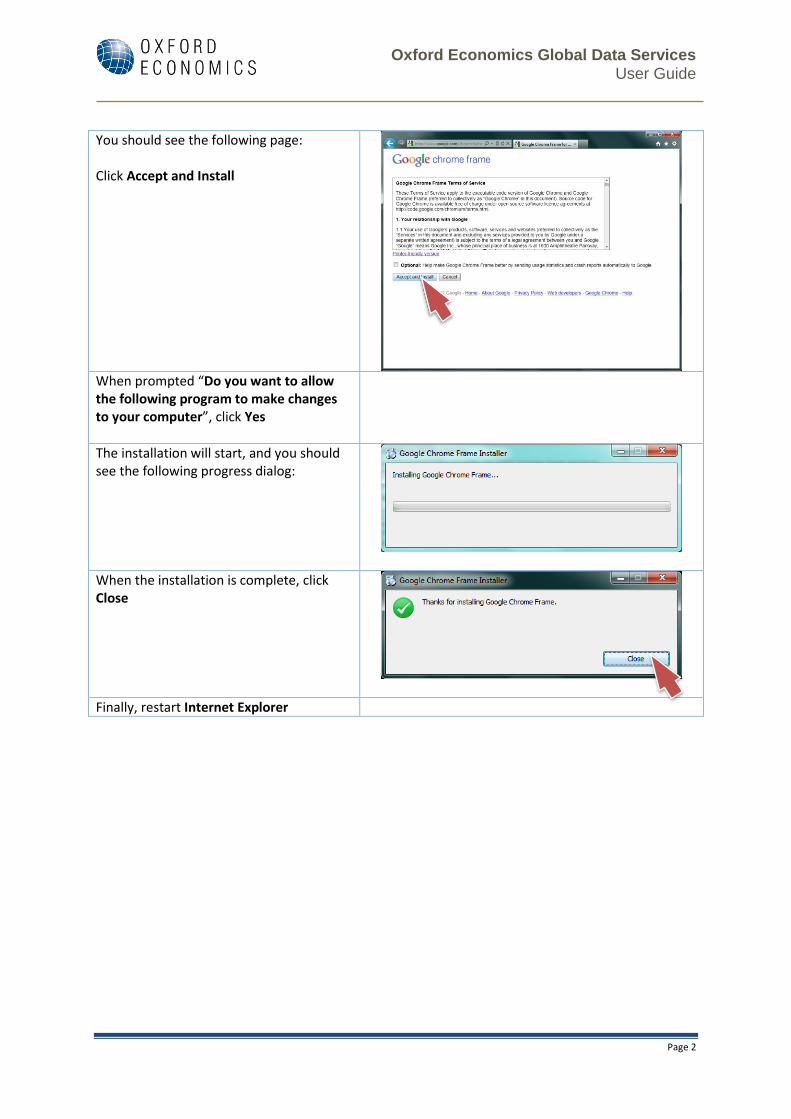
You should see the following page: Click Accept and Install
When prompted “Do you want to allow the following program to make changes to your computer”, click Yes
The installation will start, and you should see the following progress dialog:
When the installation is complete, click Close
Finally, restart Internet Explorer
Oxford Economics Global Data Services User Guide
Page 3
Introduction
The Oxford Economics Global Data Service platform covers 190 countries, 100 industries and over
2,600 cities and sub-regions. There are currently 12 separate databanks, with the intention to add
more over time.
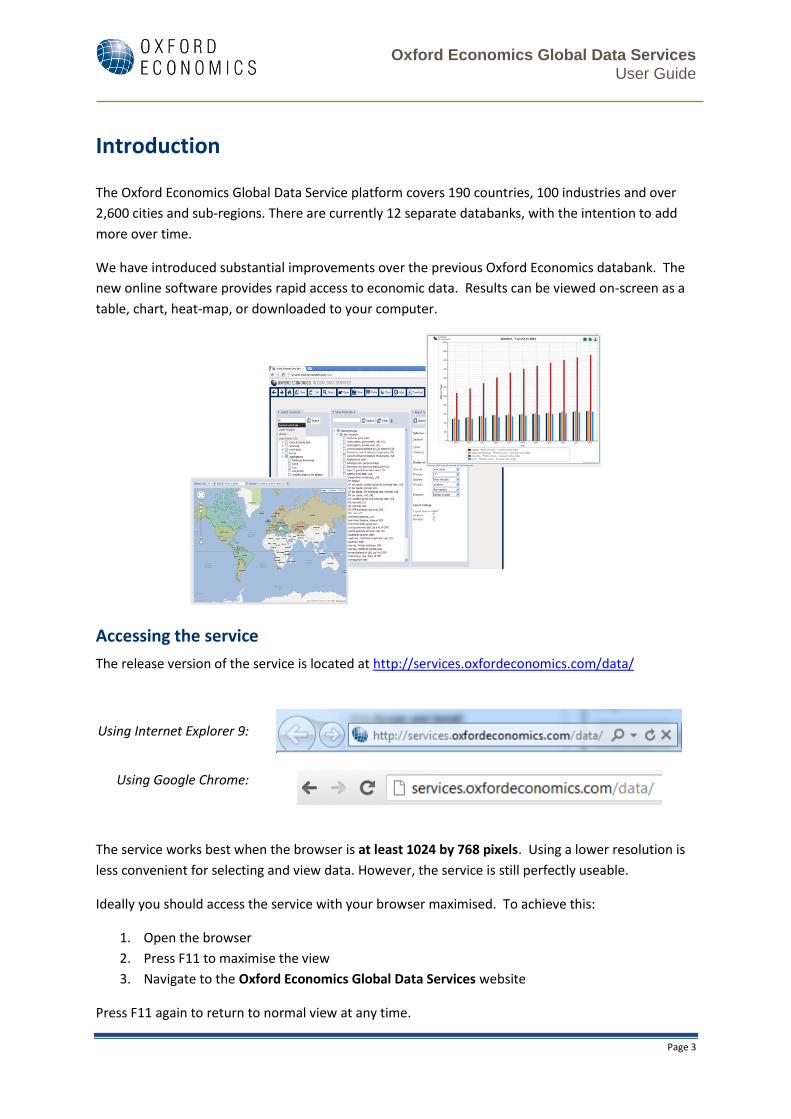
We have introduced substantial improvements over the previous Oxford Economics databank. The
new online software provides rapid access to economic data. Results can be viewed on-screen as a
table, chart, heat-map, or downloaded to your computer.
Accessing the service
The release version of the service is located at http://services.oxfordeconomics.com/data/
Using Internet Explorer 9:
Using Google Chrome:
The service works best when the browser is at least 1024 by 768 pixels. Using a lower resolution is
less convenient for selecting and view data. However, the service is still perfectly useable.
Ideally you should access the service with your browser maximised. To achieve this:
1. Open the browser
2. Press F11 to maximise the view
3. Navigate to the Oxford Economics Global Data Services website
Press F11 again to return to normal view at any time.
Oxford Economics Global Data Services User Guide
Page 4
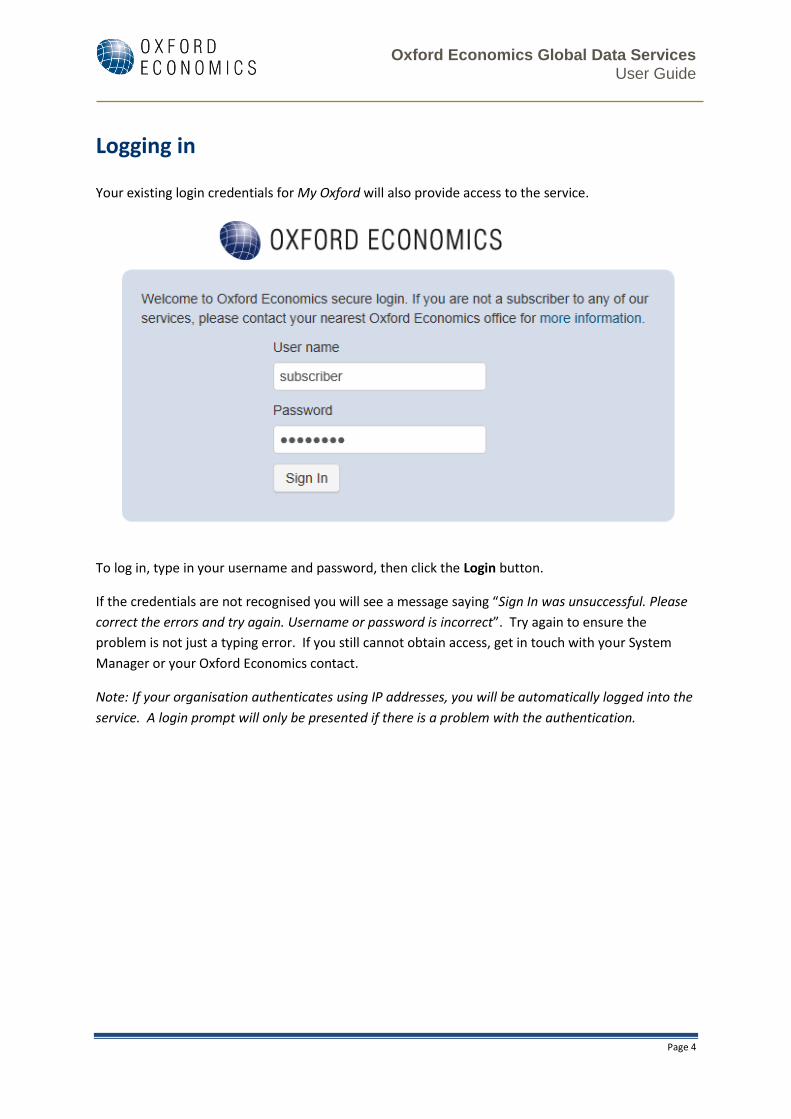
Logging in
Your existing login credentials for My Oxford will also provide access to the service.
To log in, type in your username and password, then click the Login button.
If the credentials are not recognised you will see a message saying “Sign In was unsuccessful. Please
correct the errors and try again. Username or password is incorrect”. Try again to ensure the
problem is not just a typing error. If you still cannot obtain access, get in touch with your System
Manager or your Oxford Economics contact.
Note: If your organisation authenticates using IP addresses, you will be automatically logged into the
service. A login prompt will only be presented if there is a problem with the authentication.
Oxford Economics Global Data Services User Guide
Page 5
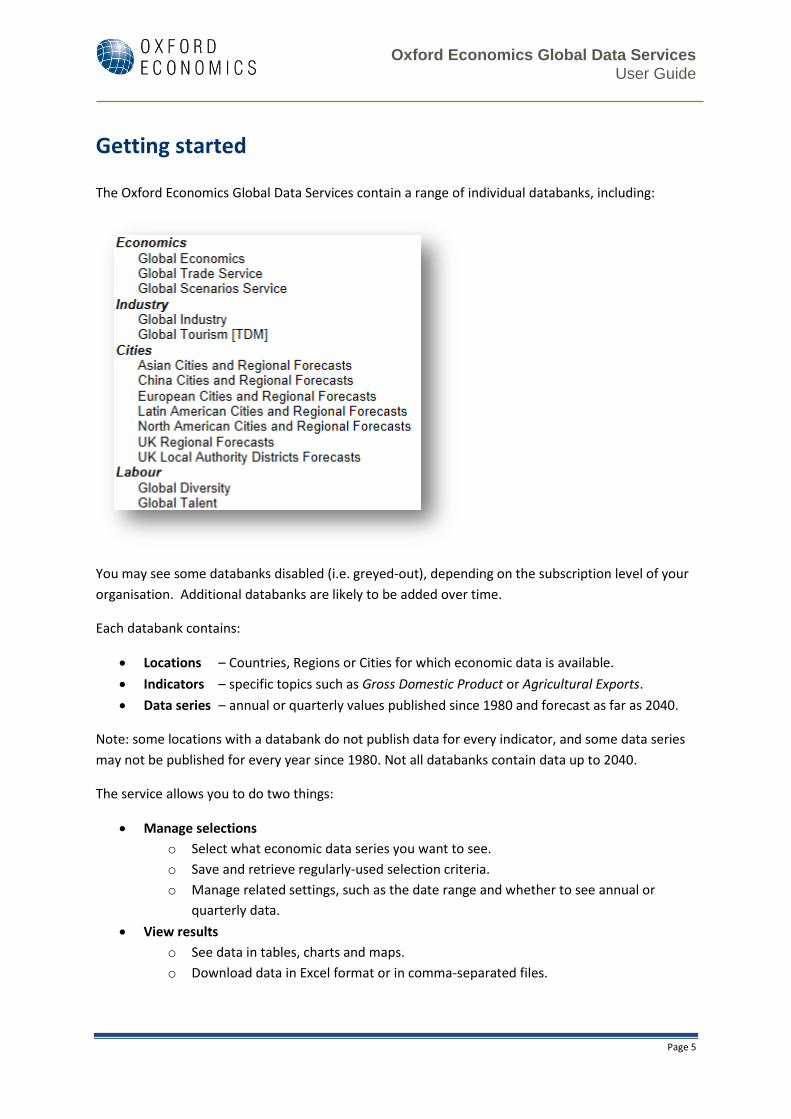
Getting started
The Oxford Economics Global Data Services contain a range of individual databanks, including:
You may see some databanks disabled (i.e. greyed-out), depending on the subscription level of your
organisation. Additional databanks are likely to be added over time.
Each databank contains:
Locations – Countries, Regions or Cities for which economic data is available.
Indicators – specific topics such as Gross Domestic Product or Agricultural Exports.
Data series – annual or quarterly values published since 1980 and forecast as far as 2040.
Note: some locations with a databank do not publish data for every indicator, and some data series
may not be published for every year since 1980. Not all databanks contain data up to 2040.
The service allows you to do two things:
Manage selections
o Select what economic data series you want to see.
o Save and retrieve regularly-used selection criteria.
o Manage related settings, such as the date range and whether to see annual or
quarterly data.
View results
o See data in tables, charts and maps.
o Download data in Excel format or in comma-separated files.
Oxford Economics Global Data Services User Guide
Page 6
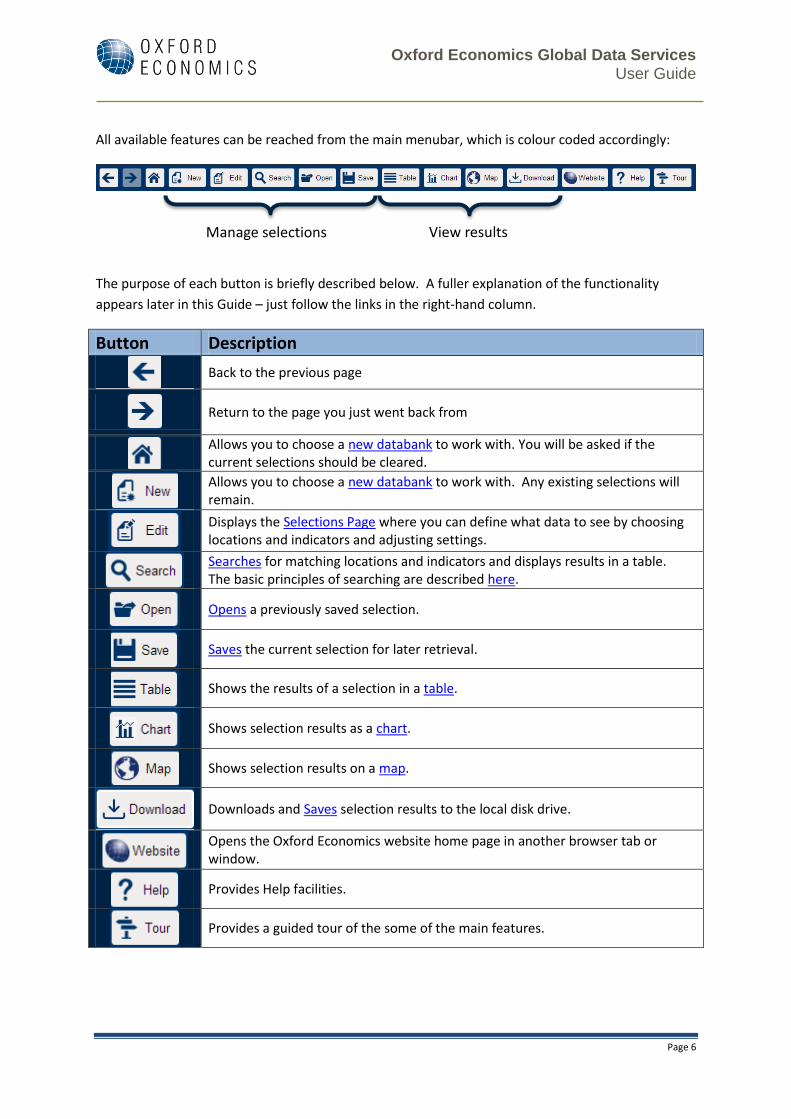
Manage selections View results
All available features can be reached from the main menubar, which is colour coded accordingly:
The purpose of each button is briefly described below. A fuller explanation of the functionality
appears later in this Guide – just follow the links in the right-hand column.
Button Description
Back to the previous page
Return to the page you just went back from
Allows you to choose a new databank to work with. You will be asked if the current selections should be cleared.
Allows you to choose a new databank to work with. Any existing selections will remain.
Displays the Selections Page where you can define what data to see by choosing locations and indicators and adjusting settings.
Searches for matching locations and indicators and displays results in a table. The basic principles of searching are described here.
Opens a previously saved selection.
Saves the current selection for later retrieval.
Shows the results of a selection in a table.
Shows selection results as a chart.
Shows selection results on a map.
Downloads and Saves selection results to the local disk drive.
Opens the Oxford Economics website home page in another browser tab or window.
Provides Help facilities.
Provides a guided tour of the some of the main features.
Oxford Economics Global Data Services User Guide
Page 7
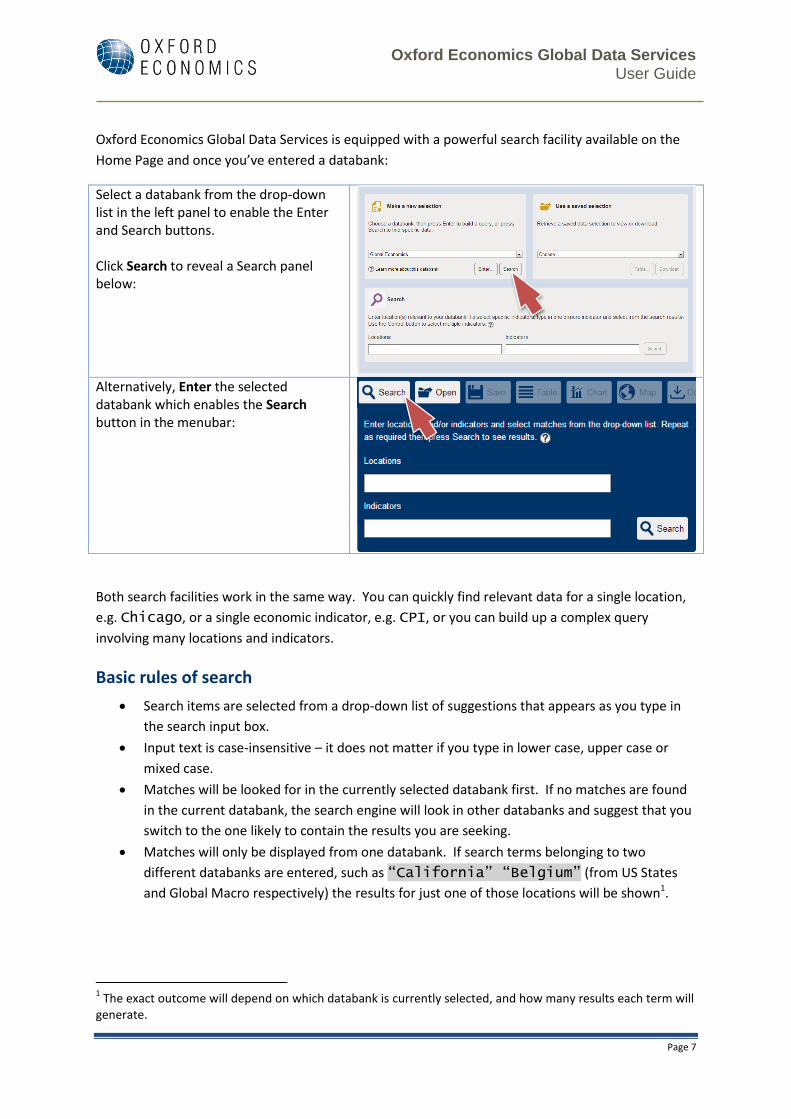
Oxford Economics Global Data Services is equipped with a powerful search facility available on the
Home Page and once you’ve entered a databank:
Select a databank from the drop-down list in the left panel to enable the Enter and Search buttons. Click Search to reveal a Search panel below:
Alternatively, Enter the selected databank which enables the Search button in the menubar:
Both search facilities work in the same way. You can quickly find relevant data for a single location,
e.g. Chicago, or a single economic indicator, e.g. CPI, or you can build up a complex query
involving many locations and indicators.
Basic rules of search
Search items are selected from a drop-down list of suggestions that appears as you type in
the search input box.
Input text is case-insensitive – it does not matter if you type in lower case, upper case or
mixed case.
Matches will be looked for in the currently selected databank first. If no matches are found
in the current databank, the search engine will look in other databanks and suggest that you
switch to the one likely to contain the results you are seeking.
Matches will only be displayed from one databank. If search terms belonging to two
different databanks are entered, such as “California” “Belgium” (from US States
and Global Macro respectively) the results for just one of those locations will be shown1.
1 The exact outcome will depend on which databank is currently selected, and how many results each term will
generate.
Oxford Economics Global Data Services User Guide
Page 8
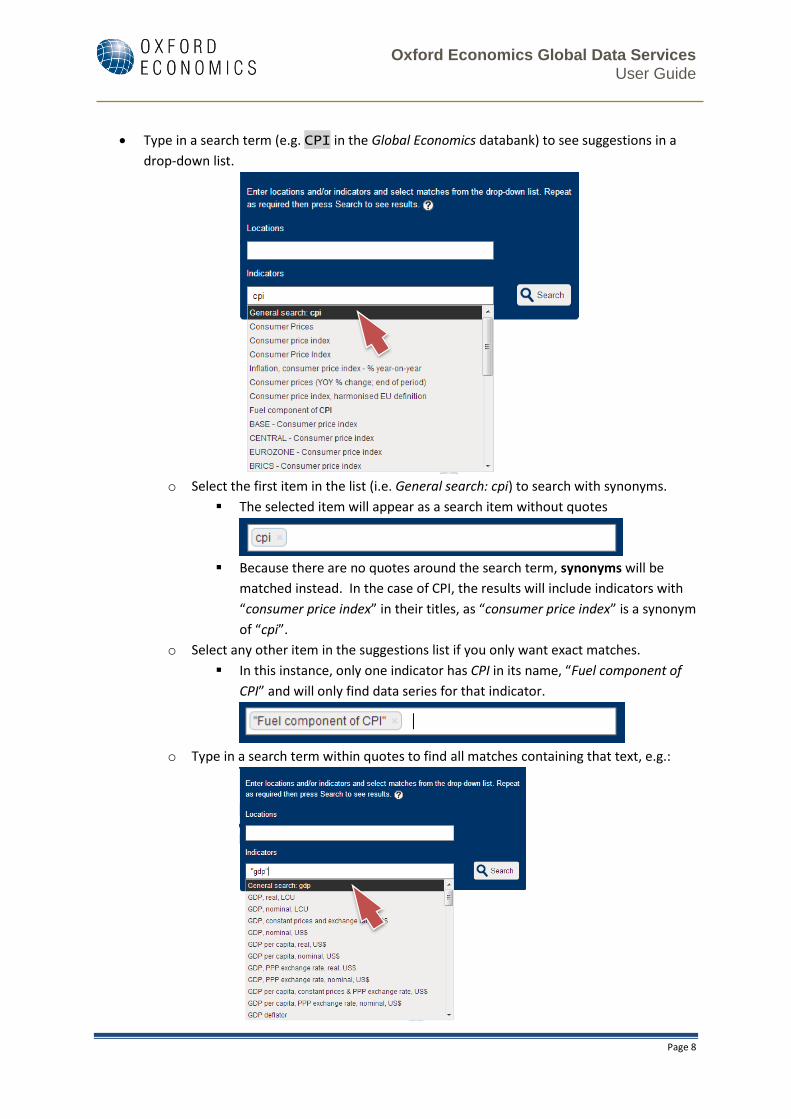
Type in a search term (e.g. CPI in the Global Economics databank) to see suggestions in a
drop-down list.
o Select the first item in the list (i.e. General search: cpi) to search with synonyms.
The selected item will appear as a search item without quotes
Because there are no quotes around the search term, synonyms will be
matched instead. In the case of CPI, the results will include indicators with
“consumer price index” in their titles, as “consumer price index” is a synonym
of “cpi”.
o Select any other item in the suggestions list if you only want exact matches.
In this instance, only one indicator has CPI in its name, “Fuel component of
CPI” and will only find data series for that indicator.
o Type in a search term within quotes to find all matches containing that text, e.g.:
Oxford Economics Global Data Services User Guide
Page 9
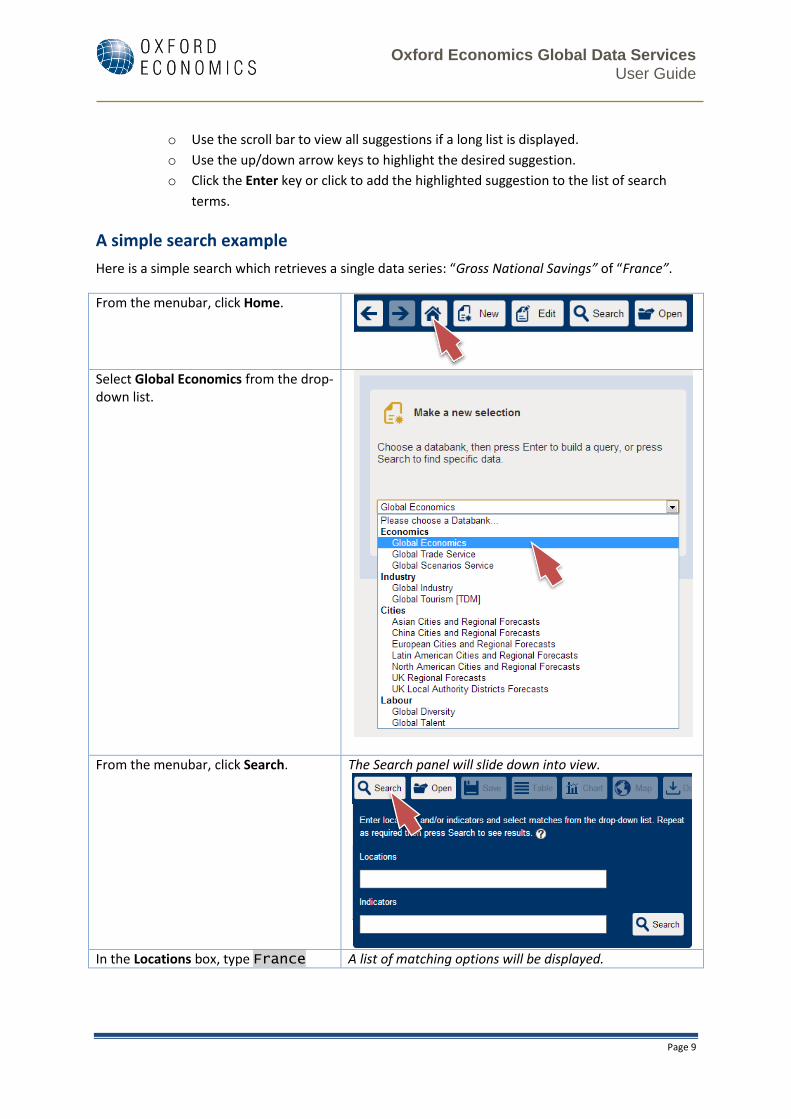
o Use the scroll bar to view all suggestions if a long list is displayed.
o Use the up/down arrow keys to highlight the desired suggestion.
o Click the Enter key or click to add the highlighted suggestion to the list of search
terms.
A simple search example
Here is a simple search which retrieves a single data series: “Gross National Savings” of “France”.
From the menubar, click Home.
Select Global Economics from the drop-down list.
From the menubar, click Search.
The Search panel will slide down into view.
In the Locations box, type France A list of matching options will be displayed.
Oxford Economics Global Data Services User Guide
Page 10
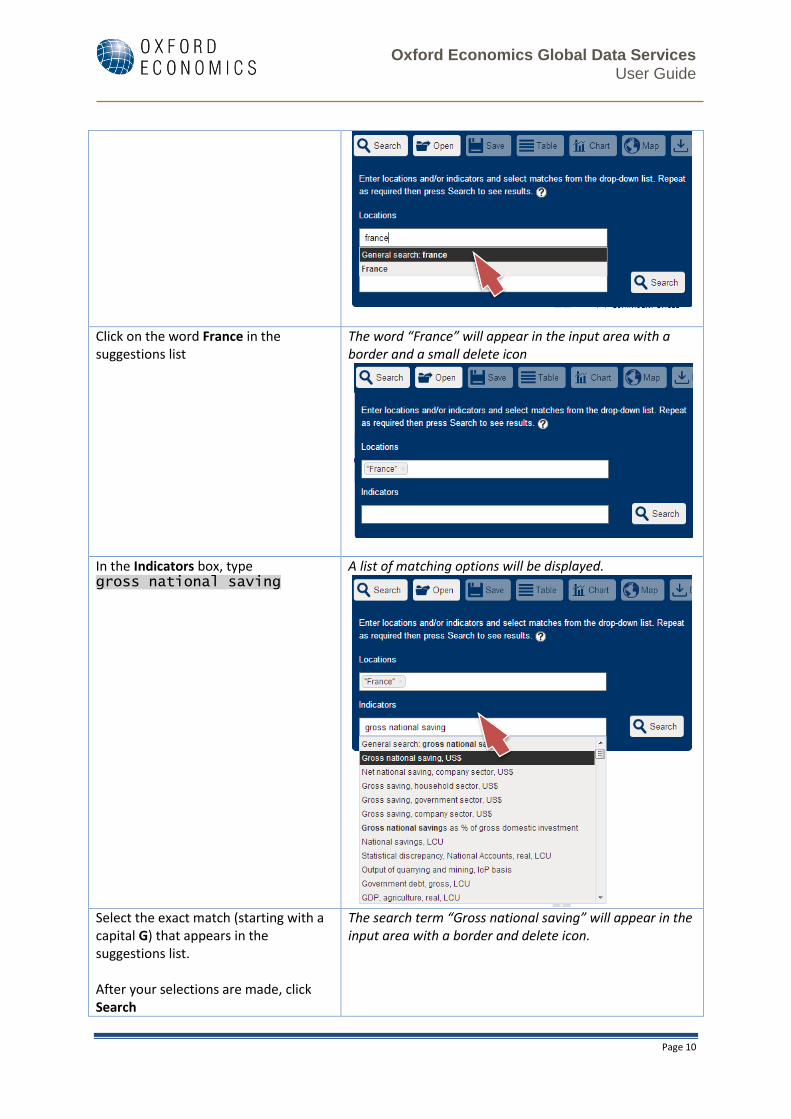
Click on the word France in the suggestions list
The word “France” will appear in the input area with a border and a small delete icon
In the Indicators box, type gross national saving
A list of matching options will be displayed.
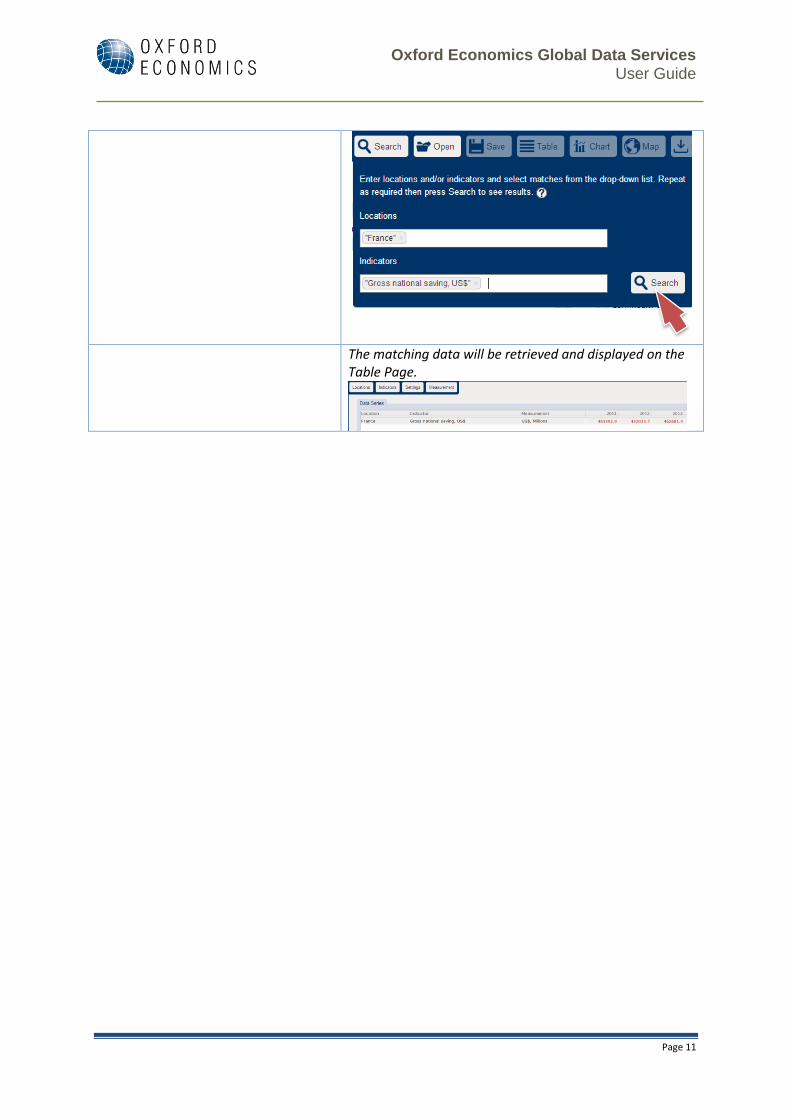
Select the exact match (starting with a capital G) that appears in the suggestions list. After your selections are made, click Search
The search term “Gross national saving” will appear in the input area with a border and delete icon.
Oxford Economics Global Data Services User Guide
Page 11
The matching data will be retrieved and displayed on the Table Page.
Oxford Economics Global Data Services User Guide
Page 12
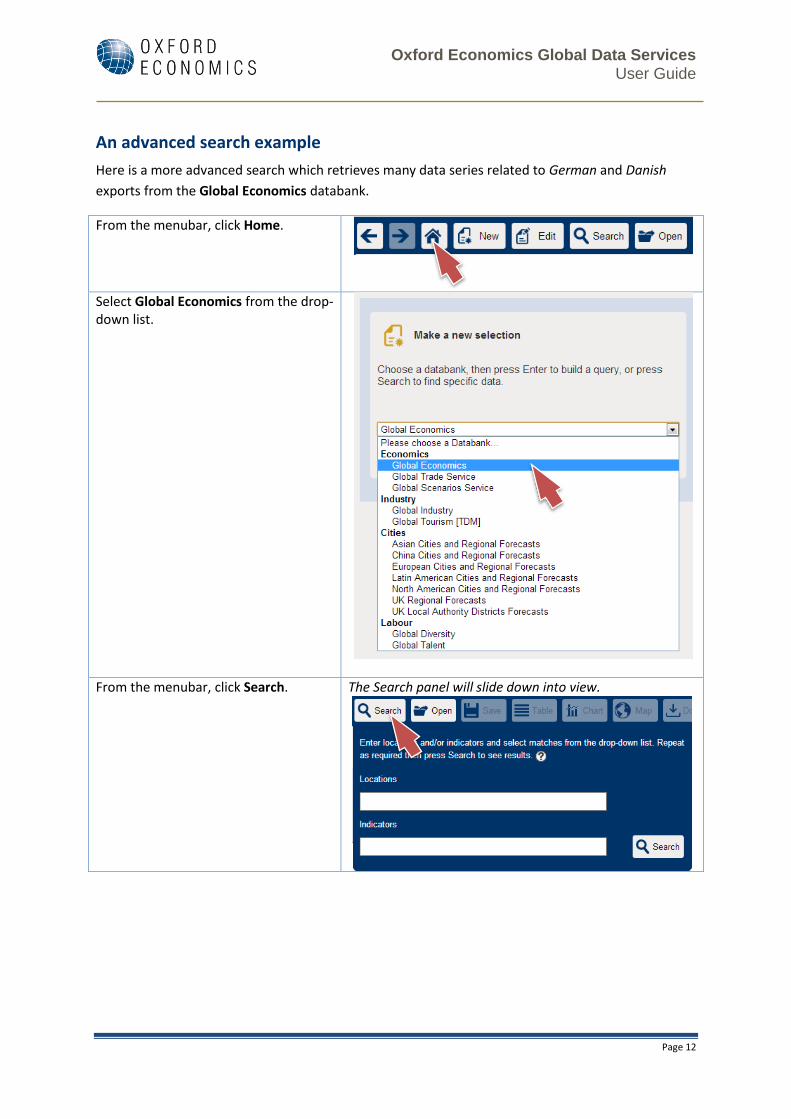
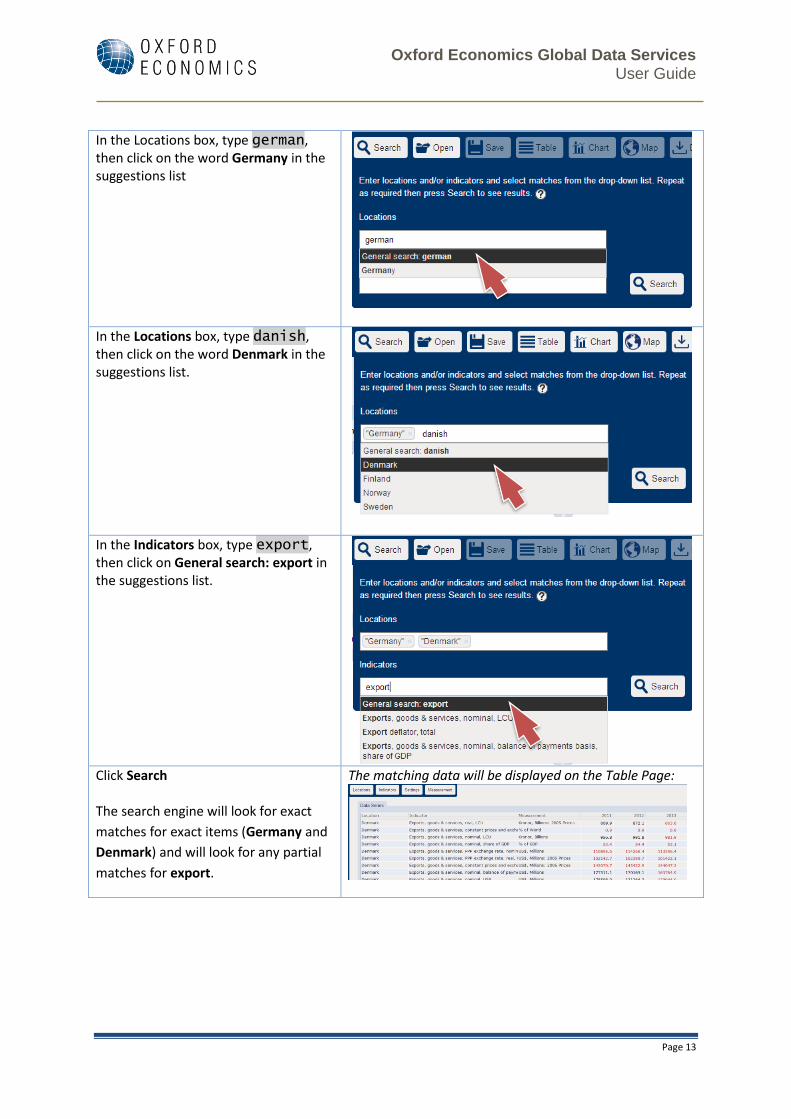
An advanced search example
Here is a more advanced search which retrieves many data series related to German and Danish
exports from the Global Economics databank.
From the menubar, click Home.
Select Global Economics from the drop-down list.
From the menubar, click Search.
The Search panel will slide down into view.
Oxford Economics Global Data Services User Guide
Page 13
In the Locations box, type german, then click on the word Germany in the suggestions list
In the Locations box, type danish, then click on the word Denmark in the suggestions list.
In the Indicators box, type export, then click on General search: export in the suggestions list.
Click Search The search engine will look for exact
matches for exact items (Germany and
Denmark) and will look for any partial
matches for export.
The matching data will be displayed on the Table Page:
Oxford Economics Global Data Services User Guide
Page 14
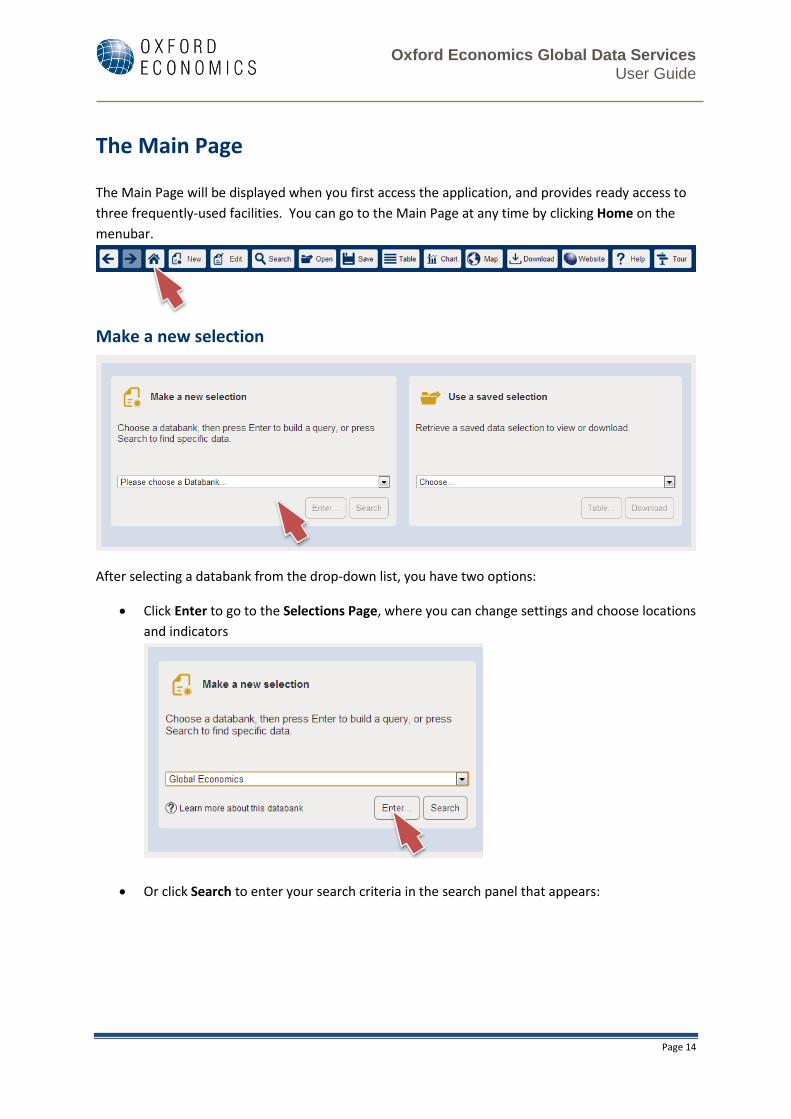
The Main Page
The Main Page will be displayed when you first access the application, and provides ready access to
three frequently-used facilities. You can go to the Main Page at any time by clicking Home on the
menubar.
Make a new selection
After selecting a databank from the drop-down list, you have two options:
Click Enter to go to the Selections Page, where you can change settings and choose locations
and indicators
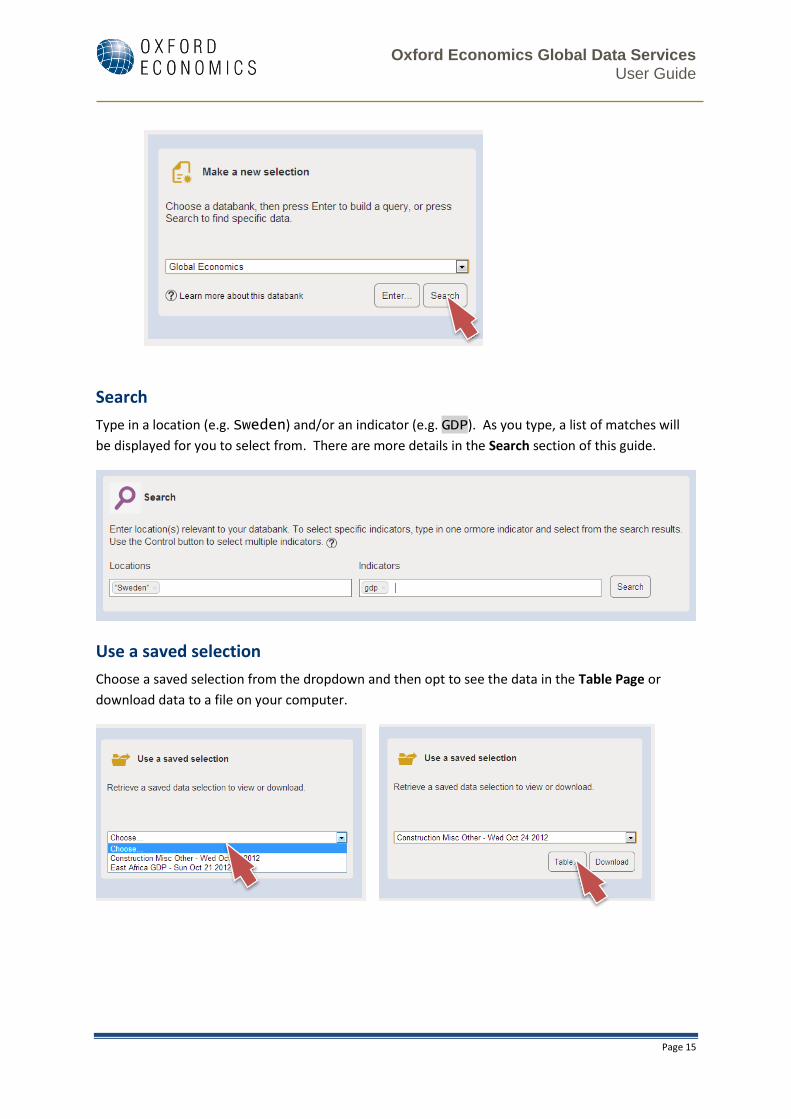
Or click Search to enter your search criteria in the search panel that appears:
Oxford Economics Global Data Services User Guide
Page 15
Search
Type in a location (e.g. Sweden) and/or an indicator (e.g. GDP). As you type, a list of matches will
be displayed for you to select from. There are more details in the Search section of this guide.
Use a saved selection
Choose a saved selection from the dropdown and then opt to see the data in the Table Page or
download data to a file on your computer.
Oxford Economics Global Data Services User Guide
Page 16
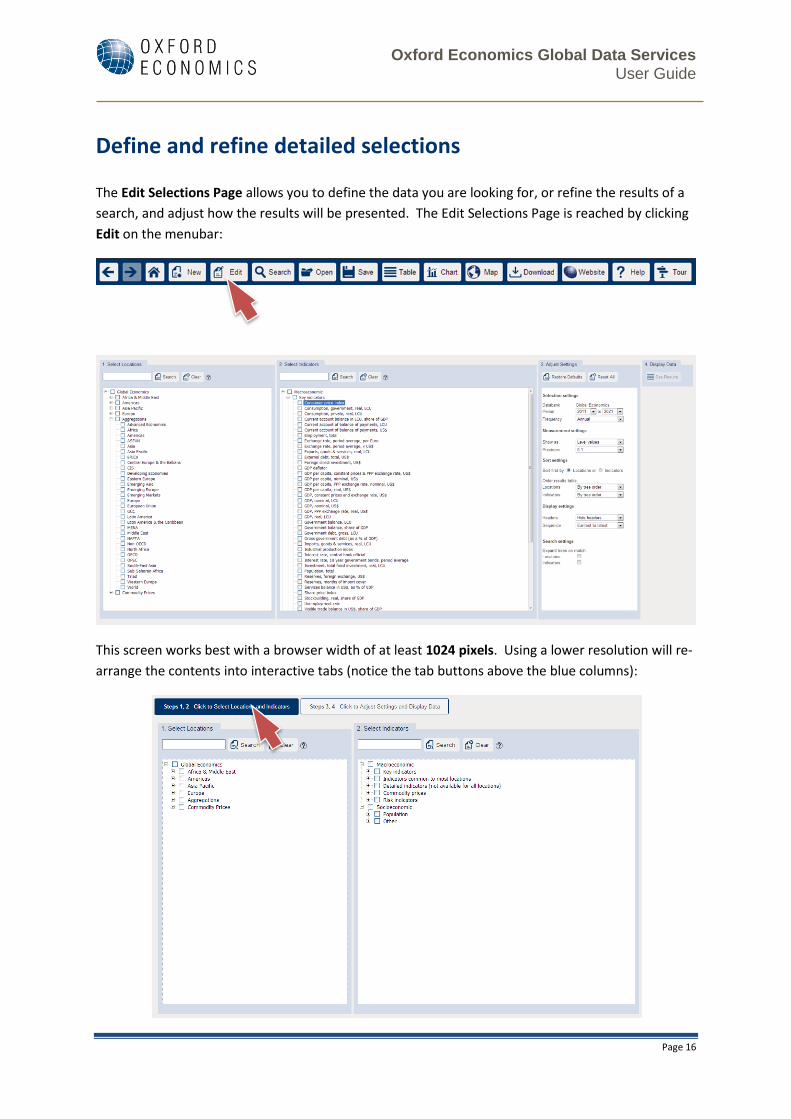
Define and refine detailed selections
The Edit Selections Page allows you to define the data you are looking for, or refine the results of a
search, and adjust how the results will be presented. The Edit Selections Page is reached by clicking
Edit on the menubar:
This screen works best with a browser width of at least 1024 pixels. Using a lower resolution will re-
arrange the contents into interactive tabs (notice the tab buttons above the blue columns):
Oxford Economics Global Data Services User Guide
Page 17
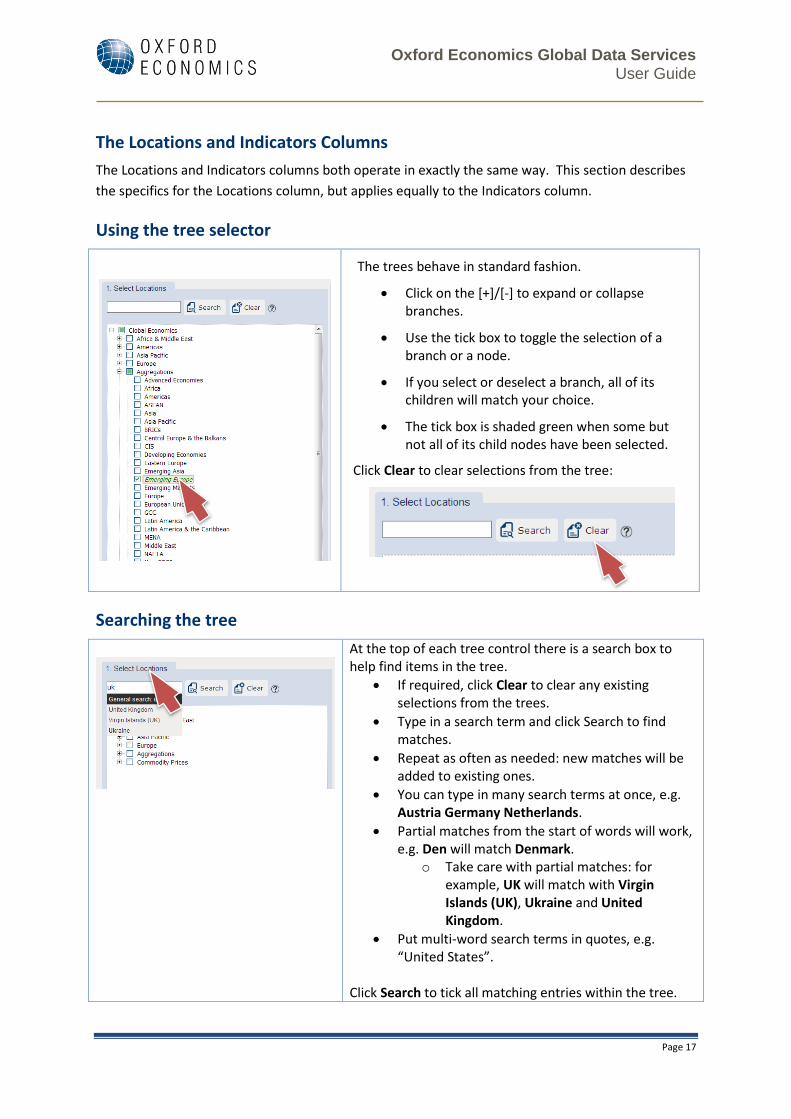
The Locations and Indicators Columns
The Locations and Indicators columns both operate in exactly the same way. This section describes
the specifics for the Locations column, but applies equally to the Indicators column.
Using the tree selector
The trees behave in standard fashion.
Click on the [+]/[-] to expand or collapse branches.
Use the tick box to toggle the selection of a branch or a node.
If you select or deselect a branch, all of its children will match your choice.
The tick box is shaded green when some but not all of its child nodes have been selected.
Click Clear to clear selections from the tree:
Searching the tree
At the top of each tree control there is a search box to help find items in the tree.
If required, click Clear to clear any existing selections from the trees.
Type in a search term and click Search to find matches.
Repeat as often as needed: new matches will be added to existing ones.
You can type in many search terms at once, e.g. Austria Germany Netherlands.
Partial matches from the start of words will work, e.g. Den will match Denmark.
o Take care with partial matches: for example, UK will match with Virgin Islands (UK), Ukraine and United Kingdom.
Put multi-word search terms in quotes, e.g. “United States”.
Click Search to tick all matching entries within the tree.
Oxford Economics Global Data Services User Guide
Page 18
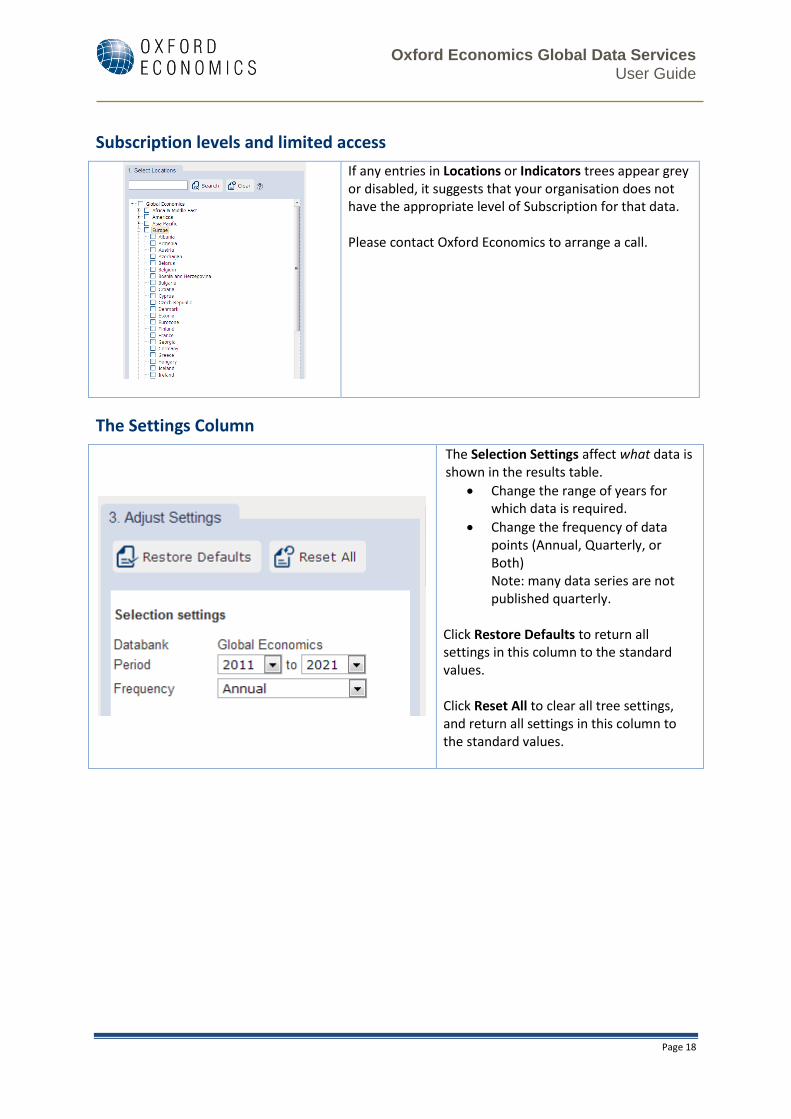
Subscription levels and limited access
If any entries in Locations or Indicators trees appear grey or disabled, it suggests that your organisation does not have the appropriate level of Subscription for that data. Please contact Oxford Economics to arrange a call.
The Settings Column
The Selection Settings affect what data is shown in the results table.
Change the range of years for which data is required.
Change the frequency of data points (Annual, Quarterly, or Both) Note: many data series are not published quarterly.
Click Restore Defaults to return all settings in this column to the standard values. Click Reset All to clear all tree settings, and return all settings in this column to the standard values.
Oxford Economics Global Data Services User Guide
Page 19
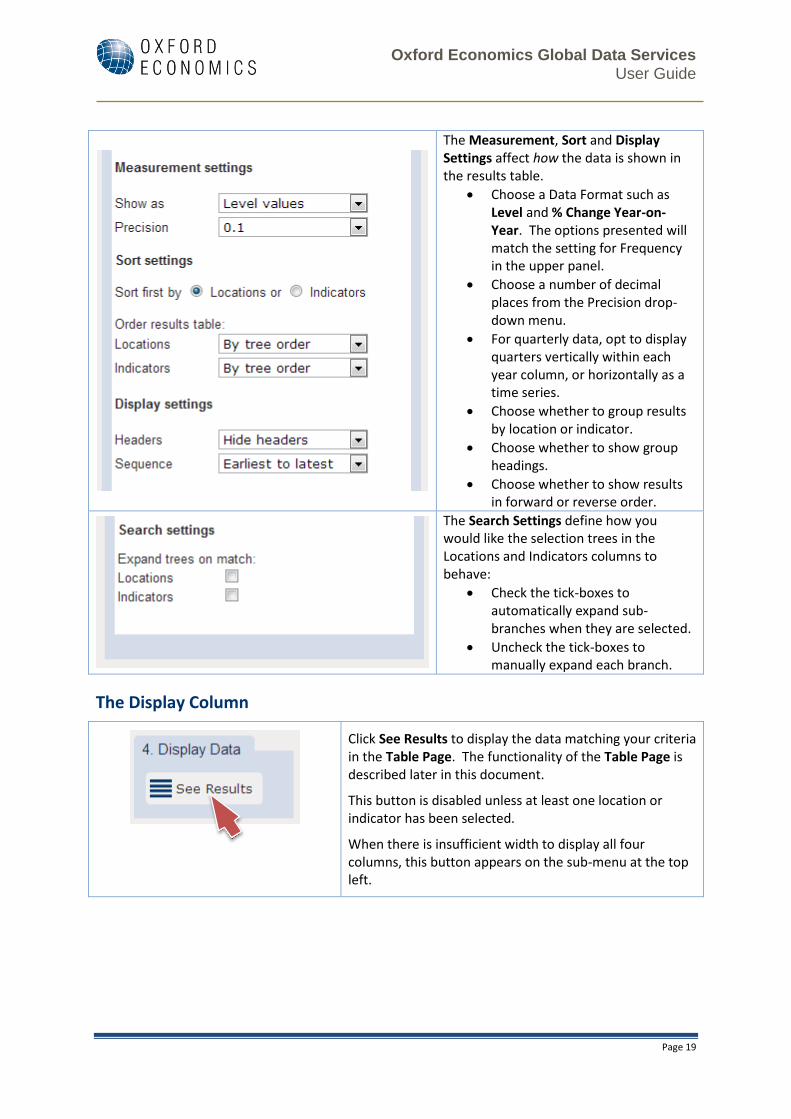
The Measurement, Sort and Display Settings affect how the data is shown in the results table.
Choose a Data Format such as Level and % Change Year-on-Year. The options presented will match the setting for Frequency in the upper panel.
Choose a number of decimal places from the Precision drop-down menu.
For quarterly data, opt to display quarters vertically within each year column, or horizontally as a time series.
Choose whether to group results by location or indicator.
Choose whether to show group headings.
Choose whether to show results in forward or reverse order.
The Search Settings define how you would like the selection trees in the Locations and Indicators columns to behave:
Check the tick-boxes to automatically expand sub-branches when they are selected.
Uncheck the tick-boxes to manually expand each branch.
The Display Column
Click See Results to display the data matching your criteria in the Table Page. The functionality of the Table Page is described later in this document.
This button is disabled unless at least one location or indicator has been selected.
When there is insufficient width to display all four columns, this button appears on the sub-menu at the top left.
Oxford Economics Global Data Services User Guide
Page 20
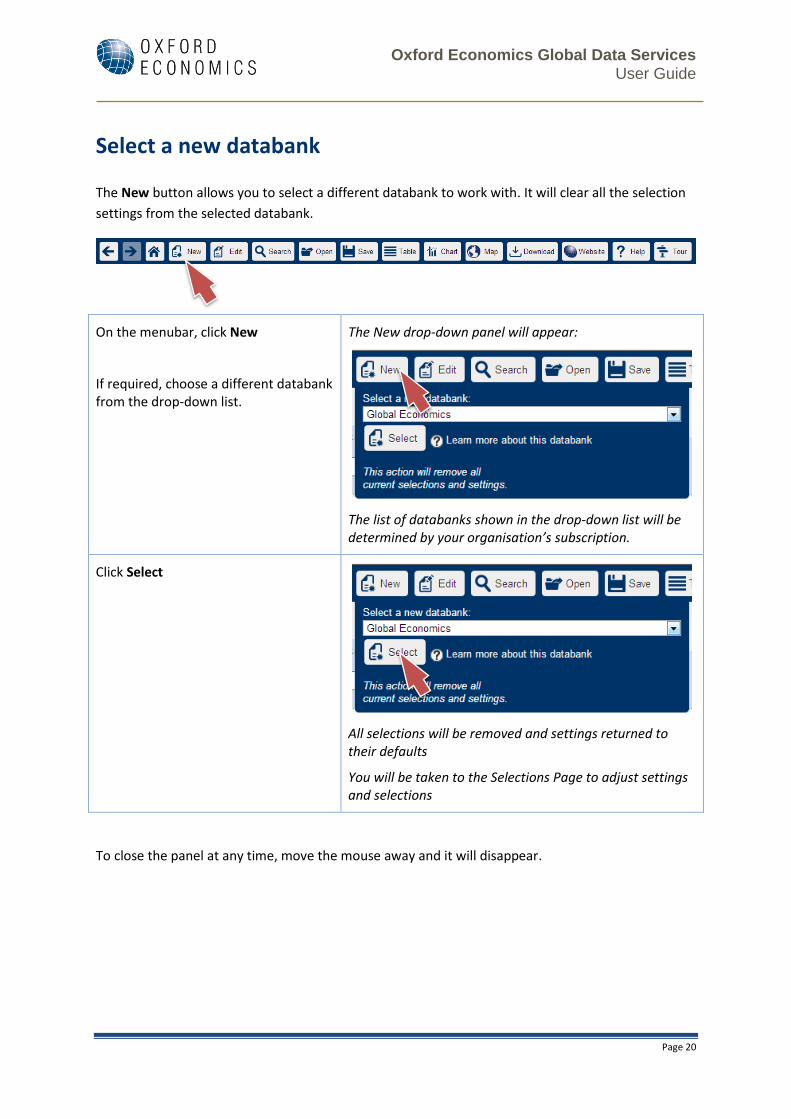
Select a new databank
The New button allows you to select a different databank to work with. It will clear all the selection
settings from the selected databank.
On the menubar, click New
If required, choose a different databank from the drop-down list.
The New drop-down panel will appear:
The list of databanks shown in the drop-down list will be determined by your organisation’s subscription.
Click Select
All selections will be removed and settings returned to their defaults
You will be taken to the Selections Page to adjust settings and selections
To close the panel at any time, move the mouse away and it will disappear.
Oxford Economics Global Data Services User Guide
Page 21
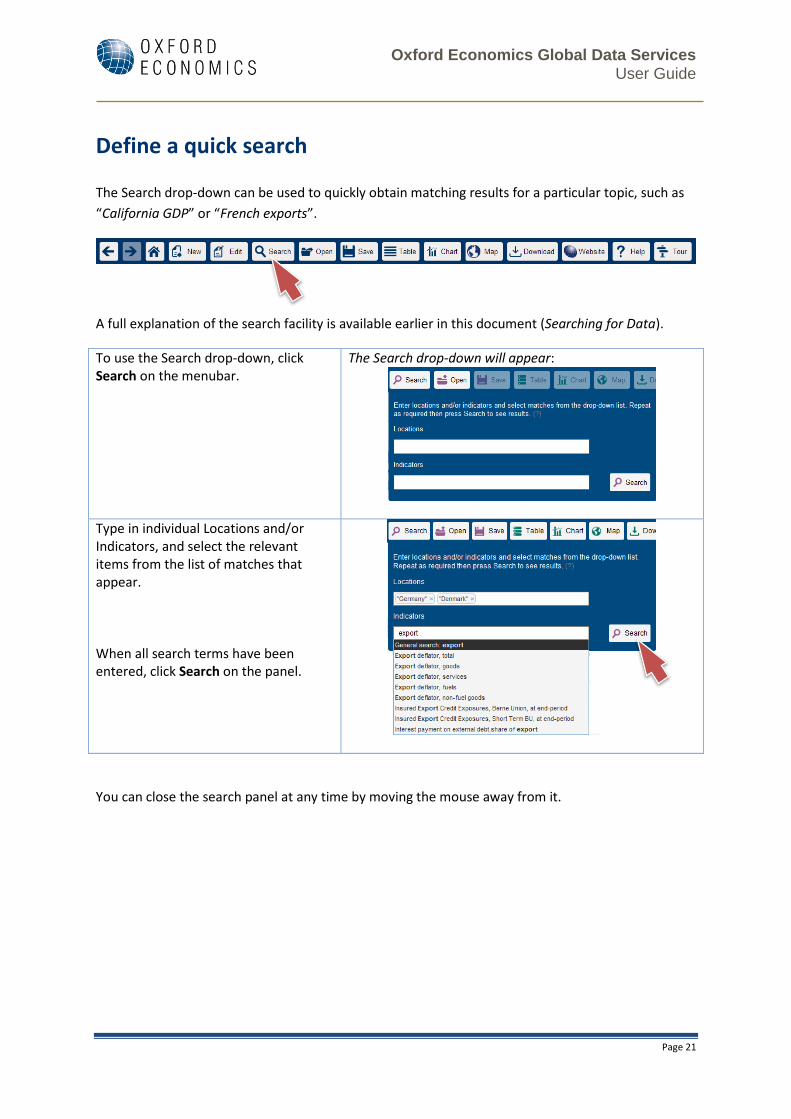
Define a quick search
The Search drop-down can be used to quickly obtain matching results for a particular topic, such as
“California GDP” or “French exports”.
A full explanation of the search facility is available earlier in this document (Searching for Data).
To use the Search drop-down, click Search on the menubar.
The Search drop-down will appear:
Type in individual Locations and/or Indicators, and select the relevant items from the list of matches that appear. When all search terms have been entered, click Search on the panel.
You can close the search panel at any time by moving the mouse away from it.
Oxford Economics Global Data Services User Guide
Page 22
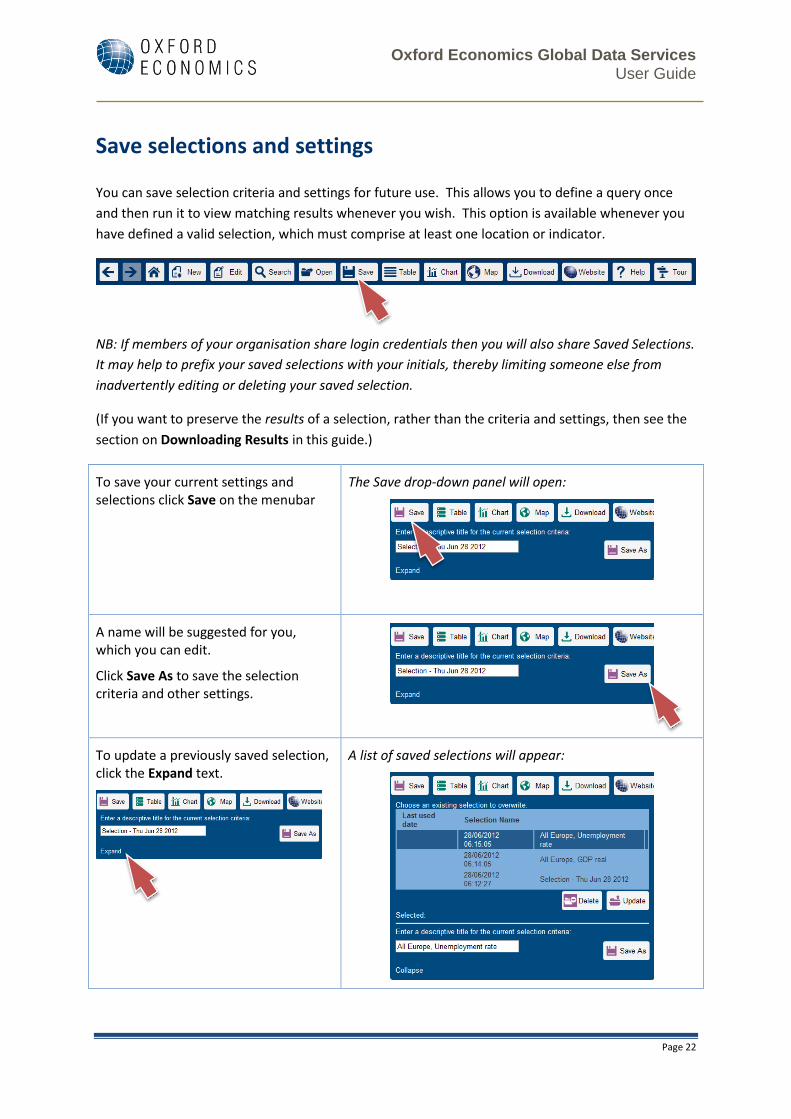
Save selections and settings
You can save selection criteria and settings for future use. This allows you to define a query once
and then run it to view matching results whenever you wish. This option is available whenever you
have defined a valid selection, which must comprise at least one location or indicator.
NB: If members of your organisation share login credentials then you will also share Saved Selections.
It may help to prefix your saved selections with your initials, thereby limiting someone else from
inadvertently editing or deleting your saved selection.
(If you want to preserve the results of a selection, rather than the criteria and settings, then see the
section on Downloading Results in this guide.)
To save your current settings and selections click Save on the menubar
The Save drop-down panel will open:
A name will be suggested for you, which you can edit.
Click Save As to save the selection criteria and other settings.
To update a previously saved selection, click the Expand text.
A list of saved selections will appear:
Oxford Economics Global Data Services User Guide
Page 23
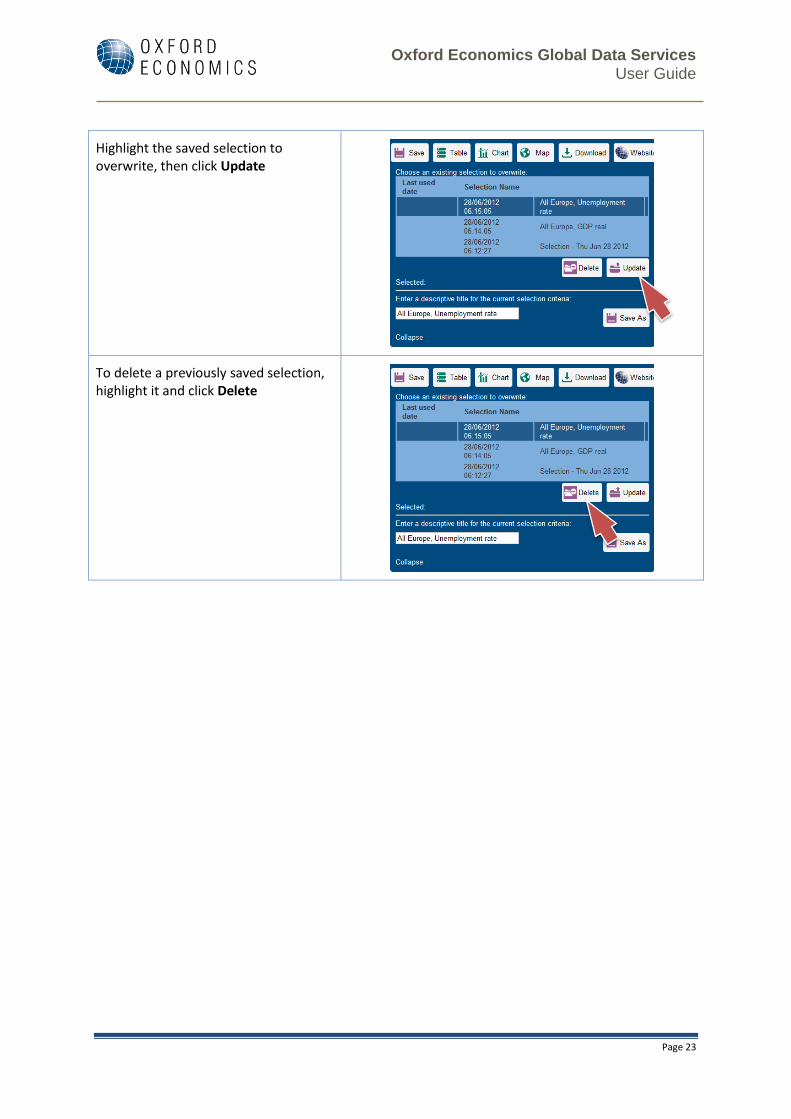
Highlight the saved selection to overwrite, then click Update
To delete a previously saved selection, highlight it and click Delete
Oxford Economics Global Data Services User Guide
Page 24
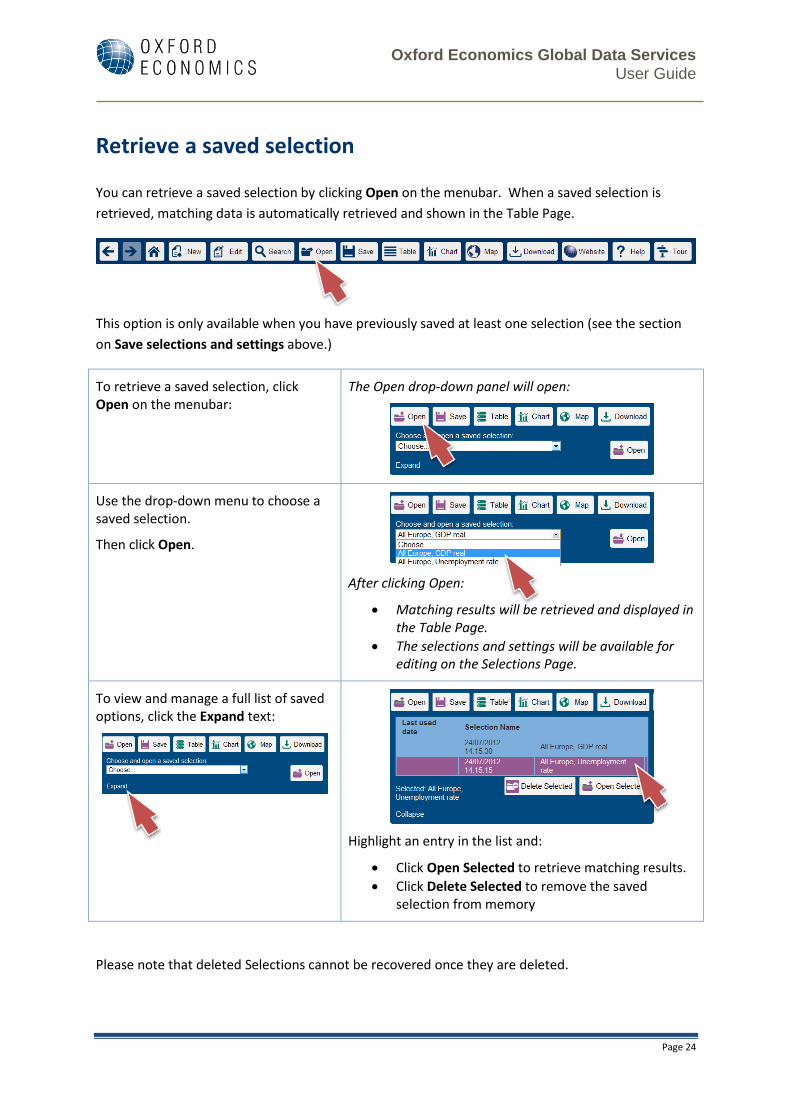
Retrieve a saved selection
You can retrieve a saved selection by clicking Open on the menubar. When a saved selection is
retrieved, matching data is automatically retrieved and shown in the Table Page.
This option is only available when you have previously saved at least one selection (see the section
on Save selections and settings above.)
To retrieve a saved selection, click Open on the menubar:
The Open drop-down panel will open:
Use the drop-down menu to choose a saved selection.
Then click Open.
After clicking Open:
Matching results will be retrieved and displayed in the Table Page.
The selections and settings will be available for editing on the Selections Page.
To view and manage a full list of saved options, click the Expand text:
Highlight an entry in the list and:
Click Open Selected to retrieve matching results.
Click Delete Selected to remove the saved selection from memory
Please note that deleted Selections cannot be recovered once they are deleted.
Oxford Economics Global Data Services User Guide
Page 25
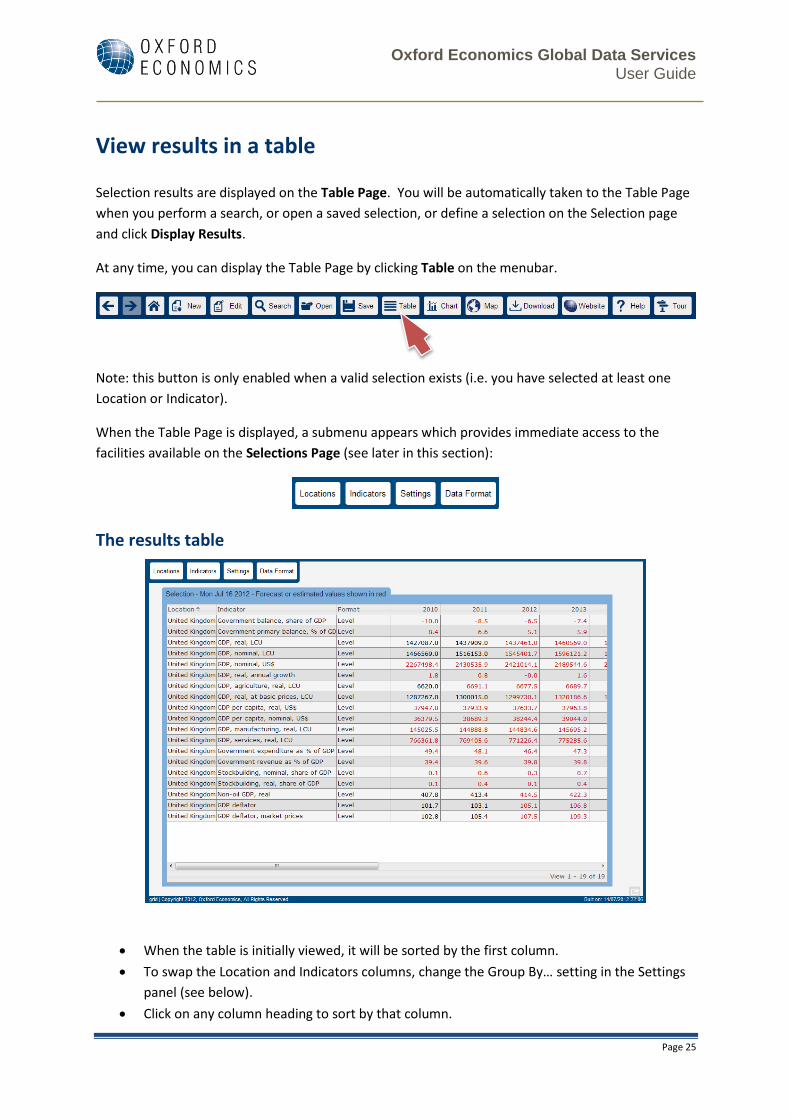
View results in a table
Selection results are displayed on the Table Page. You will be automatically taken to the Table Page
when you perform a search, or open a saved selection, or define a selection on the Selection page
and click Display Results.
At any time, you can display the Table Page by clicking Table on the menubar.
Note: this button is only enabled when a valid selection exists (i.e. you have selected at least one
Location or Indicator).
When the Table Page is displayed, a submenu appears which provides immediate access to the
facilities available on the Selections Page (see later in this section):
The results table
When the table is initially viewed, it will be sorted by the first column.
To swap the Location and Indicators columns, change the Group By… setting in the Settings
panel (see below).
Click on any column heading to sort by that column.
Oxford Economics Global Data Services User Guide
Page 26
Click on any column heading for a second time to reverse the sort order on that column.
You can cut and paste from the visible contents of the table by highlighting the required
values and either:
o Pressing Ctrl+C on your keyboard.
o Right-clicking inside the selected region and selecting Copy from the context menu.
Note: If you include column headings in the selection, all values from the top of the
table will be selected, even if they are not currently visible.
Scroll the table to see other values using the vertical and horizontal scrollbars. If the table is very long there may be some pauses as more data is fetched from the server. The total number of records in the table is shown on the bottom right of the table.
Table settings can be adjusted using the Settings Panel (see below).
BETA note: currently, the table does not resize automatically when the browser is resized. After
changing the size of the browser, go to the Table Page, open a flyout by clicking any submenu button
and click Update Table. This will refresh the data shown in the table and it will resize the table to
make best use of the available space within the browser.
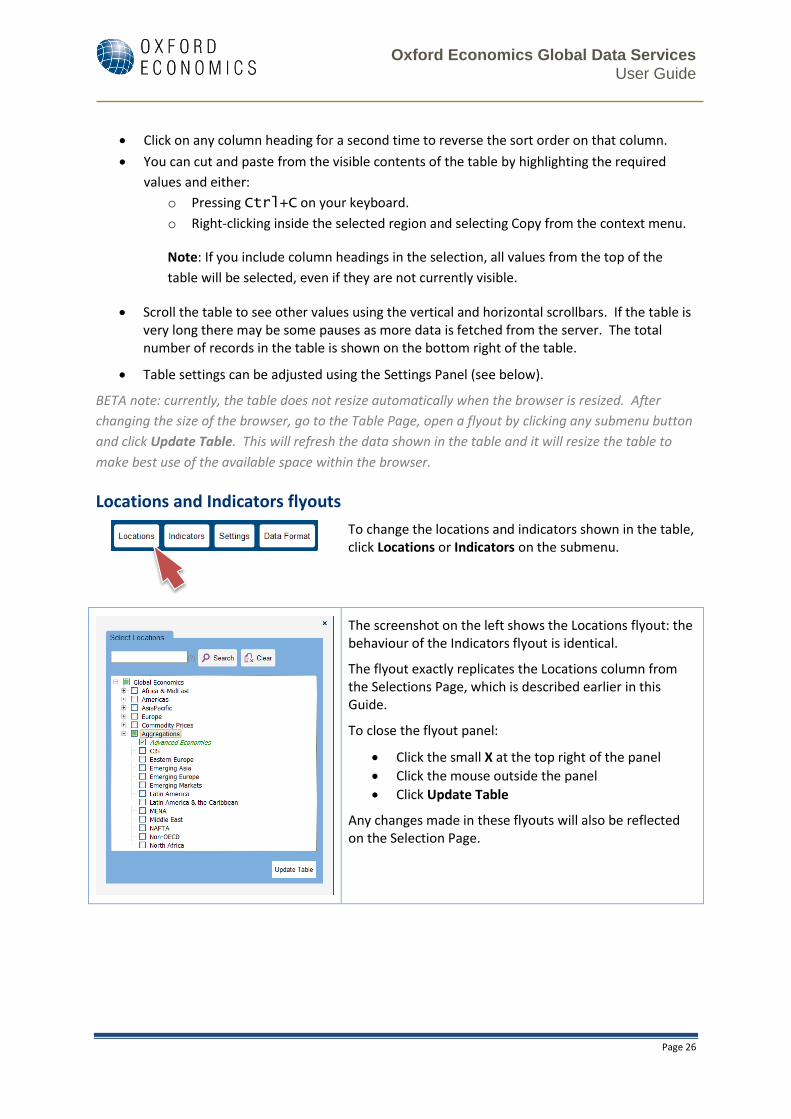
Locations and Indicators flyouts
To change the locations and indicators shown in the table, click Locations or Indicators on the submenu.
The screenshot on the left shows the Locations flyout: the behaviour of the Indicators flyout is identical.
The flyout exactly replicates the Locations column from the Selections Page, which is described earlier in this Guide.
To close the flyout panel:
Click the small X at the top right of the panel
Click the mouse outside the panel
Click Update Table
Any changes made in these flyouts will also be reflected on the Selection Page.
Oxford Economics Global Data Services User Guide
Page 27
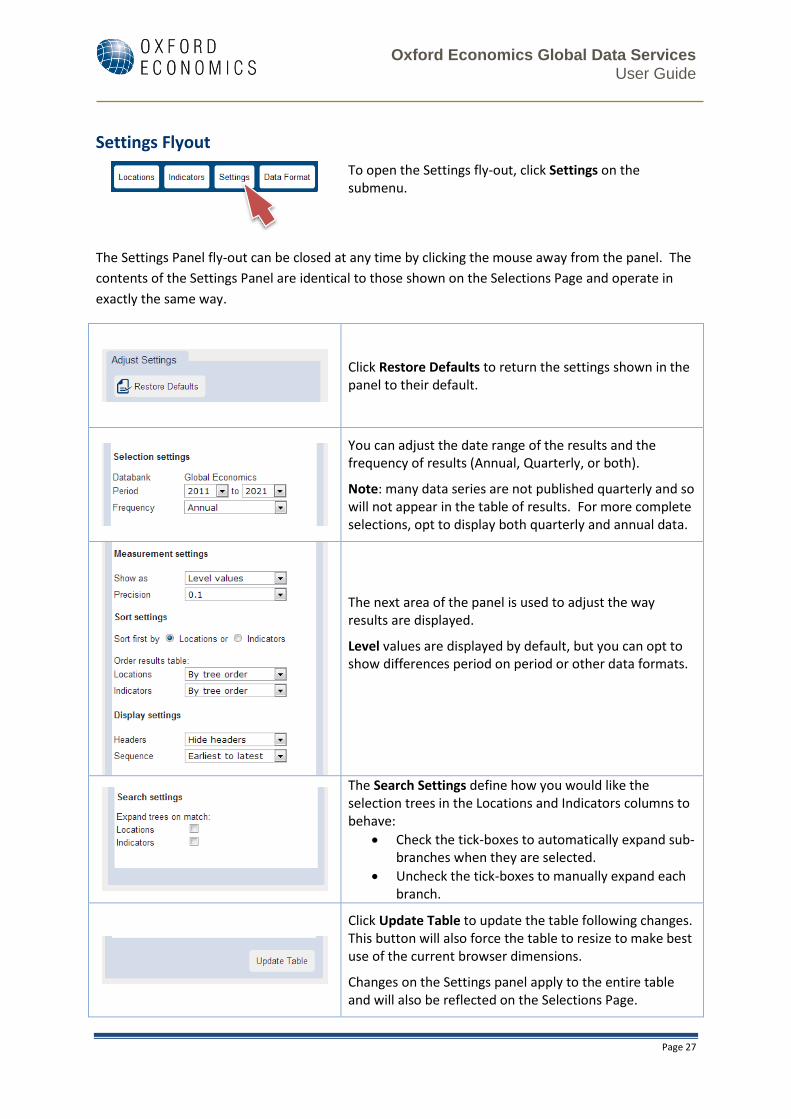
Settings Flyout
To open the Settings fly-out, click Settings on the submenu.
The Settings Panel fly-out can be closed at any time by clicking the mouse away from the panel. The
contents of the Settings Panel are identical to those shown on the Selections Page and operate in
exactly the same way.
Click Restore Defaults to return the settings shown in the panel to their default.
You can adjust the date range of the results and the frequency of results (Annual, Quarterly, or both).
Note: many data series are not published quarterly and so will not appear in the table of results. For more complete selections, opt to display both quarterly and annual data.
The next area of the panel is used to adjust the way results are displayed.
Level values are displayed by default, but you can opt to show differences period on period or other data formats.
The Search Settings define how you would like the selection trees in the Locations and Indicators columns to behave:
Check the tick-boxes to automatically expand sub-branches when they are selected.
Uncheck the tick-boxes to manually expand each branch.
Click Update Table to update the table following changes. This button will also force the table to resize to make best use of the current browser dimensions.
Changes on the Settings panel apply to the entire table and will also be reflected on the Selections Page.
Oxford Economics Global Data Services User Guide
Page 28
Notes:
The setting for Group Headers affects the way the table shows large amounts of data.
o When Group Headers are not shown, you can scroll continuously to see more rows.
o When Group Headers are shown, the table becomes paged.
Click the grey forward and back buttons to navigate to the first page, the previous
page, the next page and the last page respectively.
Type in a new page number to go directly to that page.
Use the drop-down box to change how many data series will be shown on a page.
o This behaviour is dictated by the grid control used to render the table. It cannot be
altered.
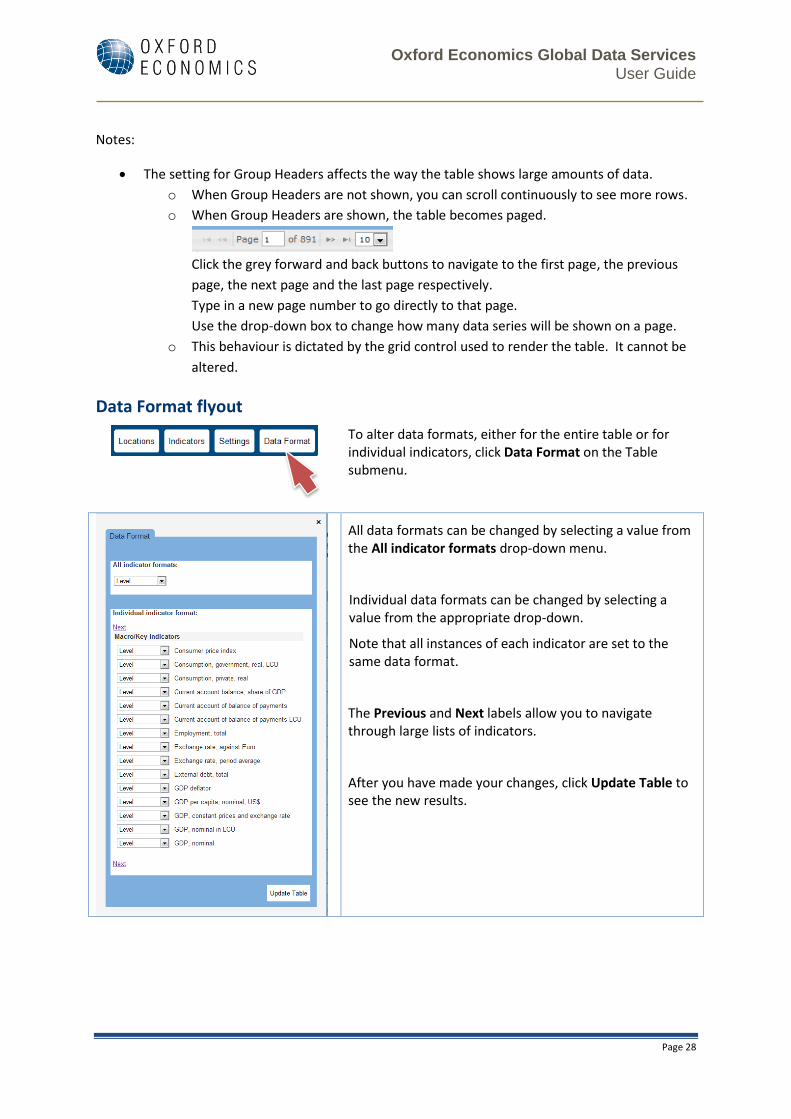
Data Format flyout
To alter data formats, either for the entire table or for individual indicators, click Data Format on the Table submenu.
All data formats can be changed by selecting a value from the All indicator formats drop-down menu.
Individual data formats can be changed by selecting a value from the appropriate drop-down.
Note that all instances of each indicator are set to the same data format.
The Previous and Next labels allow you to navigate through large lists of indicators.
After you have made your changes, click Update Table to see the new results.
Oxford Economics Global Data Services User Guide
Page 29
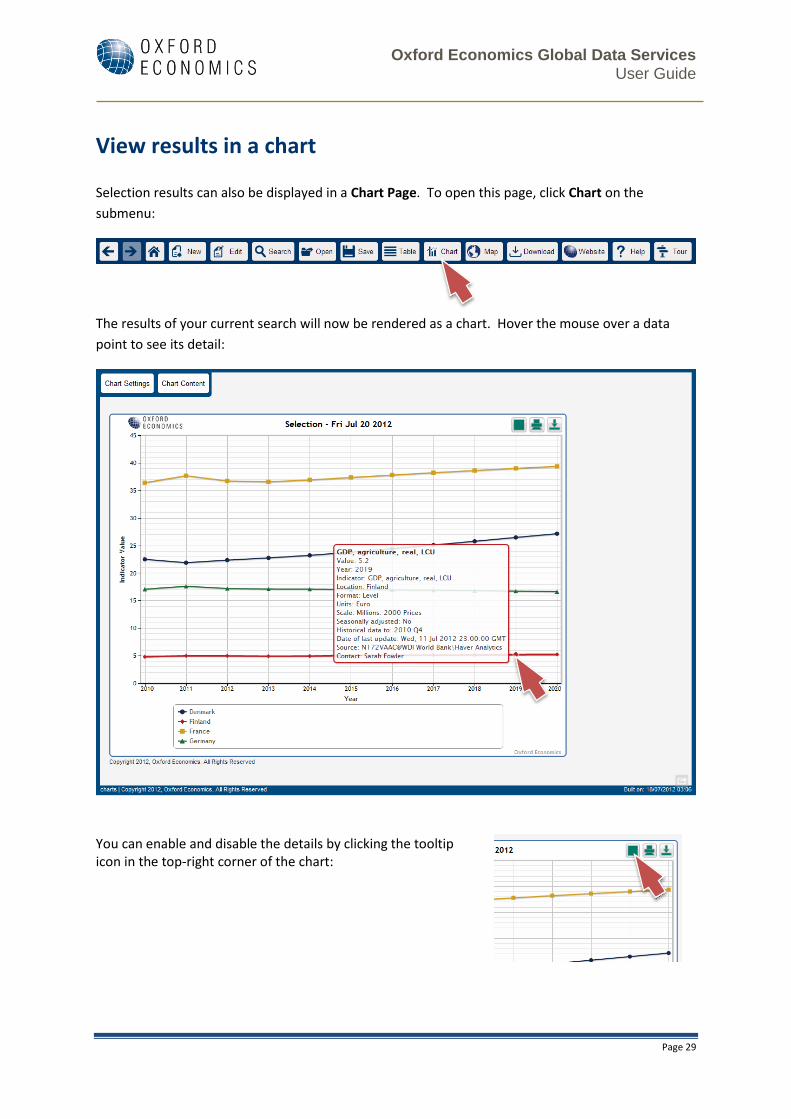
View results in a chart
Selection results can also be displayed in a Chart Page. To open this page, click Chart on the
submenu:
The results of your current search will now be rendered as a chart. Hover the mouse over a data
point to see its detail:
You can enable and disable the details by clicking the tooltip icon in the top-right corner of the chart:
Oxford Economics Global Data Services User Guide
Page 30
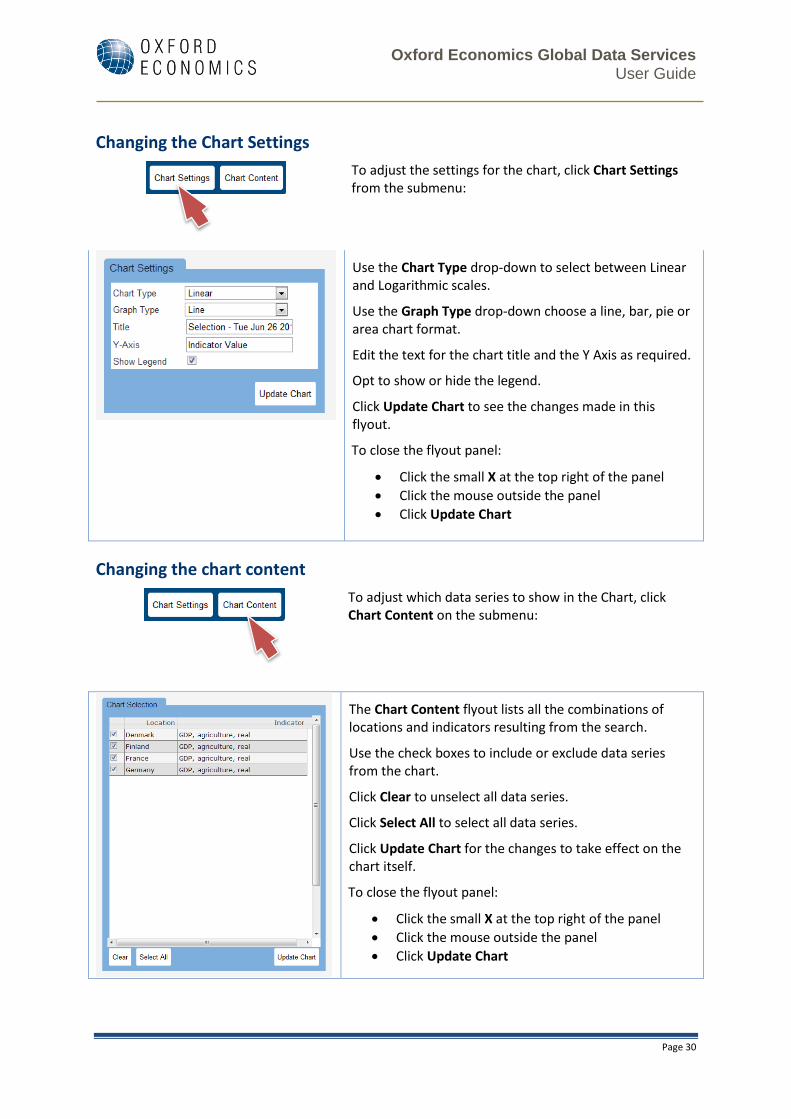
Changing the Chart Settings
To adjust the settings for the chart, click Chart Settings from the submenu:
Use the Chart Type drop-down to select between Linear and Logarithmic scales.
Use the Graph Type drop-down choose a line, bar, pie or area chart format.
Edit the text for the chart title and the Y Axis as required.
Opt to show or hide the legend.
Click Update Chart to see the changes made in this flyout.
To close the flyout panel:
Click the small X at the top right of the panel
Click the mouse outside the panel
Click Update Chart
Changing the chart content
To adjust which data series to show in the Chart, click Chart Content on the submenu:
The Chart Content flyout lists all the combinations of locations and indicators resulting from the search.
Use the check boxes to include or exclude data series from the chart.
Click Clear to unselect all data series.
Click Select All to select all data series.
Click Update Chart for the changes to take effect on the chart itself.
To close the flyout panel:
Click the small X at the top right of the panel
Click the mouse outside the panel
Click Update Chart
Oxford Economics Global Data Services User Guide
Page 31
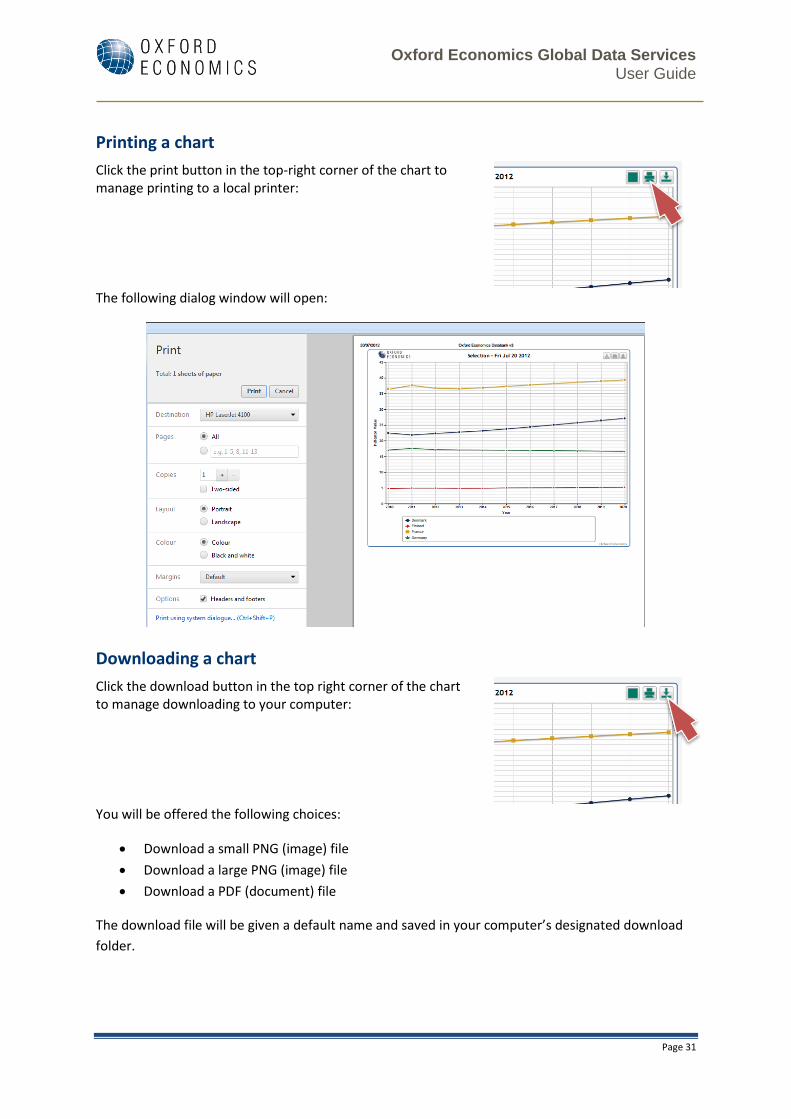
Printing a chart
Click the print button in the top-right corner of the chart to manage printing to a local printer:
The following dialog window will open:
Downloading a chart
Click the download button in the top right corner of the chart to manage downloading to your computer:
You will be offered the following choices:
Download a small PNG (image) file
Download a large PNG (image) file
Download a PDF (document) file
The download file will be given a default name and saved in your computer’s designated download
folder.
Oxford Economics Global Data Services User Guide
Page 32
View results on a map
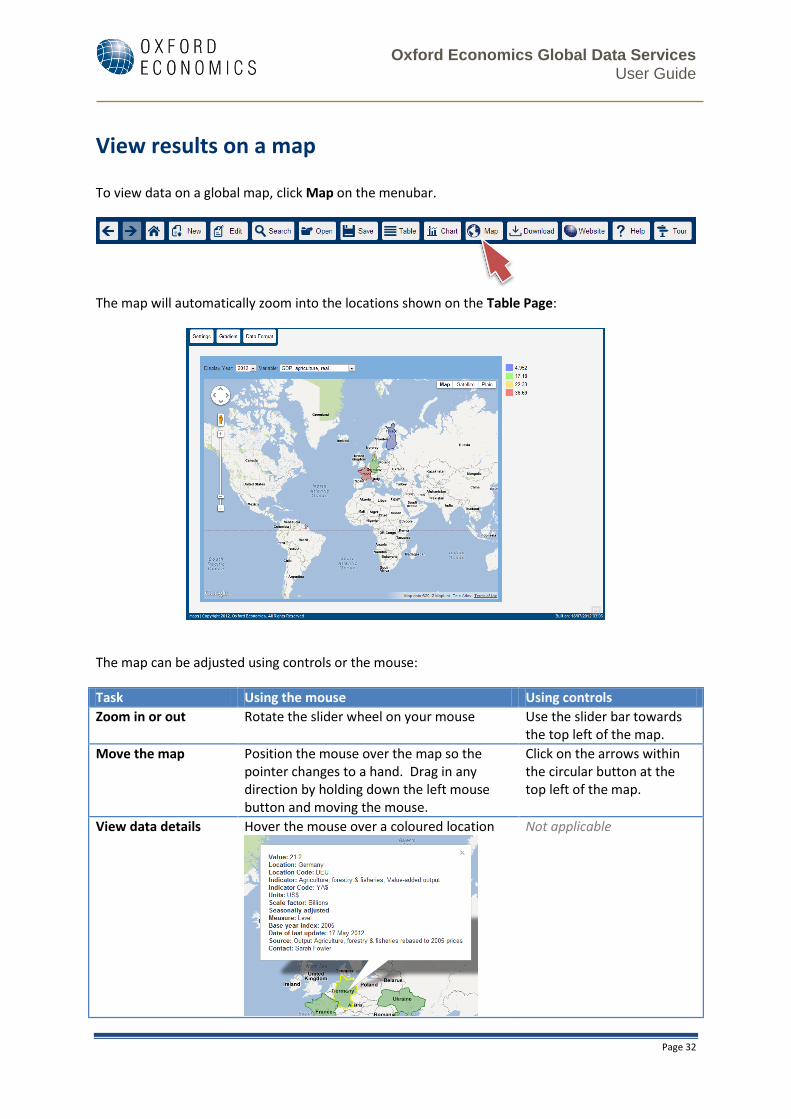
To view data on a global map, click Map on the menubar.
The map will automatically zoom into the locations shown on the Table Page:
The map can be adjusted using controls or the mouse:
Task Using the mouse Using controls
Zoom in or out Rotate the slider wheel on your mouse Use the slider bar towards the top left of the map.
Move the map Position the mouse over the map so the pointer changes to a hand. Drag in any direction by holding down the left mouse button and moving the mouse.
Click on the arrows within the circular button at the top left of the map.
View data details Hover the mouse over a coloured location
Not applicable
Oxford Economics Global Data Services User Guide
Page 33
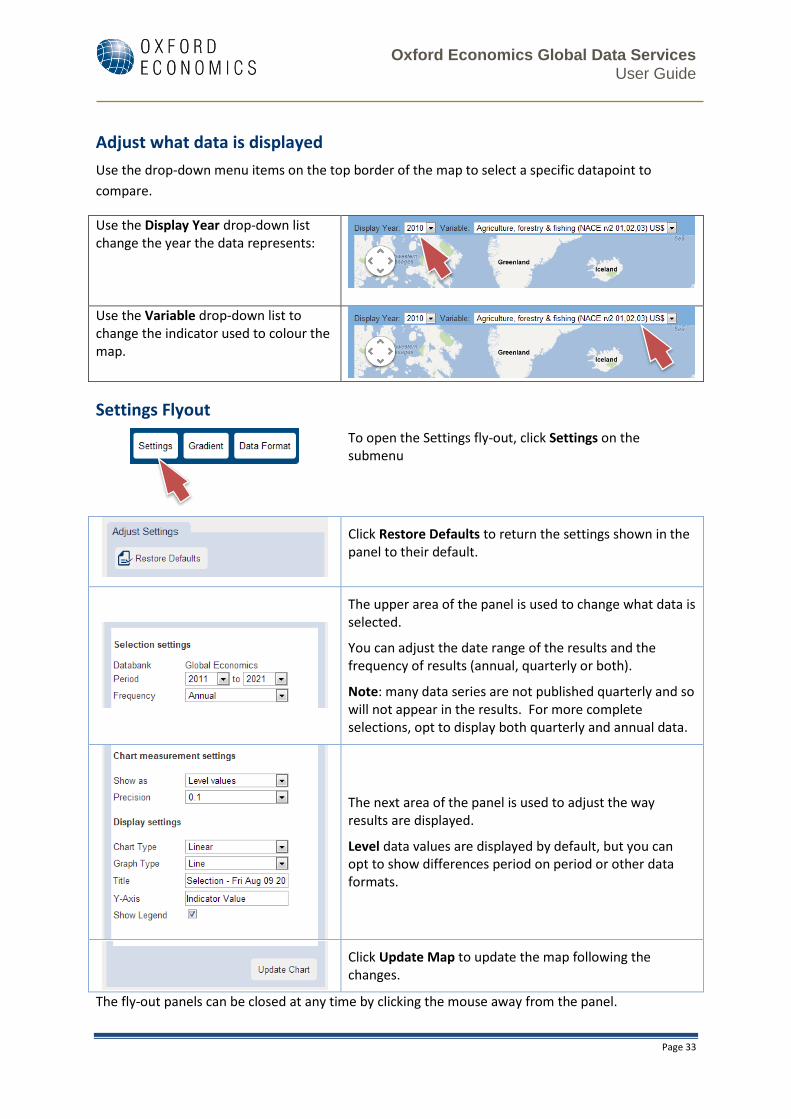
Adjust what data is displayed
Use the drop-down menu items on the top border of the map to select a specific datapoint to
compare.
Use the Display Year drop-down list change the year the data represents:
Use the Variable drop-down list to change the indicator used to colour the map.
Settings Flyout
To open the Settings fly-out, click Settings on the submenu
Click Restore Defaults to return the settings shown in the panel to their default.
The upper area of the panel is used to change what data is selected.
You can adjust the date range of the results and the frequency of results (annual, quarterly or both).
Note: many data series are not published quarterly and so will not appear in the results. For more complete selections, opt to display both quarterly and annual data.
The next area of the panel is used to adjust the way results are displayed.
Level data values are displayed by default, but you can opt to show differences period on period or other data formats.
Click Update Map to update the map following the changes.
The fly-out panels can be closed at any time by clicking the mouse away from the panel.
Oxford Economics Global Data Services User Guide
Page 34
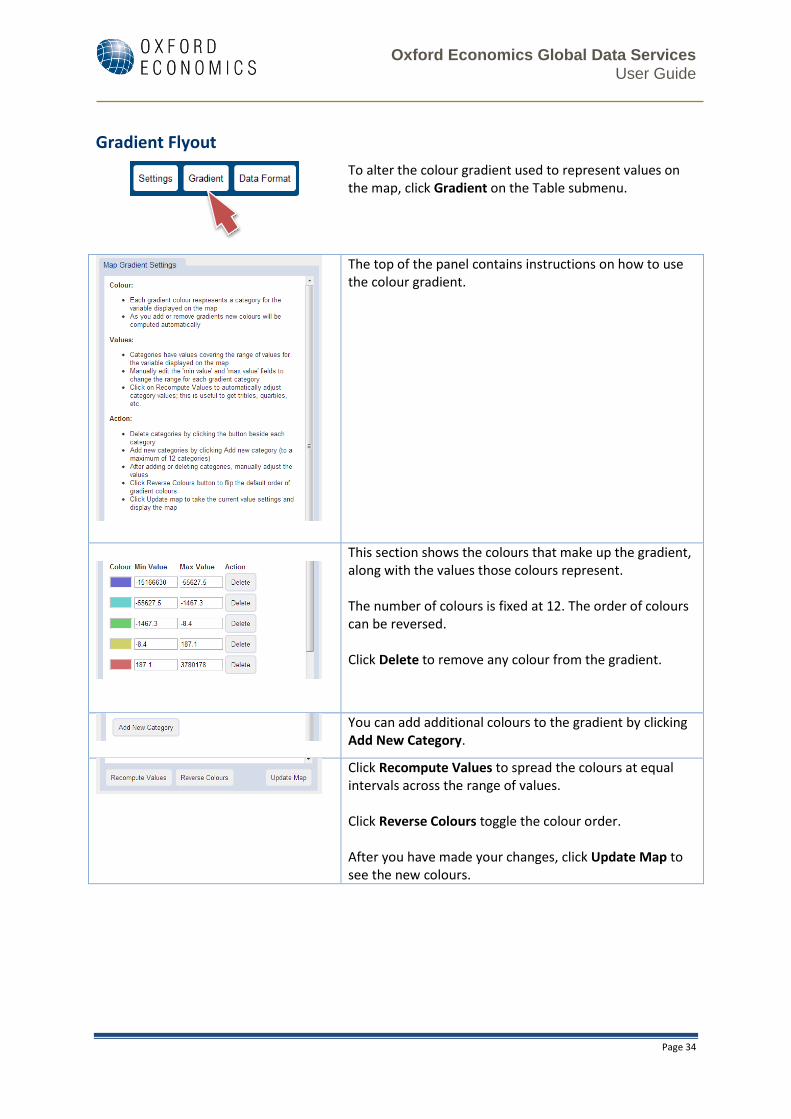
Gradient Flyout
To alter the colour gradient used to represent values on the map, click Gradient on the Table submenu.
The top of the panel contains instructions on how to use the colour gradient.
This section shows the colours that make up the gradient, along with the values those colours represent. The number of colours is fixed at 12. The order of colours can be reversed. Click Delete to remove any colour from the gradient.
You can add additional colours to the gradient by clicking Add New Category.
Click Recompute Values to spread the colours at equal intervals across the range of values. Click Reverse Colours toggle the colour order. After you have made your changes, click Update Map to see the new colours.
Oxford Economics Global Data Services User Guide
Page 35
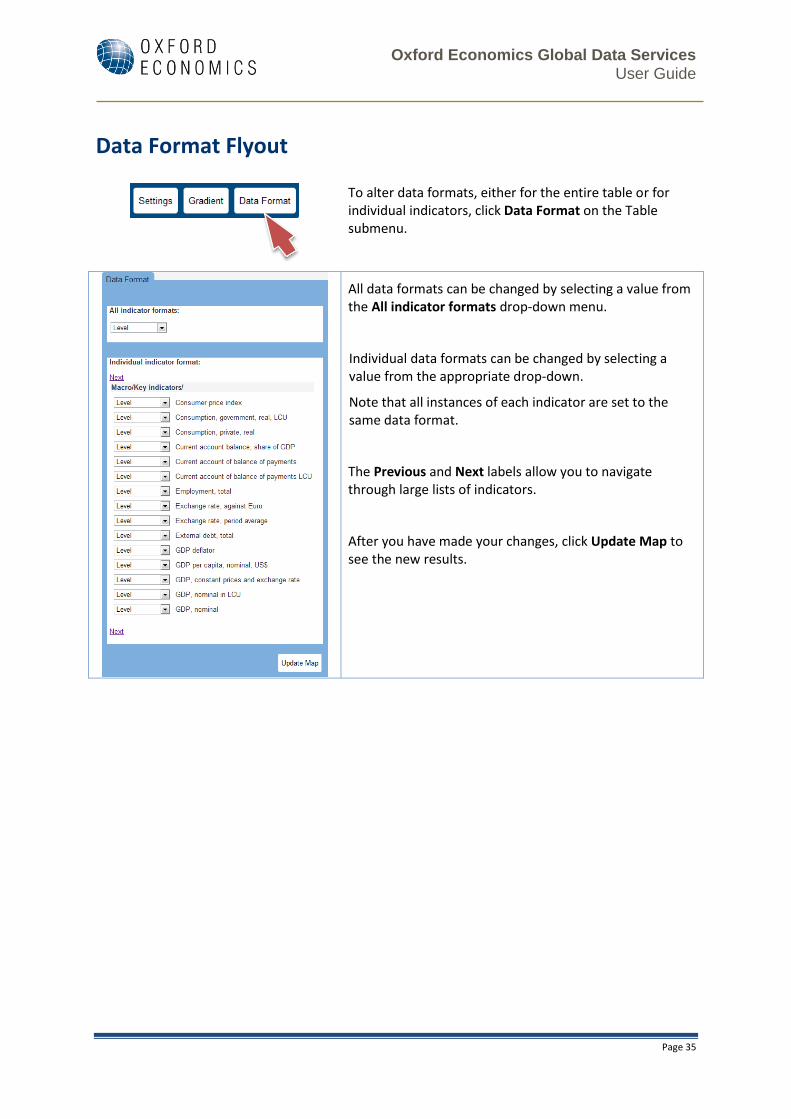
Data Format Flyout
To alter data formats, either for the entire table or for individual indicators, click Data Format on the Table submenu.
All data formats can be changed by selecting a value from the All indicator formats drop-down menu.
Individual data formats can be changed by selecting a value from the appropriate drop-down.
Note that all instances of each indicator are set to the same data format.
The Previous and Next labels allow you to navigate through large lists of indicators.
After you have made your changes, click Update Map to see the new results.
Oxford Economics Global Data Services User Guide
Page 36
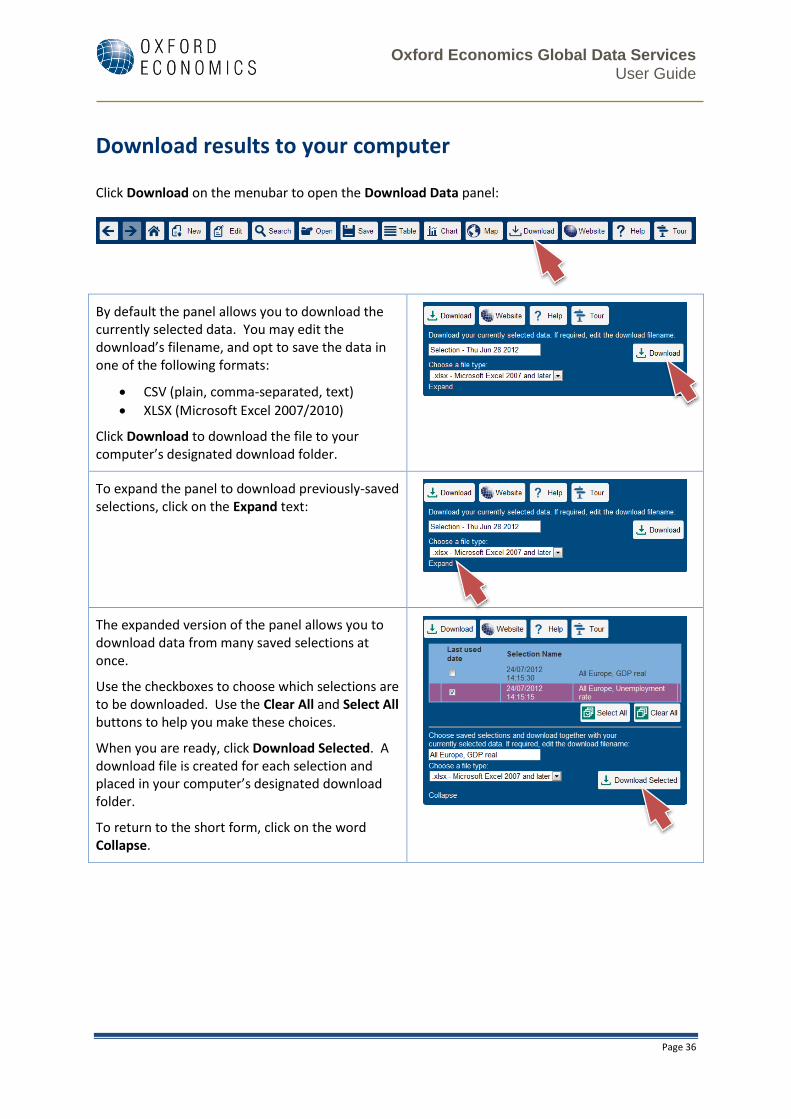
Download results to your computer
Click Download on the menubar to open the Download Data panel:
By default the panel allows you to download the currently selected data. You may edit the download’s filename, and opt to save the data in one of the following formats:
CSV (plain, comma-separated, text)
XLSX (Microsoft Excel 2007/2010)
Click Download to download the file to your computer’s designated download folder.
To expand the panel to download previously-saved selections, click on the Expand text:
The expanded version of the panel allows you to download data from many saved selections at once.
Use the checkboxes to choose which selections are to be downloaded. Use the Clear All and Select All buttons to help you make these choices.
When you are ready, click Download Selected. A download file is created for each selection and placed in your computer’s designated download folder.
To return to the short form, click on the word Collapse.