overview of tmrs investments...• 2015 equity asset class review presented at december 2015 board...
TRANSCRIPT

Overview of TMRS Investments
T.J. Carlson
Chief Investment Officer, TMRS
2
• Performance and Asset Allocation
• Public Equities
• Fixed Income
• Real Estate
• Real Return
• Absolute Return
• Private Equity
• Compliance
• Risk Management
Investment Overview
3
Performance and Asset Allocation
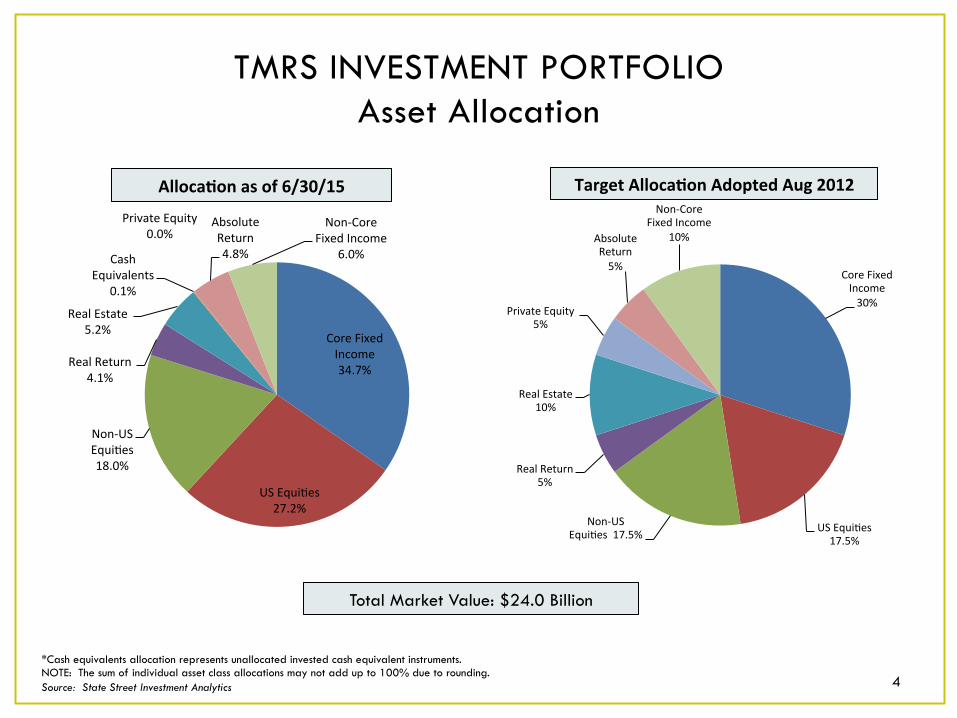
TMRS INVESTMENT PORTFOLIO Asset Allocation
Alloca&on as of 6/30/15
Core Fixed Income 30%
US Equi6es 17.5%
Non-‐US Equi6es 17.5%
Real Return 5%
Real Estate 10%
Private Equity 5%
Absolute Return 5%
Non-‐Core Fixed Income
10%
*Cash equivalents allocation represents unallocated invested cash equivalent instruments. NOTE: The sum of individual asset class allocations may not add up to 100% due to rounding. Source: State Street Investment Analytics
Target Alloca&on Adopted Aug 2012
Total Market Value: $24.0 Billion
4
Core Fixed Income 34.7%
US Equi6es 27.2%
Non-‐US Equi6es 18.0%
Real Return 4.1%
Real Estate 5.2%
Cash Equivalents
0.1%
Private Equity 0.0%
Absolute Return 4.8%
Non-‐Core Fixed Income
6.0%

TMRS INVESTMENT PORTFOLIO Performance By Asset Class
June 2015
1 Year Performance 5 Year Performance
Gross returns *Real Estate return as of prior quarter end (real estate returns are available on a quarterly basis only); ^Absolute Return performance is since inception (as of is 8/1/14). Source: State Street Investment Analytics 5
2.3% 2.0%
7.0%
-‐4.2% -‐3.4%
12.7%
2.2% 1.9%
7.3%
-‐5.0%
-‐3.4%
13.5%
-‐10.0%
-‐5.0%
0.0%
5.0%
10.0%
15.0% TMRS
Benchmark
7.5%
3.6%
17.4%
8.4%
7.3%
3.4%
17.5%
8.0%
0.0%
2.0%
4.0%
6.0%
8.0%
10.0%
12.0%
14.0%
16.0%
18.0%
20.0% TMRS
Benchmark
N/A N/A N/A N/A
6
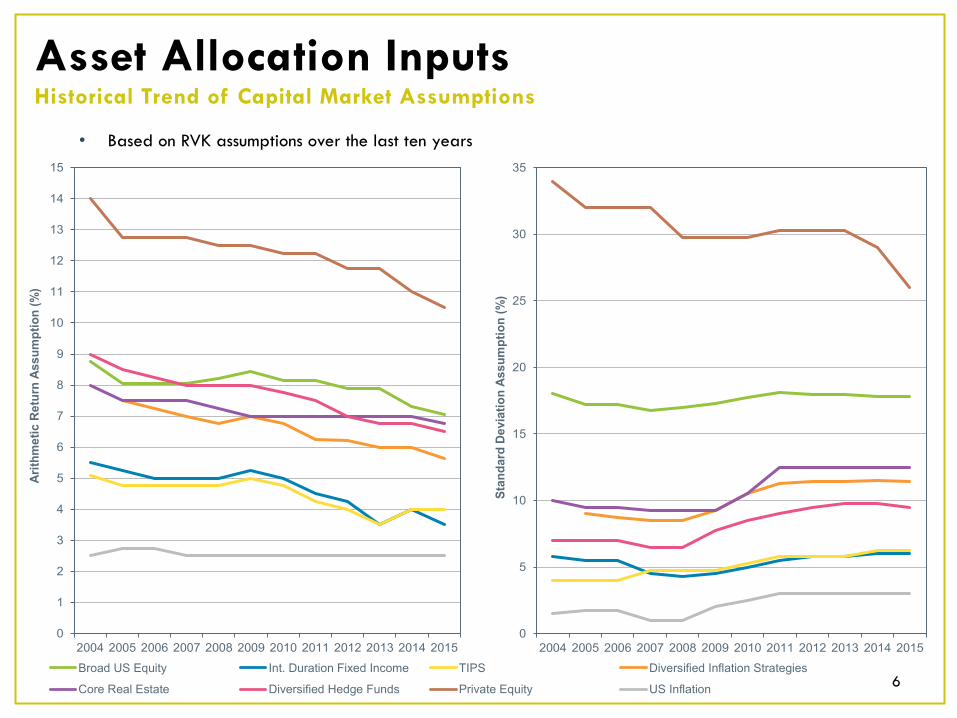
Asset Allocation Inputs Historical Trend of Capital Market Assumptions
• Based on RVK assumptions over the last ten years
0
5
10
15
20
25
30
35
2004 2005 2006 2007 2008 2009 2010 2011 2012 2013 2014 2015
Stan
dard
Dev
iatio
n As
sum
ptio
n (%
)
0
1
2
3
4
5
6
7
8
9
10
11
12
13
14
15
2004 2005 2006 2007 2008 2009 2010 2011 2012 2013 2014 2015
Arith
met
ic R
etur
n As
sum
ptio
n (%
)
0
1
2
3
4
5
6
7
8
9
10
11
12
13
14
15
2004 2005 2006 2007 2008 2009 2010 2011 2012 2013 2014 2015
Arit
hmet
ic R
etur
n A
ssum
ptio
n (%
)
Broad US Equity Int. Duration Fixed Income TIPS Diversified Inflation Strategies
Core Real Estate Diversified Hedge Funds Private Equity US Inflation
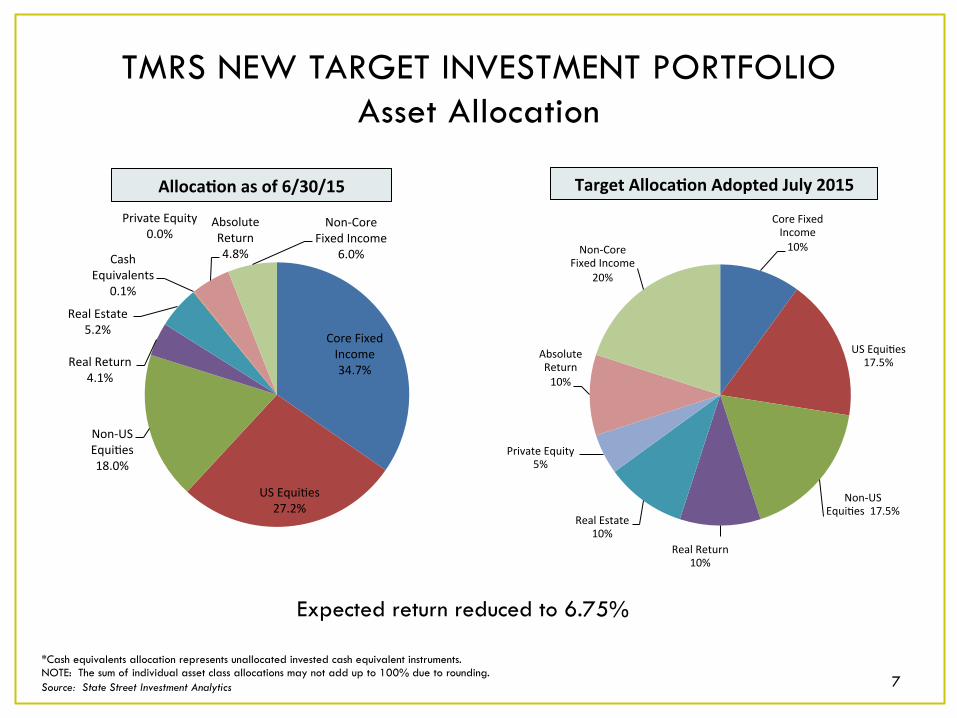
TMRS NEW TARGET INVESTMENT PORTFOLIO Asset Allocation
Alloca&on as of 6/30/15
Core Fixed Income 10%
US Equi6es 17.5%
Non-‐US Equi6es 17.5%
Real Return 10%
Real Estate 10%
Private Equity 5%
Absolute Return 10%
Non-‐Core Fixed Income
20%
*Cash equivalents allocation represents unallocated invested cash equivalent instruments. NOTE: The sum of individual asset class allocations may not add up to 100% due to rounding. Source: State Street Investment Analytics
Target Alloca&on Adopted July 2015
7
Core Fixed Income 34.7%
US Equi6es 27.2%
Non-‐US Equi6es 18.0%
Real Return 4.1%
Real Estate 5.2%
Cash Equivalents
0.1%
Private Equity 0.0%
Absolute Return 4.8%
Non-‐Core Fixed Income
6.0%
Expected return reduced to 6.75%

8
Public Equities

Public Equities Asset Class Overview
9
US Equity
� Objective � Intended to provide capital appreciation and is structured using a Core-Satellite Approach with the
overall objective of exceeding its benchmark performance net of fees over rolling five year periods.
� Satellite strategies(Active and Rules-Based) are expected to add excess return within established tracking error limits.
International Equity
� Objective � Intended to provide capital appreciation and diversification, and is structured using a Core-Satellite
Approach with the overall objective of exceeding its benchmark performance net of fees over rolling five year periods.
� Satellite strategies (Active and Rules-Based) are expected to add excess return within established tracking error limits.

Public Equities Portfolio Management Structure
10
ASSET CLASS STRATEGY MANAGER PORTFOLIO
BENCHMARK
Domestic Equities US Core/Passive Passive Broad Market Index Northern Trust Asset Management Russell 3000 Index
US Rules-Based Passive Fundamental Index State Street Global Advisors Russell US Fundamental Index
US Rules-Based Passive Minimum Volatility UBS Global Asset Management MSCI US Min Vol Index
US Satellite/Active US Traditional All Cap Epoch Investment Partners, Inc. Russell 3000 Index
US Satellite/Active US Opportunistic All Cap Sasco Capital, Inc. Russell Mid Cap Value Index
US Satellite/Active US Mid Cap Opportunistic The Boston Company Russell Mid Cap Index
US Satellite/Active US Mid Cap Core Champlain Investment Partners Russell Mid Cap Index
US Satellite/Active US Small Cap Opportunistic The Boston Company (pending) Russell 2000 Index
US Satellite/Active US Small Cap Opportunities Wellington Management (pending) Russell 2000 Index
International Equities Non-US Core/Passive Passive Broad Market Index Northern Trust Asset Management
All Country World (ACW) ex US Investable Market Index (IMI)
Non-US Rules-Based Passive Fundamental Index State Street Global Advisors Russell Fundamental Global ex US
Non-US Rules-Based Passive Minimum Volatility UBS Global Asset Management MSCI World ex US Min Vol Index
Non-US Satellite/Active Non-US Opportunistic Relative Value Wellington Management MSCI ACWI ex US Index
Non-US Satellite/Active Non-US Opportunistic Core Lazard Asset Management MSCI ACWI ex US Index
Non-US Satellite/Active Non-US Emerging Markets Acadian Asset Management (pending) MSCI Emerging Markets (EM) Index
Non-US Satellite/Active Non-US Emerging Markets William Blair & Company (pending) MSCI Emerging Markets (EM) Index

11
% of Total Fund as of 6/30/2015*
CORE Portfolio Managers
Market Value % of Total Portfolio
US CORE EQUITY: NTGI Russell 3000
4,584,077,301 19.1%
NON-US CORE EQUITY: NTGI ACW ex. US IMI
3,066,053,948 13.0%
TOTAL: 7,650,131,249 31.9%
* All figures include the pending implementation of the non-US Emerging Market managers (Acadian & William Blair) that were approved in Sept. 2014 and the U.S. small cap managers (The Boston Co. and Wellington) that were approved in June 2015. NOTE: Percentages may not be exact due to rounding
SATELLITE Portfolio Managers
Market Value % of Total Portfolio
US RULES-BASED EQUITY: 584,127,667 2.4%
US ACTIVE EQUITY: 1,365,173,186 5.7%
NON-US RULES-BASED EQUITY: 487,251,465 2.0%
NON-US ACTIVE EQUITY: 758,810,139 3.2%
TOTAL: 3,195,362,457 13.3%
31.9%
13.3% 17.5% 17.5%
0.0%
10.0%
20.0%
30.0%
40.0%
Core Portfolio Satellite Portfolio
Current Allocation Target Allocation
2.4% 2.0%
5.7%
3.2%
8.75% 8.75%
0%
2%
4%
6%
8%
10%
US Satellite Portfolio
Non-US Satellite Portfolio
Current RB Current Active Target Allocation
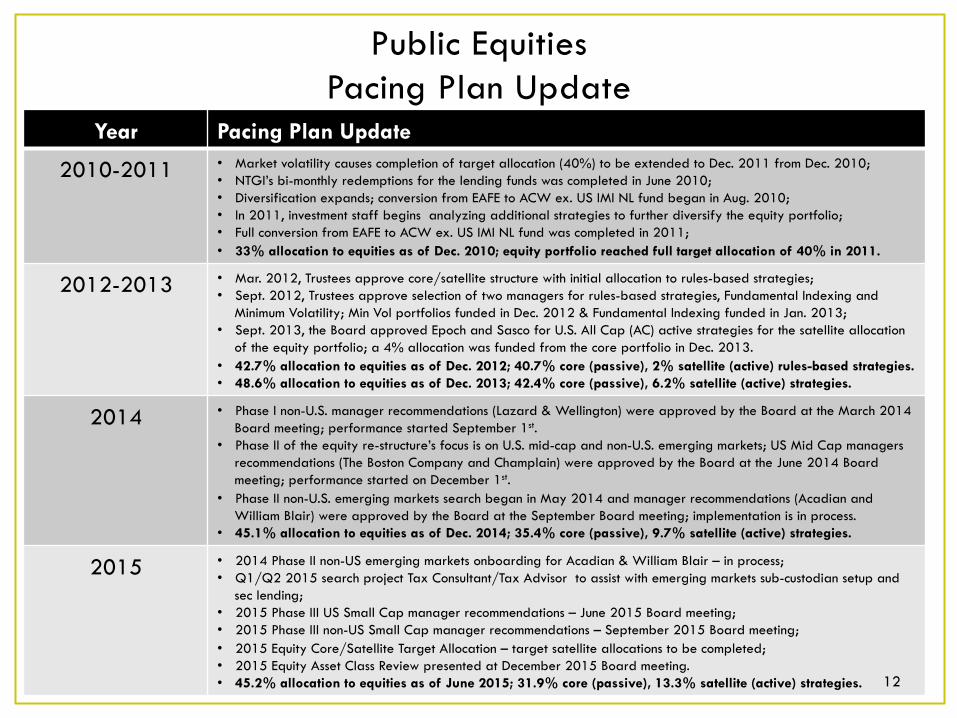
Public Equities Pacing Plan Update
12
Year Pacing Plan Update
2010-2011 • Market volatility causes completion of target allocation (40%) to be extended to Dec. 2011 from Dec. 2010; • NTGI’s bi-monthly redemptions for the lending funds was completed in June 2010; • Diversification expands; conversion from EAFE to ACW ex. US IMI NL fund began in Aug. 2010; • In 2011, investment staff begins analyzing additional strategies to further diversify the equity portfolio; • Full conversion from EAFE to ACW ex. US IMI NL fund was completed in 2011; • 33% allocation to equities as of Dec. 2010; equity portfolio reached full target allocation of 40% in 2011.
2012-2013 • Mar. 2012, Trustees approve core/satellite structure with initial allocation to rules-based strategies; • Sept. 2012, Trustees approve selection of two managers for rules-based strategies, Fundamental Indexing and
Minimum Volatility; Min Vol portfolios funded in Dec. 2012 & Fundamental Indexing funded in Jan. 2013; • Sept. 2013, the Board approved Epoch and Sasco for U.S. All Cap (AC) active strategies for the satellite allocation
of the equity portfolio; a 4% allocation was funded from the core portfolio in Dec. 2013. • 42.7% allocation to equities as of Dec. 2012; 40.7% core (passive), 2% satellite (active) rules-based strategies. • 48.6% allocation to equities as of Dec. 2013; 42.4% core (passive), 6.2% satellite (active) strategies.
2014 • Phase I non-U.S. manager recommendations (Lazard & Wellington) were approved by the Board at the March 2014 Board meeting; performance started September 1st.
• Phase II of the equity re-structure’s focus is on U.S. mid-cap and non-U.S. emerging markets; US Mid Cap managers recommendations (The Boston Company and Champlain) were approved by the Board at the June 2014 Board meeting; performance started on December 1st.
• Phase II non-U.S. emerging markets search began in May 2014 and manager recommendations (Acadian and William Blair) were approved by the Board at the September Board meeting; implementation is in process.
• 45.1% allocation to equities as of Dec. 2014; 35.4% core (passive), 9.7% satellite (active) strategies.
2015 • 2014 Phase II non-US emerging markets onboarding for Acadian & William Blair – in process; • Q1/Q2 2015 search project Tax Consultant/Tax Advisor to assist with emerging markets sub-custodian setup and
sec lending; • 2015 Phase III US Small Cap manager recommendations – June 2015 Board meeting; • 2015 Phase III non-US Small Cap manager recommendations – September 2015 Board meeting; • 2015 Equity Core/Satellite Target Allocation – target satellite allocations to be completed; • 2015 Equity Asset Class Review presented at December 2015 Board meeting. • 45.2% allocation to equities as of June 2015; 31.9% core (passive), 13.3% satellite (active) strategies. 12
13
Fixed Income
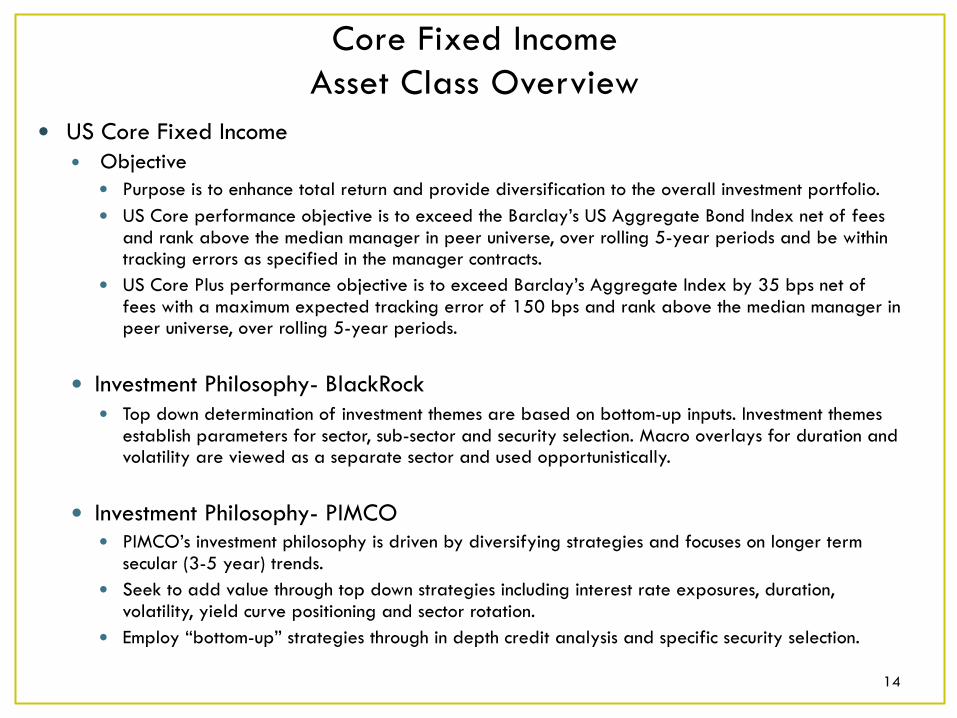
Core Fixed Income Asset Class Overview
� US Core Fixed Income � Objective
� Purpose is to enhance total return and provide diversification to the overall investment portfolio. � US Core performance objective is to exceed the Barclay’s US Aggregate Bond Index net of fees
and rank above the median manager in peer universe, over rolling 5-year periods and be within tracking errors as specified in the manager contracts.
� US Core Plus performance objective is to exceed Barclay’s Aggregate Index by 35 bps net of fees with a maximum expected tracking error of 150 bps and rank above the median manager in peer universe, over rolling 5-year periods.
� Investment Philosophy- BlackRock � Top down determination of investment themes are based on bottom-up inputs. Investment themes
establish parameters for sector, sub-sector and security selection. Macro overlays for duration and volatility are viewed as a separate sector and used opportunistically.
� Investment Philosophy- PIMCO � PIMCO’s investment philosophy is driven by diversifying strategies and focuses on longer term
secular (3-5 year) trends. � Seek to add value through top down strategies including interest rate exposures, duration,
volatility, yield curve positioning and sector rotation. � Employ “bottom-up” strategies through in depth credit analysis and specific security selection.
14

Core Fixed Income Portfolio Management Structure
15
STRATEGY MANAGER PORTFOLIO BENCHMARK
US Core (enhanced index) BlackRock Barclays US Aggregate Bond Index
Active Core Plus PIMCO Barclays US Aggregate Bond Index
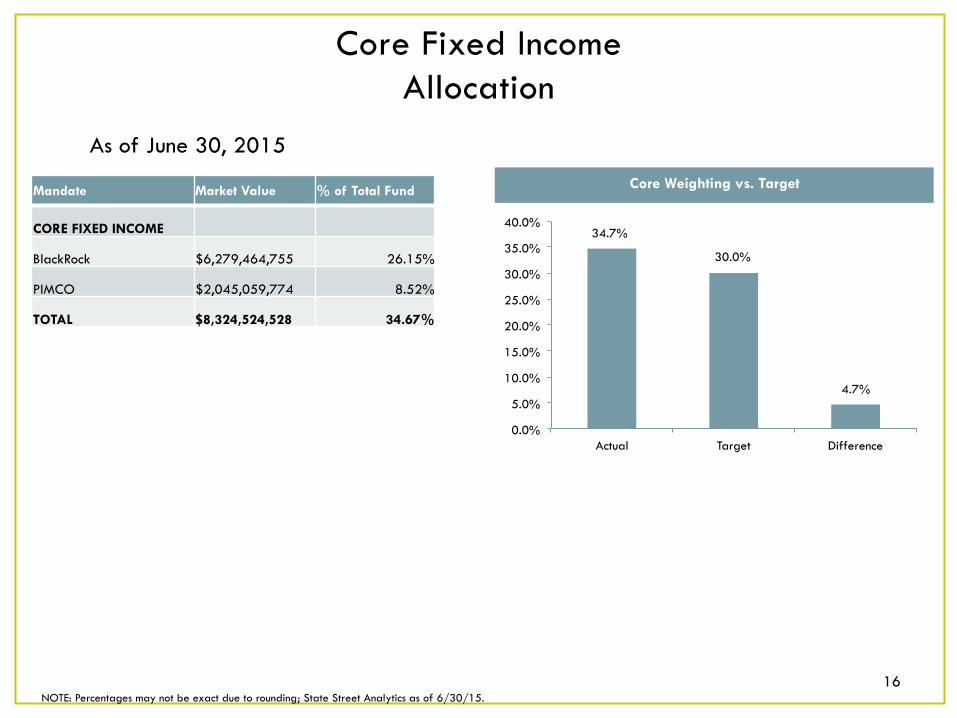
Core Fixed Income Allocation
As of June 30, 2015
NOTE: Percentages may not be exact due to rounding; State Street Analytics as of 6/30/15. 16
Mandate Market Value % of Total Fund
CORE FIXED INCOME
BlackRock $6,279,464,755 26.15%
PIMCO $2,045,059,774 8.52%
TOTAL $8,324,524,528 34.67%
Core Weighting vs. Target
34.7%
30.0%
4.7%
0.0%
5.0%
10.0%
15.0%
20.0%
25.0%
30.0%
35.0%
40.0%
Actual Target Difference
Core Fixed Income Pacing Plan Update
17
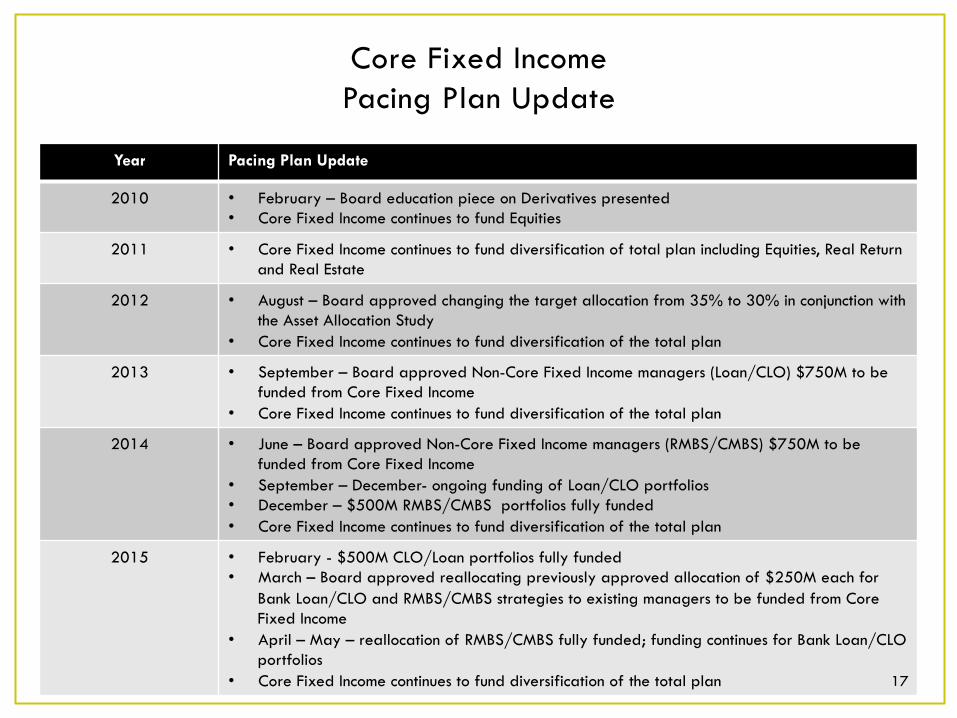
Year Pacing Plan Update
2010 • February – Board education piece on Derivatives presented • Core Fixed Income continues to fund Equities
2011 • Core Fixed Income continues to fund diversification of total plan including Equities, Real Return and Real Estate
2012 • August – Board approved changing the target allocation from 35% to 30% in conjunction with the Asset Allocation Study
• Core Fixed Income continues to fund diversification of the total plan
2013 • September – Board approved Non-Core Fixed Income managers (Loan/CLO) $750M to be funded from Core Fixed Income
• Core Fixed Income continues to fund diversification of the total plan
2014 • June – Board approved Non-Core Fixed Income managers (RMBS/CMBS) $750M to be funded from Core Fixed Income
• September – December- ongoing funding of Loan/CLO portfolios • December – $500M RMBS/CMBS portfolios fully funded • Core Fixed Income continues to fund diversification of the total plan
2015 • February - $500M CLO/Loan portfolios fully funded • March – Board approved reallocating previously approved allocation of $250M each for
Bank Loan/CLO and RMBS/CMBS strategies to existing managers to be funded from Core Fixed Income
• April – May – reallocation of RMBS/CMBS fully funded; funding continues for Bank Loan/CLO portfolios
• Core Fixed Income continues to fund diversification of the total plan 17

Non Core Fixed Income Asset Class Overview
� Objective � The purpose is to enhance total return through income and capital appreciation and
provide diversification to the total investment portfolio. This allocation may be managed actively and/or passively through multiple managers in consideration of manager concentration risk.
� The Performance Objectives is to exceed the returns of a blended benchmark comprised of the Barclays US Corporate High Yield Index 50%, the JPM GBI-EM Global Diversified Index (USD Unhedged) 25%, and JPM CEMBI Broad Diversified Index 25%, net of fees over rolling five-year periods and within tracking errors as specified in the manager contracts or otherwise agreed to in writing, determined according to the specific strategies employed.
18

Non-Core Fixed Income Portfolio Management Structure
STRATEGY MANAGER PORTFOLIO BENCHMARK
Bank Loan/CLO Debt Highland Capital
Credit Suisse Leveraged Loan Index
Bank Loan/CLO Debt Guggenheim Credit Suisse Leveraged Loan Index
RMBS/CMBS Voya Investment Management (formerly ING Investment Mgmt)
33% Barclays US Agg Corp Index and 67% Barclays US Corp High Yield Index
RMBS/CMBS Ellington Management Group 33% Barclays US Agg Corp Index and 67% Barclays US Corp High Yield Index
19
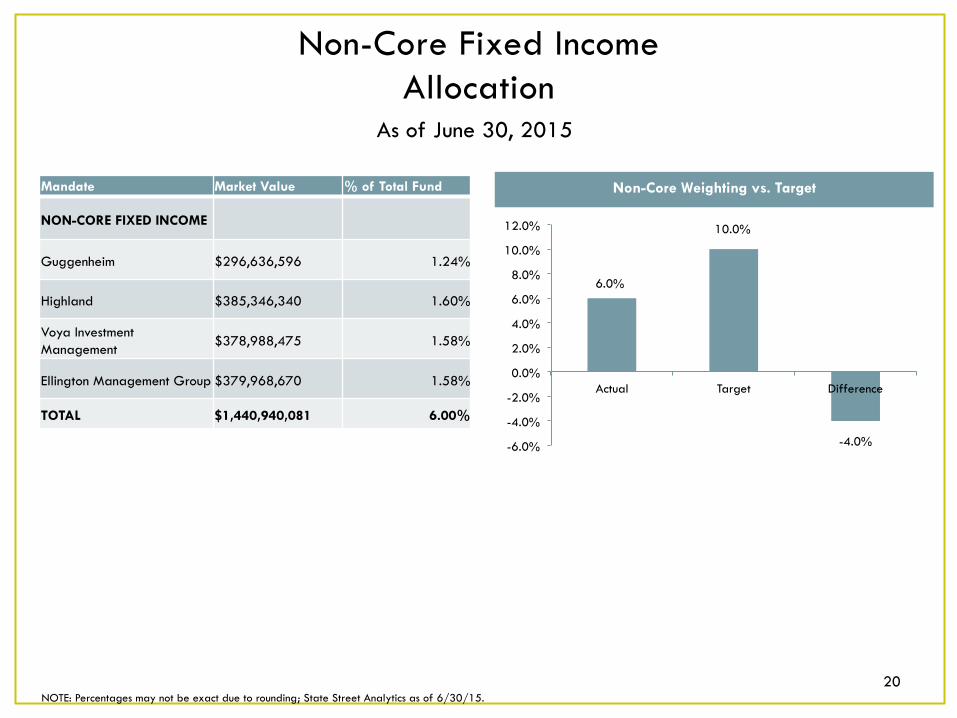
Non-Core Fixed Income Allocation
As of June 30, 2015
NOTE: Percentages may not be exact due to rounding; State Street Analytics as of 6/30/15. 20
Mandate Market Value % of Total Fund
NON-CORE FIXED INCOME
Guggenheim $296,636,596 1.24%
Highland $385,346,340 1.60%
Voya Investment Management $378,988,475 1.58%
Ellington Management Group $379,968,670 1.58%
TOTAL $1,440,940,081 6.00%
6.0%
10.0%
-4.0% -6.0%
-4.0%
-2.0%
0.0%
2.0%
4.0%
6.0%
8.0%
10.0%
12.0%
Actual Target Difference
Non-Core Weighting vs. Target

Non-Core Fixed Income Pacing Plan Update
21
Year Pacing Plan Update
2012 • August – Board approved segregating Non-Core Fixed Income from Core Fixed Income and making it a separate asset classes for better transparency and control. Board also approved 10% target allocation to Non-Core in conjunction with the Asset Allocation study.
2013 • March – Educational session presented to Board (Intro to Non Core) • June – Board approved Non-Core Fixed Income allocation and authorized manager
search for the Bank Loan/CLO strategy • September – Board approved Manager selections for Bank Loan/CLO strategy • December – Board approved 2014 Pacing Plan, including a manager search for the
RMBS/CMBS strategy
2014 • May – Board approved increasing the sector allocation limit from 25% to 40% of the Non-Core Fixed Income asset class. Board also approved manager selections for RMBS/CMBS strategy.
• December – Board approved Pacing Plan, including a manager search for Emerging Market Debt (EMD) Managers
2015 • February – Emerging Market Debt Manager search completed • March – Board approved reallocating previously approved allocation of $250M each
for Bank Loan/CLO and RMBS/CMBS strategies to existing managers • May – Board approved Emerging Market Debt Manager recommendations • June- Direct Lending Manager search in process; to be presented at December meeting

22
Real Estate
Real Estate Asset Class Overview
� Objective � To enhance total return and provide diversification to the overall investment portfolio. � Due to the illiquid and cyclical nature of the real estate asset class, Staff and the Real Estate
Investment Consultant recommend that the target allocation be invested over a multi-year period in order to avoid considerable vintage year risks.
� Performance Objective � Long term performance objective is a real rate of return (adjusted for inflation) of five
percent (5%) net of investment management fees. � The real estate portfolio is expected to generate returns net of all fees and expenses, in
excess of their respective indices, over rolling five year investment time horizons.
23
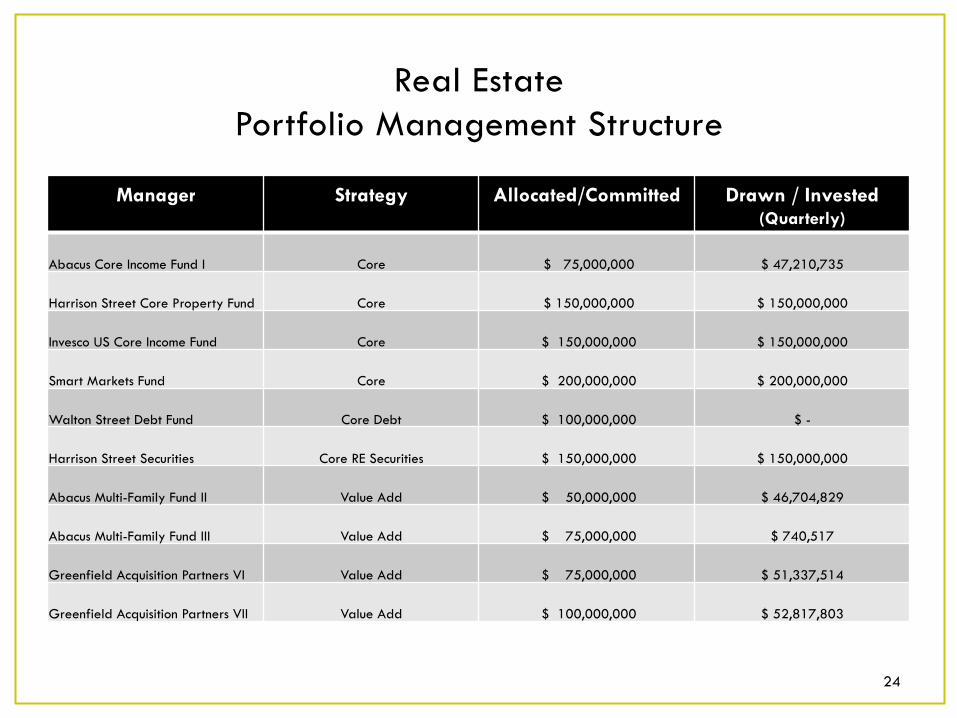
Real Estate Portfolio Management Structure
Manager Strategy Allocated/Committed Drawn / Invested (Quarterly)
Abacus Core Income Fund I Core $ 75,000,000 $ 47,210,735
Harrison Street Core Property Fund Core $ 150,000,000 $ 150,000,000
Invesco US Core Income Fund Core $ 150,000,000 $ 150,000,000
Smart Markets Fund Core $ 200,000,000 $ 200,000,000
Walton Street Debt Fund Core Debt $ 100,000,000 $ -
Harrison Street Securities Core RE Securities $ 150,000,000 $ 150,000,000
Abacus Multi-Family Fund II Value Add $ 50,000,000 $ 46,704,829
Abacus Multi-Family Fund III Value Add $ 75,000,000 $ 740,517
Greenfield Acquisition Partners VI Value Add $ 75,000,000 $ 51,337,514
Greenfield Acquisition Partners VII Value Add $ 100,000,000 $ 52,817,803
24

Real Estate Portfolio Management Structure, Cont.
Manager Strategy Allocated/Committed Drawn / Invested (Quarterly)
Miller Global Value Add $ 75,000,000 $ 43,869,639
Rubenstein Properties II Value Add $ 75,000,000 $ 19,847,330
Stockbridge Value Fund I Value Add $ 75,000,000 $ 58,983,571
Stockbridge Value Fund II Value Add $ 75,000 ,000 $ 26,677,067
Lubert-Adler Fund VII Opportunistic $ 100,000,000 $ 25,000,000
Moorfield Real Estate Fund III *** Opportunistic $ 78,560,000 $ 9,945,668
Walton Street Opportunistic $ 75,000,000 $ 55,011,749
TOTAL $ 1,683,000,000 $ 1,084,335,979
25 *** £50MM commitment, converted to USD at month end rates (source: Bloomberg, June 2015)

Real Estate Portfolio Diversification
Source: Courtland Q12015Report
Property Type Diversification Based on Market Value Geographic Diversification Based on Market Value
26
Sector Diversification Based on Market Value

Real Estate Pacing Plan Update
27
Year Pacing Plan Update
2009 • February – Board educational session presented to Board • September – Board authorized Real Estate Consultant search
2010 • May – Board approved ORG as Real Estate Consultant • October – Board educational session presented to Board
2011 • March - Board approved selection of three managers and the 2011 Pacing Plan • June – Board educational session presented to Board (Real Estate: Fee Structures) • September – Board approved selection of four managers • December – 2012 Pacing Plan approved by Board
2012 • March – Board approved selection of four managers • December – Board approved selection of four managers and the 2013 Pacing Plan
2013 • March – Board approved selection of three managers • September – Board approved selection of four managers • December – Board approved 2014 Pacing Plan
2014 • March – Board approved selection of three managers • September – Board approved selection of five managers • December – Board authorized the Real Estate Consultant search and approved 2015
Pacing Plan.
2015 • March – Board approved Courtland as the Real Estate Consultant

28
Real Return

Real Return Asset Class Overview
Global Linkers � Objective
� Purpose is to enhance total return and provide diversification and hedge against inflation risks to the overall investment portfolio.
� Performance objective is to exceed the Barclay’s Capital World Government Inflation-Linked Bond Index Unhedged in US Dollars net of fees.
� Investment Philosophy – Colchester � Colchester has a value-oriented philosophy. The firm believes that investment should be valued
in terms of the income they will generate in real terms. � Seek to add value through high quality global sovereign bonds providing the highest real yields. � Benefits of specialization and unique use of smaller markets increase diversity and add
potentially higher return opportunities.
29
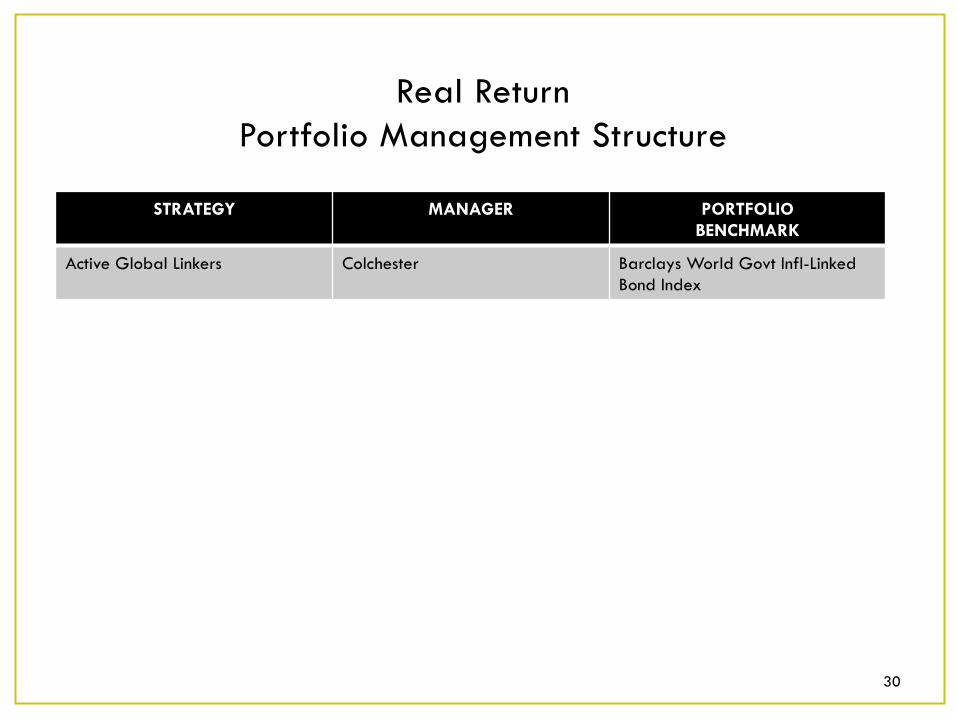
Real Return Portfolio Management Structure
30
STRATEGY MANAGER PORTFOLIO BENCHMARK
Active Global Linkers Colchester Barclays World Govt Infl-Linked Bond Index

Real Return Allocation
June 2015
31
*Source: Colchester 1. Barclays World Government Infla<on-‐Linked Bond Index USD Unhedged 2. TMRS incep<on date Feb. 1, 2011 3. Annualized returns since incep<on)

Real Return Pacing Plan Update
32
Year Pacing Plan Update
2010 • June – Board approved Real Return Interim Target Allocation and ratification of Manager Search
• September – Board approved Colchester as Real Return Manager
2011 • Fully funded through Global Inflation-Linked Bond (GILB) strategy
2014 • March - Real Return transferred from Fixed Income to Real Estate • June – Educational session presented to Board; Board authorized
Real Return Consultant search • October - Board approved selection of Albourne America, LLC., as
the Real Return Consultant • December – Educational session presented to the Board
2015 • March - The contract with Albourne America was successfully executed

33
Absolute Return
Absolute Return Asset Class Overview
� Objective � Purpose is to diversify equity and credit market risk by targeting hedge fund return streams
that are independent of the directionality of the broad stock and bond markets. The ARS portfolio will be invested in a wide variety of hedge fund strategies, with specific constraints on overall portfolio risk and individual manager exposure.
� Performance objective is to exceed the benchmark, defined as the HFRI Fund of Funds Index, net of fees, and to earn in excess of cash (90-day Libor) plus 5% on an ongoing rolling 5-year period.
� Investment Philosophy � Predicated on manager skill in:
� Rotating (long/short trading) market factors based on valuation � Navigating less liquid, non public and opaque markets � Navigating special situations � Predicting and capturing market trends
� Accordingly, ARS is not an “asset class” (or market sector)
34
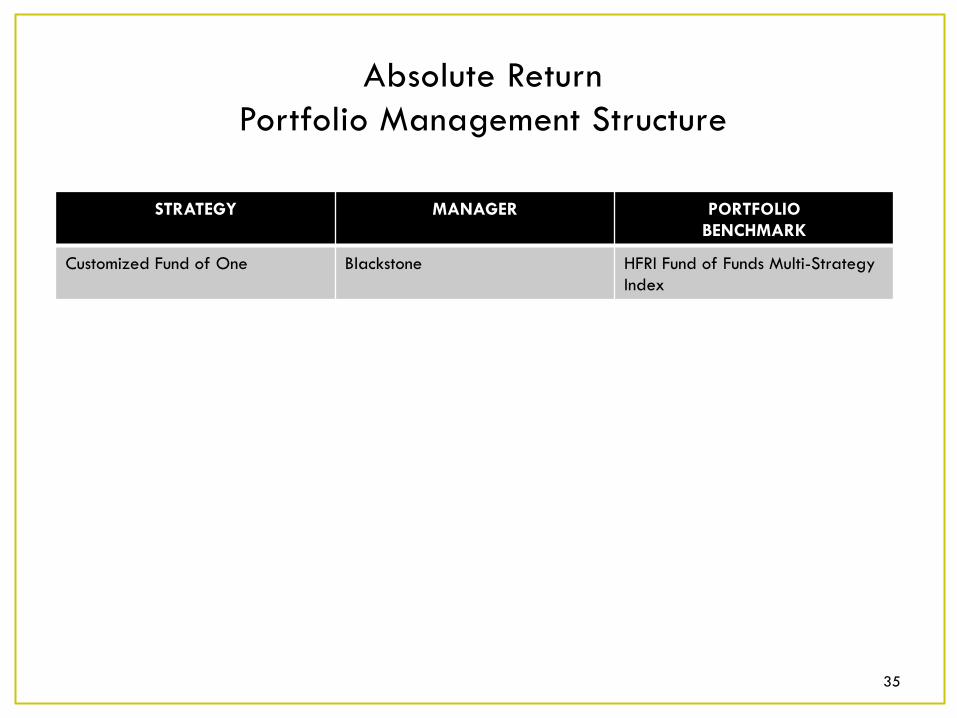
Absolute Return Portfolio Management Structure
35
STRATEGY MANAGER PORTFOLIO BENCHMARK
Customized Fund of One Blackstone HFRI Fund of Funds Multi-Strategy Index

Current BAAM Allocation (Strategy Exposures)
Equity 24%
Credit 23% Multi-Strat
18%
Macro/CTA 16%
Commodities 4%
Special Situations
13%
Cash 2%
Aggregated Manager Exposures
Source: BAAM one month lag
36
Absolute Return Pacing Plan Update
37
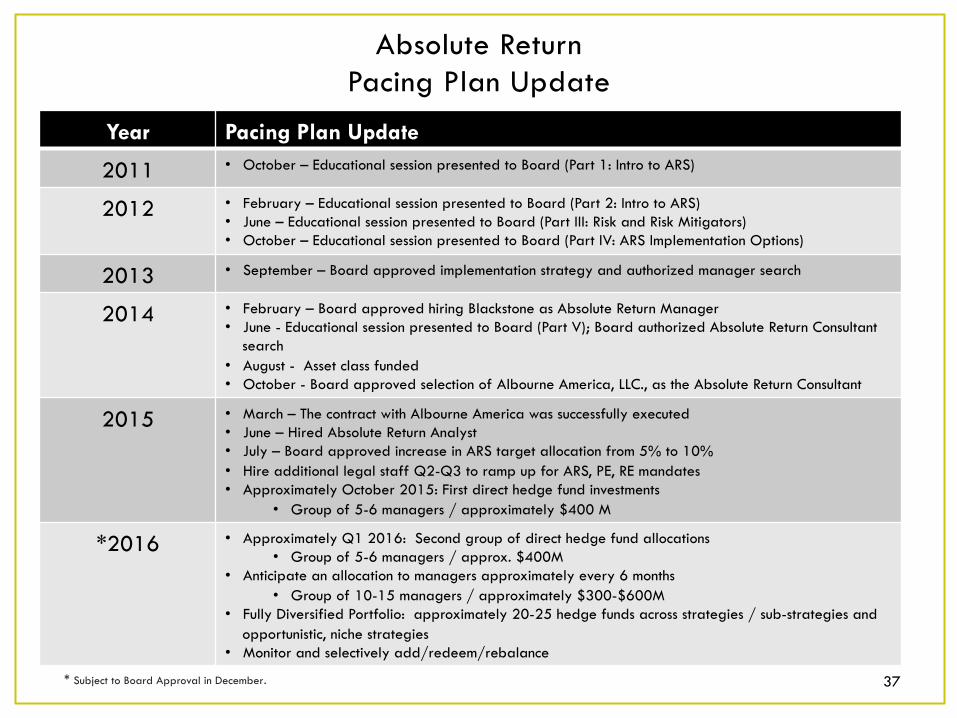
Year Pacing Plan Update
2011 • October – Educational session presented to Board (Part 1: Intro to ARS)
2012 • February – Educational session presented to Board (Part 2: Intro to ARS) • June – Educational session presented to Board (Part III: Risk and Risk Mitigators) • October – Educational session presented to Board (Part IV: ARS Implementation Options)
2013 • September – Board approved implementation strategy and authorized manager search
2014 • February – Board approved hiring Blackstone as Absolute Return Manager • June - Educational session presented to Board (Part V); Board authorized Absolute Return Consultant
search • August - Asset class funded • October - Board approved selection of Albourne America, LLC., as the Absolute Return Consultant
2015 • March – The contract with Albourne America was successfully executed • June – Hired Absolute Return Analyst • July – Board approved increase in ARS target allocation from 5% to 10% • Hire additional legal staff Q2-Q3 to ramp up for ARS, PE, RE mandates • Approximately October 2015: First direct hedge fund investments
• Group of 5-6 managers / approximately $400 M
*2016 • Approximately Q1 2016: Second group of direct hedge fund allocations • Group of 5-6 managers / approx. $400M
• Anticipate an allocation to managers approximately every 6 months • Group of 10-15 managers / approximately $300-$600M
• Fully Diversified Portfolio: approximately 20-25 hedge funds across strategies / sub-strategies and opportunistic, niche strategies
• Monitor and selectively add/redeem/rebalance
* Subject to Board Approval in December.

38
Private Equity
Private Equity Asset Class
39 Confiden6al-‐Internal Use Only
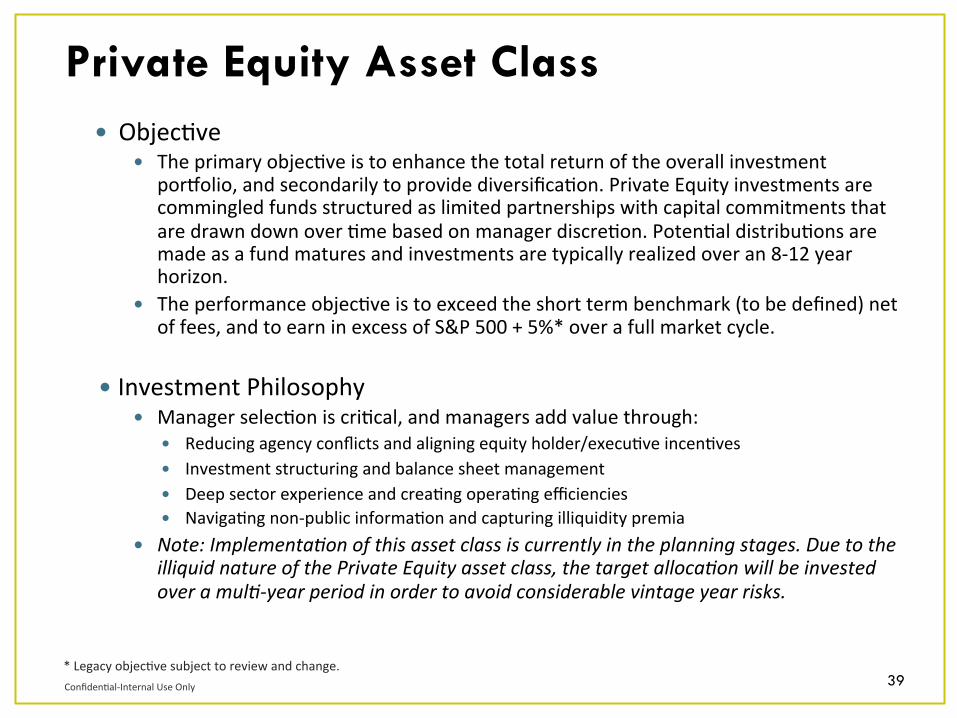
� Objec6ve � The primary objec6ve is to enhance the total return of the overall investment
porXolio, and secondarily to provide diversifica6on. Private Equity investments are commingled funds structured as limited partnerships with capital commitments that are drawn down over 6me based on manager discre6on. Poten6al distribu6ons are made as a fund matures and investments are typically realized over an 8-‐12 year horizon.
� The performance objec6ve is to exceed the short term benchmark (to be defined) net of fees, and to earn in excess of S&P 500 + 5%* over a full market cycle.
� Investment Philosophy � Manager selec6on is cri6cal, and managers add value through:
� Reducing agency conflicts and aligning equity holder/execu6ve incen6ves � Investment structuring and balance sheet management � Deep sector experience and crea6ng opera6ng efficiencies � Naviga6ng non-‐public informa6on and capturing illiquidity premia
� Note: Implementa<on of this asset class is currently in the planning stages. Due to the illiquid nature of the Private Equity asset class, the target alloca<on will be invested over a mul<-‐year period in order to avoid considerable vintage year risks.
* Legacy objec6ve subject to review and change.

Private Equity Portfolio Management Structure
40
STRATEGY MANAGER PORTFOLIO BENCHMARK
Under development
Private Equity Allocation
This Asset Class is under development.
41
Private Equity Pacing Plan Update
42
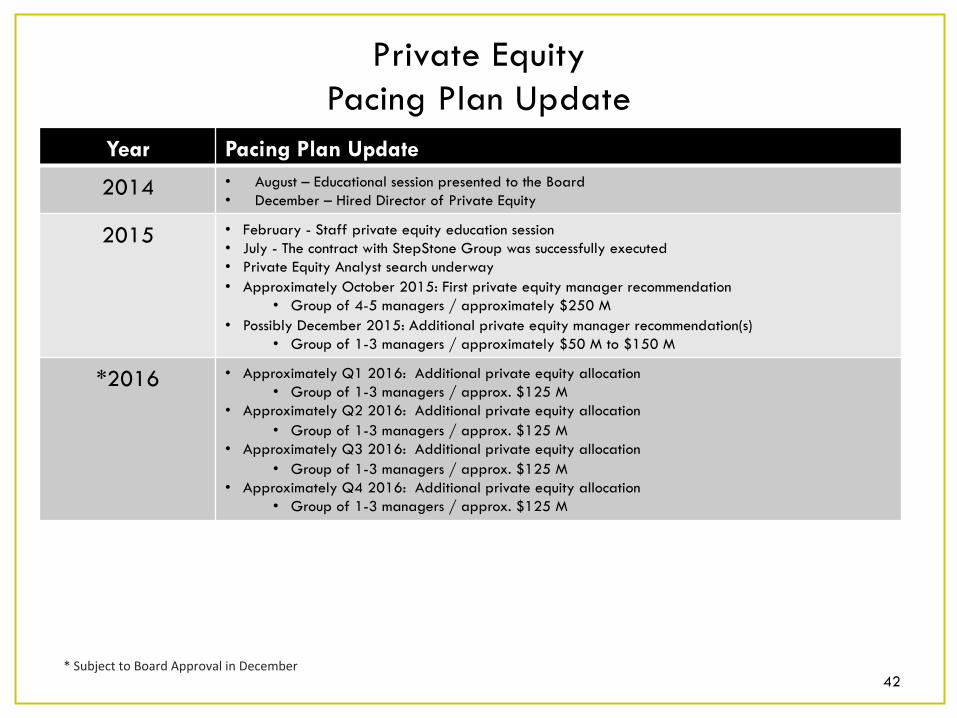
Year Pacing Plan Update
2014 • August – Educational session presented to the Board • December – Hired Director of Private Equity
2015 • February - Staff private equity education session • July - The contract with StepStone Group was successfully executed • Private Equity Analyst search underway • Approximately October 2015: First private equity manager recommendation
• Group of 4-5 managers / approximately $250 M • Possibly December 2015: Additional private equity manager recommendation(s)
• Group of 1-3 managers / approximately $50 M to $150 M
*2016 • Approximately Q1 2016: Additional private equity allocation • Group of 1-3 managers / approx. $125 M
• Approximately Q2 2016: Additional private equity allocation • Group of 1-3 managers / approx. $125 M
• Approximately Q3 2016: Additional private equity allocation • Group of 1-3 managers / approx. $125 M
• Approximately Q4 2016: Additional private equity allocation • Group of 1-3 managers / approx. $125 M
* Subject to Board Approval in December

43
Compliance
Compliance Overview
• IPS Objectives • The primary objective of Compliance is to implement a detailed compliance program which
uses a combination of daily, weekly and monthly testing of all testable parameters of the Investment Policy Statement and all Manager guidelines at the Manager, asset class and total fund level, as appropriate.
• Testing may be completed either through systematic resources (automated custodial compliance) or manually if necessary.
• Compliance personnel shall create and present a quarterly report to the Board with the results of the testing performed during each period.
44

Compliance Testing
45
Test Type State Street Tests
Internal (State Street Beta
Tests)
Total Tests
Quality/Credit Quality 27 26 53 Liquidity/Cash Management 4 0 4 Permissible/Prohibited 25 15 40 Concentration 65 52 117 Interest Rate Risk 3 0 3 Spread Risk 0 6 6
Total Number of Tests 124 99 223
� 223 separate compliance tests were run on TMRS portfolios as of June 30, 2015. All funds were in compliance with TMRS guidelines.
� The internal tests have been developed to run using State Street’s Charles River system and are currently in beta testing mode. Until tests are finalized & moved to production, the tests are run internally using Bloomberg.

Investment Guideline Compliance
June 2015
46
Policy Guidelines
Core Fixed Income
Non-Core Fixed Income
Real Return
Domestic Equities
Global Equities
Credit Quality
Liquidity/Cash Management
Permissible/Prohibited Investments
Concentration Risk
Country/Region & Currency
Issue/Issuer
Sector & Asset Type
Interest Rate Risk N/A N/A
Spread Risk N/A N/A
� 223 separate compliance tests were run on TMRS portfolios as of June 30, 2015. All funds were in compliance with TMRS guidelines.

47
Risk Management

Risk Management Overview June 2015
• Objective • Identification, evaluation and management of all risks related to investment results.
• Responsibilities: • Defining the policy and strategy for investment risk management • Building a risk aware culture within the organization • Analytical tools for investment risk management • Reporting on investment risk to the Board
• Risk Report: Q2 2015 • In this report we introduce a slightly expanded breakdown of Active Risk (Tracking Error) sources
• Pending Policy Allocation Decisions • Investment Allocation Decisions • Strategy Benchmark Decisions • Active Manager Decisions
• This report also introduces the new Strategic Target Allocation (adopted July 2015) • Tracking error given the new Strategic Target Allocation has increased but is still within our 2%
Active Risk Budget • Projected short term volatility continues to be lower than our strategic volatility assumptions
48

Total Fund Risk June 2015
49 NOTES: 1. RVK forward -looking risk assumptions as presented in the July 2015 Asset Allocation Study 2. Assumes a Real Return asset class benchmark of 100% Global Inflation Linked Bonds until the new Policy Benchmark is implemented
BarraOne – One year outlook RV Kuhns
Portfolio Policy Benchmark Long Term Assumptions1
Weight (%) Risk Contribution
to Total Risk Weight
(%) Risk Contribution to Total Risk
Benchmark
Risk Total 100.0% 6.40 100.0% 100.0% 7.26 100.0% 11.4 Cash Assets 0.2% 0.00 0.0% 0.0% 0.00 0.0% 3.0 Equity - US 27.7% 12.81 50.9% 17.5% 12.86 27.4% 17.8 Equity - Non US 18.3% 14.31 37.0% 17.5% 14.55 32.5% 20.6 Core Fixed Income 35.3% 4.09 3.8% 10.0% 4.13 0.3% 6.0 Non-Core Fixed Income 4.6% 4.64 0.9% 20.0% 6.50 14.7% 11.7 Real Estate 4.8% 7.60 3.5% 10.0% 12.38 7.9% 14.6 Real Return 4.2% 5.77 1.9% 10.0% 6.74 4.4% 8.8² Absolute Return 4.9% 4.04 1.9% 10.0% 4.02 3.5% 9.5 Private Equity 0.0% 0.00 0.0% 5.0% 15.73 9.4% 26.0
Extreme or persistent differences may cause us to rethink our long term assumptions (RVK makes small adjustments every year) otherwise it just provides background information as to the state of the markets.
• Both the “One Year Outlook” and “Long Term Assumption” risks are higher for the new Policy Benchmark.
• Projected short term (one year) volatility continues to be significantly lower than our strategic (long term) volatility assumptions
We show total fund risk to see what current market risk levels are relative to our long term assumptions.
-20.0 -10.0 0.0 10.0 20.0 30.0
Return
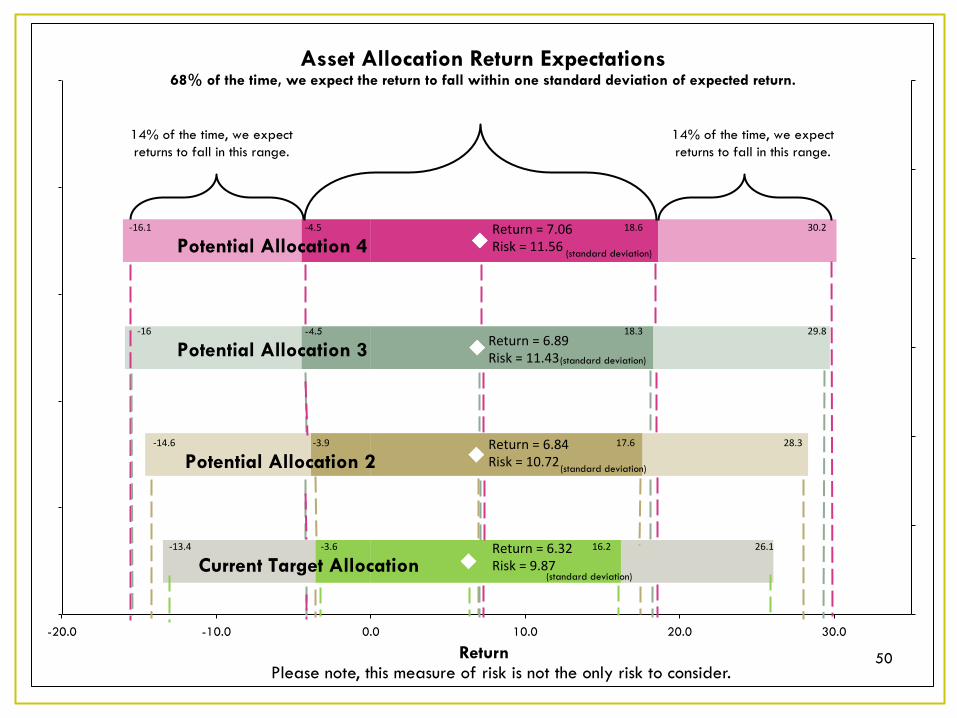
Asset Allocation Return Expectations
Return = 6.32 Risk = 9.87
Return = 6.84 Risk = 10.72
-‐3.9 17.6
-‐3.6 16.2
68% of the time, we expect the return to fall within one standard deviation of expected return.
14% of the time, we expect returns to fall in this range.
14% of the time, we expect returns to fall in this range.
Potential Allocation 3
Current Target Allocation
-‐14.6 28.3
-‐13.4 26.1
(standard deviation)
(standard deviation)
Return = 7.06 Risk = 11.56 (standard deviation)
Return = 6.89 Risk = 11.43 (standard deviation)
Potential Allocation 2
Potential Allocation 4
-4.5 -‐16 18.3 29.8
-‐16.1 18.6 30.2 -‐4.5
50 Please note, this measure of risk is not the only risk to consider.

Risk Management Update on What We Are Working On
June 2015
51
Topic Update Internal Reporting Providing internal reports analyzing active risk being taken by our public market (stocks and bonds)
managers.
Specialized Risk Analysis
Applying and further developing specialized risk analysis solutions for Alternative Asset Class investments
Performance Attribution Performance Attribution allows us to better distinguish manager skill from luck by breaking down (attributing) monthly return to specific manager decisions. Presented implemented analytics and reports for Active Equity and Fixed Income portfolios in August. Expect to start providing regular monthly analytics beginning in September.
Security Level Data Management
A daily security level portfolio data management solution is necessary to support risk and performance analytics. Have implemented the initial version. Currently being used to provide daily holdings and transaction data to the performance attribution system.
Performance Reporting Expanding Performance Reporting procedures and methodology to incorporate new asset types, new investment vehicles, and increased transparency. Assessing a move from monthly close of portfolio accounting books by our custodian to a daily close and adding un-lagged performance reporting which shows returns for all accounts properly aligned with the time periods when they were earned1.
Quantitative Portfolio Analysis
Monitoring advances in quantitative portfolio analysis to ensure that risk and performance analysis remain current at TMRS
1. Private market asset classes, like Real Estate, are priced quarterly with a quarter lag due to use of appraised value pricing in the absence of market prices. For some asset class funds in less liquid public markets this is also true, although to a lesser extent and the lag is only one month

52
QUESTIONS?