overview of pwp in sub-saharan africa · overview of public works programmes in sub-saharan africa...
TRANSCRIPT

Overview of Public Works Programmes in Sub-Saharan Africa
30th September 2009
Report prepared by Anna McCord with Rachel Slater
* Disclaimer: The views presented in this paper are those of the authors and do not necessarily represent the views of the World Bank.
Overseas Development Institute 111 Westminster Bridge Road
London SE1 7JD UK
Tel: +44 (0)20 7922 0300 Fax: +44 (0)20 7922 0399
www.odi.org.uk
ODI Overview of Public Works Programmes in Sub-Saharan Africa
ii
Acknowledgements This report was prepared for Carlo del Ninno and William Wiseman of the World Bank Social Protection Network. Many thanks are due to Carlo for his comments on an earlier version of this report, and also to the indomitable team of ODI researchers who carried out the web research and detailed narrative analysis to populate the data base on which section two of the report is based, namely Gina Bergh, Raania Rizvi, and Fiona Burtt and to Maia Stead for her management of the regional PWP data base and quantitative analysis. Finally, thanks also to Jen Morgan for diligently formatting the report. The report draws extensively on a major piece of work reviewing public works programming in Africa (McCord, 2009a) to which we refer the reader seeking more detail on many of the issues set out below. The authors apologise for the extent of self-referencing in this report. This is an artefact of the under-researched nature of the role of public works in relation to social protection in sub-Saharan Africa, the scarcity of literature on this subject, and the efforts of the Public Works Research Project (PWRP) in the Southern Africa Labour and Development Unit (SALDRU) at the University of Cape Town to address this scarcity.

McCord & Slater
iii
Contents Acknowledgements ........................................................................................................... ii Executive Summary ......................................................................................................... vii Introduction ........................................................................................................................ 1
Structure ........................................................................................................................................ 1 Part One: Setting Out a Public Works Programme Typology ........................................ 2
Type A Programmes ..................................................................................................................... 2 Type B Programmes ..................................................................................................................... 3 Type C Programmes ..................................................................................................................... 3 Type D Programmes ..................................................................................................................... 3 Discussion of the Typology in Sub-Saharan Africa ....................................................................... 4
Part Two: An Overview of PWPs in Sub-Saharan Africa ................................................ 6
Overview of the Database ............................................................................................................. 6 Data constraints ......................................................................................................................................... 7 Future data requirements .......................................................................................................................... 7
The Nature of PWPs in Sub-Saharan Africa ................................................................................. 8 Cash for Work or Food for Work? .............................................................................................................. 9 Programme objectives ............................................................................................................................... 9
Programme Financing ................................................................................................................. 11 Budgets .................................................................................................................................................... 11 Funding sources ...................................................................................................................................... 11
Design and Implementation ......................................................................................................... 12 Programme .............................................................................................................................................. 12 Implementing agencies ............................................................................................................................ 13 Coverage ................................................................................................................................................. 14 Complementary interventions .................................................................................................................. 15 Targeting .................................................................................................................................................. 15 Employment and payment modalities ...................................................................................................... 17 The nature of employment ....................................................................................................................... 20 Cost-effectiveness ................................................................................................................................... 21
Conclusion ................................................................................................................................... 22 Part Three: Analysis of the Cost-Effectiveness and Targeting Efficiency of PWPs .. 23
Cost-Effectiveness ...................................................................................................................... 23 Calculating PWP cost .............................................................................................................................. 24 Quantifying the amount of work created .................................................................................................. 25 Cost per day of employment .................................................................................................................... 26 Percentage of total cost to labour ............................................................................................................ 27 Cost of transferring one dollar ................................................................................................................. 27 Cost-effectiveness ratio analysis ............................................................................................................. 30 Application of the cost-effectiveness ratio model in sub-Saharan Africa ................................................ 31
The Impact of the PWP Wage on Household Income ................................................................. 32 Household income ................................................................................................................................... 33 The net value of the wage benefit ........................................................................................................... 34 Net PWP wage as % of total household income ..................................................................................... 35 Opportunity costs in addition to income forgone ..................................................................................... 36
The Impact on Poverty ................................................................................................................ 36 The impact of PWPs on income poverty ................................................................................................. 36 Income poverty conclusion ...................................................................................................................... 38 The impact of PWPs on non-income indicators of poverty ...................................................................... 39 Impact conclusion .................................................................................................................................... 39

ODI Overview of Public Works Programmes in Sub-Saharan Africa
iv
Targeting Efficiency ..................................................................................................................... 39 Incidence data ......................................................................................................................................... 39 PWP access: targeting and rationing practices ....................................................................................... 40 Targeting evidence .................................................................................................................................. 40 The characteristics of PWP participants resulting from different targeting mechanisms ........................ 41 Propensity score matching to assess PWP incidence ............................................................................ 42
Case Study Implications: Cost, Targeting and Impact on Household Income ............................ 45 Evidence Gaps ............................................................................................................................ 46
The value of assets created .................................................................................................................... 47 Programme impact over time .................................................................................................................. 48
Cost and Targeting Efficiency Conclusions ................................................................................. 48 Part Four: Public Works and the Current Social Protection Discourse ...................... 49
Public Works in the African Discourse ........................................................................................ 49 Reasons for the popularity of PWPs in the region ................................................................................... 49 Limitations to PWP programming ............................................................................................................ 50
Conclusion ................................................................................................................................... 51 Annex 1: PWP Database Data Entry Categories ........................................................... 53 Annex 2: Payment Modality by PWP Type ..................................................................... 54 Annex 3: Major PWP Funder by PWP Type ................................................................... 55 Annex 4: Relation to Minimum Wage ............................................................................. 56 Annex 5: Payment Frequency ......................................................................................... 57 Annex 6: Hours Worked Per Day .................................................................................... 58 Annex 7: Days Worked Per Week ................................................................................... 59 Annex 8: The Limited Scale of PWP Programming in Sub-Saharan Africa ................ 60 References ....................................................................................................................... 61

McCord & Slater
v
List of Tables, Figures and Boxes Table 1: Sub-Saharan Africa Countries included in the database .................................................... 6 Table 2: The cost of transferring US$1 through PWPs (Literature Review & Synthesis) ................ 28 Table 3: The cost-effectiveness ratio in selected South Africa PWP and international comparators ........................................................................................................................................................ 32 Table 4: Value of gross PWP wage as % of household income during employment period........... 34 Table 5: PWP wage as % of household income under different assumptions ................................ 35 Figure 1: PWP Type .......................................................................................................................... 8 Figure 2: CFW/FFW by Programme Type ........................................................................................ 9 Figure 3: Objectives of programme ................................................................................................. 10 Figure 4: Objectives of programme (type A) ................................................................................... 10 Figure 5: Objectives of programmes (type C) ................................................................................. 11 Figure 6: Type of funding agency ................................................................................................... 12 Figure 7: Major PWP funders .......................................................................................................... 12 Figure 8: Programme duration in years .......................................................................................... 13 Figure 9: Type of implementing agency .......................................................................................... 14 Figure 10: Complementary programme components ..................................................................... 15 Figure 11: Targeting mechanisms adopted .................................................................................... 16 Figure 12: Target groups ................................................................................................................ 16 Figure 13: Form of wage ................................................................................................................. 17 Figure 14: Payment modalities in Type A and Type C programmes .............................................. 18 Figure 15: The PWP age and the minimum wage .......................................................................... 18 Figure 16: Value of wage paid relative to GNI per capita ............................................................... 20 Figure 17: Labour intensity of PWPs (labour costs as a % of total cost) ........................................ 21 Figure 18: Western Cape cost/workday and labour percentage of total cost (Rands) .................... 26 Figure 19: Poverty impact of Gundo Lashu, Type C ....................................................................... 37 Figure 20: Poverty impact of Zibambele, Type B ............................................................................ 38 Figure 21: Income distribution for matched and census households (type C) ................................ 43 Figure 22: Income distribution for matched and census households (type B) ................................ 43 Figure 23: Cumulative distribution of census income & PWP matched income (type C) ................ 44 Figure 24: Cumulative distribution of census income & PWP matched income (type B) ................ 44 Box 1: PWP Typology ....................................................................................................................... 4 Box 2: Overview of South African Case Study Programmes .......................................................... 23
ODI Overview of Public Works Programmes in Sub-Saharan Africa
vi
List of Acronyms AFRICATIP Association Régionale des Agences d’Exécution des Travaux d’Intérêt Public AGETIP Agence d’Exécution des Travaux d’Intérêt Public contre le sous-emploi ALMP Active Labour Market Policy CFW Cash for Work CBPWP Community Based Public Works Programme DFID Department for International Development (UK) ECCD Early Childhood Care and Development EGS Employment Guarantee Scheme EIIP Employment Intensive Investment Programme ELR Employer of Last Resort EPWP Expanded Public Works Programme ERRA Ethiopian Rural Roads Authority EU European Union FFW Food for Work FFT Food for Training FGT Foster-Greer-Thorbecke GEP Government Employment Programme HIMO High Labour Intensive Works HIV/AIDS Human Immune Virus/Acquired Immune Deficiency Syndrome IFW Inputs for Work ILO International Labour Organisation ILTPWP Improving Livelihoods through Public Works Programme ISRDS Integrated Sustainable Rural Development Strategy LIC Low-Income Country MASAF Malawi Social Action Fund MEGS Maharashtra Employment Guarantee Programme MIC Middle Income Country NGO Non Governmental Organisation NREGA National Rural Employment Guarantee Act OECD Organisation for Economic Cooperation and Development PIC Poverty Incidence Curve PSM Propensity Score Matching PSNP Productive Safety Nets Programme SALDRU Southern Africa Labour and Development Research Unit, University of Cape Town SRM Social Risk Management TASAF Tanzania Social Action Fund

McCord & Slater
vii
Executive Summary This report provides an overview of Public Works Programme (PWP) activity in sub-Saharan Africa, drawing on a specially created database of 167 programmes across the region, original survey work and a literature review. The overall objective of the work is to contribute to the understanding of the role and possible use of PWPs in the region, learning from experiences in Africa and gaining insights from successful programmes implemented internationally. The report first sets out a typology of PWPs which is adopted as the basis for analysis throughout the report. Next the characteristics of current PWPs in sub-Saharan Africa are explored. The programmes were found to be largely donor funded (83%), predominantly food for work (60%), and are equally divided between those whose primary objective is the provision of safety nets or social protection at a household level (type A), and those for whom the creation of infrastructure using labour intensive techniques in order to promote aggregate employment is primary (type C). Only six programmes (4%) were identified which offer some form of ongoing income insurance (type B), along the lines of the Employment Guarantee Scheme programmes found in South Asia, such as the (NREGA). The limited availability and poor quality of primary data on programme cost, outputs, outcomes and the socio-economic profile of programme participants limit the potential for addressing questions of cost, targeting or impact in the region. The need for improved data and reporting consistency across programmes is highlighted. A review is made of the available literature, and survey data on two programmes in South Africa is used to explore key questions relating to targeting and impact in detail. The key findings are that programme design can reduce exclusion errors, but that PWP participation may not reduce headcount poverty, or significantly reduce income or other aspects of poverty unless it is well targeted. Finally the popularity of PWPs in the social protection discourse in the region is discussed. A critical policy misalignment highlighted, whereby programmes offering short term employment are implemented with the objective of providing social protection or promoting graduation in situations of chronic poverty where they are not effective. The report concludes that while short term PWP employment can play a vital role to promote consumption smoothing in acute situations of labour markets disruption, the social protection function of PWPs in sub-Saharan countries experiencing chronic poverty and unemployment is likely to be limited unless South Asian style programmes guaranteeing employment are implemented. Whether such programmes are fiscally, or administratively feasible remains an open question.


McCord & Slater
1
Introduction In the context of recent food-fuel price and financial crisis there has been a renewed interest in the use of Public Works Programmes (PWPs). A recent review paper (del Ninno, Subbarao and Milazzo, 2009) found that in addition to being used effectively to in response to either a one-time large covariate shock, or in respect to repeated shocks, PWPs in low income countries, also have been used often with an antipoverty or poverty reduction objective. However, information on the use of PWPs in Africa and its possible role to reduced poverty and to respond to the latest financial crises is still relatively scarce. In this report, a review of PWPs is carried out with a specific focus on sub-Saharan Africa, drawing on a literature review, original survey work, and a database of 167 PWPs across the region. The overall objective of the work is to contribute to the understanding of the role and possible use of PWPs in the region, learning from experiences in Africa and gaining insights from successful programmes implemented internationally. The intention is to identify the key components of good programme design, and lessons for successful implementation.
Structure This report is comprised of four parts; the first sets out a typology of PWPs which is adopted as the basis for analysis throughout the report, the second examines the characteristics of existing PWPs in sub-Saharan Africa based on a data base of programme information, the third explores the questions of cost and targeting effectiveness, drawing on more detailed programme information from the region from a selected number of programmes including detailed survey work carried out on two PWPs in South Africa, and the fourth briefly discusses the role of PWP in the current social protection discourse among donors and governments in the region, and sets out key challenges for future programming.
ODI Overview of Public Works Programmes in Sub-Saharan Africa
2
Part One: Setting Out a Public Works Programme Typology Before the characteristics of PWPs in the sub-Saharan region are interrogated in detail, a typology of public works is presented, which will be used to facilitate analysis and discussion throughout the report. While the term ‘Public Works’, (and in some instances ‘workfare’), is widely used in the social protection and safety nets literature, there is no common definition, and many widely differing programmes share the generic PWP terminology, despite considerable in programme variation and design. Despite this heterogeneity, the term PWP is frequently used without adequate clarification of the characteristics of the particular programme under discussion, resulting in conceptual confusion and programme design incongruities. The adoption of common terminology without a shared understanding of the meaning exacerbates the challenge of appropriate policy choice and undermines the quality of PWP design, particularly in sub-Saharan Africa. In order to address this confusion, a basic typology of PWP interventions is used in this report. The typology is based on a review of over 200 programmes internationally, and the associated literature (McCord, 2008a). This typology sets out four distinct forms of PWP, defined on the basis of core design features and primary objectives. The four types of PWP are i) those offering short-term employment, and ii) government employment programmes offering some form of employment guarantee, iii) those promoting labour intensification of government infrastructure spending, and iv) programmes which enhance supply-side characteristics, promoting ‘employability’. While some programmes may include aspects of more than one of these types and often have a range of objectives1, PWPs tend to have a primary identity which enables them to be located in one of the four categories, and this primary identity tends to have a significant influence on programme design, and the aspects of programme activity which are prioritised. The four types of programme are discussed below in relation to a review of current PWP programming in sub- Saharan Africa and internationally.
Type A Programmes Type A programmes provide a single short episode of temporary employment, and are particularly appropriate as a response to temporary disruptions to the labour market resulting in acute labour demand shortage. These programmes are primarily concerned with the provision of safety nets, and have been implemented on a large scale in East Africa as response to livelihoods disruption as result of conflict and drought. These programmes tend to offer basic ‘risk coping’ or ‘protective’ forms of social protection, and the wage transfer objective dominates objectives relating to the provision of assets, which may in many instances be essentially a ‘make-work’ activity, carried out primarily to satisfy the work conditionality. This type of programme is often considered to be synonymous with the generic term PWP, and is typical of PWPs currently implemented in many sub-Saharan African countries, examples being the PWPs included in Social Fund programmes in Malawi and Tanzania. Such programmes are typical of those implemented widely in southern Asia, in response to natural disasters such as floods or typhoons, which temporarily affect formal and informal household income earning opportunities, allowing consumption smoothing for a temporary period until the labour market returns to normal.
1 For the range of possible PWP objectives associated with the typology, see McCord 2008a.

McCord & Slater
3
Type B Programmes Type B programmes are government employment programmes (GEPs) in which the state acts as an ‘employer of last resort’ (ELR) providing employment on a sustained or repeated basis. Employment may be provided either directly by government or indirectly through private sector employers or civil society organisations under contract, and may be created in any sector; this form of PWP has the scope to create employment outside conventional sectors, and in the region employment as Home Based Carers for those with HIV/AIDS and nursery carers in the Early Childhood Care and Development (ECCD) sector have been included within these programmes. A subset of GEPs, in which the state guarantees employment on demand, are known as Employment Guarantee Schemes (EGSs), which provide non-contributory income insurance through guaranteed employment for all who seek it. The best known examples of such PWPs are to be found in South Asia, with the Maharashtra Employment Guarantee Scheme (MEGS) (Dev 1995), and the recently launched NREGP in India being the best documented (India: Department of Rural Development 2007).2 Such programmes are rare in sub-Saharan Africa, although the public works component of the national Productive Safety Nets Programme (PSNP) in Ethiopia is similar inasmuch as it aims to address the regular disruption of livelihoods which occurs as the result of persistent drought by offering a period of employment each year for up to five years for participating households. While the extent to which employment can be offered to all seeking it in this case is constrained in practice, particularly in years of serious drought, by both budgetary and capacity constraints, the concept underlying the programme however is consistent with that of the South Asian programmes, inasmuch as it is based on a recognition that it is the responsibility of the state to provide large scale employment to populations in need on an ongoing basis.
Type C Programmes Type C programmes aim to increase the labour intensity of construction sector activity in order to increase aggregate labour demand. These programmes are implemented primarily in the infrastructure sector, and entail the specification of labour-based techniques in order to promote the absorption of increased amounts of labour for each unit of asset constructed. The work of the Ethiopian Rural Roads Authority (ERRA), the AGETIP (Agence d’Exécution des Travaux d’Intérêt Public contre le sous-emploi) in Senegal, related AFRICATIP-supported programmes in Western Africa, and the ILO’s Employment-Intensive Investment Programmes (EIIPs) are typical of this type of intervention, promoting the use of labour-based techniques in the infrastructure sector. While these programmes are primarily aimed at infrastructure provision, they also confer basic short-term ‘risk coping’ or ‘protective’ social protection benefits, through the wage stream which terminates at the point of programme completion, and on average this type of programme offers employment for a four month period. Such programmes also frequently entail the promotion of small contractor development, in order to establish a cadre of entrepreneurs able to manage ongoing infrastructure provision contracts in a labour-intensive way. Such programmes do not necessarily require additional funding, but rather a shift in the factor intensity of existing expenditure to increase employment.
Type D Programmes Type D programmes aim to addresses supply-side constraints to employment, and promote the ‘employability’ of workers by providing workplace experience and skills formation among the unemployed. Such programmes are most appropriately implemented when the key constraint to
2 Under the NREGA in India, employment is defined as a constitutional right, and the state offers a guaranteed number of days of employment each year to one unemployed work seeker from any rural household seeking employment. The worker is employed for a maximum of 100 days each year on the creation of community assets and is paid the minimum wage.

ODI Overview of Public Works Programmes in Sub-Saharan Africa
4
employment is identified to be lack of skills rather than lack of employment opportunities per se. These programmes have been adopted principally in Organisation of Economic Cooperation and Development (OECD) countries at times of high frictional unemployment, i.e. when the fundamental problem has been skills shortages in the labour pool, and are rare in sub-Saharan Africa. This type of programme assumes that sufficient numbers of jobs are available for the unemployed if they are adequately retrained and supported, and is associated with a political concern to encourage the unemployed to take up available work opportunities rather than to provide them with unemployment benefits, a policy described as labour ‘activation’ (for a critique of this approach see Meth, 2009). This approach will confer social protection benefits and promote aggregate employment only if the underlying assumption – that sufficient employment is available to absorb a significant number of the unemployed if they acquire additional skills and experience – holds true. Otherwise, such initiatives are likely to result in worker substitution within the existing labour force rather than in significant increases in aggregate employment. Programmes to enhance employability by addressing supply-side problems tend to be components of broader Active Labour Market Policies (ALMP), rather than social protection policies, and their success is contingent on their ability (a) to successfully transfer skills to participants, and (b) to identify skills on the supply side which match skills in demand in the economy. The feasibility of such approaches is open to question in developing countries facing structural rather than frictional unemployment (see for example Karuri et al., 2007 with regard to South Africa). These four types are summarised in Box 1 below, and are referred to types A, B, C and D in this report, for the sake of brevity. Box 1: PWP Typology Type A PWPs offering a single short-term episode of employment with a safety net or social protection objective Type B Programmes offering repeated or ongoing employment opportunities as a form of income insurance, which in some cases entails a guarantee of employment for all who seek it Type C Programmes promoting the labour intensification of government infrastructure to promote aggregate employment Type D Programmes enhancing employability by improving labour quality
Discussion of the Typology in Sub-Saharan Africa While type A programmes have essentially microeconomic objectives relating to a short term safety net function at household level, type B programmes offer more sustained social protection in the form of income insurance which is more appropriate in contexts of covariate risk, resulting for example from structural unemployment and chronic poverty. However, this critical distinction is not widely reflected in programme type choice in Africa, and type A programmes tend to be implemented in contexts of chronic poverty and unemployment, despite the fact that they are appropriate in situations of acute labour market disruption. Only a handful of PWP in sub-Saharan Africa are type B, offering the kind of support provided under the NREGA in India, including the Zibambele case study in South Africa, discussed in section three below. Type B programmes address the right to employment on the basis of an assumption that the state is obliged to provide support to the working age poor through large scale programming, while type A programmes provide support only to an arbitrary subset of those in need, and for a limited period.3
3 It is interesting to note that NREGA programmes have been visited by African officials working on the design of PWPs, but most have failed to incorporate the most fundamental concept underlying the NREGA in programme design – the

McCord & Slater
5
Type C, labour intensification, programmes are a very different form of PWP which focuses primarily on increasing aggregate employment at the macro level, rather than social protection outcomes. Social protection benefits under such programmes are limited to short term consumption smoothing, as in type A above. However it is generally assumed that such programmes will have a beneficial potential social protection impact, and this assumption forms part of the rationale for the adoption of such programmes, which promote a shift in the factor intensity of the construction industry, and is used to allay concerns regarding any cost or efficiency premia this may imply. An example of this is Phase 2 of the national EPWP in South Africa, which is a type C programme, but is presented nationally as the primary instrument of social protection for the working age poor, despite the short duration of employment provided and the chronic nature of the underlying labour market crisis. Type D programmes are different again, being predominantly linked aspirations of labour market ‘activation’, and the removal of participants from dependency on ongoing social protection provision. While this is seldom articulated as the primary objective in sub-Saharan African PWPs, many programmes are based on the assumption that participation will result in ‘graduation’ and an ‘exit’ from poverty, with PWP participation representing a form of ‘treatment’, without adequate reference to the labour market context and the availability of appropriate employment opportunities. This is the case in the EPWP in South Africa which adopts the language of ‘graduation’ despite the lack of evidence that this is occurring on any significant scale, (Meth and McCord, 2009a). The key conclusion to be drawn from this discussion is that while the different types of PWP are conceptually discrete, and appropriate for meeting differing objectives in different contexts, there is often confusion at point of programme design and implementation in sub-Saharan Africa, with a mismatch of the form of PWP selected, and the social protection outcome which is anticipated, with type A and C programmes offering short term employment, frequently implemented in contexts of chronic poverty. This represents the critical failure in PWP programming in the region. Having established a PWP typology, and discussed the social protection function of each, a detailed review is now offered of PWP programming across the region.
responsibility of the state to guarantee a minimum level of support to all those eligible and seeking state employment, as for example in the case of the national Expanded Public Works Programme (or EPWP) in South Africa (McCord, 2007).

ODI Overview of Public Works Programmes in Sub-Saharan Africa
6
Part Two: An Overview of PWPs in Sub-Saharan Africa In this section of the report PWP activity in the sub-Saharan Africa is reviewed and key patterns and trends relating to programme design and implementation are identified, drawing on information from a data base of programmes in the region.
Overview of the Database The analysis of patterns of current PWP design and implementation in sub-Saharan Africa is based on a database of 167 current or recently implemented programmes from 29 countries in sub-Saharan Africa, listed in Table 1 below.
Table 1: Sub-Saharan Africa Countries included in the database Country Number of Public Works Programmes included in
the database Angola 2 Botswana 2 Burundi 10 Cote d’Ivoire 3 Congo Brazzaville 1 DRC 4 Ethiopia 27 Ghana 1 Guinea Conakry 7 Kenya 2 Liberia 13 Lesotho 7 Madagascar 9 Malawi 8 Mali 11 Mozambique 3 Niger 5 Nigeria 0 Rwanda 4 Senegal 5 Sierra Leone 3 South Africa 8 Somalia 4 Swaziland 2 Tanzania 6 Uganda 2 Zambia 5 Zimbabwe 8 Total number of programmes 167 The database was developed on the basis of a web review, using publicly available secondary data on programs implemented within the last decade.4 Almost three hundred programmes were identified in the initial search, but of these almost half were excluded due to inadequate electronic data availability, the fact that the programme was an earlier phase of a later programme included in
4 The database is an extended and updated version of an earlier data base completed in 2005, which was developed by the Public Works Research Project, in SALDRU at the University of Cape Town with funding from UNICEF East Africa Regional office, as part of a review of social protection provision in the East and Southern Africa region (McCord, 2005).

McCord & Slater
7
the database, or because the programme was implemented more than ten years ago. For each programme a range of secondary electronic sources were interrogated in an attempt to identify data on key design and implementation elements. The main areas investigated in the database are listed in annexe 1, although where additional information could be extracted to gain greater insights into the programme, further categories were added. Data constraints The database is limited in that it does not represent an exhaustive listing of programmes, and most of the data on which it is based was extracted from secondary sources. In addition it may also be biased in favour of programmes for which data is available electronically, implying an inherent selection bias away from smaller and lower cost programmes which are not supported by international donors. A further bias may occur in any analysis of the characteristics of these programmes due to the fact that equal weight is given to all programmes irrespective of their size, leading to a potential overrepresentation of the characteristics of smaller programmes. In addition there were serious problems with the quality and comparability of the data itself, largely as a consequence of the lack of consistent terminology, and common reporting and evaluation conventions. Examples of these inconsistencies are reflected in confusion over who should be counted as participants and who as beneficiaries, how ‘employment’ created in PWPs should be counted, with a variety of options presented, including ‘jobs created’, ‘days created’, ‘full time equivalents’, and a range of costing approaches, with no norms governing which line items should be included within PWP budgets. These problems were compounded by a lack of basic factual information in the key project documentation, and the absence of consistent criteria against which PWP programming should be measured, in terms of inputs, outputs, or outcomes. As a consequence of these constraints the process of populating the database entailed the analysis of dense narrative, and the drawing of inferences and assumptions, which may not in all cases be entirely accurate. The data was primarily based on self-reporting by implementing agencies, and in some instances reflected programme design, rather than necessarily corresponding to reality in terms of performance, and no verification of the data was possible. For this reason no attempt was made to assess the impact of the programmes reviewed, but rather to explore key conceptual and design issues. Given the range of caveats set out above the database does not represent a complete summary of regional PWP programming, and any analysis based on the data base should not be considered statistically robust, but should be taken as indicative only. However, where consistent and general patterns emerge, it is appropriate to conclude that these represent key features of PWP programming in the region. Future data requirements One key recommendation arising from this analysis is the need for improved and consistent documentation of PWPs in terms of both design and implementation across major donors, the development of agreed terminology, and common approaches to the calculation of key data relating to inputs, outputs and outcomes. Without this the possibility of robust and meaningful assessment of the cost and impact of PWP programming in the future will be seriously undermined, and prospects for evidence policy based policy selection will remain elusive.

ODI Overvie
The Natu The databtypology oregion. Givcharacterisidentified awhere assresult of thtransfer wathe primardefinitive inthe region. When appdominate,
Type A pemploymeintensificatform of eprogrammof employm This is inteacute laboprovide sigcontexts oless likely found in themployabi
5 It was not programme o
ew of Public
ure of PW
base of PWutlined abo
ven the reliastic of the pas type A wset creation he assets cras ongoing ry objectivendicators of.
plied to the together co
programmesnt accountion of infraemploymenting. This indment.
eresting, asour market gnificant saof chronic p
to be of se review, colity are imp
possible to i
objectives.
Works Prog
WPs in Su
WPs implemove in orderance on secprogramme
where the prwas prima
reated. Typor repeated
e. Due to tf PWP type
programmeomprising 96
s, with theted for 47structure prt guaranteedicates that
s while a smdisruption, fety net be
poverty and ignificance onfirming thplemented
nclude 11 of
rammes in S
ub-Sahara
mented in sr to gain ancondary datas set out
rimary charary, with hoe B programd on the bathe crude p, but collect
es in the d6% of all PW
Figu
e objective7% of prorovision, type, or repet almost all
mall numbewhere a s
nefits thougunemploymin terms o
he argumenin develope
the PWPs in
Sub-Saharan
8
an Africa
sub-Saharann insight intta, the typot in key proacteristic wusehold levmmes wereasis of needprogrammetively they i
database it WPs review
ure 1: PWP T
(n=167)
e of providogrammes, pe C, 43%,eated or oPWPs in th
r of the typshort term gh consumpment, in whf its safety
nt that mosted rather th
the database
n Africa
n Africa wao the naturlogy was ap
ogramme dowas direct suvel benefitse identified wd, and type e identificatindicate the
was found wed, see Fig
Type
ding social and thos
with only 4ongoing emhe region pr
e A PWPs period of eption smoohich a short
net impactsupply side
han develo
e in the typolo
as first anare of currenpplied on thocumentatioupport to ho being anticwhere the eD, where sion processbroad char
that type Agure 1.5
protectionse concern4% of progr
mployment, rovide a sing
were impleemploymenthing, mostt term epist. No typee interventiooping Low
ogy, due to in
alysed in tent PWPs ache basis of ton. Programouseholds, cipated indemploymenskills develos, the resuracteristics
A and C pr
n through ned with rammes off
in line wgle short te
emented in t has the pt were impleode of emp
e D programons aiming Income Co
nsufficient dat
erms of thectivity in thethe primarymmes wereand type Cirectly as at and wage
opment wasults are notof PWPs in
rogrammes
short termthe labour
fering someith type Brm episode
contexts ofpotential toemented inployment ismmes wereto enhance
ountry (LIC)
ta on primary
e e y e C a e s t
n
s
m r e B e
f o n s e e )
y

contexts (Mreviewed inin programlead to ‘graappropriatewhich are a Cash for W The populaWork or FCFW, 46%providing a Overall in comprisingforms of Pincluding bcommunitiegoods, oftein which padevelopmeasset, food The form oCFW, comreflects thesupported
Programm A range ofby far the programmeinfrastructualleviation/with the P
McCord, 20ncluded sec
mme documaduation’. Ie, in an attassociated
Work or Fo
ar conventiood for Wo
% conventioagricultural
the regiong 61% of th
PWP which both convees as an incen after a participants aent. Most od, to promot
of PWP varimpared to 72e fact that mby major fo
me objectiv
f programmmost freques (of whicure, compri/safety netsPWP typolo
008a, del Ncondary obj
mentation wn the followtempt to illuwith differe
ood for Wor
onal classifork (CFW oonal FFW, 1inputs, and
n, the majohe total. Theuse food as
entional FFWcentive rath
period of coare given fo
of these prote a range o
ied significa2% of type
many type Aood donors,
Fig
ves
me objectiveent were th
ch 52% waising roadss, which waogy findings
inno et al, jectives rela
was that skiwing analysustrate the ent forms of
rk?
fication of Por FFW). Th15% Food f 1% other.
ority of proge term FFWs an incentW and als
her than as nventional ood as an i
ogrammes aof developm
antly acrossB, and 63%
A programm such as W
gure 2: CFW
(A
es were mehe construcas environms, bridges, as mentiones above. T
9
2009) althoating to skilills developis, the datasignificant public work
PWPs is bahirty seven for Training
grammes wW is used hive to gene
so Food fora formal waFFW prograncentive fo
are funded bmental outco
s PWP type% of type Cmes are humWFP or USA
W/FFW by Pro
A n=78, C n=7
entioned in tction on infrmental or aand other
ed in 61%, he provisio
ough many lls developm
pment and a will be disdifferencesks.
ased on whepercent of
g (FFT), 1%
were some here inclusiverate a rangr Assets (Fage, in recoamming, asr spending by the WFPomes, in ad
, with only 2, see Figure
manitarian inID, than typ
ogramme Ty
72)
the PWP drastructure, gricultural iconstructiosee Figure
on of emplo
programmement, and alabour mar
saggregated in design
ether progrf the progra
% Inputs for
form of Fvely to covege of sociallFFA), in wompense fos well as Fotime under
P, in an attedition to im
20% of typee 2 (for datn nature, anpe B or C pr
ype
ocumentatimentioned
infrastructun), and soc3. These f
oyment wa
McC
es of the pra common arket experied by PWP tand concep
rammes offeammes revi
Work (IFW
Food for Wer several ny desirablehich food r the creatio
ood for Trairgoing trainiempt to useproving nut
e A programa see Annend are morerogrammes
on reviewed in more thre, and 48cial protectfindings ares included
Cord & Slater
rogrammesassumptionence wouldtype, whereptualisation
er Cash forewed were
W), primarily
ork (FFW),new variant outcomes,is given toon of publicning (FFT),ing or skills its primarytrition.
mmes beingexe 2). Thise frequently.
d, of whichhan 80% of% physicaltion/povertye consistent
in 34% of
r
s n d e n
r e y
, t ,
o c , s y
g s y
h f l y t f

ODI Overvie
objective sfact that 20
It is interedominanceinfrastructuWhere infrschools, cassets; wh40%. The objectand D were
ew of Public
statements, 0% of progr
esting to noe of infrastrure while arastructure clinics and hile the cons
tives are bre not adequ
Works Prog
and 23% erammes rep
(n=
ote that socucture basealso promoprovision whousing an
struction of
roken downuately repre
Figu
(n
rammes in S
explicitly meported huma
Figure 3: Ob
=158, 113 ha
cial protectied programoting aggregwas stated nd roads)environme
by types Aesented to b
ure 4: Object
n=76, 60 hav
Sub-Saharan
10
entioned skian capital c
bjectives of
ave more tha
ion is not gmmes (type
gate emploas the objeaccounts fntal or agric
A and C belbe discusse
tives of prog
ve more than
n Africa
lls developmreation as a
f programme
n one object
given more C), in whichoyment by ective the cfor 60% of cultural infr
low in Figured in this wa
gramme (typ
one objectiv
ment, whichan intended
e
tive)
priority, hih the objecincreasing
constructionprogramm
rastructure w
res 4 and 5ay).
pe A)
ve)
h is consisted outcome.
ighlighting tctive is the p the labou
n of facilitiemes providin
was mentio
5 respective
ent with the
the relativeprovision ofur intensity.es (such asng materialoned in only
ely (types B
e
e f . s l y
B

As would infrastructusignificantland their economic micro (housocial protemploymeand the leveconomic considered
Program Budgets The rangemillion, witHowever, difficulty oallocated tfigures, othPWP prog Funding s Most of theare centralfrequently sector (4%and 19% bfunding. Th
be expecteure provisioy more melivelihoodsstabilisation
usehold) antection enhnt promotiovel was con
level, andd to be cont
mme Finan
of budgetsth mean angiven extre
of ascertainto PWP proher than tharammes va
sources
e programml to current mentioned
%) and localbilateral, withe range an
Figur
(n
ed, the socon in type ntions of sk, while then (23), whind macro lehancing maon. Politicalnsistent acrod employmtributors to p
ncing
s associatednnual progreme probleing how m
ogramming,at PWPs areries enormo
mes had muprogramme were natio NGOs (3%th 12% of innd frequenc
re 5: Object
n=71, 54 hav
cial protectiC. It is in
kills develope type C inch was onlevel emphaacro-econom stabilisatiooss types A
ment creatiopolitical sta
d with PWPramme budms with da
much of a c it is not poe currently ously from p
ultiple fundie funding, bonal govern
%) see Figunternationa
cy of funding
11
ives of prog
ve more than
ion objectivnteresting tpment than ncludes a ly mentioneases of the mic stimulaon was menA and C, indon and infbilisation.
Ps ranged fdgets of USata quality complex mossible to dreceiving mprogramme
ing sourcesbeing mentionments (22re 6. Of the
ally funded pg was simila
grammes (ty
one objectiv
ve is dominthat the tytype C, reflsignificant
ed once in two progra
ation, infrasntioned expicating thatfrastructure
from a few S$ 43 millioand compaultiple com
drawn any smajor fundine to program
s. The data oned in 83%
2%), internae internationprogrammear across ty
ype C)
ve)
nant in typeype A proglecting the fnumber oftype A, ref
ammes, witstructure creplicitly in 15 both socia
e provision
thousand ton dollars (arability, an
mponent prostatistical cog allocation
mme.
indicates th% of prograational NGOnal donors,
es having boype A and C
McC
e A progragramme alsfocus on thef mentions flecting theth type C feation and 5% of all prl protection
at macro
to more tha(in US$ 200nd in manyogramme bonclusions ns, and that
hat multilateammes. TheOs (13%), 74% were
oth multi- aC programm
Cord & Slater
ammes andso includese individualof macro-respective
focusing onaggregate
rogrammesat a micro-
o level are
an US$ 10000 values).
y cases thebudget wasfrom these
t the cost of
eral donorse next mostthe privatemultilateralnd bilateral
mes.
r
d s l -e n e s -e
0 .
e s e f
s t
e l l

ODI Overvie
InternationGovernmegovernmencontinued (see annex
Design a This sectiodeterminin Programm Programm
ew of Public
nal donors went Organisnts the majPWP implexe 3).
and Imple
on will revieg the socia
me
e duration v
Works Prog
(
were identifsations (INGjor funders
ementation.
ementatio
ew a numbel protection
varied cons
rammes in S
Figure 6: T
(n=154) 37 h
fied as the GOs) in 1
s, see FiguThe breakd
Figure 7
on
er of key fac impact of P
siderably ac
Sub-Saharan
12
Type of fund
have more th
major dono0% and inre 7, illustrdown did no
: Major PWP
(n=146)
ctors relatinPWPs.
cross progra
n Africa
ding agency
an one dono
or in 82% ofn only 6%rating the cot vary sign
P funders
ng to progra
ammes, see
or
f programm of progra
critical role nificantly acr
amme desig
e Figure 8.
mes, Internaammes we
of donor aross progra
gn, which ar
ational Non-re nationalagencies inamme types
re critical in
-l
n s
n

For prograyears in duduration bebut in mosprogrammeto 48 for tyare implemprogramme The duratioexperiencePWPs, parmaximum proceduresestablished Implemen National goalthough a
6 McCutcheoverheads to
ammes withuration, witheing three yst of these e which waype C. Themented in es terminat
on of prograes in Kenyarticularly typefficient levs etc), are hd (McCutch
ting agenc
overnment a range of d
on cites expe
o direct constru
Fig
h complete h 53% beingyears. Onlyinstances its ongoing. shorter duresponse te.
ammes maa during thepe C progravel, since shigh during heon, 2001)
cies
and local Nifferent age
erience from uction costs d
gure 8: Prog
data on stg three to fiy 6% of prot was not cThe mean dration of tyto an emer
y have impe 1970s, Mammes, resset up coststhe initial st.6
NGOs were ents were id
the Kenya puring its first t
13
gramme dur
(n=125)
tart and enive years, a
ogrammes wclear if this duration typpe A progrargency and
lications forMcCutcheonsult in a failus and overhtart up phas
the most frentified, see
public works hree years (19
ration in yea
d dates, 36and 11% sixwere implemreflected a
pe A prograammes ma
d once the
r programm argued thaure to realisheads (recrse, but fall s
requently me Figure 9.
programme w974-76), whic
ars
6% were ox or more yemented on bsent progrmmes was
ay be linkedhumanitar
me cost-effeat the shorse the beneuitment, trasignificantly
mentioned im
which suffereh subsequent
McC
f between ears, with tan open enramme end33 months
d to the factrian crisis i
ctiveness. Drt time scaleefits of operaining, devey once a pro
mplementing
d an initial 8ly reversed.
Cord & Slater
one to twohe averagended basis,d data, or a, comparedt that manyis over the
Drawing ones of manyating at the
elopment ofogramme is
g agencies,
84:16 ratio of
r
o e ,
a d y e
n y e f s
,
f
ODI Overvie
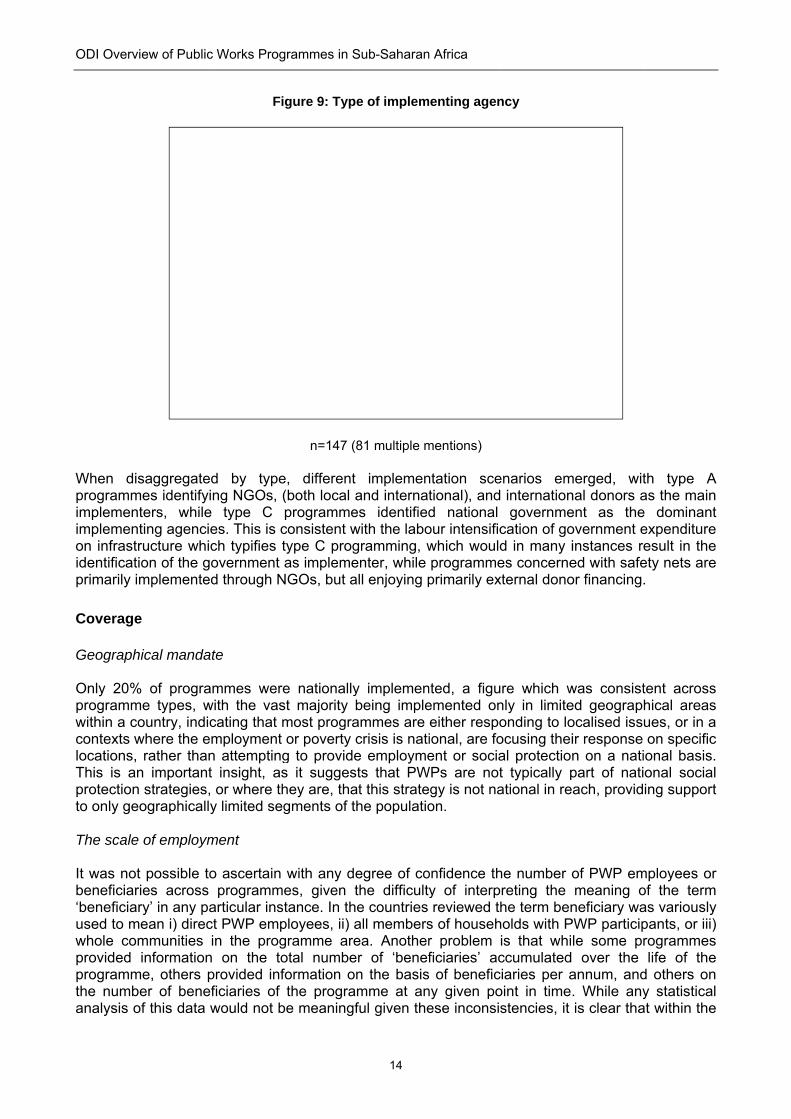
When disprogrammeimplementimplementon infrastruidentificatioprimarily im Coverage Geographi Only 20% programmewithin a cocontexts wlocations, This is anprotection to only geo The scale It was not beneficiarie‘beneficiaryused to mewhole comprovided iprogrammethe numbeanalysis of
ew of Public
saggregatedes identifyiners, while ing agencieucture whicon of the gomplemented
ical mandat
of programe types, w
ountry, indicwhere the em
rather thann important strategies,
ographically
of employm
possible toes across y’ in any paean i) directmmunities information e, others per of beneff this data w
Works Prog
Fig
d by typeng NGOs, (
type C pes. This is cch typifies tovernment ad through N
te
mmes wereith the vas
cating that mmployment n attempting
insight, asor where th
y limited seg
ment
o ascertain programme
articular instt PWP empn the progon the to
rovided infoficiaries of would not b
rammes in S
gure 9: Type
n=147 (8
, different (both local aprogrammeconsistent wype C progas implemeGOs, but a
e nationallyt majority b
most prograor poverty c
g to provides it suggesthey are, thagments of th
with any dees, given ttance. In the
ployees, ii) aramme are
otal numbeormation onthe programe meaningf
Sub-Saharan
14
e of implem
81 multiple m
implemenand internat
es identifiedwith the labogramming, wenter, while ll enjoying p
y implemenbeing impleammes are crisis is natie employmets that PWt this stratehe populatio
egree of cothe difficultye countries all membersea. Anotherr of ‘benefn the basismme at anful given the
n Africa
menting agen
mentions)
ntation scetional), andd national our intensificwhich wouldprogrammeprimarily ex
nted, a figuemented oneither respoional, are foent or socia
WPs are notegy is not naon.
onfidence thy of interpreviewed th
s of househr problem ficiaries’ ac
s of beneficny given poese inconsis
ncy
enarios em internation
governmecation of god in many ies concernexternal dono
re which wnly in limiteonding to loocusing theial protectiot typically pational in re
he number oreting the he term ben
holds with Pis that whiccumulated
ciaries per aoint in timestencies, it
merged, witnal donors aent as theovernment einstances red with safeor financing
was consisted geograpocalised issir response n on a natipart of natiach, provid
of PWP emmeaning o
neficiary waPWP particip
le some pr over the annum, and. While anyis clear tha
th type Aas the maine dominantexpenditureesult in theety nets are.
tent acrosshical areasues, or in aon specific
ional basis.onal socialing support
mployees orof the termas variouslypants, or iii)rogrammeslife of the
d others ony statistical
at within the
A n t
e e e
s s a c . l t
r m y ) s e n l
e

region thethose empsignificant Compleme One hundrPWP emplcomplemeto have a l
Over 70% for those uan outcomprogrammehumanitariprogrammetraining, in Targeting Almost 50selection, disaggrega
e annual nuploying justvariation in
entary inte
red of the loyment, anntary prograarger numb
of type A punable to wme which ise type. Twan aspect e compone pursuit of t
% of all prand lotter
ated by type
umber of dt a few hu programm
erventions
PWPs reviend of these amming va
ber of assoc
Figure 10
(A
programmeswork or specs probably wenty seve
of type A nts, and thothe provisio
rogrammes ries occurre are set ou
direct emploundred wore scale.
ewed had a57 had mulried by PWciated progr
0: Complem
n=51, B n =
s had compcified vulnerlinked to thn percent programm
ose that didn of infrastr
adopted coring in 12%ut in Figure
15
oyees varierkers, to o
additional pltiple additioP type, seerammes tha
mentary prog
= 50, with mu
plementary frable grouphe dominanprovided g
ming. Fewerd were primaructure.
ommunity t% and 8%11.
es significaothers empl
programme onal prograe Figure 10,an type C.
gramme com
ltiple mentio
feeding props outside thnce of Foogoods or ar type C parily in the a
targeting te% of instan
ntly betweeloying over
componenmme comp with type A
mponents
ns)
ogrammes, phe direct PW
od for Workagricultural programmesareas of tec
echniques, wnces respe
McC
en programr a million,
nts complemonents. The
A programm
providing a WP benefick programm
inputs, refs had comchnical assi
with local gectively. Th
Cord & Slater
mmes, from, indicating
menting thee pattern of
mes tending
food rationciary group,ming in thisflecting theplementaryistance and
governmenthe results,
r
m g
e f g
n , s e y d
t ,

ODI Overvie
Communityexpected, oriented an In terms of(in over 60third of proheaded hoprogramme
ew of Public
y selectiongiven the
nd typically
f target gro0% of both ogrammes) ouseholds’, e type in Fig
Works Prog
Figu
(A
n was moregreater coprivate sec
ups, the motype A andgroups whalso menti
gure 12 bel
(A
rammes in S
ure 11: Targ
A n=46, C n=
e dominantncern with
ctor impleme
ost frequend C programich may weioned in onow.
Figure
A n= 68, C n=
Sub-Saharan
16
eting mecha
=33, with mul
t in type Asafety net
ented type
ntly mentionmmes) ‘thoell entail cone third of p
e 12: Target
=61, with mu
n Africa
anisms ado
tiple mention
A programmt objectivesC programm
ned targets se affectednsiderable programme
groups
ltiple mention
opted
ns)
mes than ts comparedmes.
were ‘the pd by disasteoverlap, ans. These fi
ns)
type C, asd to the mo
poor and maers’ (mentiond ‘women ndings are
s would beore market
arginalised’oned in oneand femaleset out by
e t
’ e e y

The categoobjective lfrequently infrastructuwhose re-i On averagacross proemploying combinatio Employme Employme Only one qthe mean than four mduration ofon averagprogramme Form of wa PWPs usinFood for Tinputs or oand non fothis analys
7 Unfortunatwas based opost conflict s8 As a result(167).
ory ‘other’ ininked with mentioned
ure in a pontegration i
ge, 50% of ogrammes,
95% womeon of design
ent and pa
ent duration
quarter of pduration of months, 31f employme
ge two mones, with onl
age
ng food as Training), mother formsood componsis.8
ely options fon a model devstabilisation tht n=176 for th
ncluded sigpolitical sta in type C
ost conflict cnto the labo
PWP emplowith some
en, while otn and cultur
yment mod
programmeemployme
% for four ent is consisnths longery 3.71 mon
the mode made up 52 of paymennents, whic
or recording seveloped in 200han in West anhis analysis, w
nificant numabilisation. programm
context is four market
oyees wereprogramme
thers in Somral factors.
dalities
s gave datnt was 4.8 months, an
stent with thr in type Anths.
of payment2% of all pnt, see Figuch have bee
Figure
eparate data 05 for East annd Central Afrwhich is great
17
mbers of exIt is interees (over 4frequently ais importan
e women, aes such asmalia attain
ta for emplomonths, w
nd 35% for he dominanA programm
t, (includingrogrammesure 13. A sen treated a
e 13: Form o
(n=176)
on ex-combatnd Southern Africa. This is anter than the to
x-combatantesting to no0%). In suassociated t for nationa
lthough thiss the Zibamed only 6%
oyment durith 33% of between foce of type A
mes, at 5.7
g both Foods, while 44%small numbeas separate
of wage
tants were nofrican countrie
n issue to be aotal number o
ts, whose reote that thisch programwith the emal stability.7
s conceals mbele progra% female pa
ration. For tworkers beour and eigA and C PW
75 months,
d for Work,% offered cer of prograe programm
ot included in es where PWPaddressed in fuof programme
McC
eintegrations group is
mmes the pmployment 7
considerabamme in S
articipation,
these 42 preing employght months.WPs. Emplo
compared
, Food for Acash, and 4ammes had
mes for the
the databaseP play a more uture analysiss included in
Cord & Slater
n was a keyparticularly
provision ofof workers
ble variationSouth Africa
reflecting a
rogrammesyed for less This short
oyment wasto type C
Assets and4% offeredd both foodpurpose of
e design, as itlimited role in
s. the database
r
y y f s
n a a
s s t s C
d d d f
t n
e

ODI Overvie
The modeprogramme
The value For the limthe minimuwage, 36%wage. Whein cash (ontype C proreflecting tsocial pro‘dependenPWPs, see
Interestingspecified, t
ew of Public
of paymenes, compar
Figu
of the wage
mited numbeum wage w
% reported aen reviewedne quarter o
ogrammes hthe fact tha
otection procy’ and lab
e Figure 15
ly, in mosthe implied
Works Prog
nt varied acred to 67% o
ure 14: Paym
e: Payment
er of prograwere availaba wage equd by PWP tof type A prhowever, that these programmes, bour marke(for data ta
Figure
t food-basewage rate
rammes in S
cross PWPof type C, s
ment modali
(A
in relation
mmes wherble, 39% of ual to the mtype, it is clrogrammese wage is srogrammes
and so let distortionable see An
15: The PW
(A
ed PWPs, is significan
Sub-Saharan
18
P type, withsee Figure 1
ties in Type
n= 82, C n=
to the minim
re data on tprogramm
minimum walear that in
s); it is usuaset at or ab
are predoless directn which arenexe 4).
WP age and t
A n=9, C n=1
(predominantly higher
n Africa
h cash bein14.
e A and Type
75)
mum wage
the relationses reportedage, and ontype A prog
ally set belobove the minominantly ely influence associate
the minimum
7)
antly type than where
g offered in
e C program
ship betweed a wage senly 25% paigrammes wow the minimnimum wagmployment ed by theed with soc
m wage
A), where e a cash wa
n only 26%
mmes
en the PWPet below thid above th
where the wmum wage ge for 82%
creation, re concernscial protect
the food age is provid
% of type A
P wage ande minimume minimum
wage is paid(78%). Forof workers,rather than regardingtion type A
ration wasded, as the
A
d m m d r ,
n g A
s e

McCord & Slater
19
objective is to ensure adequate nutritional intake on a family basis, with the weekly ration being calculated to meet minimum household calorific requirements, without reference to its monetary value in relation to prevailing wages. In some (although by no means all) instances the higher real value of the FFW wage is likely to be linked to humanitarian contexts where participants are solely reliant on PWP employment, as in the case refugee or internally displaced situations. Since the objective in these cases is to ensure adequate nutrition, a specific poverty related objective, it is unaffected by the concerns about labour market distortion which depress a monetary wage. In contrast cash wages tend not to be set with the objective of attaining a specified reduction in poverty, or enabling participating households to reach certain minimum consumption thresholds, but are guided by a concern to avoid labour market distortion, even if the resulting wage is not sufficient to close specified nutritional or income gaps, and as a result, the wage in a cash PWP tends to be significantly lower than in a food based PWP An example is the low wage paid to participants in the Malawi Social Action Fund (MASAF) PWP, which resulted in total household income which fell significantly below the level required to purchase household nutritional requirements, even once household own production had been taken into account (Chirwa et al, 2004). This illustrates the significant diversity of objectives in terms of the intended function of the wage in food and cash based PWPs, and how it is calculated resulting in significantly different social protection outcomes. This is consistent with the broader issue that, paradoxically, humanitarian interventions tend to have materially differing outcome targets from ‘developmental’ ones, with a greater focus on meeting certain thresholds, guaranteeing basic rights, and safeguarding minimum levels of income and consumption. The concept of the ‘minimum wage’ is however itself problematic, as it is a somewhat arbitrary legislative construct which is rarely enforced in LICs, and may be above or below the prevailing wage (see del Ninno et al, 2009). The minimum wage may fall below the market wage if it is not regularly updated, (as in the case of Malawi, see Chirwa et al, 2004) and hence paying a wage equivalent to the minimum wage may in some instances indicate a wage which is below the prevailing market wage. In a highly segmented labour market, where the market wage in the bottom segments may itself offer below subsistence levels of remuneration, resulting in the phenomenon of the working poor, this strategy of ensuring the PWP wage is below the prevailing wage may be counter-productive in terms of the desired safety net function of the programme (ibid). In order to gain some objective insight into the value of the PWP wage in terms of the national economic context, and to facilitate some means of comparison across programmes, the total wage, (calculated by multiplying the cash monthly wage by the duration of employment) was compared to national GNI per capita, see Figure 16. The results must be treated with caution, but give an indication of the significant spread in terms of the real market value of PWP employment, ranging from 20% to more than 140% of per capita GNI. This diversity suggests that the programmes reviewed might result in very different incentives for participation, impacts on the labour market and social protection outcomes.

ODI Overvie
Payment fr Payment woffering padelays andthe most programme The nature Ninety-thre(n=28)), rerequiremenA and C, shours per available, wlabour con These findpotentially water gathparticipatioMcCord, 2selection otheir limitedregion, leaorder to elimited covhouseholdcash transbudget to gin Ethiopia
ew of Public
frequency
was predomayment on ad irregularitifrequent i
es where th
e of emplo
ee per centequired pant was onlysee annexeday and dwhich was straints the
dings are sexclude in
hering etc), on may be 2009a) potof a low wagd capacity t
ading some extend sociaverage. Exas in Malaw
sfer compongrants, as i
a.
Works Prog
Figure 16:
minantly ona daily basiies in paymn all PWP
hey account
oyment
t of programrticipants t
y 3-5 hours, es 6 and 7.ays per weexplicitly d
ey faced.
ignificant, andividuals wand househhigher tha
tentially unge. The excto participatcountries toal protectioamples of th
wi and Zambnents of son the case
rammes in S
Value of wa
a monthlyis, 17% fort
ments were P types, alted for 34%
mmes (all bo work forand there w
. The only eek was theesigned to
as in combwith domesholds with ln for those
ndermining clusion of pte remains o adopt cas
on to this ghis are the bia (which come PWPsof MASAF
Sub-Saharan
20
age paid rel
(n=34)
y basis, acctnightly, andmentioned lthough da
% of program
but two of tr 5 to 6 dwas no signprogrammee single typfacilitate pa
ination withstic (non-reimited labo
e with morethe povert
poor labour a perennial
sh transfer pgroup, altho
pilot cash cover less t
s which alloin Malawi,
n Africa
ative to GNI
counting ford 4% less fin many in
aily wages mmes (see a
the programays a wee
nificant diffee offering pape B prograarticipation
h the low wemuneratedur availabili
e abundant ty targetingconstrained problem in
programmeough these transfer prothan 2% of
ocate a perand the Pro
I per capita
r 57% of prfrequently thstances. Mwere only
annexe 5).
mmes for wek, but for erence betwart time emamme for wby poor wo
wage, the w) labour oity, for whomlabour (Ba
g objectived householdn social prots in place oprogramm
ogrammes f the poor, rcentage ofoductive Sa
rogrammeshan monthlonthly paym
y reported
which data i63% the
ween programployment, which informomen, reco
work requirebligations (m the margarrett and Ce which infds from PWtection provof PWP empes tend to for labour c(McCord, 2f the total pafety Nets P
s, with 11%y, althoughments werein type A
is availabledaily work
amme typesin terms of
mation wasognising the
ement may(child care,ginal cost ofClay, 2003,formed the
WPs, due tovision in theployment in
have veryconstrained2009b), andprogrammeProgramme
% h e A
e k s f s e
y , f ,
e o e n y d d e e

Cost-effec Given the limited insi Wage as a Few prograsuch a waare availab
Across all Seventy sewages (mesuggestedcost with th1997). Onlconsiderabet al’s findwas higheintensity pSaharan P While the percentagetype C, 28technical cgiven to thwas only athe definitithese findiexplore the
ctiveness
limited datghts into co
a percentag
ammes repy as this co
ble is illustra
Figure
programmeven per ceedium labou that internhe remaininly 19% of pbly lower thadings, in theer than 60%erformance
PWPs.
mean was e of program% and com
costs involvhe infrastrucavailable forion of total ngs are inde question i
ta availableost-effective
ge of program
ported the pould be calcated in Figu
17: Labour
mes an aveent of progrur intensity)nationally, wng budget bprogrammesan in del Ne majority o% (del Ninne internation
similar acrmmes alloc
mpared to 1ved in infrascture outpur 16% of all programme
dicative onlyn more deta
e on both ceness can b
mme cost
roportion ofculated. Theure 17.
r intensity of
rage of 46rammes (n=), a finding wwage typicabeing absorbs allocated inno et al’s of the internno et al, 20nally it is no
ross progracating above1% respectstructure cret in type Cprogramme
e cost calcy, and signail.
21
cost and alsbe derived f
f budgets se labour int
f PWPs (lab
(n=26)
6% of total =20) spent which is coally represebed in matemore than recent ana
national pro009). Givenot possible
mme typese 60% to wtively. This eation in typ, comparedes reviewedulation acroals the nee
so programrom the dat
pent on watensity of th
bour costs a
programmbetween 30nsistent wit
ented betweerial and ma
60% to labalysis which ogrammes en the varian
to assess
s (48% for wage was h
is likely to bpe C prograd to type A.d, and the faoss programed for impro
mme outputsta base.
ges or preshe 26 progra
s a % of tota
e cost was0 and 60% th findings been 30% aanagement bour costs sfound that,
examined (nce in estimthe relative
type A andigher in typbe due to thammes, giv. However, act that themmes (see oved progra
McC
s and outc
sented theirammes for
al cost)
s allocated of the total
by Subbarand 60% of costs (Subsee Figure , contrary to(62%), labomates of Pe performan
d 42% for type A prograhe higher mven the greathe fact thare is no conabove) sug
amme data
Cord & Slater
omes, only
r budgets inwhich data
to wages.l budget on
ao et al whototal PWP
barao et al,17. This is
o Subbaraour intensity
PWP labournce of sub-
ype B), themmes than
material andater priorityat this datansistency inggests thatin order to
r
y
n a
. n o P , s o y r -
e n d y a n t
o

ODI Overview of Public Works Programmes in Sub-Saharan Africa
22
Conclusion Drawing conclusions from the 167 programmes reviewed is problematic given the poor quality of the data available. However, some key insights emerge from the data presented above. Programmes in the region are almost exclusively types A and C, offering short term employment, the primary objectives are safety nets/social protection and infrastructure creation respectively and the main target group is the poor and marginalised. These programmes are heavily reliant on international donor funding, and receive only limited allocations from national resources. The programmes are mostly medium labour intensity, which is either consistent with, or lower than international averages depending on the international comparators selected (Subbarao et al, 1997, del Ninno, 2009). Most programmes are locally rather than nationally implemented and many are part of larger initiatives or have complementary programme components, either for participants or other community members. Two thirds of programmes overall are Food for Work/Food for Assets, but this differs significantly between type A and C programmes, with a greater preponderance of FFW in type A (78%). Where paid in cash, the wage for type A programmes is less than the minimum wage, but in type C programmes it is equal to or higher than the minimum wage. When the wage is paid food, it tends to have a higher equivalent value than the cash. Overall the data indicate that there are major differences between type A and type C programme design and implementation. However, while the type A/C distinction was useful when the database was first developed, the expansion of the database to include countries affected by humanitarian disasters and conflict may require the subdivision of type A into two sub-components to allow for differentiation in terms of a development/humanitarian, chronic/acute labour market disruption, food/cash wage, social safety net/social protection axis. There are potentially significant differences between such programmes, and separating them in future work might allow for further insights which are currently obscured. If this subdivision were complemented by donor analysis further light might be shed on the relationship between donors and programme design. There were only six type B programmes included in the data base. Because of this small number, type B programmes were excluded from much of the analysis as the findings would not have been significant. The population of the database was constrained by reliance on secondary web based data. To achieve a more detailed and nuanced analysis the development of a larger database using primary research methods would be desirable. One practical recommendation arising from this section of the report is the need for the establishment of reporting norms and conventions within the community of agencies implementing PWP, in order to promote the possibility of programme analysis and cross programme comparability.

McCord & Slater
23
Part Three: Analysis of the Cost-Effectiveness and Targeting Efficiency of PWPs The third section of this report analyses the cost-effectiveness and targeting efficiency of PWPs in sub-Saharan Africa and the impact of the PWP transfer on household income. Given the limited primary data available on costs, outcomes and targeting performance, and the difficulties in assessing the credibility and consistency of data which is available, a comprehensive review of the cost-effectiveness and targeting efficiency of PWPs in Africa is not attempted in this paper. For the same reasons any comparisons with the performance of alternative social protection programmes such as cash transfers are necessarily tentative. The approach taken is to review the main approaches to assessing the cost-effectiveness of PWPs internationally, and examine the main conclusions from the limited literature which applies these approaches to programming in the region. The literature primarily addresses PWPs in Southern Africa and Ethiopia, and the issues raised in this literature are explored in more detail through the analysis of primary data from two case study programmes from South Africa (McCord 2004 and 2009a).
Cost-Effectiveness Data on PWP costings and outputs are extremely limited in the African context, rendering cost- effectiveness analysis problematic, and the analysis in this section draws on the limited literature papers available which offer analysis or data on costings and outputs, with evidence largely drawn from research conducted in the Southern African countries of Malawi, South Africa, and to a lesser extent Zambia, (drawing largely on the work of Adato, Chirwa, Devereux, McCord, Smith, Taylor and White), as well as some from Ethiopia (Devereux and Smart). The issues arising from this literature review are explored in more detail through the analysis of two case study programmes from South Africa, for which survey data is available, see Box 2. Box 2: Overview of South African Case Study Programmes Gundo Lashu The Gundo Lashu programme is a type C PWP, implemented in Limpopo province, which offered a single short term episode of employment in construction, averaging four months, typical of ILO EIIP programming, and the West African AGETIP, and most PWP activity throughout sub-Saharan Africa. The programme was primarily funded by international donors (the ILO and DFID), and was implemented through private contractors, using a lottery or first come first served approach to recruit labour. Zibambele The Zibambele programme is a rare example of an African type B PWP. The programme was implemented in KwaZulu Natal province, and offered ongoing part time employment in road maintenance for participants on an ongoing basis. Participants were selected using community participation on the basis of a poverty criterion. The programme was implemented by provincial and local government, and was funded by the provincial government. Survey data on these programmes was gathered in 2003 The data interrogated have a geographical bias towards southern Africa, but nevertheless draw on more than a dozen different programmes, and represent a range of programme types funded variously by multilateral and bilateral donors (including the World Bank, the ILO, the EU and DFID), international NGOs, and national governments. The programmes discussed are predominantly type A and C programmes, reflecting the fact that such PWPs dominate in the region, but also include two type B programmes.

ODI Overview of Public Works Programmes in Sub-Saharan Africa
24
Prior examining the cost-effectiveness approaches adopted in the literature to date and their findings with regard to the region, key methodological problems are highlighted in relation to i) calculating the cost of PWPs, and ii) quantifying the amount of work created. Calculating PWP cost The lack of consistent information on the cost of programme implementation is a key problem. In order to assess cost-effectiveness, it is essential that the actual costs of a PWP are known, but this in itself is problematic as there is no consensus on the appropriate set of costs to be included in PWP cost-effectiveness analysis. This renders any attempt at comparison between PWPs, either nationally or internationally, problematic, and also undermines the potential for cost-effectiveness comparisons with other forms of social protection, such as cash transfers. A recent study which attempted to carry out a cost-effectiveness analysis of a range of PWPs in Malawi and Zambia highlighted the difficulty of gathering comparable basic data on total PWP cost from the main national and international agencies operating PWPs in the country (White and McCord, 2006). There is no consistent approach to the assessment of the administrative, technical, management and capital costs implied by a PWP, or which of these costs should be included in any form of cost-effectiveness analysis. For the great majority of PWPs, data are not available on the total cost of PWP implementation and hence no measure of unit cost, nor any other measure for comparative costing can be calculated with any degree of confidence. This concern was highlighted by Devereux and Solomon in their 2006 review of international employment creation programmes:
‘... there is a dearth of detailed disaggregated information on job creations [sic] costs, partly because the management costs are usually hidden in regular government administration.’ (2006:6)
Similarly a recent report by the RHVP initiative concludes with regard to PWPs that;
‘Lack of scheme-level data on transfer and overhead costs and other scheme parameters prevents accurate cost-efficiency calculations for most schemes’ (2008).
Costings relating to PWPs tend to be idiosyncratic. There are several factors underlying this problem, relating in part to the complexity of PWP implementation. The cost data problem reflects the fact that PWPs are institutionally complex, often crossing several funding and expenditure jurisdictions as a result of the inherent complexity of PWP design and implementation. As a consequence of this complexity, there are a considerable variety of cost centres under which the diverse set of activities requiring PWP expenditure may be located; local government, Department of Public Works, Department of Planning, Department of Labour, Department of Education, NGOs, QUANGOs (Quasi Non-Governmental Organisations),9 PMUs (donor-funded Programme Management Units),10 donors, advisors or consultants. Creating a comprehensive picture of the real cost of PWP implementation would require the synthesis of data conventionally spread across a diverse set of cost centres in a range of different institutions. PWP budgets frequently exclude the administrative and management costs, particularly when implementation costs are incurred by local government institutions, at district or village level. It is often assumed that the implementation of PWP related tasks should be performed without additional budgetary allocations or incentives, even though they may be additional to the existing scope of responsibility, and fall to already overburdened local officials, as in the case of MASAF in Malawi, or the EPWP in South Africa (UK DFID, 2003a; Karuri et al., 2007). In this way, many PWPs imply an additional set of unbudgeted work activities, with local government being required 9 QUANGOs are state-funded organisations outside the normal governmental structure, and may be responsible for PWP implementation. 10 PMUs implement PWPs in structures which are parallel to those of government.

McCord & Slater
25
to play a central, but unfunded, role in implementation. Hence the hidden cost of PWP implementation includes both unbudgeted activity, as well as activities which are budgeted outside the PWP budget. This problem also reflects the fact that different types of PWPs may be differently conceptualised in terms of their budgets. For example, WFP and USAID do not tend to include the cost of the food component of their FFW programmes, with the result that the wage component in many PWPs implemented or supported by these agencies is often considered to be ‘free’, rather than reflecting actual costs in terms of purchase value, shipping and internal transport storage and handling costs. For donors such as WFP, the disaggregation of specific programme costs, and attempts to cost the value of the in-kind payment in PWPs is both technically problematic, and politically sensitive (White and McCord, 2006). The consequence of WFP and other donors’ inability to share budgetary data on the total cost to the donor community of FFW programmes is a lack of transparency regarding the true cost of PWPs which utilise donated food as the basis for the payment. As a result, when programmes are costed, the budget lines included as ‘PWP’ line items can vary greatly, with potentially sizeable hidden costs. The extent to which these are or are not included in estimates of programme cost can have a significant impact on cost-effectiveness conclusions. In this context it may be difficult to distinguish variation in cost-effectiveness from noise. Often donors and implementing agencies themselves have difficulties in assessing the actual total cost of PWPs, including implementation, given the extent of the unknown real costs of local government management, technical design and monitoring, material costs, contractor costs, etc. The lack of conventions governing the calculation of PWP cost is compounded by a lack of transparency regarding which costs have been included or excluded, and how these costs are derived in each instance. This has implications for any attempt to assess the cost-effectiveness of individual programmes, and renders cross PWP comparison and any kind of cost-effectiveness across different social protection instruments, problematic. Together, these factors undermine the reliability of much current PWP comparative cost assessment analysis, particularly in sub-Saharan Africa. Quantifying the amount of work created Quantifying the amount of work created in a PWP for comparative purposes requires a common definition of the concept of ‘work created’. Across the programme data examined a range of different units of measurement have been used to quantify the employment created through PWPs, including ‘jobs’, ‘employment’, ‘workdays’ and ‘person years’. The term ‘jobs created’ and ‘employment created’ are frequently adopted in the PWP literature but such terminology is problematic in that it gives no indication of the quantity of employment created, limiting the potential for meaningful analysis of programme cost and cross programme comparisons. This problem has been addressed in some of the international literature, notably that which is linked to the World Bank, by the adoption of the objective and analytically useful term ‘workdays created’ as the conventional unit of measurement of PWP performance (for example Subbarao (1997); Ravallion (1998); del Ninno et al (2009)). However, for the majority of PWPs in Africa (and internationally), data for workdays created is not available. Only 17 of the 167 programmes reviewed in the PWP database included this information in their documentation, using instead the problematic and unquantifiable terminology of ‘jobs’, ‘employment’ or ‘work’ created, recording the throughput of workers, irrespective of the period of time each was employed, rather than the aggregate amount of work days created. This omission from PWP documentation and monitoring and evaluation analysis represents a critical weakness in terms of attempting to assess the cost-effectiveness of PWPs, or effect comparisons between different PWPs and between PWPs and other forms of social protection problematic.

ODI Overview of Public Works Programmes in Sub-Saharan Africa
26
For the purpose of this study however, these (considerable) problems will be put aside, and a critical assessment made of the literature available, to ascertain whether they can offer any insights into regional PWP cost-effectiveness. Four main approaches have been adopted in the literature to address cost-effectiveness; i) the cost per day of employment created, ii) the percentage of total programme cost allocated to labour, iii) the cost per dollar transferred (empirically linked to (ii)) and iv) the Cost-Effectiveness Ratio Analysis approach developed by Ravallion (Ravallion, 1998). Each is critically reviewed below, with reference to sub-Saharan Africa. Cost per day of employment The first approach to cost-effectiveness is based on estimations of the unit cost of providing one day of employment. This approach is reviewed with reference to a range of PWPs. In order to assess the cost per day, it is necessary to determine the amount of employment created, and then to analyse this in the light of the programme budget. This requires two sets of information; the quantity of employment created and the cost of creating it (discussed above). Both sets of information are scarce in the African context, with very little comparable empirical data available. Adato et al (1999) measured the cost of employment created in 101 PWPs implemented in the Western Cape Province in South Africa during the late 1990s by calculating the cost per workday.11 This analysis of cost per workday over a range of programmes is almost unique in the PWP literature, as it is rare to have comparable data on either programme performance in terms of employment created, or programme cost. The findings are summarised in Figure 18 below.12
Figure 18: Western Cape cost/workday and labour percentage of total cost (Rands)
Source: McCord 2009a, Derived from Adato et al. (1999:200). This graph illustrates the wide diversity of cost per workday within PWPs, even within a single programme and common geographical location. The wide distribution of costs ranges from R40 (US$7) a day for programmes requiring limited capital resources or management inputs, (e.g. the removal of alien vegetation from agricultural land, or urban rubbish collection), to R749 (US$123) for programmes entailing employment in high tech construction work 13(1999 prices). These findings suggest that the cost per workday is correlated with the labour intensity of employment provided within a PWP and that it is not in itself an indication of the cost-effectiveness of a programme. 11 These programmes were part of the national Community Based Public Works Programme (CBPWP). 12 The most efficient programmes, in terms of jobs created per unit of investment, with low cost per workday and a high percentage of total cost transferred as wages, are those which fall in the upper left hand quadrant of Figure 2 13 Dollar values calculated using the June 1999 exchange rate of US$1=R6.11.

McCord & Slater
27
Percentage of total cost to labour The second approach found in the literature assesses the labour intensity of a programme, by reviewing the percentage of total programme cost paid out in wages. As discussed above, Subbarao et al suggested that internationally, wage typically represents between 30% and 60% of total cost (Subbarao et al, 1997), although del Ninno et al argued that internationally mean labour intensity was above 60% in PWPs (del Ninno et al, 2006). These international findings are compared with analysis available for sub-Saharan Africa, drawn primarily from Southern Africa. In order to promote the cost-effectiveness of a PWP, in terms of labour intensity (the percentage of total programme expenditure allocated to participants), a cap on the share of programme cost allocated to non-labour costs is often included in PWP design specifications. Examples of this approach are found in the ILO supported Gundo Lashu programme in South Africa, where labour was required to represent at least 45% of total spend, and Phases I and II of the Malawi Social Action Fund III (MASAF) PWP in which a similar minimum of 40% was included (Chirwa, 2007). This approach can be problematic, particularly in situations where labour costs are rising more rapidly than capital costs, or where the wage/capital ratios are set without reference to the level of capital investment required to produce the desired physical assets. The latter case this can result in scenarios where the quality of asset created is compromised by utilizing cheaper but inferior inputs, in order to adhere to the ratio, or where capital rich components of infrastructure are not completed, to the detriment of the functioning of the overall asset. An example is where roads are constructed under a PWP, but the bridges required for the roads to be functional year round are not completed, due to their higher capital/labour cost ratios. Such outcomes are less common in type C programmes, where the creation of infrastructure is the primary objective of the intervention and so the quality and durability of the asset produced is likely to be a higher priority than for example in type A programmes, where the priority is the provision of employment. In the Adato et al study of PWPs in the Western Cape in South Africa, the budget share accruing to labour varied from a low of 11%-22% for programmes relating to the creation of transport infrastructure, to almost 100% in the case of recreation ground maintenance. These findings were consistent with national level analysis by the South African National Economic Forum (1994) which found that simple projects and small scale agriculture related infrastructure entailed a 40-80% share to labour, compared to shares as low as 5-15% of total cost for water reticulation, storm water, sanitation, roads and railways projects. In the case of the Ethiopian PSNP the share of total programme costs allocated to labour was calculated to be 67% (Smart, 2007). This illustrates how the percentage of cost allocated to labour varies according to the capital intensity of the sector, and that the creation of socially or economically desirable infrastructure may not necessarily entail maximum labour absorption per unit spend, highlighting the potential trade off between the number of jobs created, and the nature (and quality) of the asset created. An examination of the two South African programmes for which detailed budgetary information is available indicates a labour share of 45% in the case of a rural road construction programme (Taylor et al, 2005), compared to 70% to 80% for rural road maintenance (McCord, 2002), again illustrating the importance of the capital inputs and level of technical complexity in determining the share of PWP budget which will be directly transferred to workers. Cost of transferring one dollar The third approach used in the literature for assessing cost-effectiveness is based on an assessment of the cost of transferring a dollar to a beneficiary through a PWP. This is a corollary of the labour shares in the total budget, discussed above, and subject to similar data constraints and inconsistencies. Systematic primary data on this costing is not available for most sub-Saharan African PWPs, but information is available from a range of secondary sources on programmes in South Africa, Malawi, Zambia and Ethiopia, which provide the cost of transferring a unit of benefit through both PWP. This information has been summarised in Table 2 below. Where possible,

ODI Overview of Public Works Programmes in Sub-Saharan Africa
28
actual data on the cost of delivering a US$1 through a cash transfer programme in the same country and the same year has also been included, in order to provide an indication of the relative costs of a unit transfer through PWP and cash transfers, based on White and McCord, 2006.
Table 2: The cost of transferring US$1 through PWPs (Literature Review & Synthesis)
Country Programme Year Payment modality
Cost to transfer $1*
Cost to transfer $1 through Cash Transfer programmes in same country and year**
Source Notes
Ethiopia PSNP PWP Component
2006 CFW/FFW 1.48 Own calculations from Smart, 2007
Includes the value of transfers, public works capital inputs, training and monitoring and institutional support costs
Malawi EU/GOM PWP 2001/2 CFW 4.54 1.65 White and McCord, 2006
EU/GOM PWP 2002/3 CFW 6.08 White and McCord, 2006
EU/GOM PWP 2003/4 CFW 7.06 White and McCord, 2006
EU/GOM PWP 2004/5 CFW 5.10 White and McCord, 2006
MASAF PWP 2003/2004
CFW 2.5 Chirwa, 2007
ILTPWP 2003/2004
CFW 1.15-1.61 Own calculations from Devereux and Coll-Black, 2007
Based on ‘total cost’, including the value of the transfers, capital inputs and administration
MASAF PWP 2004/2005
CFW 3.75 White and McCord, 2006
MASAF III PWP
2005 CFW 1.41 Chirwa, 2007
Government/EU SPRINT
2005/06
CFW 1.75 Chirwa, 2007
I-LIFE 2005 FFW 8.21 1.23 White and McCord, 2006
Excludes management, administration distribution and material costs. High cost due to international food purchase and shipping
Based on existing FFW
1999 FFW 2.97 1.34 Smith 2001 Both CT and PWP estimates are based on transfers to a particular population segment, the moderately poor
Based on MASAF costings
1999 CFW 3.09 1.34 Smith 2001 As above
South Africa
Zibambele 2001/2 CFW 1.37 Own calculations from McCord, 2002
High labour intensity (70-80%)

McCord & Slater
29
Gundo Lashu 2002/3 CFW 2.52 Own calculations from Taylor, McCord and van Seventer, 2005
45% labour intensity
NEF 1992-8
CFW 2.08 McCord, 2002
Zambia Eastern Province Feeder Roads Programme
1999 CFW 5.14 White and McCord, 2006
Eastern Province Feeder Roads Programme
2000 CFW 4.83 White and McCord, 2006
Eastern Province Feeder Roads Programme
2001 CFW 4.88 White and McCord, 2006
ZAMSIF Emergency Relief PWP
2004/5 CFW 7.28 White and McCord, 2006
Project Urban Self Help
2004 FFW 1.81 White and McCord, 2006
Project Urban Self Help
2005 FFW 1.42 1.09-1.48 White and McCord, 2006
** White and McCord, 2006.
Table 2 illustrates the wide range of costings found within PWPs in Southern Africa, ranging from US$1.37 to US$8.21 to transfer US$1 to a beneficiary. The table also illustrates the extent of cost-effectiveness variation found by different researchers analyzing the same programme, as in the case of the MASAF PWP in Malawi, where values of both US$1.41 and US$3.75 have been published for the same programme and over a largely identical period. Even where a single researcher has carried out the analysis, values of US$1.41 and US$2.5 are presented for subsequent years of the same programme, (Chirwa, 2007), illustrating the problem of inconsistent data and the lack of conventions governing cost calculation. RHVP underline this problem, arguing with regard to the apparent variation in Malawi PWP costings included in their 2008 analysis that, ‘this apparent difference in cost-efficiency appears to stem from different approaches to attributing overhead costs’ (RHVP, 2008). Much of the variance in the PWP cost-effectiveness estimates in Table 2 is likely to result from inconsistencies in the calculation of the overall programme budget. In the case of FFW programmes, it may also be influenced by assumptions made in assessing the real cost of the food distributed in a FFW programme, rendering cross programme cost comparison problematic, as argued above. It is noteworthy that the FFW programmes are not consistently more or less costly that the CFW programmes, although this is likely to be due to inconsistencies in costing these programmes, with the food component being completely excluded as a line item in some costings, costed at national price at time of consumption in others, sometimes including and sometimes excluding internal transport storage and handling costs (ITSH) and in others being costed on the basis of actual purchase price and including international shipping costs (see also discussion in RHVP, 2008). It is interesting to note that the lowest cost programme is a multiple year type B CFW programme of road maintenance, the South African Zibambele programme, with a cost per unit transferred of only 1.37. On the basis of sub-Saharan Africa research, McCutcheon has argued that multiple year programmes, offer considerable potential for cost reduction and increased efficiencies over time, and this may also be a factor in the cost variations (McCutcheon, 2001). The table indicates that where comparable data are available, the cost provision of $1 through a PWP is consistently higher than provision through a cash transfer alternative in the countries
ODI Overview of Public Works Programmes in Sub-Saharan Africa
30
reviewed, based on Smith 2001 and White and McCord 2006. Smith’s work in Malawi is particularly interesting, as it indicates a greater disparity between cash transfer and PWP costs, if the poorest, rather than ‘the poor’ are specified as the target group, with the cost of $1 transferred to the poor using a PWP being $2.97, compared to $1.34 for a cash transfer, while the cost of transferring $1 to ‘the poorest’ being $13.9 and $1.73 respectively, suggesting that poverty targeting may be significantly more costly through PWPs than cash transfers due to the complexity of achieving poverty targeting within PWPs. The robustness of these assertions is not explored in this study, but it does indicate a potential area of future research. The limited data available does however confirm the intuitive expectation that there is a cost premium associated with the adoption of PWP, over cash transfers, to deliver a resource transfer, and suggests that the premium may increase if the criterion is expanded to transferring US$1 to the poor or poorest. From a fiscal perspective, such a premium is acceptable only if the value of assets created and any other benefits specific to PWP provision of social protection, are commensurate with this premium, a question which remains largely unexplored in the literature and evaluations to date (McCord, 2009a). Interestingly recent work carried out by the ILO in Ethiopia using the newly developed Rapid Assessment of Poverty Impacts (RAPI) methodology indicates the difficulty of identifying the anticipated sustained household level benefits resulting from the assets created in a PWP, which would in part justify such a premium (Osei-Bonsu and Mengesha, 2007). Devereux and Coll-Black also refer to the lack of data on the frequently anticipated but empirically elusive benefits resulting from infrastructure creation, questioning the value added offered by PWPs in return for the cost premium, with reference to a labour-intensive road programme in Mozambique;
‘The programme memorandum stated that “public works can have higher transaction costs than direct transfer programmes, but contribute to social capital, to asset accumulation (reducing vulnerability), and to longer-term economic growth through the construction or maintenance of infrastructure.” It is difficult to assess the validity of this statement given the lack (thus far) of evaluation documents.’ (2007:148)
The implication of the available PWP analysis in the region is that although the cost of providing social protection through PWPs is likely to be higher than provision by alternative means, it is not possible to identify with certainty or consistency what the value of the additional premium may be, in terms of cost per unit transferred, relative to cash transfers, nor is it possible to assess the extent to which commensurate economic benefits are attained, at either household, or economy wide level, through the adoption of a PWP approach. Finally, it is critical to mention that while cash transfers provide an ongoing transfer, PWPs, as implemented in sub-Saharan Africa, conform almost exclusively to the type A or C approach, providing a single short term episode of employment (typical duration is five months). When considered in this light, it is clear that direct comparisons between the relative costs of PWP and cash transfer provision in the region are not inherently useful, as they are represent very disparate social protection interventions (see discussion in McCord, 2006b). More direct comparisons would be meaningful if comparing cash transfer provision with type B programmes, but in this case, it would be important to also take into account the cost and benefits of the infrastructure (or services) provided by the programme, in addition to the cost of transferring a unit of benefit to the participant. Cost-effectiveness ratio analysis The fourth, and most complex appraisal framework for addressing the question of PWP cost-effectiveness attempts to generate internationally comparable analyses of the cost-effectiveness of PWPs by calculating programmes’ ‘cost-effectiveness ratios’, which are estimated by modelling the net gain to poor workers arising from a PWP, and then by deriving from this ratio the unit cost of a transfer to the poor (Ravallion, 1998; Subbarao, 2001). This model represents a significant

McCord & Slater
31
advance on the approaches discussed above, taking into account a number of critical factors which influence the social protection outcome and cost, and which extend beyond the basic labour intensity of the intervention, including i) the extent to which the poor are included in the programme (the poverty incidence of participants) ii) a calculation of the net (as opposed to gross) wage gain taking into account income forgone,14 iii) indirect benefits accruing to the poor when assets are created in their neighbourhoods, and iv) the potential rate of cost recovery which might accrue to the state from the asset created. While the Ravallion approach offers greater insights than a simple cost per workday analysis, it is still dogged by a number of significant data and conceptual limitations. In terms of data constraints, the main problems remain the paucity basic cost data, and the lack of adequate data to populate the targeting and impact components of the model, resulting in a reliance on assumptions to inform key components of the methodology, particularly with regard to incidence (the effectiveness of poverty targeting and extent of leakage to the non-poor), the accuracy of assumed local unemployment rate, the benefit cost ratio (the extent to which projects produce benefits sufficient to cover their costs), and the current and future value of the asset created to poor participants), as discussed in McCord (2002). Changes in any of the assumptions informing these components of the model could significantly alter the model’s conclusions. The number of programmes which could be modelled without recourse to assumed values in these areas is extremely limited. As a consequence this type of cost-effectiveness is of only limited use in the development of an empirical evidence base to assess the relative performance of PWPs, and their selection as appropriate instruments for social protection (or other) purposes. Notwithstanding these limitations, it is interesting to review the results of the few cases where this model has been applied to sub-Saharan African contexts, (Adato et e al, 1999 and McCord, 2002). Application of the cost-effectiveness ratio model in sub-Saharan Africa The cost-effectiveness ratio model was applied to the type B case study programme, and the programme cost-effectiveness ratio was found to be of 0.31, with a cost of 3.21 units for a 1 unit gain by the poor in terms of current benefits, (and a ratio of 0.74 and cost of R1.36 in terms of current and future benefits taking into account predicted future gains to the poor from the assets created). The mean values for internationally MIC and LIC comparators were 0.20 and 0.28 respectively, with unit transfer costs of 5 and 3.6 for additional current earnings (0.4 and 0.41 respectively for current and future gains, implying unit transfer costs of 2.5 (Ravallion, 1998). Hence the type B case study programme was more effective than both LIC and MIC programme comparators, with costs at the lower end of the MIC job creation scale (McCord 2002). Adato et al carried out a similar analysis of type A and C PWPs in the Western Cape Province of South Africa using the same framework, and found a wide range of ratios, with substantially higher costs for a unit gain for the poor in all programmes but one. All but one programmes fell within a range of 2.27 and 28.82 for each unit gained by the poor (Adato et al 1999:210), see Table 3 below.
14 This is derived from expected earnings outside the programme and the probability of finding such work.

ODI Overview of Public Works Programmes in Sub-Saharan Africa
32
Table 3: The cost-effectiveness ratio in selected South Africa PWP and international comparators
Cost of $1 transfer to the Poor (current and future)
Cost-effectiveness Ratio (current and future)
Cost of $1 transfer to the Poor (current)
Cost-effectiveness Ratio (current)
Source
Zibambele (Type B)
$1.36 0.74 $3.21 0.31 McCord 2002
W Cape Synthesis
$2.27-$28.82
Adato et al 1999
MIC $2.5 0.4 $5 0.2 Ravallion 1998
LIC
$2.5 0.41 $3.6 0.28 Ravallion 1998
While the available data is extremely limited, and the findings are vulnerable to the assumptions made in constructing the data, the range of outcomes found by Adato et al in the cost-effectiveness ratios from PWPs in South Africa indicates the heterogeneity of cost-effectiveness of projects within a single programme (the South African national CBPWP). This reflects significant programme design variations, with higher cost-effectiveness ratios being associated with low capital cost programmes, such as the type B Zibambele programme. It is interesting to note that most of the programmes are considerably less cost-effective than the MIC and LIC norms. The limited application of the Ravallion approach in the region to date clearly illustrates the heterogeneity of potential cost-effectiveness outcomes, contingent on programme design choices. Some limited conclusions can be drawn from this review of the four approaches to the assessment of cost-effectiveness in the region. Foremost is the need for the development of improved programme data, and conventions governing the calculation of programme cost and outcomes. Notwithstanding these limitations, it is clear that there is a significant range of cost-effectiveness in programming in the region, and, as would be anticipated, high labour intensity PWPs tend to be more cost-effective. This is particularly true for those programmes where the quality of output is not the primary objective, illustrating a potential trade off between asset quality and cost-effectiveness, in terms of the unit cost of the transfer to workers. However, the quality and impact of assets created is critical if the broader impacts of the programme, rather than just workdays created, are taken into account. The omission of the quality and economic impact of assets created in calculating the cost-effectiveness of PWP programming is a key problem in three of the four approaches dominant in the literature, which urgently needs to be addressed.
The Impact of the PWP Wage on Household Income In this section an exploration is made of the contribution of the PWP wage to household income. Ideally the calculation of the impact of the PWP should factor in the economic benefits of the assets created, and the second round employment benefits. Regional research however, has focussed exclusively on the immediate wage income effects, rather than an empirical assessment of all the wage, employment and asset effects on a second round basis. For this reason second round benefits are not included in the analysis, and the review focuses exclusively on the impact of the PWP wage on household income. A range of literature is reviewed, and survey data from the two South African case study programmes is used to examine the question in detail, focusing on both gross and net wage income and taking into account income forgone (McCord, 2009a). Next, various approaches to estimating the impact of the PWP wage on total household income and poverty are reviewed, drawing on survey data from the case study programmes. The main insight arising from this analysis is that different approaches to calculating both household income and the value of the wage can lead to disparate assessments of the impact of the programme at household level.

McCord & Slater
33
Household income Most PWPs do not include baseline socio-economic profiling of programme participants, rendering an assessment of the household income among participants, and hence the impact of the PWP wage on household income problematic. Among PWPs offering short-term employment, or developed in response to an emergency, (type A and C programmes), baseline socio-economic data are rarely gathered on programme participants:
‘For safety-net interventions, such as workfare programs, that have to be set up quickly in response to a macroeconomic or agro-climatic crisis, it is often unfeasible to delay the operation in order to do a baseline survey.’ (Ravallion, 2003:8)
However, even large-scale programmes which have not been developed under emergency conditions, typically do not gather baseline socio-economic data on participants or their households; neither the PSNP in Ethiopia, nor the CBPWP or EPWP in South Africa, nor the MASAF PWP in Malawi gathered baseline data from which the contribution of PWP wage income to household income could be empirically evaluated (McCord, 2009a). Devereux et al carried out a survey on a sample of PSNP participants (Devereux et al, 2006), and found that participation in the PWP resulted in a 57% increase in household income during the period of employment.15 Interestingly however, despite the major increase in household income resulting from the programme and the many benefits associated with this, one of the key findings from their analysis was that ‘PSNP transfers did not provide complete protection against hunger’, with the transfers being either too small or too unpredictable to address this objective (Devereux et al, 2006). Similar findings are indicated by Chirwa et al with regard to Malawi’s MASAF programme, and their data suggests that PWP participation added 68% to total household income, (including in-kind income from subsistence agricultural production), although this represented only 21% of the wage which would be required to enable households to close the household subsistence poverty gap (Chirwa et al, 2004). This once again indicates a PWP wage which contributes to reducing the poverty gap, but does not offer complete protection against hunger. More detailed analysis of the impact of the PWP transfer on household income is possible in the two case study programmes. The contribution of gross PWP income as a percentage of the total household wage income in these programmes was 76% for the Zibambele, type B programme, and 68% for the Gundo Lashu type C programme (McCord, 2009a). These findings are set alongside the relevant figures for the PSNP in Ethiopia (Devereux et al, 2006), and the MASAF PWP in Malawi (based on my own calculations from Chirwa et al, 2004) in Table 4 below.
15 A gross transfer of US$103 was made to households with mean non PWP incomes of $181.
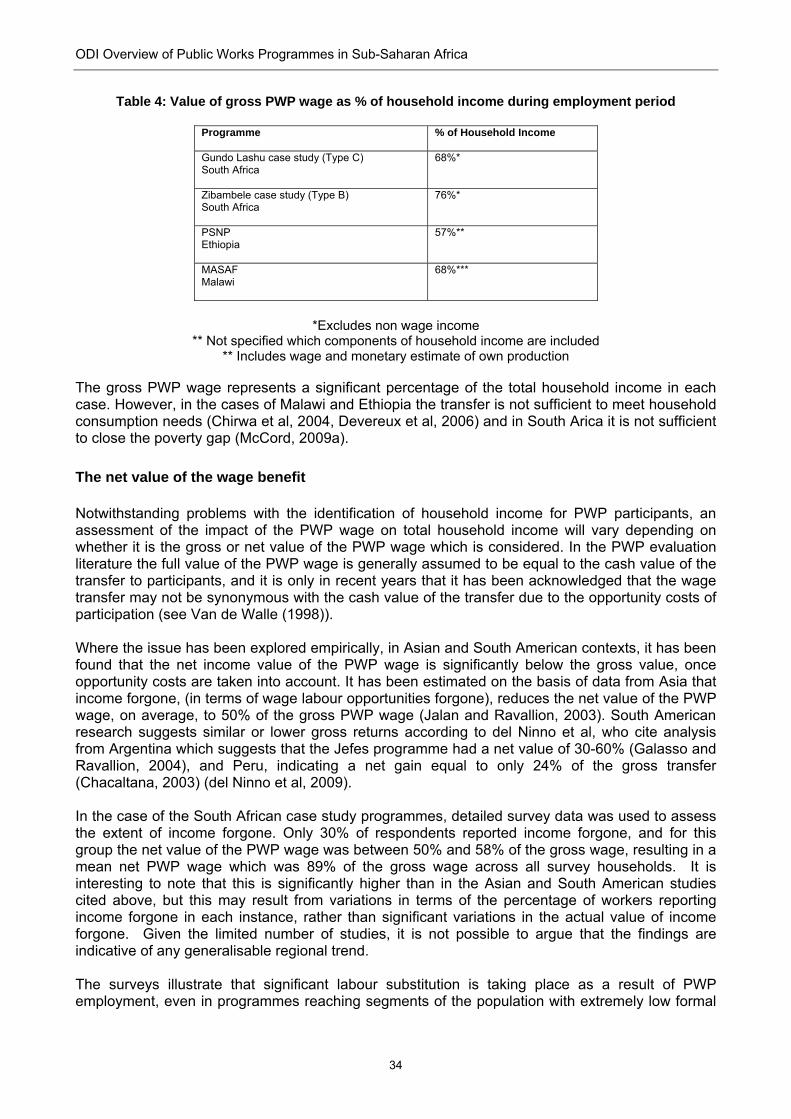
ODI Overview of Public Works Programmes in Sub-Saharan Africa
34
Table 4: Value of gross PWP wage as % of household income during employment period
Programme
% of Household Income
Gundo Lashu case study (Type C) South Africa
68%*
Zibambele case study (Type B) South Africa
76%*
PSNP Ethiopia
57%**
MASAF Malawi
68%***
*Excludes non wage income
** Not specified which components of household income are included ** Includes wage and monetary estimate of own production
The gross PWP wage represents a significant percentage of the total household income in each case. However, in the cases of Malawi and Ethiopia the transfer is not sufficient to meet household consumption needs (Chirwa et al, 2004, Devereux et al, 2006) and in South Arica it is not sufficient to close the poverty gap (McCord, 2009a). The net value of the wage benefit Notwithstanding problems with the identification of household income for PWP participants, an assessment of the impact of the PWP wage on total household income will vary depending on whether it is the gross or net value of the PWP wage which is considered. In the PWP evaluation literature the full value of the PWP wage is generally assumed to be equal to the cash value of the transfer to participants, and it is only in recent years that it has been acknowledged that the wage transfer may not be synonymous with the cash value of the transfer due to the opportunity costs of participation (see Van de Walle (1998)). Where the issue has been explored empirically, in Asian and South American contexts, it has been found that the net income value of the PWP wage is significantly below the gross value, once opportunity costs are taken into account. It has been estimated on the basis of data from Asia that income forgone, (in terms of wage labour opportunities forgone), reduces the net value of the PWP wage, on average, to 50% of the gross PWP wage (Jalan and Ravallion, 2003). South American research suggests similar or lower gross returns according to del Ninno et al, who cite analysis from Argentina which suggests that the Jefes programme had a net value of 30-60% (Galasso and Ravallion, 2004), and Peru, indicating a net gain equal to only 24% of the gross transfer (Chacaltana, 2003) (del Ninno et al, 2009). In the case of the South African case study programmes, detailed survey data was used to assess the extent of income forgone. Only 30% of respondents reported income forgone, and for this group the net value of the PWP wage was between 50% and 58% of the gross wage, resulting in a mean net PWP wage which was 89% of the gross wage across all survey households. It is interesting to note that this is significantly higher than in the Asian and South American studies cited above, but this may result from variations in terms of the percentage of workers reporting income forgone in each instance, rather than significant variations in the actual value of income forgone. Given the limited number of studies, it is not possible to argue that the findings are indicative of any generalisable regional trend. The surveys illustrate that significant labour substitution is taking place as a result of PWP employment, even in programmes reaching segments of the population with extremely low formal

McCord & Slater
35
employment. The extent of this substitution and potential complementary intra-household labour reallocation, (not examined in the existing literature), will have a significant effect on the additional income which PWP employment provides. If significant intra-household labour reallocation were taking place to accommodate work forgone by the PWP participant, the extent of income forgone at a household level would be lower and the net value of the PWP wage higher. The reality of income forgone by PWP employees is recognised by the World Bank:
‘Since poor people can rarely afford to be totally idle, they often give up some form of income to join a workfare scheme.’ (2001:156)
In the light of this reality, which is particularly relevant in the contexts of chronic poverty and underemployment which characterise labour markets in many sub-Saharan African countries, it is clear that the real value of the PWP wage in terms of total household income may often be significantly less than the transfer anticipated by programme designers, unless income forgone is taken into account during programme design. Net PWP wage as % of total household income If the net PWP wage is calculated as percentage of total household income, the findings are significantly different from when the calculation is based on gross wage and household wage income. Total household income was calculated in the case study programmes by aggregating wage, the net PWP wage,16 state social grants and insurances, private transfers, remittances and community contributions (see a, 2009). The net PWP wage accounted for 44% and 35% of total household income compared to 76% and 67% when the gross wage and limited sources of household income were taken into account, see Table 5.
Table 5: PWP wage as % of household income under different assumptions
Zibambele (Type B)
Gundo Lashu (Type C)
Gross wage as % of household wage income
76%
68%
Net wage as % of total household income
44%
35%
Source: Derived from McCord, 2009a.
Table 5 highlights the importance of selecting consistent methodological approaches when analysing programme impact, in order to ensure comparability and meaningful cross programme analysis. It also provides the important insight that the increase is greater in the programme offering a lower total monthly wage, but targeting a poorer segment of the population, due to the greater depth of poverty experienced by this group – i.e. a lower wage can have a greater impact in terms of increasing household income if it is targeted at a poorer section of the population.
16 The net PWP wage used here is based on reported PWP wage, less reported value of income forgone.
ODI Overview of Public Works Programmes in Sub-Saharan Africa
36
Opportunity costs in addition to income forgone While the inclusion of income forgone in a calculation of the real value of the PWP wage is important, this represents only one of a significant number of potential monetary and non-monetary costs of PWP participation. Pellisery (2008) identified a range of costs relating to non-wage domestic and subsistence activity forgone, transportation, and the cost of securing selection in the context of a highly rationed resource, as a result of the rents demanded by those controlling access to PWP participation. Although frequently overlooked, such costs may be significant in terms of the social, developmental or livelihoods impact of reduced domestic (for example, childcare) or subsistence activities. The demand for bribes and payments in return for PWP selection is symptomatic of a discretionary approach to rationed PWP employment, typical in the type A and C programmes which typify most PWP in sub-Saharan Africa.17 Together these considerations could potentially render the real cost of participation higher than generally accepted, and the net value of the transfer lower than suggested in the literature, even when income forgone is taken into account. In the light of this, the question of the net wage and the assumed benefits thereof, remains open to debate. The largely unproblematised adoption of a PWP wage without taking these cost factors into consideration remains a significant weakness in the current evaluation literature.18
The Impact on Poverty Having discussed the impact of the PWP wage on household income, the impact of PWP participation on income and non-income poverty is now reviewed using the two case study programmes. The impact of PWPs on income poverty The impact of the two case study PWPs on income poverty is illustrated Poverty Incidence Curves (PICs) for the two programmes following Ravallion (2003), and a review of total income in PWP households relative to the poverty line, using Foster-Greer-Thorbecke (FGT) indices to estimate the incidence and depth of poverty. PICs are cumulative incidence graphs of monthly income of households participating in the PWP, which illustrate the impact of PWP income on headcount poverty. PICs for the two case study programmes are set out in Figures 19 and 20 below. The upper curve illustrates total monthly income per adult equivalent, including the PWP income; and the lower curve the ‘estimated counter-factual PIC, after deducting the imputed income gains from the observed (post-intervention) incomes’ (Ravallion, 2003:2). The vertical line represents the poverty line.19 The shift of the curve to the right in both cases illustrates a positive impact in terms of poverty reduction of programme participation.
17 It is interesting to note however that even in Employment Guarantee Schemes (EGS) such as the Maharashtra Employment Guarantee Scheme, which are often rationed in reality, even if universal in intent, there is still space for the extraction of rents in return for programme inclusion (Pellisery, 2008). 18 If the impact of PWP on social protection is to be adequately assessed, the impact of the wage, in terms of its function within the household economy needs to be included in the appraisal framework, in addition to the net value of the wage. To assess the social protection impact of a PWP in line with this critique, significant additional contextual, programme performance and participant socio-economic data would be required, as well as post programme data to clarify cost, impact and incidence. 19 Several poverty lines are currently in use in South Africa, offering differing estimates of the proportion of the population living in poverty, and for this analysis, a version of the Household Subsistence Line (HSL) was selected with a value of R486 (US$).

McCord & Slater
37
Figure 19: Poverty impact of Gundo Lashu, Type C
Source: Own calculations from PWP Survey 2003. Figure 19 indicates that approximately 5% of the participants in the Gundo Lashu type C programme were brought out of poverty by participation in the programme, on the basis of the poverty line although this change in headcount poverty is not statistically significant.20
20 χ=1.86 at 0.05 significance level, with df =1.
0.2
.4.6
.81
0 500 1000 1500 2000
Income Without PWP Income With PWP

ODI Overview of Public Works Programmes in Sub-Saharan Africa
38
Figure 20: Poverty impact of Zibambele, Type B
Source: Own calculations from PWP Survey 2003. Figure 20 illustrates the Zibambele type B programme had no impact on headcount poverty. Notwithstanding the negligible effect of programme participation on headcount poverty, programme participation reduced the poverty gap in both instances, reducing the depth of income poverty experienced in PWP workers’ households. Using the Foster-Greer Thorbecke method to derive headcount estimates of poverty within the sample households confirmed the PIC story; even while participating in PWPs, 99% and 86% of households in the B and C programmes respectively remained below the poverty line in terms of total household income. Participation in the PWP did not move these households out of poverty, even during the period of programme participation. The headcount poverty findings overall make it clear that, with all sources of household income taken into account, PWP participation fails to bring the majority of workers’ households in either programme above the poverty line. This highlights the fact that when examined empirically, even programmes generally considered to be ‘successful’ in terms of their overall perceived and evaluated impact may not move participants out of poverty, a critical insight in terms of tempering the sometimes exaggerated expectations surrounding PWP implementation. Income poverty conclusion A key insight from this research is that most participants in the two programmes were living below the poverty line, even while in receipt of the PWP wage. However, while participation in the PWP did not move these households out of poverty, it did reduce the depth of poverty experienced in workers’ households. This finding is consistent with the argument set out by Coll-Black and Devereux, with reference to social transfers in general;
‘in the few cases where serious efforts have been made to quantify the poverty impacts of social transfers (e.g. by BRAC), the conclusion is that the severity of poverty has been reduced, but not necessarily that the prevalence of poverty has fallen: programme beneficiaries remain poor, but they are less poor than before.’ (2007:65)
0.2
.4.6
.81
0 200 400 600 800
Income Without PWP Income With PWP

McCord & Slater
39
The impact of PWPs on non-income indicators of poverty The PWP literature tends to assess impact in terms of the value of the wage transferred. However, the case study PWPs offer evidence of positive impacts on other dimensions of poverty, including consumption, financial and material asset ownership, and human capital formation (education and nutrition) as well as reported impacts relating to psycho-social well-being and access to other available benefits, such as state grants as a result of programme participation (McCord, 2009a), despite the limited headcount poverty impact, corroborating findings by Devereux et al with regard to the PSNP (2006). These impacts were particularly notable in relation to human capital formation, in the form of regular school attendance by all children in PWP households, and improved nutrition, although the impact was only significant in the case of the type B programme which successfully targeted the poor (McCord, 2009). Impact conclusion There is very little data available on which to base rigorous assessments of the impact of PWP implementation on household poverty in the sub-Saharan Africa region. The limited research carried out to date suggests that PWP income supplements monthly household income by between 35 – 75%, depending on assumptions regarding income forgone and how household income is calculated. While it is not possible to draw any regional conclusions on the basis of the available evidence, the case study data indicates that where programmes are successfully targeted to the poor, the impact on all aspects of poverty, monetary and non-monetary, is greater, even with a lower transfer value, than when the less poor are employed. The available research indicates that while PWP participation may not reduce headcount poverty, it may significantly reduce the depth of poverty in participating households. This is a critical insight, and should lead to a tempering of the sometimes excessive expectations associated with much PWP programming. Improved data would greatly improve the potential for cross programme analysis and insights into impact.
Targeting Efficiency The next section of the report addresses the question of the targeting efficiency of PWPs in the region. Again, as in the case of estimates of cost-effectiveness, the paucity of data inhibits comparison between PWPs, and with other forms of social protection, such as cash transfers. Incidence data Socio-economic data are critical if the targeting efficiency of a PWP is to be assessed. However, as noted above, for most PWPs, no socio-economic data are available on programme participants. The absence of incidence data renders analysis of targeting effectiveness impossible, as well as any robust empirical assessment of performance against objectives related to reaching a particular socio-economic group, rather than simply the promotion of aggregate employment. In most cases, it is assumed that the work requirement and low wage provided in a PWP will be sufficient to ensure that those for whom the programme was intended, usually 'the poorest’, are actually participating in the programme. There is however little evidence to suggest that this assumption is necessarily robust, and where tested post hoc, significant inclusion errors are found in many PWPs (see for example Barrett and Clay, 2003; Devereux and Solomon, 2006; Lembani and Mandala, 2006). The extent of exclusion errors is also a major and possibly more serious concern, and occurs in most instances, given the limited scale and duration of PWP employment in

ODI Overview of Public Works Programmes in Sub-Saharan Africa
40
relation to those in need of social protection among the working age poor, an issue which is discussed in the next section. PWP access: targeting and rationing practices In the context of mass unemployment and extremely low informal sector earnings, it is not evident that the principle of ‘less eligibility’ (the work requirement and low wage) will ensure that only the ‘poorest’ will access PWP employment. In the case of most PWPs in sub-Saharan Africa, access to PWP employment is strictly rationed, due to the large scale of the unemployment, and the relatively limited scale of PWP employment. An example of this is the programme developed under phase one of the Expanded Public Works Programme (EPWP) in South Africa (2004-2008), one of the larger PWPs in sub-Saharan Africa, absorbed less than 2% of unemployed workdays per annum. As a result of the demand for PWP employment exceeding the supply of PWP jobs, targeting and rationing mechanisms become critical determinants of the extent to which such programmes reach intended groups. This issue is particularly critical since in most SSA contexts PWPs represent the only significant policy response to the social protection needs of the working age poor. In the context of a highly rationed resource, it is important to know how effective targeting is, in terms of the proportion of the transfer which is reaching the poor, and whom among the poor are the beneficiaries, in terms of their relative poverty. This question of programme incidence is explored below, with reference to the two case study programmes. Targeting evidence While there is only limited data on targeting efficiency, some broadly consistent lessons emerge from the region. With reference to two components of the MASAF PWP, Devereux and Coll-Black conclude;
‘An analyses of community-based targeting supported by CARE as compared with self targeting concluded that the method used by CARE was more effective at targeting the poor (World Bank 2006). An evaluation of the CARE pilot district reports that community-based targeting procedures were more effective in targeting the most vulnerable households than those that rely on self-targeting through the wage rate or “first come first serve” basis (Devereux and Coll-Black, 2007:126)
This distinction between targeting outcomes when ‘community’ as opposed to ‘wage based self targeting’ are adopted is illustrated by data from the two South African case study programmes, one of which adopted the former (the type B programme) while the other adopted the wage-based self targeting more typical of type C programmes which have social protection objectives as well as aggregate employment goals. The type C programme adopted a restricted wage as the primary mechanism to target the poor, setting the wage below the minimum wage, to deter all but the poorest from self-selecting into PWP employment, in line with the principle of ‘less eligibility’. In addition the programme adopted additional demographic targeting criteria, using quotas for the employment of women, youth and the disabled. No explicit poverty criteria were adopted as it was assumed that poverty targeting would be satisfactorily achieved through the reduced wage level. During the implementation of the type C programme, mobile labour from outside the immediate programme area complemented local labour supply at times when local labour supply was insufficient to meet construction demand, with participants being selected on the basis of availability, rather than other explicit targeting criteria. At other points in the construction cycle, when the local labour seeking employment exceeded PWP job availability, job rationing was required, and a lottery used to allocate employment opportunities, with exigency overriding the more complex ‘official’ participation criteria.

McCord & Slater
41
The implication of this finding is that the targeting nuances incorporated into the design of a type C programme may be compromised by the exigencies of differential labour demand throughout the construction process. Anecdotal evidence from around the region suggests that the labour scenario found in the case study is common in type C programmes, with excess demand for PWP employment typically resulting in a lottery-based allocation of jobs, on the assumption that the wage level itself will exclude the non-poor, and when demand for labour outstrips local labour availability, migrant labour tends to participate. Hence, the degree of participation by particular target groups at any point in the implementation cycle was contingent on the size of the available labour supply in relation to demand, and also on the extent to which the private contractors adopted official targets. The lack of incentives for the private sector contractors executing a PWP to meet either explicit demographic or implicit poverty targets in their recruitment processes has been identified as an issue in both Asia and Africa (McCord, 2006a). In the type B programme, poverty was explicitly used as the targeting criterion by community groups. Within the group identified as the ‘poor’, the poorest were targeted, using membership of female-headed households as a secondary criterion to reach this subset of the most disadvantaged. In this programme the wage was set at the minimum wage for the rural construction sector. As with the type C programme, excess demand for PWP jobs also led to rationing. In this case, each applicant was considered on the basis of strict poverty criteria (based on a combination of factors such as household labour availability, wage income and grant income) by community representatives. The extent of community participation in the selection process was feasible due to the long-term relationship between the community and government implementing agencies, as the institutions adopted for PWP selection were functioning prior to the implementation of the PWP (McCord, 2002).21 This insight highlights the critical importance of the institutional processes through which targeting takes place, and also the phasing and scale of labour demand in relation to labour supply in a given area, in determining effective poverty targeting. The characteristics of PWP participants resulting from different targeting mechanisms Survey analysis indicates that the different targeting and rationing approaches described above resulted in different incidence outcomes, with the two programmes attracting demographically different participants (McCord, 2009a). The type B participants were older, and had a higher percentage of females than were found in the type C programme. Ninety two per cent of all type B programme participants were household heads or spouses of heads, compared to only 42% of their type C counterparts, who were more likely to be the children of household heads. This suggests that the two programmes were recruiting different household segments, participants of differing ages and positions within the household hierarchy, and consequently, it may be imputed, with different labour market functions and responsibilities within the household. These demographic findings are consistent with the type C practice of employing all comers seeking full-time work and randomly selecting participants through lotteries where there are excess applicants, and the type B programme practice of recruiting poor rural female household heads. By definition, the latter group would tend to be older, and comprise a group for whom full-time work, such as that offered in the type C programme, may
21 The extent of active governance of the programme by the community resulting from this institutional setting was illustrated by a report given by one focus group that one participant had been invited, by the community who had previously selected her for participation, to step down from the programme upon receipt of a pension by a household member, on the grounds that she no longer conformed to the poverty selection criterion, since her household now had access to an alternative form of income. This is indicative of the effective community ownership and commitment to the programme’s purpose and the objective of selecting the poorest for participation.

ODI Overview of Public Works Programmes in Sub-Saharan Africa
42
have been unattractive due to competing domestic responsibilities; a factor which would not represent a constraint for younger household members without the same burden of domestic responsibility (McCord 2009a). Propensity score matching to assess PWP incidence A statistical analysis of incidence in the two programmes confirmed a significant difference in terms of the socio-economic profile of the participants. In the absence of baseline socio-economic data propensity score matching (PSM) techniques were used to compare incidence (McCord and Wilkinson, 2009).22 Using PSM techniques survey households with employees in the two programmes were matched with Census households on the basis of a number of household characteristics excluding income.23 The income distribution of the matched households was then compared to that of the other households in the survey areas in order to assess the income status of participating households. Other household characteristics were also compared across the two groups. In this way an income profile of PWP participants was constructed which was reviewed in the context of the income distribution of the population from which participating households are drawn, to gain an insight into the incidence of the two programmes in terms of the relative economic status of PWP workers. The PSM analysis indicates that 35% of type C programme households and 57% of type B programme households fell in the bottom 40% and 45% of the income distribution respectively.24 Caldes et al. (2004) cite work by Coady et al. (2002) who reviewed more than 100 social protection programmes and found that the ‘median targeting performance was consistent with 50% of programme benefits accruing to the poorest 40% of the population’ (Caldes et al., 2004:31). On this basis, the community targeted type B programme incidence would fall above this median targeting performance at 57%, and type C below, at 35%, with the poor receiving 1.27 times their population share in the case of the former programme, and 0.875 in the latter, representing a significant difference between the two programmes. This confirms that the type B programme was more effectively targeted at the poor than the type C programme. The income distributions for the PWP and population groups are shown graphically in Figures 21 and 22. The type C households appear generally to be better off across the distribution, having fewer households in the bottom two income groups and more households in the third fourth and fifth income groups. The type B households were generally poorer than the overall population, with almost 75% of the PWP group in the bottom two income groups.
22 For a full technical description see McCord and Wilkinson, 2009. 23 This approach follows Rosenbaum and Rubin (1983) PSM is typically used to evaluate programme impacts by identifying a ‘control’ group with similar characteristics to the ‘treatment’ group and comparing the outcomes of the groups on a particular variable, such as unemployment status. In this case, however, the aim was not to select a comparator group for purposes of impact evaluation, but rather to identify households similar to the PWP households in the Census, in order to ascertain their income status relative to the overall population, to provide an insight into incidence. The use of PSM in the analysis of characteristics of households taking part in PWPs is not typical, in that i) it is not being used for programme impact evaluation, and ii) PSM is most often used to match individuals with other individuals, rather than matching households as in this instance. However, the use of PSM in a non-evaluation method is not problematic, as the basic assumption, that the probability of selection into the treatment group is the same for participants and non-participants, is not broken. Also, many examples can be found in the literature where matching has been used for households (and other units of analysis), such as Mendola (2007) in Bangladesh; Arun et al. (2006) in India and Guarcello et al. (2003) in Guatemala. 24 The 45th percentile is adopted in place of 40th as it is the closest approximation possible given the banding approach adopted in the Census, rather than continuous variable, which a 40th specification would require).
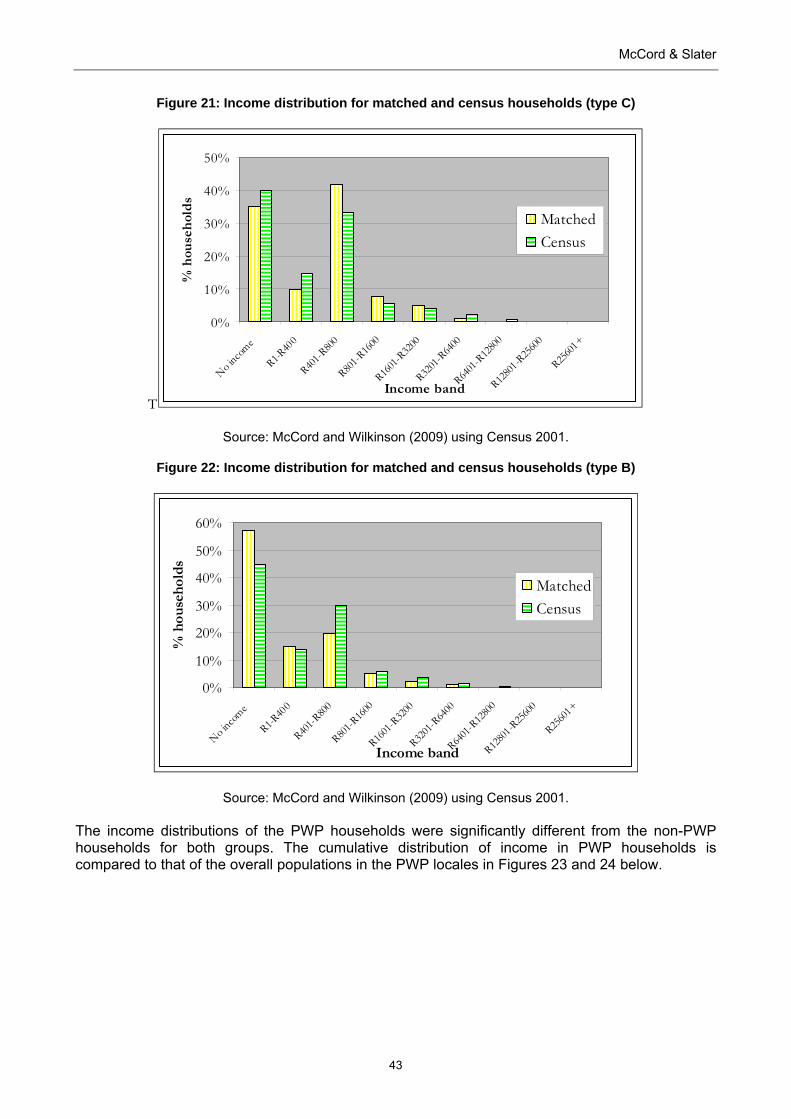
McCord & Slater
43
Figure 21: Income distribution for matched and census households (type C)
T
Source: McCord and Wilkinson (2009) using Census 2001.
Figure 22: Income distribution for matched and census households (type B)
Source: McCord and Wilkinson (2009) using Census 2001. The income distributions of the PWP households were significantly different from the non-PWP households for both groups. The cumulative distribution of income in PWP households is compared to that of the overall populations in the PWP locales in Figures 23 and 24 below.
0%
10%
20%
30%
40%
50%
No incom
e
R1-R40
0
R401-R
800
R801-R
1600
R1601-
R3200
R3201-
R6400
R6401-R
12800
R12801
-R25600
R25601
+
Income band
% h
ouse
hol
ds
Matched Census
0%
10%
20%
30%
40%
50%
60%
No inco
me
R1-R40
0
R401-R
800
R801-R
1600
R1601-R
3200
R3201-R
6400
R6401-
R12800
R12801
-R25600
R25601
+
Income band
% h
ouse
hold
s
MatchedCensus

ODI Overvie
Fig
Fig
These figuthan the otype B proincomes, cin which mof househo Logistic reThe main average, bindicators tB househodifferent inthat of the
ew of Public
gure 23: Cum
gure 24: Cum
ures illustraverall popu
ogramme paconfirming t
members weold income.
egression mconclusionsbetter off athan the ovolds were sndicators, thtype C prog
Works Prog
mulative dis
Source: Mc
mulative dis
Source: Mc
te that whiulation the tyarticipants whe analysis
ere selected
models confs drawn by across bothverall populasignificantly he poverty gramme.
rammes in S
stribution of
cCord and W
stribution of
cCord and W
le the typeype B partiwere dispros above, i.e.d by the com
firmed this McCord an
h the incomation from wpoorer thaincidence o
Sub-Saharan
44
f census inc
Wilkinson (200
f census inc
Wilkinson (200
e C programcipants we
oportionately. the type Bmmunity, re
analysis acnd Wilkinsome distributwhich they aan the overaof the type
n Africa
come & PWP
09) using Ce
come & PWP
09) using Ce
mme particire poorer thy drawn fro
B programmesulted in su
cross a ranon were thation and a are drawn, wall populatioB program
P matched in
ensus 2001.
P matched in
ensus 2001.
ipants werehan the oveom among he, offering l
uperior pove
ge of sociot the type Crange of
while on theon. Consist
mme was si
ncome (type
ncome (type
e marginallyerall populahouseholdslong term eerty targetin
o-economicC householdother socio
e same bastently, over ignificantly
e C)
e B)
y less pooration. In thes with loweremploymentng, in terms
indicators.ds were ono-economicsis, the type
a range ofsuperior to
r e r t s
. n c e f
o

McCord & Slater
45
The conclusion which can be drawn from this case study is that significantly different demographic and socio-economic segments of the population participated in the two different case study programmes. In the type B programme explicit poverty targeting objectives were attained by utilising community selection techniques to ration access, and offering flexible employment to reduce potential exclusion errors. As a result of these design considerations the poor received 1.27 times their population share of the PWP employment. By contrast, in the type C programme, which relied on wage-based self-targeting and offered full-time non-flexible employment opportunities, the poor received only 0.88 of their population share of employment. This analysis suggests that active poverty targeting, rather than reliance on the work conditionality and a low wage, may be required to promote the share of programme benefits transferred to the poor, and that by tasking community groups with selection, where community groups enjoy a degree of programme ownership in the context of a long-term relationship between local communities and implementing agencies, it is possible to promote the participation of the very poor, a relationship which, by definition, is more likely to be achieved in type B programmes. By contrast, in the context of the short-term case study programme (conforming to PWP types A and C) which was implemented by contractors without explicit poverty targets or incentives, the poverty incidence of participants was significantly lower, with the poorest being under-represented in the PWP participant group. The effectiveness of the community-targeting mechanism in the type B case was contingent on significant investment in social development by the implementing agency over a period of years, which was possible because of the extended duration of the programme and hence, the sustained nature of the relationship between the workers, the programme, and the community institution managing the programme at the local level.25 It is not clear whether such issues can be addressed in the context of short-term employment projects, particularly when they are implemented by the private sector, and when neither targets nor incentives for targeting the poor are in place, particularly given the additional expenditure on social development required. The limited poverty focus of the type C programme is illustrative of this problem, confirming research on the MEGS in India, which has also found evidence of the negative implications for successful poverty targeting of private sector implementation, due to the inherent tension between profit-based incentives and the costly investment in social processes required to ensure the inclusion of the poorest.26
Case Study Implications: Cost, Targeting and Impact on Household Income While empirical conclusions for the region cannot be drawn from two case studies, nevertheless, the case study analysis can offer some insights into the relative incidence and impact performance of the two dominant PWP types in the region, in a context of chronic poverty and unemployment, and highlights issues relating to design aspects of each model. The fact that one of the programmes was a poverty targeted type B programme offering ongoing employment through labour intensive work, while the other was a type C programme, with the typical characteristics of the short term construction-based PWP which dominates the genre in sub-Saharan Africa, is significant in terms of the different cost-effectiveness, targeting effectiveness, and household income and poverty impacts of the two programmes. The survey indicates that both programmes had negligible impact in terms of reducing headcount poverty, itself a key insight. However, both programmes contributed to reducing the depth of poverty experienced by participating households, and addressing other, non-monetary aspects of poverty. Despite the continued high levels of income poverty, participation in both programmes had a beneficial impact on all the dimensions of poverty examined; income, asset ownership,
25 A further indication of the community ownership of the programme was the social regulation of the distribution of the scarce resource of PWP employment within the community. 26 S Pellissery, Department of Social Policy and Social Work, Oxford University, 2004, pers. comm.

ODI Overview of Public Works Programmes in Sub-Saharan Africa
46
access to services, and the capabilities and psychosocial aspects of poverty. A critical difference however is that the initial situation of the poverty targeted type B PWP households was consistently found to be one of greater poverty than for the type C households, and consequently benefits which were, in many cases, marginal for type C households were significant among type B households (McCord, 2009a). In the case of the type B programme PWP participation impacted significantly on factors which influence the reproduction of poverty, examples being the reduction in chronic under-nutrition and increased participation in education, despite the low absolute value of the monthly transfer in comparison with that of the less well targeted type C programme. Whether this is due to the ongoing nature of the programme, as well as the more effective poverty targeting remains an open question, but certainly the impacts were sustained for a longer period in the open ended type B programme, compared to the average 4-6 month duration of the wage transfers under the type C programme, which rendered any programme benefits short term in nature. It is noteworthy that the type B case study, offering a lower total monthly wage, but higher hourly wage rate together with community based targeting mechanisms, and part time flexible working hours, had superior poverty targeting outcomes than the type C case study programme, which was implemented on the basis of more conventional wage targeting. This finding supports arguments set out by Barrett and Clay (2003) and Mujeri (2002) that it is not adequate to rely on the functioning of the market to ensure the participation of the poorest in PWPs, as the provision of a low wage can provide additional opportunities for cash income for surplus labour in less poor households, particularly in contexts of high unemployment, while failing to offer wages which match the marginal value of labour in the labour-constrained households which are often among the poorest. The challenge the case studies present is that conventionally designed PWPs may not necessarily be an effective tool for reaching poor, especially labour-constrained households, and that adopting a low wage may not result in effective poverty targeting.
Evidence Gaps The foregoing discussion on cost-effectiveness and targeting efficiency in PWPs in sub-Saharan Africa has revealed major evidence gaps. There are fundamental gaps in the literature both in terms of impact at household level, as discussed above, and also in terms of incidence. Neither of these gaps however are adequately highlighted in the existing literature, despite their critical importance for assessing the efficacy of the PWPs’ social protection function. While there is some research into these questions in the Asian context, there is little empirical evidence relating to the incidence of PWP participation in sub-Saharan Africa, in terms of the socio-economic profile of workers, due to the lack of baseline data gathered on PWP participants, and lack of subsequent survey work to rectify this initial omission. The short-term nature of most programmes in the continent mitigates against the gathering of such data, which tends not to be included in monitoring schedules, as socio-economic data collection is often perceived as an additional cost burden, rather than an essential prerequisite for meaningful programme impact assessment. These data omissions undermine any attempt to assess the functioning of PWPs as instruments of social protection, and together with the lack of data on performance, render any assessment of the effectiveness of PWP impossible, since it is not possible to calculate either the impact or benefit incidence. In addition, the data on PWP cost are highly problematic. Inasmuch as the data exist, they imply that the cost per unit transferred may be greater than for the cash transfer alternatives, (see, for example, Smith (2001)) however whether such a (putative) premium is acceptable is contingent on the value of the assets created, another area which suffers from a critical data void. Together, these critical areas of data failure undermine the potential for evidence-based policy selection in relation to PWPs. In many sub-Saharan African countries PWPs represent the intervention of choice to address the social protection needs of the working age poor who are not covered by alternative interventions

McCord & Slater
47
for specific vulnerable groups (such as children or the elderly). It is widely assumed, on the basis of the principle of ‘less eligibility’ that the work requirement and low wage lead to effective targeting to the intended group. However, the limited evidence available in the literature indicates that, in the context of highly rationed access to PWP employment resulting from low coverage, wage targeting and the work requirement are often not adequate to prevent significant inclusion and exclusion errors, and there is an urgent need to gather more data in order to better understand the targeting outcomes of programmes. The value of assets created The creation of assets is generally included as a key rationale for the selection of PWPs over alternative social protection assistance measures, as PWPs avoid the perceived trade-off between ‘productive’ investment in infrastructure, and ‘consumption’ expenditure on welfare by combining social assistance and productive asset creation in one intervention. As Smith argues with reference to Malawi:
‘... as far as possible, safety nets in Malawi need to be productivity-enhancing (for example in the form of public works […], rather than pure transfers […] to maximize long-term income growth among the poor.’ (2001:13)
However, the beneficial economic and developmental value of the assets created through PWPs is frequently assumed rather than empirically established. In some instances, such as the flood- and drought-related assets created in Bangladesh and India which have a direct impact on mitigating future risk and promoting land productivity, the economic benefit of the infrastructure created is often readily apparent, in terms of a reduction in flooding and improved water harvesting opportunities. Where the assets created are intended to promote livelihoods and economic growth, however, rather than mitigate known environmental threats, the value of those assets may be less easily quantifiable and their impact on the livelihoods of PWP participants is frequently unobserved, with outcomes rarely being subject to evaluation. Under these conditions asset impact evaluation is critical, yet such evaluation is rarely carried out, as there is an assumption among policy makers that the production of assets is de facto synonymous with growth and poverty reduction, without any consideration of the nature or value of the assets created, or the distribution of asset benefits across the population. This results in an often implicit analytical conflation of the provision of assets with the achievement of poverty reduction, livelihoods promotion and social protection outcomes, or even more problematically, a conflation of spending on asset creation and social protection outcomes27. An example of the conflation of PWP asset construction with poverty alleviation is to be found in the document produced by the South African government to celebrate ten years of democratic rule, which justifies the claim of poverty alleviation by stating the number of assets constructed under the national PWP, and the funds spent on their construction, rather than assessing the impact of those assets on poverty:
‘... these [public works] programmes have been successful in alleviating the asset poverty of communities. Over R6.5 billion of expenditure on infrastructure has provided 2,182 community assets.’(South Africa, PCAS, 2003:19)
Such conceptual looseness in evaluating the asset impact of PWPs is typical within the literature, and is a major source of confusion in the current PWP discourse, as asset creation is not per se synonymous with any kind of poverty alleviation. The evaluation of the quality of assets created
27 A similar debate is currently underway in South Africa with regard to the provision of the ‘social wage’ (goods and services) for the poor, where the cost of provision has been equated with the value of the benefit experienced by the poor in some of the literature (PCAS, 2003) following the benefit incidence or cost apportionment method of estimating incidence of benefits (see for example, Demery (2000)), which is challenged elsewhere in the social protection discourse (Meth, 2008a).
ODI Overview of Public Works Programmes in Sub-Saharan Africa
48
under PWPs, and their value to local communities over time is a key area to address in future programme monitoring. Programme impact over time With respect to cost-effectiveness it is clear from the material reviewed in this section that although programmes may or may not be considered cost-effective in terms of indicators such as the proportion of programme budget spent on labour, the cost of the creation of a day’s work or the extent to which they reach the poor, a critical open question remains largely unaddressed, namely the actual impact on participants and their families of participation in PWPs, in terms of depth of poverty over time. Current monitoring and evaluation activities tend to focus on immediate short term outputs, such as the occurrence of the wage transfer or the construction of the asset, rather than the impacts of these outputs on participants, over time. The literature for sub-Saharan Africa is particularly limited in terms of examining the impact of participation in the medium term, after the period of employment has been completed, in terms of i) returns to assets created, ii) the impact of wage transfer, and the value of skills transfer and work experience. Current PWP programme design tends to include an implicit and sometimes explicit expectation, particularly on the part of donors, that PWP participation will have some transformative impact in terms of graduation out of poverty. However, given the lack of evidence on the impact of PWPs at household level, there is little no empirical basis for this expectation (McCord, 2009a). This is a critical area for future research.
Cost and Targeting Efficiency Conclusions This section has offered an overview of the literature available on PWP cost and targeting efficiency in the region, and an exploration of the major issues arising. As with much of the much social protection debate, data on cost and targeting are poor and often inconsistent. In almost all cases the quality and impact of assets created through PWP was excluded from evaluation, and there is a need to extend the current approach to cost-effectiveness to take account of the quality, sustainability and usage of assets created. In the absence of such data, any assessment of cost-effectiveness only takes into account the immediate transfer benefits and excludes potential medium term benefits from the assets created. However, the forgoing discussion suggests that if PWPs are to be retained as the principal instrument for delivering social protection to the working age poor, additional investment in explicit targeting mechanisms, such as the adoption of demographic or poverty criteria, possibly using community based selection mechanisms, is required, along with the creation of incentives for programme implementers to honour such targets during implementation, and improved monitoring of targeting outcomes. It is important to note however that effective and cost efficient community targeting may only be viable where longer term (type B) programmes are being developed. Where the duration of transfers into a community is limited to a few months, particularly where recruitment is taking place through a private sector contractor, (as in many type A and C programmes) it may not however, be feasible or cost-effective to adopt this approach.
McCord & Slater
49
Part Four: Public Works and the Current Social Protection Discourse The final section of the report discusses the role of PWP within the broader policy context, from both a donor and government perspective,
Public Works in the African Discourse Public works are a key instrument in social protection and safety nets programming in Africa. As well as being used for the purposes of relief during a temporary disruption of the labour market in countries subject to environmental disasters or conflict, they are also extremely widespread as components of social protection ‘systems’ in countries facing chronic poverty and elevated unemployment as an instrument to address poverty (del Ninno et al, 2009). Typically social protection systems in the region are somewhat fragmented, resulting in a highly inequitable and often somewhat arbitrary distribution of resources and low levels of coverage. Within this context, PWPs are the dominant instrument for addressing the needs of the working age poor. Reasons for the popularity of PWPs in the region Within this context, the role, function and design of PWPs is relatively consistent across the region. They are predominantly type A or C programmes, offering a short single episode of employment, and are the preferred means of transferring social protection or safety net resources to households with labour. There is a widespread reluctance among governments and donors to provide cash transfers to households with working age members, and for this reason PWPs dominate social protection provision for the working age poor. Households with available labour are typically excluded from cash transfer programmes currently popular among donors in the region (as for example in the high profile Zambia and Kenya cash transfer pilots). The assumption that such households should not be eligible for cash transfers, and should be supported primarily through PWP employment has become widely accepted in the African social protection discourse, as exemplified by the discourses in Kenya, Malawi and Zambia (see McCord, 2009b).28 PWPs are widely assumed to represent the appropriate instrument for this group within the dominant donor and government discourse, but in reality PWPs rarely employ more than a small fraction of poor households with access to labour at any one time. The low coverage of almost all programmes means that the extent of ‘social protection’ offered by PWPs is rarely commensurate with their ‘political’ role in the social protection discourse. The underlying problem is that PWP programming tends not to take account of the labour market reality in much of sub-Saharan Africa, in which labour availability per se, does not guarantee access to adequately remunerated employment, or any employment at all. Hence, those with labour, but facing no labour market demand, are in most cases excluded from social protection provision, other than PWPs. When PWPs are the only form of social protection for the working age poor in such contexts, low coverage represents a serious challenge in terms of equity and ethics. The preference for PWPs as the instrument for the delivery of social protection to the working age poor is informed by a range of ideological and political preferences29. Donors and governments share concerns regarding the risks of dependency and labour market distortion if cash transfers are provided to households with available labour. From the donor perspective preferences are also shaped by the relative abundance of resources to fund support for households without labour due to HIV/AIDS (McCord, 2009b). From a government perspective the perception that expenditure on 28 With the notable exception of Namibia, which is currently piloting a cash grant for the working age poor (Haarman and Haarman, 2009). 29 For a detailed discussion of ideology and PWP selection see McCord 2008b.

ODI Overview of Public Works Programmes in Sub-Saharan Africa
50
PWPs represents investment rather than consumption expenditure, is also common (social cash transfer schemes are often perceived as representing consumption expenditure), leading to a preference to use scare resources for PWP programming rather than alternative forms of support for the working age poor. PWPs represent an approach to social protection which combines the provision of infrastructure as well as social protection, rendering PWP particularly attractive in post conflict situations where there has been significant destruction of infrastructure. Type A and C PWPs are popular, as they do not entail the ongoing fiscal liabilities implied by other forms of social protection, such as cash transfer programmes. In addition PWPs are perceived as a means to promote stability in contexts of potential unrest, for example in the case of AGETIP in Senegal (Karuri et al, 2007) and where there is a need for visible reintegration of ex-combatants or internally displaced populations (current examples being PWPs in Sierra Leone, Liberia and Somalia). Limitations to PWP programming However, there are two fundamental limitations to a PWP response to the provision of social protection for the working age poor in the region; i) the limited scale of programming, and ii) a frequent misalignment of programme type and programme objectives. The scale and coverage of most PWPs in Africa is minimal and rarely matches the extent of need among the poor working age under- and unemployed, for reasons of technical capacity and also cost (see annexe 8 for a comparison of the scale of sub-Saharan African and international PWP programming). Due to the small scale of most PWPs and the limited employment offered, in almost all cases where information is available, significant excess demand was reported, leading to a process of rationing access to PWP support. This concern was expressed by Devereux et al in relation to the PSNP in Ethiopia;
‘More worrying is the high level of ‘exclusion error’ – among non-beneficiaries, 71% reported experiencing a food shortage but were excluded from the PSNP. This indicates that the coverage of the Productive Safety Net Programme is limited in relation to the level of need.’ (Devereux et al 2006)
The second fundamental limitation to PWP programming is the misalignment of programme type and programme objectives in contexts of chronic poverty. In such contexts there is no evidence that the provision of one episode of employment has a significant medium or long term social protection impact, in terms of improved livelihoods or ‘graduation’ out of poverty. In order to offer a social insurance function in such contexts programmes would need to offer repeated or ongoing employment opportunities, as in a type B programme. This argument has been presented repeatedly in the literature; Datt and Ravallion argue that:
‘... failure to obtain this work [PWP employment] whenever needed will tend to undermine the social insurance function of public works schemes.’ (1994a:1358)
Subbarao et al. concur, suggesting that:
‘... in countries where poverty-gap ratios are high, the need to run the programme [PWP] year-round (and thus raise transfer benefits to the poor) assumes greater importance.’ (1997:84)
However, notwithstanding these insights, most PWPs implemented in contexts of chronic poverty in sub-Saharan Africa do not offer any form of income insurance in the form of year round programmes or guaranteed access to employment annually, as in the Indian NREGA, and so their social protection impact is compromised.
McCord & Slater
51
Conclusion This report has explored the available information on PWP activity in sub-Saharan Africa, highlighting the extensive scale and diversity of PWP programming, and the dearth of available data against which to assess the performance of these programmes. It has also highlighted the limited literature on programming in the region, and the inconsistencies in the approaches and methodologies adopted to assess programme output and impact, which undermine prospects for cross programme comparison, or comparison with other forms of social protection. In this context evidence based policy selection and programme design is difficult, and for this reason programme design has not, in many cases, been based on rigorous empirical or theoretical analysis, with the notable exception of rare initiatives such as the Zibambele programme.30 In order to address this there is an urgent need for improved data on PWP programming, the development of a set of norms and conventions relating to programme reporting, and improved monitoring and evaluation practices which include an appraisal of assets created over time. Notwithstanding the lack of evidence on programme efficacy PWP programming is vibrant, and PWPs remain an extremely popular policy option in the region in terms of both safety net provision and social protection provision (in addition to a range of other objectives). However, a range of issues related to PWP programming remain contested, including, most fundamentally the nature of PWP themselves. In the African development discourse PWPs are variously conceptualised as instruments to deliver social safety nets, and social protection, they are components of an active labour market strategy in terms of direct job creation, the promotion of aggregate employment and the ‘activation’ of the labour force, they are tools to promote the creation of assets, and they are drivers of both macroeconomic and social stability. These disparate ideas about the nature of PWPs have resulted in institutional conflicts and misunderstandings, as well as poor programme design with programmes often overloaded with disparate objectives (Karuri et al, 2007). Many programmes do not fall clearly into one or the other of these categories but have a range of objectives, often taking on aspects of several different PWP identities. In the first section of the report, an attempt was made to recognise this diversity, and to impose some form of typology to break the monolithic ‘PWP’ nomenclature into more meaningful components in order to facilitate more informed debate, with particular reference to the provision of social protection. In the absence of an explicit recognition of the diverse form and objectives of PWPs, the debate has become confused and somewhat segmented, with different agencies adopting a common terminology for very different interventions. While the typology imposed may not be perfect, it is intended to promote reflection on the plurality of the PWP concept. This review has highlighted some of the ways that the plurality of the PWP concept and the associated confusion has lead to programming inconsistencies and misalignments. Even within single PWPs there are often multiple objectives, and sometimes these can be in tension with each other. The identification of key components of good programme design, and lessons for successful implementation in this context is difficult, as appropriate programme design is contingent on a programme’s objectives. The most problematic misalignment identified relates to programmes with social protection objectives in situations of chronic poverty and unemployment. Most programmes in the region provide a single episode of employment. This is appropriate in contexts of acute labour market disruption, where short term consumption smoothing is required. However, in instances where unemployment is the norm and poverty chronic, a situation which characterises many countries in the region, a single episode of employment is not, in household economy terms, a substitute for alternative interventions which provide the security of regular ongoing cash transfer into a household. A unique episode of employment is not sufficient to provide the stabilisation benefits 30 The Zibambele programme was designed by the Provincial Department of Transport in KwaZulu Natal, in collaboration with the NGO CORD.

ODI Overview of Public Works Programmes in Sub-Saharan Africa
52
required cyclically in many countries in the region, but much PWP design does not accommodate this reality. This concern is generally recognised in the South Asian context, and in particularly in the type B programmes implemented under NREGA in India, in which PWP work is guaranteed to all who seek it (for up to 100 days a year), and may be accessed repeatedly over time. In NREGA the role of the PWP transfer in the household economy is taken into account, and programme design reflects a concern to ensure that the programme has an insurance function, rather than offering once-off or ad hoc employment as in much of sub-Saharan Africa. While the type B NREGA and its predecessor, the Maharashtra Employment Guarantee Scheme (MEGS), are celebrated internationally, their core insights and related design features have not been incorporated into PWPs in sub-Saharan Africa, with a few notable exceptions, including the PSNP in Ethiopia,31 and the Zibambele programme, both discussed in this report. Short term PWP employment can play a vital role in promoting consumption smoothing in situations of acute labour market disruption. Where PWP are intended to perform either a short term safety net function, or promote aggregate employment, the type A and C programmes which are prevalent in the region are appropriate. However, neither type of programme is well suited to the provision of social protection for the poor in the labour market context predominant in sub-Saharan Africa, and as a consequence the social protection function of such PWPs is likely to be limited. Yet this type of programming is repeatedly supported by donors and governments, who fail to recognise the critical importance of income insurance for meaningful social protection provision in contexts of chronic poverty. If PWP remain the preferred instrument for the provision of social protection for the working age poor in situations of chronic poverty then type B programming, offering South Asian style employment guarantee programmes, is appropriate, but this implies implementation on a mass scale and at significant cost, in terms of both financial and human resources. Whether such programmes are fiscally or administratively feasible in sub-Saharan Africa remains an open question.

McCord & Slater
53
Annex 1: PWP Database Data Entry Categories 1. Country
2. Title of programme/ project
3. Nature of scheme (Cash for Work, Food for Work etc)
4. Objectives of programme
5. Name of implementing agency/ies
6. Type of implementing agency/ies
7. Name of funding agency
8. Programme budget
9. Additional programme support
10. Start date
11. End date
12. Documentation available
13. Contact details for programme
14. Number of direct beneficiaries
15. Number of employees
16. Target group(s)
17. Targeting procedure
18. Geographic coverage
19. Consideration of HIV impact
20. Additional comments
21. Frequency of wage payment
22. Form of wage
23. Value of wage
24. Payment and the minimum wage
25. Hours worked per day
26. Days worked per week
27. Duration of employment
28. Gender of workers
29. Nature of assets created
30. Ratio of labour to total costs
31. Objectives of programme

ODI Overview of Public Works Programmes in Sub-Saharan Africa
54
Annex 2: Payment Modality by PWP Type
CFW FFW FFT Food (FFW + FFT)
IFW Other n
All 37% 46% 15% 61% 1% 1% 167 A 20% 55% 23% 78% 1 1 78 B 72% 14% 14% 28% 0 0 6 C 64% 31% 3% 34% 1 1 72
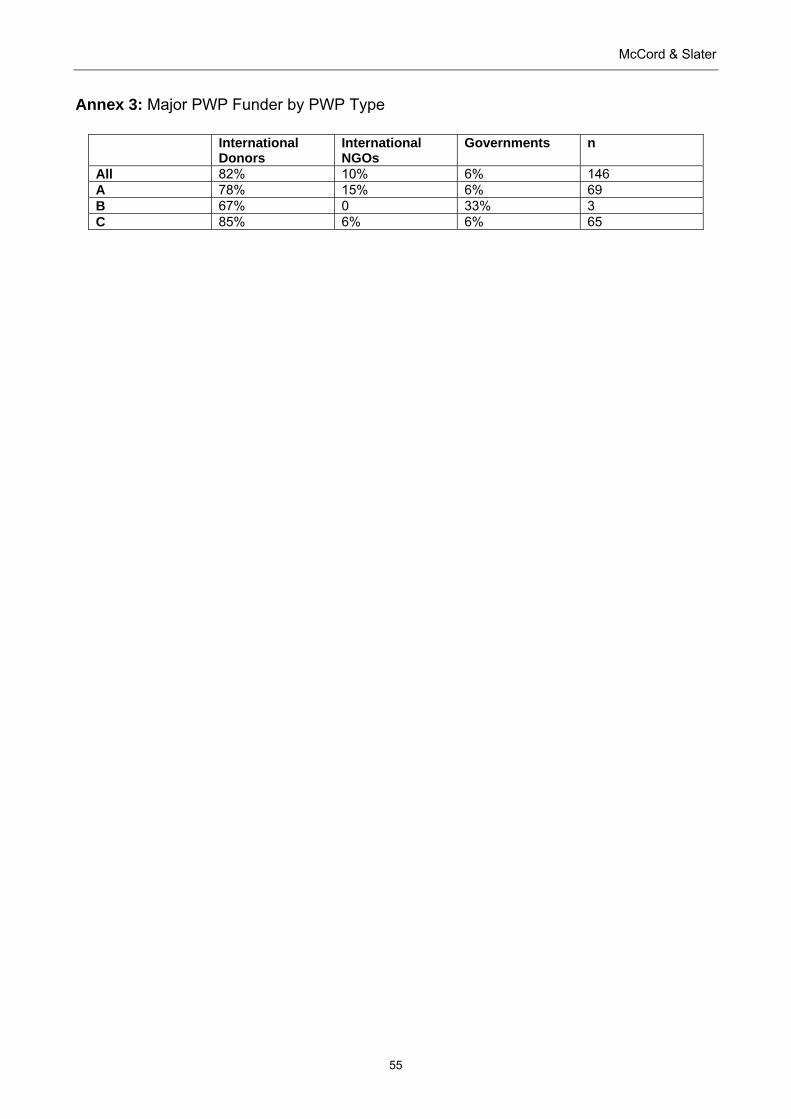
McCord & Slater
55
Annex 3: Major PWP Funder by PWP Type
International Donors
International NGOs
Governments n
All 82% 10% 6% 146 A 78% 15% 6% 69 B 67% 0 33% 3 C 85% 6% 6% 65

ODI Overview of Public Works Programmes in Sub-Saharan Africa
56
Annex 4: Relation to Minimum Wage
< MW =MW >MW n All 39% 36% 25% 28 A 78% 11% 11% 9 B 50% 50% 0 2 C 18% 47% 35% 17

McCord & Slater
57
Annex 5: Payment Frequency
Daily
Fortnightly Monthly Less Frequently
Unclear n
All 11% 17% 57% 4% 11% 45 A 34% 13% 53% 0 0 15 B 0 0 75% 0 25% 4 C 0 23% 58% 8% 11% 26

ODI Overview of Public Works Programmes in Sub-Saharan Africa
58
Annex 6: Hours Worked Per Day
3-5 6-8 n All 63% 37% 27 A 57% 43% 7 B n/a n/a n/a C 63% 37% 19

McCord & Slater
59
Annex 7: Days Worked Per Week
<5 5-6 n All 7% 93% 28 A 0 100% 5 B 100% 0 1 C 5% 95% 21

ODI Overview of Public Works Programmes in Sub-Saharan Africa
60
Annex 8: The Limited Scale of PWP Programming in Sub-Saharan Africa The small scale of PWPs in sub-Saharan Africa is illustrated by an analysis of nine programmes internationally, which set three major (in terms of profile) African PWPs alongside Asian, European and Latin American counterparts, taken from McCord 2005. Given the inherent lack of meaning of comparing absolute programme size, given variations in population and national labour market size, and consistency problems in national approaches to estimating unemployment rates, the programme sizes are compared relative to the size of the labour force, in order to give broadly comparable data, taking the size of the programme in its year of peak performance. This clearly indicates the relatively small size of the South African EPWP, the Senegalese AGETIP and even the Ethiopian PSNP, when compared to the NREGA in India, the Jefes e Jefas programme in Argentina or the PWP implemented under the New Deal in the USA during the 1930s. This underlines concerns regarding exclusion error, and illustrates the relatively limited coverage of even ‘flagship’ African programmes, see Figure i.
Figure i: International Review of PWP Jobs as % of the Labour Force
Source: Karuri et al 2007.
PWP Jobs as % of Labour Force
0.5 1.3 1.62.9
4.8 5.0 6.0
13.015.0
02468
10121416
Sene
gal 0
4
South
Afri
ca 06
/07
Indon
esia 9
8/99
Irelan
d 90s
Ethiop
ia 06
/07
India
06/07
USA 33
-40 (m
ean)
Argenti
na 03
India
08/09
% o
f Lab
our F
orce

McCord & Slater
61
References Adato, M., Haddad, L., Horner, D., Ravjee, N. and Haywood, R. (1999) From Works to Public
Work: The Performance of Labour-Intensive PWP in Western Cape Province, South Africa. Cape Town: Southern Africa Labour and Development Research Unit and International Food Policy Research Institute, University of Cape Town.
Arun, T., Imai, K. and Sinha, F. (2006) Does Microfinance Reduce Poverty in India? Propensity Score Matching Based on a National-level Household Data, Economics Discussion Paper, Manchester: University of Manchester.
Barrett, B. and Clay, D. (2003) Self-Targeting Accuracy in the Presence of Imperfect Factor Markets: Evidence from Food-for-Work in Ethiopia. Journal of Development Studies, 39(5): 152-180.
Caldes N., Coady, D. and Maluccio, J. (2004) The Cost of Poverty Alleviation Transfer Programs: A Comparative Analysis of Three Programs in Latin America. FCND Discussion Paper No 174. International Food Policy Research Institute, Washington, D.C.: The World Bank, February.
Chacaltana J. (2003) IMPACTO DEL PROGRAMA “A TRABAJAR URBANO”: Ganancias de ingreso y utilidad de las obras. Informe Final, Centro de Estudios para el Desarrollo y la Participación. Lima, diciembre del 2003. http://www.consorcio.org/CIES/html/pdfs/pm0230.pdf
Chirwa, E.W. (2007) Targeting and Exclusion Experiences in Public Works Programmes in Malawi, Report prepared for the Regional Evidence Building Agenda (REBA) of the Regional Hunger and Vulnerability Programme (RHVP), April
Chirwa, E., McCord, A., Mvula, P. and Pinder, C. (2004a) Study to Inform the Selection of an Appropriate Wage Rate for Public Works Programmes in Malawi. Malawi: National Safety Nets Unit. Unpublished.
del Ninno, C., Subbarao, K. And Milazzo, A. (2009) How to Make Public Works Work: A Review of the Experiences. SP Discussion Paper No 0905. Social Protection and Labour, Washington, D.C.: The World Bank.
Dev, S. (1995) India’s (Maharashtra) employment guarantee scheme: Lessons from long experience. In von Braun J. (ed.). Employment for Poverty Reduction and Food Security. Washington, D.C.: International Food Policy Research Institute.
Devereux, S. and Coll–Black, S. (2007) Review of Evidence and Evidence Gaps on the Effectiveness and Impacts of DFID-supported Pilot Social Transfer Schemes. DFID Evaluation Working Paper/ Evaluation Report A1/A3. Unpublished. October
Devereux, S. and Solomon, C. (2006) Employment Creation Programmes: The International Experience. Issues in Employment and Poverty. Discussion Paper No. 24. Geneva: Economic and Labour Market Analysis Department, International Labour Office, August 2006.
Devereux, S., Tefera, M., Sabates-Wheeler, R., and Taye, H. (2006) Ethiopia’s Productive Safety Net Programme (PSNP): Trends in PSNP Transfers Within Targeted Households Final Report, 10 August 2006. Institute of Development Studies, Sussex, UK and Indak International Pvt. L. C., Addis Ababa, Ethiopia

ODI Overview of Public Works Programmes in Sub-Saharan Africa
62
Galasso, Emanuela and Martin Ravallion (2004) “Social Protection in a Crisis: Argentina’s Plan Jefes y Jefas”, World Bank Economic Review, 18(3): 367-399.Galasso, Emanuela, and Martin Ravallion. 2004. “Social Protection in a Crisis: Argentina’s Plan Jefes y Jefas.” World Bank Economic Review 18 (3): 367–99.
Guarcello, L., Mealli, F. and Rosati, F. (2003) Household Vulnerability and Child Labor: The Effect of Shocks, Credit Rationing and Insurance. Understanding Children's Work Project Working Paper No. 3. ILO, World Bank and UNICEF.
Haarman, C. and Haarman, D.et al (2009) Making the difference! The BIG in Namibia. Basic Income Grant Pilot Project. Assessment Report. Windhoek.
Jalan, J. and Ravallion, M. (2003) Estimating the Benefit Incidence of an Antipoverty Program by Propensity-Score Matching. Journal of Business & Economic Statistics 21(1): 19-30.
Karuri, G., McCord, A. and Hemson, D. (2007) Mid Term Review of Expanded Public Works Programme. Report commissioned by the South African Department of Public Works, Pretoria. Unpublished.
Lembani, M. and Mandala, C. (2006) Malawi: Some Targeting Methods in Public Works Programs. MASAF Policy Infobrief, 1 (1) Lilongwe: MASAF. Retrieved in July 1008 from: http://www.worldbank.org/afr/findings/english/find267.pdf
McCord, A. (2002) Public Works Programmes as a Response to Labour Market Failure in South Africa. SALDRU/CSSR Working Paper No. 19. Cape Town: Southern Africa Labour and Development Research Unit / Centre for Social Science Research, University of Cape Town.
McCord, A. (2005) Addressing social protection challenges in the context of HIV and AIDS: a role for PWPs in East and Southern Africa? UNICEF. http://www.eldis.org/cf/search/disp/docdisplay.cfm?doc=DOC19939&resource=Default
McCord, A. (2006a) The Current Status of the EPWP (Infrastructure) in the Western Cape. Prepared for Western Cape Provincial Treasury & Department of Transport and Public Works. Unpublished. March.
McCord, A. (2006b) Are Public Works an Alternative to a Basic Income Grant? Paper presented at the XIth BIEN International Congress, Cape Town, South Africa, 2-4 November.
McCord, A. (2007) International PWP Comparative Study. Component 1 of EPWP Mid-Term Review. Report commissioned by the South African Department of Public Works, Pretoria. Unpublished.
McCord, A. (2008a) Recognising Heterogeneity: A Proposed Typology for Public Works Programmes. SALDRU Working Paper no 26. Cape Town: Southern Africa Labour and Development Research Unit, University of Cape Town.
McCord, A. (2008b) The Social Protection Function of Short Term Public Works Projects in the Context of Chronic Poverty. In Barrientos, A and Hulme, D. (eds) Social Protection for the Poor and Poorest: Concepts, Policies and Politics. UK: Palgrave: 227-246.
McCord, A. (2009a) The Anatomy of Public Works: An exploration of the social protection function of public works programmes in contexts of chronic poverty. Thesis Presented for the Degree of DPhil. School of Economics, Department of Commerce, University of Cape Town. April 2009. Unpublished.

McCord & Slater
63
McCord, A. (2009b) Cash Transfer Affordability and Sustainability, Overseas Development Institute Project Briefing Note, London: ODI.
McCord, A. and Wilkinson, C. (2009) Assessing the Incidence of Public Workd Programmes: Using Propensity Score Matching Techniques to Assess the Poverty Targeting of Employment in Two Public Works Programmes in South Africa. SALDRU Working Paper no 31. Cape Town: Southern Africa Labour and Development Research Unit, University of Cape Town.
McCutcheon, R. (2001) Using employment-intensive methods to construct and maintain infrastructure. Municipal Engineer, vol 145, issue 4, 2001: 273-284.
Mendola, M. (2007) Agricultural Technology Adoption and Poverty Reduction: A Propensity Score Matching Analysis for Rural Bangladesh. Food Policy, 32:372-393.
Mengesha, T. and Osei-Bonsu, K.D. (2007) Rapid Assessment of Poverty Impacts (RAPI): Results of Baseline and Follow-up Surveys in Ethiopia. Paper Presented at the 12th Annual ILO Regional Seminar on Labour Intensive Practices, International Conference Centre, Durban, October.
Meth, C. (2009) Problematic aspects of ‘Active’ Labour Market Policies in the UK and in South Africa. Unpublished.
Meth and McCord, (forthcoming). The EPWP – A major role in reducing unemployment and poverty? 2009 Transformation Audit, Institute for Justice and Reconciliation. Cape Town, South Africa.
Mujeri, M. (2002) Bangladesh: Bringing Poverty Focus in Rural Infrastructure Development. Discussion Paper No. 6. Geneva: Recovery and Reconstruction Department, International Labour Office.
National Economic Forum, (1994) A framework for implementation of a national public works programme adopted by the National Economic Forum. Development Bank of Southern Africa, Johannesburg.
Pellisery, S. (2008) Process Deficits in the Provision of Social Protection in Rural Maharashtra. In Barrientos, A and Hulme, D. (eds) Social Protection for the Poor and Poorest: Concepts, Policies and Politics. UK: Palgrave: 227-246.
Ravallion, M. (1998) Appraising Workfare Programs, Policy Research Working Paper, WPS 1955. Washington D.C.: Development Research Group Poverty and Human Resources Agricultural and Rural Development Department, The World Bank.
Ravallion, M. (2003) Assessing the Poverty Impact of an Assigned Program. In Bourguignon, F. and Da Silva, L. (eds) The Impact of Economic Policies on Poverty and Income Distribution. Washington, DC: Oxford University Press for the World Bank.
Regional Hunger and Vulnerability Programme (RHVP) (2008) The Cost-Effectiveness of Social Transfers. Regional Evidence Building Agenda (REBA) Thematic Paper Number 5. July.
Rosenbaum, P. and Rubin, D. (1983) The Central Role of the Propensity Score in Observational Studies for Causal Effects, Biometrika, 70(1):41-55.
Smart, M. (2007) PSNP Economic Appraisal, Annexe [X]. Draft 3, September 07 pm. DFID. Unpublished.
ODI Overview of Public Works Programmes in Sub-Saharan Africa
64
Smith, W. (2001) Spending on Safety Nets for the Poor: How Much, For How Many? The Case of Malawi. Africa Region Working Paper Series No.11. Washington, D.C.: The World Bank.
South Africa, Policy Co-ordination and Advisory Services (PCAS). (2003) Towards a Ten Year Review: Synthesis Report on Implementation of Government Programmes. Pretoria: PCAS, The Presidency, Government of South Africa.
Subbarao, K. (1997) Public Works as an Anti-Poverty Program: An Overview of Cross-Country Experience. Paper submitted for the invited session of ASSA Annual Meetings, 3-5 January.
Subbarao, K. (2001) Systemic Shocks and Social Protection. Role and Effectiveness of Public Works Programs. Africa Region Human Development Working Paper Series. Washington, D.C.: The World Bank.
Subbarao, K., Bonnerjee, A., Braithwaite, J., Carvalho, S., Ezemenari, K, Graham, C. and Thompson, A. (1997) Safety Net Programs and Poverty Reduction, Lessons from Cross Country Experience. Directions in Development. Washington, D.C.: The World Bank.
Taylor, G., McCord, A. and van Seventer, D. (2005) Limpopo Province Labour Intensive Rural Roads Maintenance Programme (Gundo Lashu) Cost Comparison Report. Draft 6. United Kingdom: Report for DFID, March. It Transport Ltd, Ardington, UK
United Kingdom, Department for International Development (UK DFID). (2003a) Learning from DFID’s investment in MASAF to date and linking support through ILTPWP (Improving Livelihoods Through Public Works Programmes) with MASAF III. MASAF Output to Purpose Review. Malawi: DFID. Unpublished.
Van de Walle, D. (1998) Assessing the Welfare Impacts of Public Spending. World Development, 26(3):365-79.
White, P. and McCord, A. (2006) Cost Comparison of Cash, Food and Agricultural Input Transfer Schemes in Malawi and Zambia. unpublished paper, DFID Policy Division (Equity & Rights Team), London, January, available at; http://www.wahenga.net/uploads/documents/library/Transfer_Schemes_Malawi_Zambia_2006.pdf