overview of groundwater remediation technologies for mtbe ... · soil. mtbe and tba can be...
TRANSCRIPT

Overview of Groundwater RemediationTechnologies for MTBE and TBA
Prepared byThe Interstate Technology & Regulatory Council
MTBE and Other Fuel Oxygenates Team
February 2005
Technology Overview

ABOUT ITRC Established in 1995, the Interstate Technology & Regulatory Council (ITRC) is a state-led, national coalition of personnel from the environmental regulatory agencies of some 40 states and the District of Columbia; three federal agencies; tribes; and public and industry stakeholders. The organization is devoted to reducing barriers to, and speeding interstate deployment of, better, more cost-effective, innovative environmental techniques. ITRC operates as a committee of the Environmental Research Institute of the States (ERIS), a Section 501(c)(3) public charity that supports the Environmental Council of the States (ECOS) through its educational and research activities aimed at improving the environment in the United States and providing a forum for state environmental policy makers. More information about ITRC and its available products and services can be found on the Internet at www.itrcweb.org. DISCLAIMER This document is designed to help regulators and others develop a consistent approach to their evaluation, regulatory approval, and deployment of specific technologies at specific sites. Although the information in this document is believed to be reliable and accurate, this document and all material set forth herein are provided without warranties of any kind, either express or implied, including but not limited to warranties of the accuracy or completeness of information contained in the document. The technical implications of any information or guidance contained in this document may vary widely based on the specific facts involved and should not be used as a substitute for consultation with professional and competent advisors. Although this document attempts to address what the authors believe to be all relevant points, it is not intended to be an exhaustive treatise on the subject. Interested readers should do their own research, and a list of references may be provided as a starting point. This document does not necessarily address all applicable heath and safety risks and precautions with respect to particular materials, conditions, or procedures in specific applications of any technology. Consequently, ITRC recommends also consulting applicable standards, laws, regulations, suppliers of materials, and material safety data sheets for information concerning safety and health risks and precautions and compliance with then-applicable laws and regulations. The use of this document and the materials set forth herein is at the user’s own risk. ECOS, ERIS, and ITRC shall not be liable for any direct, indirect, incidental, special, consequential, or punitive damages arising out of the use of any information, apparatus, method, or process discussed in this document. This document may be revised or withdrawn at any time without prior notice. ECOS, ERIS, and ITRC do not endorse the use of, nor do they attempt to determine the merits of, any specific technology or technology provider through publication of this guidance document or any other ITRC document. Trained professionals should perform the work described in this document, and federal, state, and municipal laws should be consulted. ECOS, ERIS, and ITRC shall not be liable in the event of any conflict between this guidance document and such laws, regulations, and/or ordinances. Mention of trade names or commercial products does not constitute endorsement or recommendation of use by ECOS, ERIS, or ITRC.

Overview of Groundwater Remediation Technologies
for MTBE and TBA
February 2005
Prepared by The Interstate Technology & Regulatory Council
MTBE and Other Fuel Oxygenates Team
Copyright 2005 Interstate Technology & Regulatory Council

Permission is granted to refer to or quote from this publication with the customary acknowledgment of the source. The suggested citation for this document is as follows: ITRC (Interstate Technology & Regulatory Council). 2005. Overview of Groundwater
Remediation Technologies for MTBE and TBA. MTBE-1. Washington, D.C.: Interstate Technology & Regulatory Council, MTBE and Other Fuel Oxygenates Team. Available on the Internet at http://www.itrcweb.org.

ACKNOWLEDGEMENTS
The members of the Interstate Technology & Regulatory Council (ITRC) MTBE and Other Fuel Oxygenates Team wish to acknowledge the individuals, organizations, and agencies that contributed to this technology overview document. As part of the broader ITRC effort, the MTBE and Other Fuel Oxygenates Team effort is funded by the U.S. Department of Energy, the U.S. Department of Defense, and the U.S. Environmental Protection Agency (EPA). The American Petroleum Institute has provided additional funding and support. ITRC operates as a committee of the Environmental Research Institute of the States (ERIS), a Section 501(c)(3) public charity that supports the Environmental Council of the States (ECOS) through its educational and research activities aimed at improving the environment in the United States and providing a forum for state environmental policy makers. The team wishes to recognize the efforts of Fred McGarry (Team Leader, New Hampshire DES), Todd Margrave (ITRC Program Advisor, Razor Resources, Inc.), Amber Sogorka (ITRC Program Advisor, RegTech, Inc.), Bruce Bauman (American Petroleum Institute), Gino Bianchi (Geomatrix), Michael Day (Applied Hydrology Associates), Rula Deeb (Malcolm Pirnie), Jeff Dey (Resource Control Corporation), Patricia Ellis (Delaware DNREC), Linda Fiedler (EPA), Michael Gill (EPA), Kathy Greene (U.S. Army Corps of Engineers), Joe Haas (New York DEC), Shannon Harbour (Nevada DCNR), Greg Hattan (Kansas DHE), Michael Hyman (North Carolina State University), Vince Maiden (Virginia DEQ), Steven Maxwell (South Carolina DHEC), Ellen Moyer (Greenvironment LLC), Eric Nichols (LFR, Inc.), Kirk O’Reilly (ChevronTexaco), Charlie Sosik (Ridge Civic Association), Roy Spalding (University of Nebraska–Lincoln), Matt Tonkin (S.S. Papadopulos and Associates Inc.), Kimberly Wilson (South Carolina DHEC), and Xiaomin Yang (BP). The team would also like to acknowledge those who provided valuable feedback by participating in the document peer review process: Jean Balent (EPA), Jim Landmeyer (U.S. Geological Survey), Hal White (EPA), Jim Weaver (EPA), John Wilson (EPA), Ravindra Kolhatkar (BP Remediation Management), Ernie Lory (U.S. Department of Defense), and Paul Johnson (Arizona State University).
i
EXECUTIVE SUMMARY
This is the first document in a series to be prepared by the MTBE and Other Fuel Oxygenates Team of the Interstate Technology & Regulatory Council (ITRC) regarding characterization and remediation of methyl tertiary butyl ether (MTBE or MtBE) and tertiary butyl alcohol (TBA or tBA) in groundwater. It will be followed by a more detailed and comprehensive technical and regulatory guidance document planned for publication in 2006, along with associated classroom or Internet-based training. This technology overview document is designed to provide an overview summary of remediation technologies for MTBE and TBA in groundwater; it does not cover remediation of other media such as soil, air, or nonaqueous-phase liquid. It is intended for readers who have a technical background but not necessarily extensive remediation experience. MTBE has been blended with gasoline in the United States since 1979, initially as an octane booster, and subsequently as an oxygenate. The volume of MTBE produced and blended with gasoline has increased over the years in response to the requirements of the Clean Air Act Amendments for oxygenated fuels. TBA, another oxygenate, has been less extensively blended with gasoline but is also often found in association with MTBE. Releases of MTBE-blended gasoline from leaking underground storage tanks, surface spills, and other sources have resulted in sites with groundwater impacts requiring remedial action. This document is intended to help regulators address these impacts as cost-effectively as possible. The physical properties of ether and alcohol oxygenates such as MTBE and TBA are substantially different from other gasoline components, and these properties need to be considered during all aspects of site characterization and remedial design. Despite the physical differences, the same technologies are generally used for MTBE and TBA as for other gasoline constituents. However, the application of these technologies needs to be adjusted significantly based on the properties of the target compounds. Oxygenates are more soluble in water and tend to partition more strongly from the vapor phase into the aqueous phase than do gasoline components such as benzene, toluene, ethylbenzene, and xylenes (BTEX). Oxygenates tend to be more mobile in groundwater systems than other gasoline components and are not significantly slowed by sorptive processes. Consequently, an emphasis on early detection and response to oxygenated fuel leaks and spills is essential. Oxygenates tend to migrate at the same velocity as flowing groundwater; therefore, an oxygenate plume is likely to be longer than a corresponding BTEX plume. If groundwater is moving gradually downward, the chemicals dissolved in it will also gradually move downward (“plunge” or “dive”). Because MTBE may migrate over greater distances, the magnitude of dive may be greater. Because of this behavior, it is critical to characterize oxygenate plumes both vertically as well as horizontally. Compared with more readily biodegradable plumes such as BTEX, sites contaminated with MTBE and TBA are likely to require corrective action for longer periods of time and may require more extensive monitoring over both time and space. A critical component in the site evaluation and cleanup process is the development of a conceptual site model. This is a written and/or graphical representation of the current understanding of how the release occurred; geological, hydrogeological, and other physical site
iii

characteristics; and the (likely) distribution of chemicals at the site. It should describe the potential migration of all chemicals of concern to potential receptors through transport processes in air, soil, and water. Groundwater remediation technologies shown to be effective for the treatment and removal of MTBE and TBA include both ex situ technologies (pump and treat) and in situ technologies (air sparging, bioremediation, chemical oxidation, phytoremediation, and monitored natural attenuation). Pump-and-treat processes, which have been shown to have a lower effectiveness for petroleum contaminants, are effective in treating MTBE and TBA due to the low affinity these compounds have for organics in the soil and the ability to “flush” these contaminants from the soil. MTBE and TBA can be biologically degraded under both aerobic and anaerobic conditions and both in situ and ex situ (for example, as part of a pump-and-treat process). However, degradation of MTBE can be incomplete, resulting in the formation of TBA. Generally, aerobic conditions have been shown to be far more effective in the complete biological treatment and removal of these compounds. Under favorable conditions and when properly applied, these technologies can treat both MTBE and TBA to concentrations currently acceptable in all states. However, the technologies chosen must be specific to the contaminant of concern and cannot be applied equally to all contaminants. In some instances, processes effective for the removal of MTBE may have little or no effect on TBA.
iv
TABLE OF CONTENTS
ACKNOWLEDGEMENTS............................................................................................................. i
EXECUTIVE SUMMARY ........................................................................................................... iii
1. INTRODUCTION .....................................................................................................................1
2. PHYSICAL, CHEMICAL AND BIOLOGICAL PROCESSES AND SAMPLE PRESERVATION AND ANALYTICAL METHODS.............................................................3 2.1 Fuel Oxygenates.............................................................................................................. 3 2.2 Description of Physical and Chemical Properties........................................................... 4 2.3 Fate and Transport Processes........................................................................................ 10 2.4 Sample Preservation and Analytical Methods for MTBE and Other Oxygenates........ 13
3. SITE EVALUATION AND CLEANUP REQUIREMENTS .................................................16 3.1 Conceptual Site Model.................................................................................................. 16 3.2 Site Characterization Issues .......................................................................................... 17 3.3 Regulatory Issues .......................................................................................................... 29 3.4 Considerations in Choosing Appropriate Technologies ............................................... 31 3.5 Performance Monitoring............................................................................................... 33 3.6 Public Considerations in Specifying a Treatment Technology..................................... 36
4. TREATMENT METHODS.....................................................................................................39 4.1 Groundwater Extraction and Aboveground Treatment: Pump and Treat..................... 39 4.2 Air Sparging.................................................................................................................. 53 4.3 In Situ Bioremediation.................................................................................................. 63 4.4 Chemical Oxidation ...................................................................................................... 70 4.5 Phytoremediation .......................................................................................................... 73 4.6 Monitored Natural Attenuation..................................................................................... 76 4.7 Cost Comparison Summary .......................................................................................... 80
5. SUMMARY AND CONCLUSIONS ......................................................................................81
6. REFERENCES ........................................................................................................................83
LIST OF TABLES Table 2-1. Historical fuel oxygenates..............................................................................................3 Table 2-2. Physical and chemical properties of fuel components ...................................................5 Table 4-1. Typical features of a site that affect the selection of a P&T Remedy..........................42 Table 4-2. Selected parameters typically monitored for assessing P&T system performance......44 Table 4-3. Interpretations and actions for selected monitoring data .............................................45 Table 4-4. Selected aeration technologies .....................................................................................48 Table 4-5. Selected technologies for treating contaminated air streams .......................................48 Table 4-6. Summary of oxidants and their properties. ..................................................................71 Table 4-7. Relative costs and durations of remedial technologies for MTBE and TBA in
groundwater .................................................................................................................81
v

LIST OF FIGURES Figure 2-1. Plot of vapor pressure, aqueous solubility, and volatility as expressed in
Henry’s law...................................................................................................................7 Figure 2-2. Pathway for the degradation of MTBE under aerobic conditions...............................10 Figure 2-3. Relative fate and transport processes for MTBE and benzene. ..................................11 Figure 3-1. Plunging MTBE plume in a regional groundwater recharge area...............................18 Figure 3-2. Schematic of contaminant plumes, East Patchogue, Long Island...............................19 Figure 3-3. Schematic of example site showing relationship between the site, a nearby
lake, and river network ...............................................................................................20 Figure 3-4. Wind rose representation of gradient magnitude and direction. .................................22 Figure 3-5. Interpreted gradient and magnitude for the first 11 sample rounds. ...........................22 Figure 3-6. Example of a missed diving plume .............................................................................23 Figure 3-7. Example of a well cluster............................................................................................24 Figure 3-8. Example from USEPA Web-based calculator demonstrating the effect of well
screen length and position on average borehole concentration ..................................25 Figure 3-9. State groundwater action/cleanup levels for MTBE. ..................................................31 Figure 3-10. State groundwater action/cleanup levels for TBA. ...................................................32 Figure 4-1. Schematic of an in situ air sparging system combined with soil vapor
extraction ....................................................................................................................53 Figure 4-2. Effect of heterogeneity on injected air distribution.....................................................55 Figure 4-3. Air sparging applicability analysis..............................................................................56 Figure 4-4. Remedial optimization for air sparging systems.........................................................59 Figure 4-5. Geochemical evolution of groundwater ......................................................................69 Figure 4-6. Example chemical oxidation products of MTBE........................................................71
APPENDICES APPENDIX A. Acronyms APPENDIX B. Response to Review Comments APPENDIX C. ITRC Contacts, Fact Sheet, and Product List
vi
OVERVIEW OF GROUNDWATER REMEDIATION TECHNOLOGIES FOR MTBE AND TBA
1. INTRODUCTION
The MTBE and Other Fuel Oxygenates Team of the Interstate Technology & Regulatory Council (ITRC) is preparing a series of documents and classroom and Internet training programs regarding the remediation of fuel oxygenates. This document, which focuses on remediation of methyl tertiary-butyl ether (MTBE, or MtBE) and tertiary-butyl alcohol (TBA or tBA) in groundwater, is the first in a planned series of technical and regulatory documents related to MTBE and other fuel oxygenates. For more information on ITRC, visit www.itrcweb.org. MTBE has been blended into gasoline in the United States since 1979, initially at a low percentage as an octane enhancer (API 1998). Later, in response to the 1990 Clean Air Act Amendments and other factors, it was added to gasoline at higher concentrations (commonly 11% to 15% by volume) as an oxygenate to make gasoline burn cleaner in those areas of the country not meeting air quality standards. TBA has been less extensively blended with gasoline as a fuel oxygenate. However, TBA is also often found in association with MTBE in gasoline as a manufacturing by-product. Typically, MTBE used for blending contains TBA ranging from about 0.03% to 0.8% (Shell Global Solutions 2003). Releases of MTBE-blended gasoline from leaking underground storage tanks, surface spills, and other sources have resulted in sites with groundwater impacts requiring remedial action. This document is intended to help regulators and stakeholders address these impacts as cost-effectively as possible. The physical properties of ethers and alcohols such as MTBE and TBA are different from those of other gasoline components, and these properties need to be considered in site characterization and remedial design. Despite the physical differences, similar technologies are generally used for MTBE and TBA as for other gasoline constituents. However, the application of these technologies needs to be adjusted significantly based on the properties of the compounds present. This technology overview document provides an overview of remediation technologies for MTBE and TBA in groundwater. It is intended for readers who have a technical background but not necessarily extensive remediation experience. This document will be followed by a technical and regulatory guidance document that is planned to be released in 2006, along with associated classroom or Internet-based training. This technology overview describes several emerging technologies, as well as established technologies that are used to remediate groundwater containing MTBE and TBA. Other technologies may be available that are not covered here. These either were not in widespread use at the time this document was prepared or have emerged since then. While not suggesting that these technologies be excluded from consideration, they should be approached carefully and their use based on evidence of effectiveness in the field. This document focuses on groundwater and does not address remediation of other media such as soil, air, or nonaqueous-phase liquid (NAPL). When remediating groundwater, it is essential that
1

ITRC – Overview of Groundwater Remediation Technologies for MTBE and TBA February 2005
sources of contamination, including impacted soil, be evaluated and controlled; otherwise, chemicals may continue to affect groundwater. Prompt responses to releases and source management are critical to minimizing total site remediation costs. Section 2 of this document summarizes the properties of MTBE, TBA, and other oxygenates. Section 3 discusses site assessment, regulatory, and other considerations that affect remedy selection. Section 4 covers applicable groundwater remediation technologies (pump and treat, air sparging, in situ bioremediation, in situ chemical oxidation, phytoremediation, and monitored natural attenuation). Finally, Section 5 presents a summary and conclusions.
2
ITRC – Overview of Groundwater Remediation Technologies for MTBE and TBA February 2005
2. PHYSICAL, CHEMICAL AND BIOLOGICAL PROCESSES AND SAMPLE PRESERVATION AND ANALYTICAL METHODS
This section considers the effects of the physical and chemical properties of MTBE, TBA, and other oxygenates on their fate and transport in groundwater flow systems and the applicability and cost-effectiveness of various in situ remedial technologies and ex situ treatment systems. These properties influence the choice of effective remedial systems, but it must be recognized that they are just one factor that must be considered in the development of site-specific remedial alternatives. The section also includes a subsection on sample preservation and analytical methods. Understanding the fate and transport of fuel components under various hydrogeologic and geochemical conditions is critical to the development of an appropriate management plan. The understanding that fuel oxygenates tend to be more mobile in groundwater systems than other fuel components has put an increased emphasis on early detection and response to oxygenated fuel leaks and spills. 2.1 Fuel Oxygenates
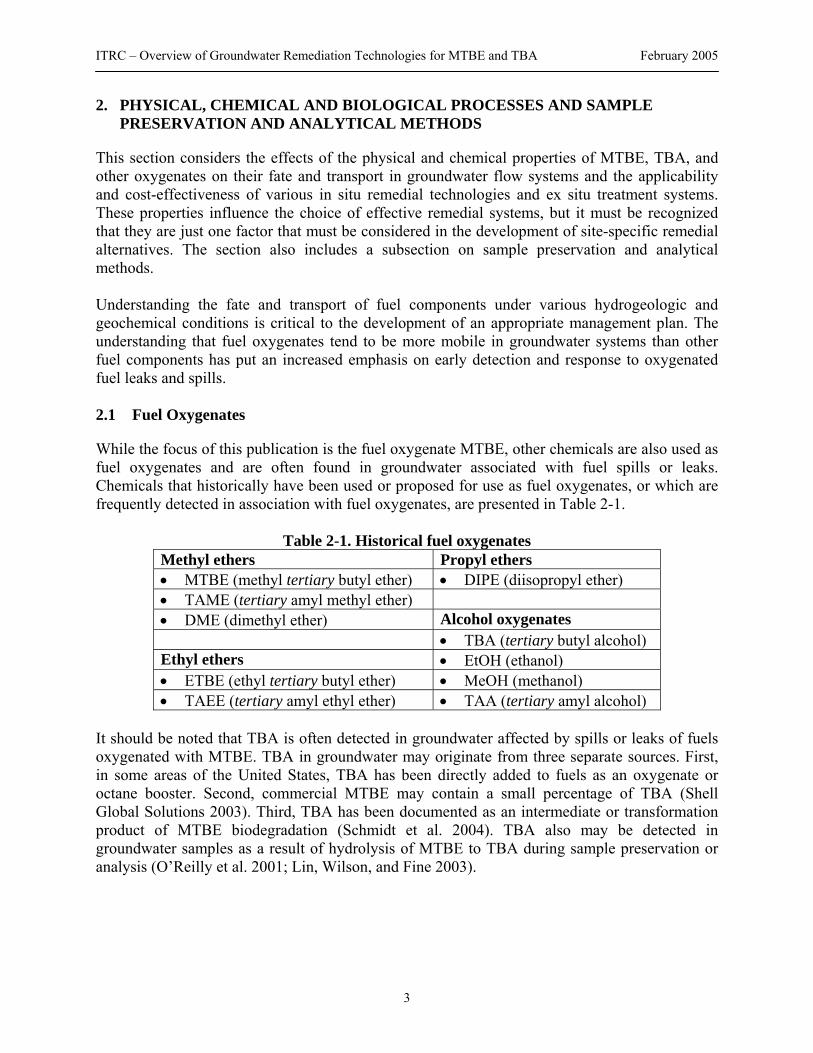
While the focus of this publication is the fuel oxygenate MTBE, other chemicals are also used as fuel oxygenates and are often found in groundwater associated with fuel spills or leaks. Chemicals that historically have been used or proposed for use as fuel oxygenates, or which are frequently detected in association with fuel oxygenates, are presented in Table 2-1.
Table 2-1. Historical fuel oxygenates Methyl ethers Propyl ethers • MTBE (methyl tertiary butyl ether) • DIPE (diisopropyl ether) • TAME (tertiary amyl methyl ether) • DME (dimethyl ether) Alcohol oxygenates • TBA (tertiary butyl alcohol) Ethyl ethers • EtOH (ethanol) • ETBE (ethyl tertiary butyl ether) • MeOH (methanol) • TAEE (tertiary amyl ethyl ether) • TAA (tertiary amyl alcohol)
It should be noted that TBA is often detected in groundwater affected by spills or leaks of fuels oxygenated with MTBE. TBA in groundwater may originate from three separate sources. First, in some areas of the United States, TBA has been directly added to fuels as an oxygenate or octane booster. Second, commercial MTBE may contain a small percentage of TBA (Shell Global Solutions 2003). Third, TBA has been documented as an intermediate or transformation product of MTBE biodegradation (Schmidt et al. 2004). TBA also may be detected in groundwater samples as a result of hydrolysis of MTBE to TBA during sample preservation or analysis (O’Reilly et al. 2001; Lin, Wilson, and Fine 2003).
3

ITR
C – Overview of Groundwater Remediation Technologies for MTBE and TBA February 2005
4
2.2 Description of Physical and Chemical Properties
The properties of oxygenates most relevant to aqueous fate and transport processes and to groundwater remedial technologies and treatability are as follows: • vapor pressure and solubility, both individually, and as they relate to Henry’s law constant, • sorption, and • biodegradability. Each property is described in the following sections with specific reference to its influence on phase transformation, fate, and transport processes in the subsurface, and feasibility and effectiveness of remedial technologies and treatment systems. Table 2-2 summarizes the physical and chemical characteristics of fuel oxygenates and benzene. 2.2.1 Henry’s Law Constant
2.2.1.1 Description
Vapor pressure and solubility are governing properties in Henry’s law constants, which are an estimate of the ability of a component to partition between water and air or vice versa. Individual impacts of vapor pressure and solubility on fate and transport in the unsaturated (vadose) and saturated (phreatic) zones are also described in Section 2.3. The partial pressure of a volatile component in equilibrium with liquid fuel is equal to its pure-phase vapor pressure multiplied by its fractional content (mole fraction) in the fuel (Barker et al. 1991). With the exception of TAME, MTBE and other ether oxygenates have higher vapor pressures than commonly encountered monoaromatics (e.g., benzene, toluene, ethylbenzene, and xylenes [BTEX]) and therefore volatilize more readily from light, nonaqueous-phase liquid (LNAPL) (Table 2-2). Solubility, expressed as mg/L or moles/L at a specified temperature, is a measure of the degree to which a chemical dissolves in water. Alcohols are miscible with water, while ethers have values of solubility ranging from about 9,000 mg/L for DIPE to 43,000 mg/L for MTBE (Table 2-2). The relative solubility of each chemical contained in a mixture of other chemicals, such as gasoline, is defined by Raoult’s law (below) as the product of the chemical’s pure phase solubility and its proportion in the fuel mixture (defined in terms of the mole fraction): Si = SXi , (1) where Si = effective solubility of chemical i in a mixture (mg/L), S = pure solubility of chemical (mg/L), X = mole fraction of chemical i in a mixture (dimensionless).

C – Overview of Groundwater Remediation Technologies for MTBE and TBA February 2005
5
Table 2-2. Physical and chemical properties of fuel components Parameter Unit Methanol Ethanol MTBE ETBE TAME DIPE TBA Tertiary butyl
formate Benzene
CAS Number 67-56-1 64-17-5 1634-04-4 637-92-3 994-05-8 108-20-3 75-65-0 762-75-4 71-43-2 Molecular formula CH3OH C2H5OH C5H12O C6H14O C6H14O C6H14O C4H9OH C5H10O2 C6H6 Molecular weighta g/mole 32.04 46.07 88.15 102.18 102.18 102.18 74.12 102.13 78.11 Melting pointa °C -98 -114.1 -109 -94 -85.5 25.5 5.5 Boiling pointa °C 64.6 78.3 55.2 71 85–86 68.5 82.2 83 80.1 Densitya g/L @ 25°C 0.791 0.789 0.741 0.752 0.764 0.724 0.786 0.872 0.879 Vapor pressureb mm Hg @
25°C 121.58 49–56.5 245–256 152 68.3 149–151 @
20°C 40–42 81 @ 20°C 95.2
Vapor densityc g/L @ 25°C 1.3 1.9 3.6 4.2 4.2 4.2 3.0 4.2 3.2 Water solubility mg/L infiniteb infiniteb 51,000a 26,000b 20,000b 2,000a infiniteb 10,000b 1800a Viscosity centipose @
25°C 0.544d 1.074d 0.35 @ 20°Ce 0.42 @ 20°Cf 0.379d 1.421 @
50°Cd 1.607d 0.649 @
20°Cd Henry’s law constantb
Cair/Cwater @ 25°C
1.087E-4 2.097E-4 to 2.571E-4
1.226E-1 to 2.399E-2
1.087E-1 5.191E-2 1.95E-1 to 4.075E-1
4.251E-4 to 5.927E-4
1.111E-2 2.219E-1
Log Kocb Coc/Cwater @
25°C 0.44–0.921 0.20–1.21 1.035–1.091 0.95–2.2 1.27–2.2 1.46–1.82 1.57g 1.11 1.56–2.15
Log Kowb Coctanol/Cwater
@ 25°C -0.75 -0.16–
-0.31 1.20 1.74 -- 1.52 0.35 -- 2.13
Retardation factorh, R = 1 + (ρ/n)foc × Koc Soil condition Ai foc = 0.001 mg/mg
1.04 1.04 1.09 1.33 1.47 1.37 1.31 -- 1.59
Soil condition Bi
foc = 0.00001 mg/mg 1.004 1.004 1.009 1.033 1.047 1.037 1.031 -- 1.059
a http://chemfinder.cambridgesoft.com b Interagency Assessment of Oxygenated Fuels (National Science and Technology Council 1997). c Vapor density = PM/RT where P, pressure, is 1 atm; R is 0.082 atm-L/gram-mol-K; T, temperature, is 298 K; and M is mass in g/mole. d Lange’s Handbook of Chemistry, 15th ed. (Dean 1999). e MTBE Technical Bulletin (Oxygenated Fuels Association 2003). f “tertiary amyl methyl ether,” BP Chemicals Product information sheet. g This Koc is unreasonably high, given a Kow of 0.35 (Moyer and Kostecki 2003). h Guidelines for Investigation and Cleanup of MTBE and Other Ether-Based Oxygenates (California EPA 2000). i Aquifer properties: bulk density (ρ) of 1.75 kg/L, porosity (n) of 0.25 and foc as given in table.
ITR

ITRC – Overview of Groundwater Remediation Technologies for MTBE and TBA February 2005
In aqueous solution, volatility is a measure of the tendency of chemicals to partition between the dissolved phase and the vapor phase and is described by Henry’s law constant (Kh) in the equation Kh = Cair / Cwater = [Vp][MW][1000] / [S][P][R][T] , (2) where Vp = vapor pressure of chemical (mm Hg), MW = molecular weight of chemical (g/mol), S = solubility (mg/L), P = atmospheric pressure (1 atm = 760 mm Hg), R = gas law constant (0.082 L-atm/mole-°K), T = temperature (°K = 273° + °C). The constant Kh is generally reported as a dimensionless value (concentration in air divided by the concentration in water). Compounds with values of 0.05 or larger are considered to volatilize easily from water. 2.2.1.2 Range of Values
In Figure 2-1, the fuel components have relatively similar vapor pressures; however, the aqueous solubilities for the alcohols are magnitudes higher than those of the ethers. Dimensionless Henry’s law estimates are depicted as parallel diagonal lines in Figure 2-1. Lines of constant Kh are formed by substituting Pv’s of 10 and 1000 mm Hg° and Kh values ranging from 10-5 to 1 into the equation and solving for solubility in mg/L (Equation 2). The conversion from mg/L to moles/L is assumed to be a factor of 100 mg/mole. Calculated aqueous solubilities for lower molecular weight oxygenates would cause the iso-Kh lines to shift slightly to the right. Alcohol oxygenates all have very low Henry’s law constants (<10-4), indicating that the impact of S far exceeds that of Vp. Kh lines for low-molecular-weight oxygenates shift to the left. Emphasizing the large difference in alcohol and ether aqueous solubilities, two widely separated component clusters appear on the plot. Generally, ether oxygenates have lower Kh values than benzene, MTBE is less volatile in water, and the alcohol oxygenates are essentially nonvolatile in water (note that the dashed Kh line separates easily volatilized components from those of lesser volatility). 2.2.1.3 Effect on Fate and Transport Processes
The interchange between soil vapor and pore water occurs within the vadose zone and at the water table interface. In comparison to benzene, MTBE and TBA tend to partition strongly from the gas phase into the water phase. The volatilization process from the dissolved phase to the vapor phase is driven by concentration gradients. The more volatile constituents of fuel, as indicated by their vapor pressures (Table 2-2), are more readily vaporized, allowing for preferential component removal in the “source areas” where gasoline released from a leak or spill may exist in either a residual or mobile form in the subsurface near the water table. The partial pressure of MTBE and other ether oxygenates in recently released oxygenated fuels is initially higher than other fuel components, and they will therefore volatilize more readily during
6

ITRC – Overview of Groundwater Remediation Technologies for MTBE and TBA February 2005
the time period immediately following the release. As a result of volatilization, the partial vapor pressure is reduced, making it more difficult for the remaining component to completely volatilize.
10
100
1000
10 100 1,000 10,000 100,000
DIPE
Benzene TBF
TAME
ETBE
MTBE
TBA Ethanol
Methanol
K h=1
K h=10
-1
K h=1
0-2
K h=10
-3
K h=10
-4
K h=10
-5
Increasingly mobilein ground water
Incr
easi
n g te
nden
cy to
vo
latil
i ze
fr om
LN
AP L
Increasing tendency to
volatilize from water
K h= 5x
10-2
Vap
or P
ress
ure
(mm
Hg
@ 2
5o C)
Aqueous Solubility (mmol L-1 @ 25oC)
Figure 2-1. Plot of vapor pressure, aqueous solubility, and volatility as expressed in Henry’s law.
2.2.2 Effect on Remedial Technologies
Low Kh’s for MTBE and other ether oxygenates affect the efficacy of technologies that rely on phase transfer to the air phase. In situ technologies such as air sparging may not be as successful at normal air/water ratios in the direct removal of MTBE as compared to BTEX. Similarly, water treatment technologies for extracted groundwater, such as air stripping, are not very efficient for MTBE, as compared to BTEX, and are ineffective for TBA. Bruce et al. (1998) showed in a physical model that air sparging could remove a major fraction of residual phase MTBE (85%) from aquifer material. Mortensen et al. (2000) also showed that major fractions of MTBE could be sparged from water, but they found that the efficiency of sparging was sensitive to the texture of the geological material being treated. Coarse sands were more subject to channeling of the sparged air and were not treated as effectively. In laboratory physical models, Rutherford and Johnson (1996) achieved rates of oxygen transfer to groundwater during sparging in the range of 10–170 mg/L per day. The rates of oxygen transfer were sensitive to the rate of advective flow of groundwater in the aquifer. Johnson (1998) conducted model simulations that showed that “…in situ air sparging has significant potential of remediating spills of very soluble, but slowly degrading fuel oxygenates, such as MTBE.”
7
ITRC – Overview of Groundwater Remediation Technologies for MTBE and TBA February 2005
2.2.3 Sorption
2.2.3.1 Description
Sorption is the tendency of soluble compounds to partition to solids which results in losses of solutes from aqueous solutions. A compound’s potential sorption can be estimated by its organic partition coefficient (Koc) in Table 2-2. 2.2.3.2 Range of Values
Oxygenates are less sorptive than benzene and therefore are more mobile in groundwater (Table 2-2). 2.2.3.3 Effect on Fate and Transport Processes
The velocities of MTBE and TBA aqueous transport relative to the transport of groundwater are not significantly retarded (slowed) by surface sorption processes and, therefore, tend to be transported at velocities effectively equivalent to the rate of flowing groundwater. The ratio of the velocity of groundwater to the velocity of a compound of interest is expressed by the retardation value (R, dimensionless). Both ethanol and TBA have R values of approximately 1, while those of the ethers remain low but are slightly higher than those reported for alcohols. The most representative R values in groundwater under natural gradient conditions rely on the measurement of the velocity of a conservative (unretarded) solute such as bromide divided by the velocity of the contaminant of interest. Since velocities of contaminants are normally slower than those of bromide, R is usually greater than 1. 2.2.4 Biodegradation
2.2.4.1 Description
Biodegradation is a biologically mediated chemical transformation. Complete degradation (mineralization) of an organic compound to carbon dioxide and water is almost always associated with some form of microbial activity. Biological transformations of organic pollutants can involve many steps and may require a long period of time to complete, but often they are the predominant decay pathways in water and soil. The aerobic pathways for MTBE degradation have not been fully elucidated (Schmidt et al. 2004) although all initial reactions appear to be directed at the methoxy group rather than the tertiary butyl group of MTBE. Current evidence obtained with pure microbial cultures indicates the ether bond of MTBE is enzymatically activated by a variety of monooxygenase enzymes. The hemiacetal product of these reactions can either chemically decompose to TBA and formaldehyde (Steffan et al. 1997) (Figure 2-1) or can be further oxidized to tertiary butyl formate (TBF) (Smith, O’Reilly, and Hyman 2003). The subsequent hydrolysis of TBF yields TBA and formate (Hardison et al. 1997, Church et al. 1997). Steffan et al. (1997) report that TBA is further biodegraded to 2-methyl-1,2-propanediol (MPD), which most likely first forms an aldehyde intermediate (2-hydroxyisobutanal) before degrading to 2-hydroxyisobutyric acid
8

ITRC – Overview of Groundwater Remediation Technologies for MTBE and TBA February 2005
(HIBA). Downstream intermediates following HIBA may include 2-propanol, acetone, hydroxyacetone (acetol) and others. To date there have been no studies published describing MTBE biodegradation by pure cultures of anaerobes. Therefore, less is known about the biochemical mechanisms and pathways involved in this process. However, existing field studies suggest that removal of the methoxy group from MTBE is the rate-limiting step in the complete mineralization of this compound. Stable and hydrogen isotope ratio analyses also suggest the methoxy group of MTBE is removed hydrolytically (Kuder et al. N.d.). A hydrolytic reaction would generate TBA and methanol as products. Methanol is readily biodegradable by a wide variety of anaerobic organisms (e.g., methanogens, acetogens, denitrifiers). Although TBA has been reported to be biodegradable under anaerobic conditions, nothing is currently known about the downstream intermediates or the enzymes involved in these processes. 2.2.4.2 Range of Values
Degradability of organic compounds in the subsurface is dependent on geochemical and microbial conditions and cannot be described in terms of an intrinsic value. It is widely perceived that ether oxygenates such as MTBE tend to be less readily degradable than benzene under aerobic conditions and, according to Wilson et al. (2000), under anaerobic conditions. In some cases, TBA has been demonstrated to degrade under aerobic conditions (Schirmer et al. 2003; Bradley, Chapelle, and Landmeyer 2002) and anaerobic conditions (Bradley, Chapelle, and Landmeyer 2002). Due to its tertiary molecular carbon, TBA tends to be more recalcitrant to degradation than straight-chain alcohol oxygenates like ethanol. 2.2.4.3 Effect on Fate and Transport Processes
It is well documented that BTEX compounds undergo biological transformations in groundwater. There is increasing evidence that MTBE and TBA also naturally degrade under a variety of conditions. At many sites, MTBE and TBA degrade under aerobic conditions (Salanitro et al. 2000), albeit at a rate slower than the BTEX compounds. Biodegradation of MTBE and TBA has also been reported under methanogenic (Wilson et al. 2000), denitrifying (Bradley, Chapelle, and Landmeyer 2001a), sulfate-reducing (Bradley, Chapelle, and Landmeyer 2001b; Somsamak, Cown, and Haggblom 2001), and iron-reducing conditions (Landmeyer et al. 1998). Biodegradation in the unsaturated zone also can occur, particularly if atmospheric exchange allows the continued introduction of oxygen to promote aerobic respiration (Baehr, Charles, and Baker 2001). Barometric and temperature variations associated with diurnal fluctuations and storm events can produce air exchanges between the atmosphere and the soil vapor of the unsaturated zone (Massmann and Farrier 1992).
9

ITRC – Overview of Groundwater Remediation Technologies for MTBE and TBA February 2005
Figure 2-2. Pathway for the degradation of MTBE under aerobic conditions. (Solid arrows indicate dominant pathways.)
2.2.4.4 Effect on Remedial Technologies
The low sorptivity of oxygenates favors the implementation of dissolved-phase remediation such as pump and treat and in situ bioremediation processes. Monitored natural attenuation (MNA) may also be a viable remedial alternative for situations in which the potential for adverse impacts to public health or sensitive environmental receptors is very low. It relies on the naturally occurring processes of dilution, dispersion, sorption, volatilization, and, most importantly, biodegradation to reduce or control the mobility, toxicity and mass of contaminants in the subsurface over a reasonable period of time. The relatively high mobility of MTBE may affect the applicability of MNA. Currently, the efficacy of MNA as a sole remedy for MTBE has not been established at many sites (for more information see Section 4.6). 2.3 Fate and Transport Processes
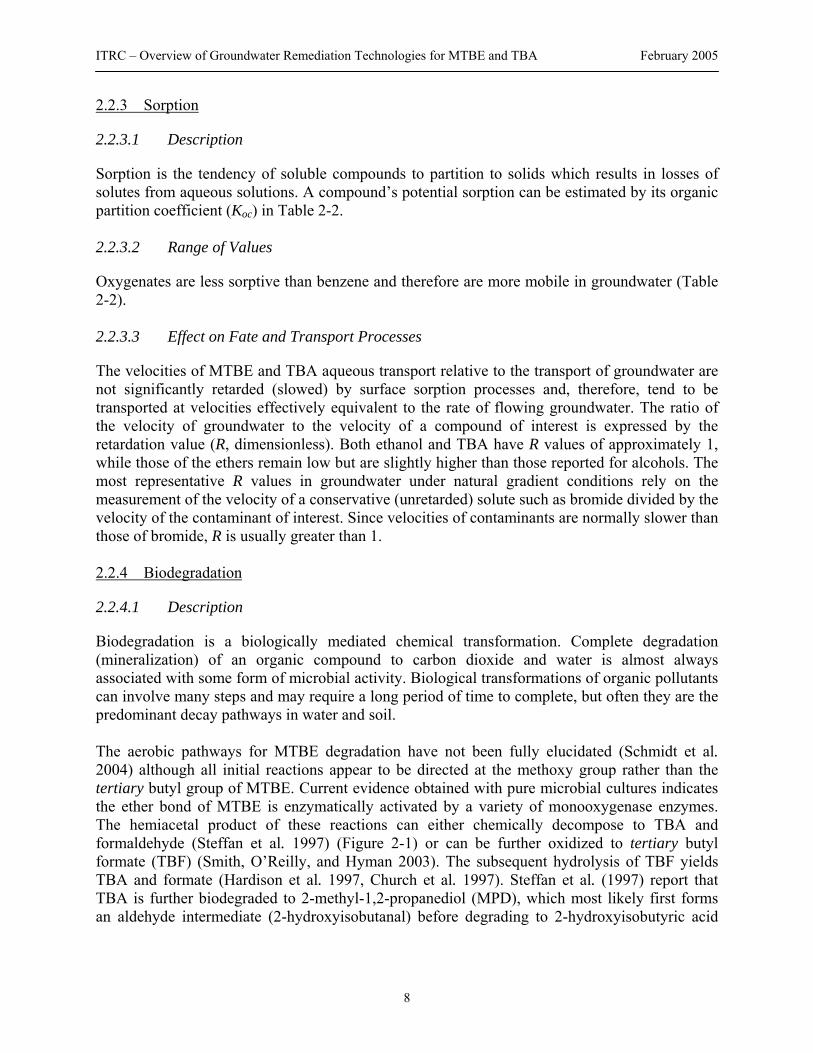
Fate and transport of fuel components in the subsurface from leaks or spills are determined by their physical and chemical characteristics and by the hydrogeologic and geochemical conditions at the site. These are illustrated schematically for MTBE and benzene in Figure 2.3. As long as the rate of fuel release is greater than the rate of removal by natural processes, the subsurface extent of the fuel components will expand until it reaches a physical barrier or until natural processes remove the fuel components at the same rate at which they are introduced.
10
ITRC – Overview of Groundwater Remediation Technologies for MTBE and TBA February 2005
M = MTBE, B = benzene; length of arrow indicates relative significance of process; from Moyer and Kostecki (2003)
Figure 2-3. Relative fate and transport processes for MTBE and benzene. The fate and transport of fuel components released to the subsurface are discussed in terms of the hydrogeological conditions that typically exist in (a) the unsaturated or “vadose” zone above the water table where the soil pores are not entirely saturated with water and (b) an unconfined aquifer. 2.3.1 Vadose Zone
A spill or leak of fuel of sufficient magnitude will eventually lead to infiltration of the fuel into the underlying soils of the vadose zone. The extent of migration of liquid fuel, dissolved fuel components, and gas-phase fuel components will depend on the volume of fuel released, the properties of the native soil materials, the rate of water infiltration, and other physical and biological processes.
The major processes that occur within the vadose zone are volatilization, condensation, solution, sorption, biodegradation, vapor advection and diffusion. Mass loss of fuel components to the atmosphere can occur at the land surface interface if the constituent remains in the vapor phase (Figure 2-1). Volatilization of released fuel will continue to occur into the air-filled pore spaces of the vadose zone. Soil moisture in the vadose zone will interact with soil vapor and allow exchange of volatile fuel constituents between the air phase and the water phase. Once in the air or water phase, the fuel components can continue to migrate under the prevailing geologic conditions. Mass loss of fuel components to the atmosphere can occur at the land surface
11

ITRC – Overview of Groundwater Remediation Technologies for MTBE and TBA February 2005
interface if the constituent remains in the vapor phase and enters overlying air. The low soil moisture in arid and semiarid environments provides limited opportunity for volatilized fuel constituents from leaked fuels to dissolve into the water phase; however, if the soil moisture content in the vadose zone is moderate to high, then components such as MTBE and TBA with a relatively low Henry’s law constant will partition into the water phase. The overall downward velocity and travel times of infiltrating water containing dissolved gasoline constituents depend on many factors, such as recharge rate and vadose zone horizontal and vertical hydraulic conductivities and thickness. Migration of dissolved MTBE and TBA in the vadose zone does not tend to be retarded by sorption to soils, and they move at the velocity of the infiltration water. The dissolved BTEX components of gasoline tend to migrate at a slower rate due to their higher sorption. Any attenuation that occurs within the vadose zone reduces the overall flux of mass of constituents reaching the water table. The more mobile constituents of oxygenated fuels, such as MTBE and TBA, tend to be at the leading edge of an advancing dissolved “front” and therefore have the most exposure to soil air (and oxygen) in the vadose zone. Aerobic degradation tends to be most active at the front and lateral edges of the dissolved plume of fuel constituents where oxygen contents are highest, so that MTBE and TBA may have the higher potential for degradation at these locations than less mobile fuel constituents such as benzene. Consumption of oxygen by biological degradation processes can lead to anaerobic conditions behind the leading edge of the dissolved plume so that aerobic degradation of less-mobile dissolved constituents is not as rapid. Recent modeling studies (Lahvis and Rehmann 2000) and field studies (Dakhel et al. 2003) have shown that small-volume releases of oxygenated gasoline containing MTBE have the potential to impact groundwater at underground storage tank (UST) sites. These results indicate that groundwater near the gasoline release is likely to be enriched in MTBE relative to BTEX, which is consistent with empirical groundwater data. 2.3.2 Saturated Zone
A release of fuel may migrate to the water table, where it spreads and becomes distributed above and below the water table (Table 2-2). The accumulation of fuel at the water table as an LNAPL provides a source of dissolved constituents to the groundwater. The major processes that occur within the saturated zone are dissolution, advection, dilution, dispersion, sorption, diffusion, and biodegradation. Volatilization of dissolved fuel constituents also can continue at the air-water interface if the saturated zone is unconfined. A release of fuel may migrate to the water table, where it spreads and becomes distributed above and below the water table (Table 2-2). Fuel constituents which partition from the fuel to the groundwater (dissolved constituents) will migrate with groundwater flow at a rate dependent on their tendency to sorb to the aquifer matrix. Once MTBE or TBA is dissolved in the saturated zone, their low sorption characteristics allow them to move at virtually the same velocity as the groundwater (i.e., their retardation values are fairly close to 1 for typical low-carbon-content aquifers); BTEX compounds have R values that typically range from 1.1 to about 2.0 (Zogorski et al. 1997). Groundwater velocities
12

ITRC – Overview of Groundwater Remediation Technologies for MTBE and TBA February 2005
normally range from few meters per year to a meter per day; however, in the radial influence of a pumping well, velocities can be higher due to increased hydraulic gradients. Dispersion tends to mix and dilute the concentrations of fuel constituents within the saturated zone. Dispersion is more apparent in more heterogeneous aquifer systems. Dilution of dissolved constituents by mixing with unaffected groundwater recharge is also commonly observed in unconfined aquifers. Recharge that occurs along the flow path of an affected groundwater plume and/or pumping of deeper aquifer units for water supply will tend to cause the affected groundwater plume to move faster as well as migrate downward. This effect has been referred to as a “sinking” or “diving” plume and is most apparent in situations where an affected groundwater plume has migrated over a significant distance (100s to 1000s of feet) and can result in the significant accumulation of “clean” water overlying the contaminant plume (Weaver, Haas, and Sosik 1999; Weaver and Wilson 2000; Landmeyer et al. 1998). Diffusion of dissolved constituents into lower-permeability lenses within the aquifer, or confining units above and below the aquifer, also may contribute to a decrease in dissolved constituent mass. Diffusion effects are most apparent in highly stratified aquifers consisting of alternating layers of fine-grained and coarse-grained materials. 2.4 Sample Preservation and Analytical Methods for MTBE and Other Oxygenates
Unlike standardized analytical procedures that were relied upon in past ITRC reports for other contaminants, new and better methods to detect oxygenates are continuously being developed and refined. A robust analytical method has been recently developed that is capable of accurately measuring trace concentrations of both ethers and alcohols. The need for enhanced analyte preservation techniques for holding and treating these compounds prior to analysis and detection is controversial and in part dependent on the analytical method employed. Accurate quantification of the groundwater concentration of ethers and alcohols is required in the evaluation of leaking underground storage tank (LUST) sites. 2.4.1 Sample Preservation
Concerns have been raised regarding the need for an improved preservation technique for water samples containing MTBE (White, Lesnik, and Wilson 2002). Conversely, Rong and Kerfoot (2003) and Bauman (2003) have concluded that the traditional preservation techniques are adequate if samples are properly acidified and not heated above 45°C during analysis. Traditional protocol is to preserve groundwater samples by the addition of sufficient hydrochloric acid to adjust the pH to 1.5–2.0 with subsequent storage at 4ºC. However, excess acidification and/or excessive heat can result in increased hydrolysis of MTBE to TBA and the hydrolysis of ETBE to TBA and ethanol (O’Reilly et al. 2001; Lin, Wilson, and Fine 2003). Conversely, insufficient sample heating can result in lowered analytical sensitivity of TBA and other alcohols. To prevent acid hydrolysis, Kovacs and Kampbell (1999) replaced the hydrochloric acid with 0.4–0.44 g of trisodium phosphate (TSP) in each 40-mL sample vial prior to sample collection. TSP is the salt of a weak acid which normally raises the sample pH to >11 and prevents ether hydrolysis during storage and analysis and biodegradation during storage. U.S. Environmental Protection Agency (USEPA) protocols for preservation of LUST samples recommend the addition of TSP and icing and/or refrigeration at 4ºC. Regardless of chemical
13

ITRC – Overview of Groundwater Remediation Technologies for MTBE and TBA February 2005
preservation, samples should be stored at 4ºC (White, Lesnik, and Wilson 2002). Using the above method, Lin, Wilson, and Fine (2003) reported method detection limits (MDLs) of 0.8 μg/L and 18 μg/L for TBA and ethanol, respectively. 2.4.2 Analytical Methods
2.4.2.1 Heated Headspace Method
According to USEPA research chemists, the heated-headspace method with gas chromatography (GC) or gas chromatography/mass spectrometry (GC/MS) and TSP sample preservation is a robust method for oxygenates and their transformation products (White, Lesnik, and Wilson 2002). They demonstrated that the method (EPA Method 5030 heated to 80oC) performed appropriately in the analysis of MTBE, TAME, ETBE, DIPE, TAEE, TAA, and TBA. Briefly, a known aliquot of the sample in the crimp-top vial is removed to provide headspace; the sample is heated to 80ºC in an autosampler; the head gas is robotically removed and injected into the GC; and concentrations are quantified by MS (EPA Method 8260) or a flame ionization detector (FID)(EPA Method 8015). The heated-headspace analysis was satisfactorily tested on oxygenated gasoline samples in an aqueous matrix at three different laboratories (McLoughlin 2002). The addition of common salt (25% by weight) increased the alcohol extraction efficiency, and low MDLs of <10 μg/L and <5 μg/L were indicated for ethanol and TBA, respectively. 2.4.2.2 Purge-and-Trap Gas Chromatography/Mass Spectrometry Method
Purge-and-trap with GC and GC/MS is a standard method for groundwater analysis of fuel components and fuel oxygenates in many laboratories. USEPA has published these as EPA Method 5030, EPA Method 8015 and EPA Method 8260, respectively. Volatile organic compounds (VOCs) are transferred to the gaseous phase by purging the water sample with an inert gas at ambient temperature. The vapor is swept through a trap that sorbs the analytes of interest and is then heated and back-flushed to desorb VOCs into a GC column for separation. The compounds are separated in the column flow to an MS or FID for confirmation and quantification. The MDL for MTBE by the purge-and-trap GC/MS method is 0.45 ± 0.5 μg/L with an 81% recovery. Purge-and-trap GC with a photoionization detector (PID) is slightly more sensitive for MTBE, with an MDL of 0.41 ± 0.01 μ/L with a 75% recovery (APHA 1998). Bauman (2003) asserts that the purge-and-trap extraction method (EPA Method 5030) is adequate for most monitoring needs. He reports that the hydrolysis of MTBE at pH >1.0 and temperature <45ºC is insignificant. TBA has been reported to have low and highly variable recoveries (Kopfler et al. 1976, Ramstad and Nestrick 1981, Church et al. 1997). Purge-and-trap GC/MS has been used in many U.S. Geological Survey (USGS) projects (Brooks et al. 1998) and in a large California study by Ekwurzel et al. (2002). Analytical reviews by Evans and Closman (2003) and Rong and Kerfoot (2003) suggest that results obtained from commercial laboratories meet performance criteria required of environmental projects. However, purge-and-trap GC/MS is not very sensitive for ethanol.
14

ITRC – Overview of Groundwater Remediation Technologies for MTBE and TBA February 2005
2.4.2.3 Solid Phase Microextraction Chromatography/Mass Spectrometry Method
Solid-phase microextraction (SPME) is especially useful in delineating groundwater zones where characterization goals require the measurement of analyte concentrations at sub-parts-per-billion (ppb) levels. This solventless extraction relies on the direct partitioning of analytes to a stationary phase bonded to a fused silica fiber. Sorbed ethers and alcohols are then thermally desorbed in the heated GC injection port. A 2-cm 50/30-μm divinylbenzene Carboxen polydimethlysiloxane (DVB/CAR/PDMS) fiber is used to sorb several oxygenates and their alcohol transformation products from aqueous samples (Cassada et al. 2000). The loaded fiber is inserted into the injection port of a GC and sorbed organics are desorbed and flushed into a GC/MS. Chromatic separation is accomplished with a fused silica capillary column. The main advantage of the method is high sensitivity, which enables accurate quantification of ethanol and TBA at low-ppb levels and MTBE, ETBE, and TAME at parts-per-trillion (ppt) levels. The MDLs for low standards using one column are 10 and 1.8 μg/L for ethanol and TBA, respectively, and 0.008, 0.025, and 0.038 μg/L for MTBE, ETBE, and TAME, respectively. Using two columns in series, MDLs were further reduced to 3.0 and 2.6 μg/L for ethanol and TBA, respectively, and to 0.090, 0.068, and 0.053 μg/L for MTBE, ETBE, and TAME, respectively (Cassada et al. 2000). The method has been tested for matrix effects, and in samples with high concentrations of petroleum hydrocarbon or free product. its performance is compromised due to interference (Black and Fine 2001). Zhang and Spalding (2003) demonstrated that hydrolysis did not occur in water samples spiked with ethers and preserved with HCl to a pH of 2.0 and held at 4ºC for 106 days prior to analysis using SPME GC/MS at a 220ºC injector temperature. 2.4.2.4 Direct Headspace Method
Some laboratories use the direct (static) headspace GC method coupled with MS (EPA Method 8260), FID (EPA Method 8015), or PID (EPA Method 8021) for the analysis of ethers. Briefly, 40-mL glass vials are partially filled by injection with measured aliquots of water samples; shaken for 2 minutes; and allowed to reach equilibrium. A measured volume of head gas is withdrawn in a gas-tight syringe and injected into a GC or GC/MS for identification and quantification. Typical MDLs for TBA are >100 μg/L. 2.4.2.5 Direct Aqueous Injection GC/MS Method
In direct aqueous injection (DAI) the sample is directly injected into the heated injection liner and immediately flushed onto a GC column. According to EPA Method SW-846, ethanol and other VOCs can be determined by DAI coupled with a FID or MS, but the sensitivity of ethanol is limited to ppm concentrations. Potter (1996) described a DAI-GC/FID method with an MDL near 100 μg/L for ethanol in petroleum-contaminated groundwater. Zwank et al. (2002) describe a DAI-GC/MS method for simultaneous analysis of BTEX, MTBE, TBA, and major degradation products.
15

ITRC – Overview of Groundwater Remediation Technologies for MTBE and TBA February 2005
3. SITE EVALUATION AND CLEANUP REQUIREMENTS
Data collected during the assessment and evaluation stages of a project should be sufficient to define the full extent of contamination and to determine which cleanup technologies are viable alternatives. 3.1 Conceptual Site Model
Development of a conceptual site model (CSM) is a critical component in the site evaluation and cleanup process. An initial CSM should be developed early in the site investigation process and updated regularly as new data become available during the site investigation and remediation process.
The CSM is a written and/or graphical representation of the release scenario, site characteristics (geology, hydrogeology, etc.), and likely distribution of chemicals at the site. It describes the potential transport of chemicals of concern to potential receptors through transport processes in air, soil and water. An up-to-date site-specific CSM should include the following: • Site location and vicinity maps—Maps showing the general location of the site (e.g., 5-mile
radius of the site), and a site vicinity showing the areas around the site and identifying receptors within approximately 1–2 miles from the site.
• A list of the contaminants of concern (COCs)—This list may not necessarily include only gasoline constituents, but may also include other constituents that may have a bearing on fate, transport, transformation, and treatment issues.
• Identification of potential site-specific sources of contamination—This effort should describe spatially both the historical and current areas where gasoline was managed. This is usually best done with site plan diagrams. These diagrams should include description of tank locations, dispenser islands, subsurface piping, tank fill locations, and service bays. Description of known historical releases, estimates of mass of historical releases if sufficient data is available to produce estimates, description of tank testing history, and available description of tank conditions during any tank inspection or removal activities should also be included.
• Identification of potential background sources of contamination—This is most applicable to groundwater but could also be applicable to vapor transport. The portion of the CSM should include description of the background and upgradient groundwater quality for the site, an inventory or description of upgradient and surrounding pollution sources, and a description of data for upgradient and surrounding pollution sources.
• A description of the current understanding of the nature and extent of contamination—This should include maps and figures showing extent of gasoline-related pollution both horizontally and vertically. Figures should indicate the nondetect boundaries of the pollution. Figures should also indicate the areas that are believed to contain residual separate phase hydrocarbons. Graphs should be included that depict concentration vs. time for each well and should include key COCs (e.g., benzene, MTBE, TBA and total petroleum hydrocarbons as
16

ITRC – Overview of Groundwater Remediation Technologies for MTBE and TBA February 2005
gasoline). Tables summarizing groundwater, soil, and soil gas analytical data should be included.
• A description of previous remediation activities—This should include type of remediation used, concentrations of contaminants before and after remediation, total mass removed for each COC, and figures showing target areas for prior remedial activities.
• A description of the site-specific mechanisms for chemical fate, transport, and transformation—This information should include the following: o description and figures depicting site vicinity stratigraphy; o description and figures showing groundwater gradient and any known preferential
pathways; o a table summarizing current and historical groundwater elevation data for the site and site
vicinity areas; o cross sections along axis of pollution migration showing three-dimensional
representations of hydrogeology and soil and groundwater chemistry; o cross sections perpendicular to axis of pollution migration showing three-dimensional
representations of hydrogeology and soil and groundwater chemistry; o regional geologic cross sections; o tables showing aquifer properties, including hydraulic conductivity, permeability, and
organic carbon content; o description of water-bearing units, including thickness, aquifer type (e.g., confined,
unconfined) and hydraulic conductivity; o local water balance including inflows and outflows for the site vicinity; o estimates of groundwater flow velocities and directions with comparisons to previous
interpretations; o a description of subsurface anthropogenic features that could influence subsurface
movement of contaminants (e.g., this might include wells, subsurface utilities, and/or building foundations); and
o a summary and interpretation of geochemical data. • A description of the current and potential future exposure pathways—This section should
describe groundwater use in the area including a description of nearby (within 1–2 miles) public and private water supply wells, description of nearby surface water features, a description of potential indoor air receptors, and a description of other receptors. Potential receptors should be identified on the site vicinity map.
3.2 Site Characterization Issues
After a release is identified at a site, a site characterization is conducted to identify the nature and extent of the contamination, evaluate the source area, identify potential receptors, and locate migration pathways. The results of the site characterization provide the basis for evaluation of risk, and for design of a remediation system. Because of the differences in the behavior of oxygenate plumes from BTEX plumes, several adjustments must be made in how a site characterization should be conducted (API 2000). 3.2.1 “Diving Plumes”
Differences in fate and transport properties of oxygenates from other chemicals in groundwater drive some of the differences in approach to site characterization methodologies. In areas where
17

ITRC – Overview of Groundwater Remediation Technologies for MTBE and TBA February 2005
natural or induced downward vertical gradients have not been ruled out, it is extremely important to vertically characterize the plume by multilevel sampling. All chemicals dissolved in groundwater will move hydraulically with the groundwater. If the groundwater tends to migrate gradually downward as well as horizontally, the chemicals dissolved in the groundwater will also “dive” (Figure 3-1). The effect is most pronounced for those chemicals with longer plumes. Often, the MTBE plume will be longer than the BTEX plume due to a combination of factors including higher solubility, lower sorption, higher content in the gasoline that was released, and/or slower biodegradation. Therefore, it is critically important to adequately delineate the plume both vertically and horizontally. It is a common mistake to rely on shallow water table wells for plume delineation, and in so doing, fail to identify a leading portion of the plume that is located at a greater depth than the monitoring network.
Figure 3-1. Plunging MTBE plume in a regional groundwater recharge area. (API 2000)
The purpose of flow system characterization is to understand the local and regional groundwater flow systems and its impact on the migration of a dissolved plume. Groundwater flow systems typically comprise recharge areas and discharge areas. The geometry of an oxygenate plume can be affected by its location within the groundwater flow system, so this information should be incorporated into the CSM as hydraulic and hydrogeologic information is obtained. Plumes in recharge areas tend to slowly migrate downward as the plume migrates downgradient (Weaver, Haas, and Wilson 1999; Landmeyer et al. 1998). Pumping from depth may also cause plumes to migrate downward. Under these conditions, multilevel sampling may be necessary to completely define the plume extent. While not unique to oxygenates, plume dive is often more pronounced for oxygenates than for other gasoline components such as benzene due to greater subsurface mobility. The occurrence of plume diving depends on the amount and areal distribution of recharge, vertical and horizontal components of the hydraulic gradient, the age of the release, the hydraulic conductivity of the aquifer, the stratigraphy, nature of surface cover, and the distance from the source of contaminants. USEPA provides the OnSite Web site, which contains an interactive calculator for estimating the magnitude of plume dive (USEPA 2001b).
18

ITRC – Overview of Groundwater Remediation Technologies for MTBE and TBA February 2005
MTBE does not sorb readily to soil organic carbon and therefore moves rapidly with groundwater flow. MTBE and other dissolved constituents travel rapidly in coarser, more transmissive zones. Individual studies that document plume behavior have indicated that MTBE plumes tend to be more elongated and thinner than benzene plumes (Weaver, Haas, and Wilson 1996; Weaver, Haas, and Sosik 1999). Plume studies conducted by Lawrence Livermore (Happel, Beckenbach, and Halden 1998) and Texas (Mace et al. 1997, Mace and Choi 1998) did not find large differences in plume length between MTBE and benzene plumes; however, because the monitoring well networks used in these studies were not specifically designed to identify the full extent of MTBE plumes, the three-dimensional plume characterization may have been incomplete. Plume diving is less likely in areas where there is low-permeability surface cover, such as the paved area of a gas station. As the plume migrates beyond areas of surface pavement, plume diving is more likely due to increased recharge (Figure 3-2) (Landmeyer et al. 1998).
SourceArea
Xylene
BenzeneMTBE
Quarry(Recharge)
7000’ from source
80’ BGL
10’
SourceArea
Xylene
BenzeneMTBE
Quarry(Recharge)
7000’ from source
80’ BGL
10’
SourceArea
Xylene
BenzeneMTBE
Quarry(Recharge)
7000’ from source
80’ BGL
10’
Figure 3-2. Schematic of contaminant plumes, East Patchogue, Long Island. (MTBE plume is deeper and detached from source area. (Adapted from Weaver, Haas, and
Wilson 1996; Weaver, Haas, and Sosik 1999). Because of the tendency of MTBE plumes to be narrow and long in aquifers with relatively high rates of flow, it may be necessary to collect samples at closely spaced intervals. Transects of closely spaced wells or temporary well points may be necessary to intercept the plume. Unless monitoring well networks are spaced fairly closely across the width of the plume, it is possible to miss the MTBE plume entirely. During site characterization, closely spaced direct-push sampling points at multiple depths placed perpendicular to the expected axis of the plume can be used as a tool for delineating a plume and facilitating proper placement of permanent monitoring wells. A
19
ITRC – Overview of Groundwater Remediation Technologies for MTBE and TBA February 2005
limited site characterization, constrained either areally to the property boundaries or vertically to the top of the water table, may be insufficient for predicting potential future impacts to off-site receptors. 3.2.2 Horizontal Characterization
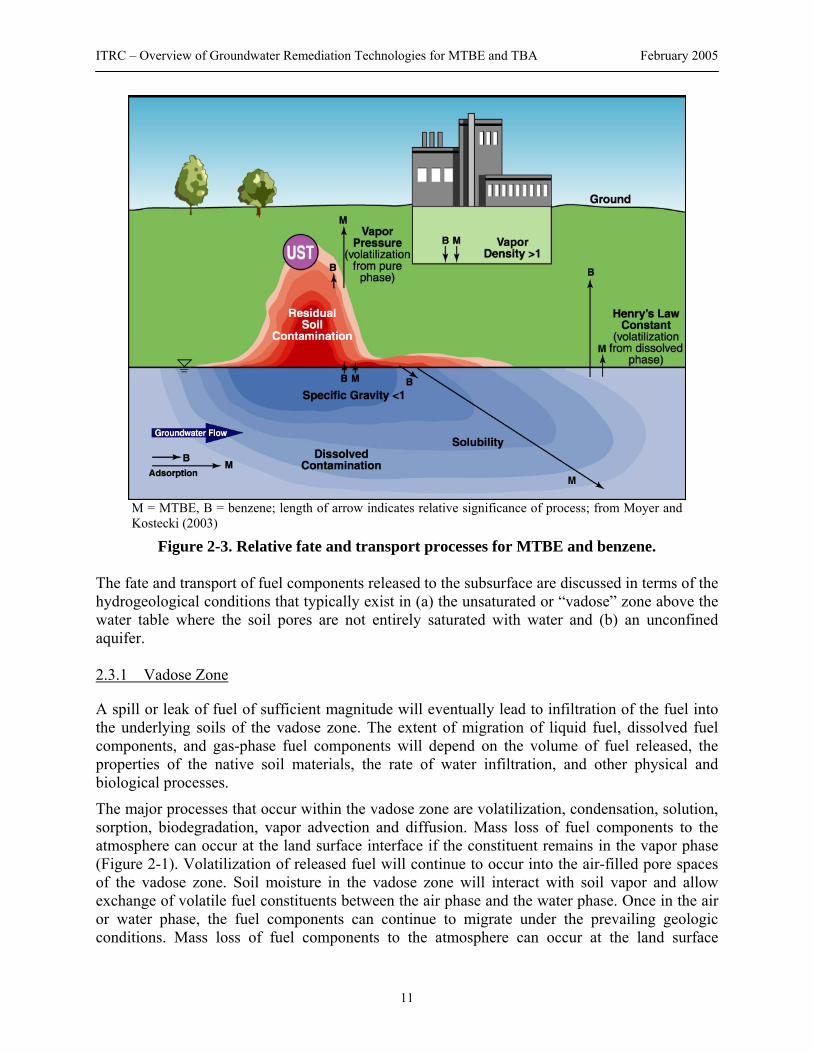
Groundwater flows in response to hydraulic gradients, the conductance of aquifer materials, and the influence of hydraulic boundaries. The flow of groundwater is three-dimensional in nature and can be described as a vector quantity with horizontal and vertical components. When interpreting and simulating the flow of groundwater, the horizontal and vertical components of flow are typically dealt with independently for simplicity of calculation, and the three-dimensional groundwater flow determined by resolving these vector components. Therefore, the following discussion of aquifer characterization is described in terms of horizontal and vertical aquifer properties and horizontal and vertical gradients. These two directions are also emphasized because of their close relationship to site characterization and development of a suitable conceptual model. Since groundwater flow is an important contaminant transport mechanism, proper characterization of contaminant plumes requires site-specific knowledge of the magnitude and direction of flow. Both the horizontal and vertical directions of flow have important implications for site characterization and assessment. Shallow groundwater tends to follow topography, with water flowing from topographic highs toward topographic lows. Thus a first indication of groundwater flow direction can come from a topographic map. This is an “indication” because groundwater flow directions are influenced by a number of other factors. Figure 3-3 shows a schematic of a site that is located between a lake and a river. There is a drop in elevation of roughly 185 feet between these two features. This difference indicates that groundwater flow would be from south to north across the site, although the small tributaries may have some local influence.
Figure 3-3. Schematic of example site showing relationship between the site, a nearby lake, and river network.
The topographic map provides a large-scale indication of the direction of groundwater flow. Groundwater levels at the site are used to refine the estimated groundwater flow directions. Locally, water levels are influenced by subsurface heterogeneity, well construction, drought or
20

ITRC – Overview of Groundwater Remediation Technologies for MTBE and TBA February 2005
rainy periods, pumpage from nearby wells, and local land usage. These factors have various influences: • Heterogeneity: Heterogeneity can cause variation in the magnitude and direction of
groundwater flow because water tends to flow preferentially through the most permeable materials. The location and orientation of each type of geologic material influences the gradient.
• Well Construction: Ideally, groundwater levels would be measured by true piezometers that are open to the aquifer at only a discrete point in space. Since it is more common to use the screened intervals of wells to measure groundwater levels, the length of the well screens and their position with respect to hydrogeologic strata must be considered when interpreting flow directions from groundwater level data.
• Rainfall: Groundwater levels rise and fall in response to changes in rainfall occurring over relatively long time periods. Because of heterogeneity and variations in local recharge, groundwater levels may not rise or fall uniformly. Droughts that last several years will generally result in declines in groundwater levels and possible shifting of discharge areas.
• Well Pumpage: Changes in pumpage in water supply wells may shift the location of a contaminant plume.
• Land Usage: All of these patterns of flow are influenced by land usage. The land surface near many UST systems tends to be paved and located nearby other expanses of pavement. These relatively impervious surfaces may shield the aquifer from some local recharge, and cause the water levels immediately below the gas station to represent poorly the regional flow of groundwater through the site. If the only available groundwater level data are from beneath paved areas, plumes may be interpreted to migrate in unexpected directions away from the site. Although pavement may prevent local recharge, other features such as drainage ditches and leaking storm drains may serve as local recharge points. These features may further confound the interpreted flow directions obtained from a small number of monitoring wells.
Figure 3-4 shows the magnitude and direction of groundwater flow at the example site for 12 sample rounds of data. These were determined using the USEPA online gradient calculator available at http://www.epa.gov/athens/onsite. The circular plot shows the magnitude and compass direction of gradient by the size and orientation of the triangles. For 11 of the sample rounds, flow is interpreted to be directed northerly, with a deviation of ±30° from north (Figure 3-5). Most of the time (8 of 12 sample rounds) the flow is interpreted to be within 10° of north. The magnitude of the hydraulic gradient also varies, with most values around 0.06. When the interpreted flow directions shift significantly, higher magnitudes are seen at this site. During the 12th sample round the interpreted flow direction shifted to the south. This occurred at a time when the average water level was between 2 feet and 7 feet higher than previously observed. This sample round clearly is not typical for the site. As an exercise, consider the outcome if these were the only data available for the site. The direction of flow presumed from these data would be opposite that indicated from the 11 other sample rounds and from the site topography.
21

ITRC – Overview of Groundwater Remediation Technologies for MTBE and TBA February 2005
0
45
90
135
180
225
270
315
0 0.1 0.2 0.3 0.4
Figure 3-4. Wind rose representation of gradient magnitude and direction. Most of the data indicate that the interpreted flow direction is generally to the north.
0
45
90
135
180
225
270
315
0 0.04 0.08 0.12
Figure 3-5. Interpreted gradient and magnitude for the first 11 sample rounds.
Changing water levels at sites and the various factors that influence groundwater flow point to a strategy for determining the direction of flow:
22

ITRC – Overview of Groundwater Remediation Technologies for MTBE and TBA February 2005
• Topography: Use site topography to indicate the large-scale, general direction for
groundwater flow • Local Water Levels: Use site-specific data to indicate the small-scale direction of flow.
Caution should be used with data taken only over a limited area or from beneath paved surfaces. Consider the length of well screens and position with respect to hydrogeologic strata when interpreting flow directions.
• Time: Collect data over time to indicate the range of conditions at the site. The topography and local water levels give the relationship between the regional and site scales. Each of these can contribute to understanding behavior at the site. Only by collecting and evaluating data over time can the impact of temporal fluctuations be assessed. By considering these three factors, the monitoring network can be designed to delineate the contaminant plume and provide adequate data for decision making. 3.2.3 Vertical Variability
Oxygenate concentrations in groundwater downgradient of active source zones tend to correlate well with high-conductivity zones in the aquifer. MTBE does not sorb significantly to organic clays within finer-grained layers. Downgradient of source zones, higher concentrations of MTBE tend to be found within coarser zones. Concentrations of MTBE can vary widely within small intervals in an aquifer. Conversely, if the source is removed or weathers away rapidly, it is possible to find the highest concentrations of MTBE in the less conductive material, because the MTBE has flushed out of the more conductive material. Because there can be large concentration variations within small vertical distances within an aquifer, well screen placement and length are extremely important. Vertical plume characterization avoids averaging contaminant distributions over arbitrarily long screen lengths and thus reducing maximum concentrations, missing the downgradient edge of a plunging plume (Figure 3-6), and possible confusion presented by the presence of possible contaminant contributions from other sources. Vertical plume delineation is critical because of the possibility of diving plumes.
Figure 3-6. Example of a missed diving plume.(From South Lake Tahoe, Dernbach 2000)
It is recommended that, during initial site characterization using soil coring methods, soil be retrieved continuously to identify changes in stratigraphy that might be missed by typical sampling methods of retrieving soil samples at 5-foot intervals.
23

ITRC – Overview of Groundwater Remediation Technologies for MTBE and TBA February 2005
Direct-push methods are useful for rapidly collecting soil and groundwater samples and can be used to install small-diameter wells or permanent soil gas points. A membrane interface probe (MIP) can be used with direct-push equipment to provide depth-discrete detection of dissolved phase organics (Geoprobe Systems N.d.). Detection limits and general applicability for oxygenates are still under evaluation. Cone penetrometer technology (CPT) can also be used to classify soil types and detect the presence of a variety of contaminants. CPT or electrical conductivity data can be used to identify site geology and zones of high and low hydraulic conductivity (Butler et al. 1999, Butler et al. 2002, Schulmeister et al. 2003). Passive diffusion bag (PDB) samplers are a recent technology development for collecting VOC samples. The results of laboratory testing, however, indicate that PDB samplers should not be used for MTBE, several other VOCs, or most semivolatile organic compounds. Studies indicate that these compounds are transmitted through the bag, but the resulting concentrations are lower than in the surrounding groundwater (ITRC 2002a). Multilevel groundwater monitoring can be accomplished by installing clusters of short-screen, single-interval monitoring at different depths (Figure 3-7). The site-specific geology and the objectives of the monitoring program determine the number and depths of the individual wells.
Figure 3-7. Example of a well cluster. USEPA provides the OnSite Web site, which contains an interactive tool that demonstrates the effect of differences in well screen length and placement on the average borehole concentration (USEPA 2001a). Based on data from the East Patchogue site on Long Island, the model allows changes in screen placement and length and calculates the contaminant concentration that would be expected. This calculation includes the variability of the contaminant distribution and the hydraulic conductivity over the screened segment of the aquifer.
24

ITRC – Overview of Groundwater Remediation Technologies for MTBE and TBA February 2005
Figure 3-8 shows screen shots of the calculator for cases that illustrate screen placement above, at the maximum, and below the bulk of the contaminant. The line on the graph shows the actual concentrations of MTBE in groundwater, based on closely spaced sampling intervals. The shaded area shows the location and length of the well screen. The table beside each graph shows the results of varying the depth of the top of the screen and the length of the screen.
Top of screen at 20 feet Screen length (feet)
Estimated borehole concentration (μg/L)
20 119.5
Top of screen at 50 feet Screen length (feet)
Estimated borehole concentration (μg/L)
5 5677.0
Top of screen at 70 feet Screen length (feet)
Estimated borehole concentration (μg/L)
10 994.7
Figure 3-8. Example from USEPA Web-based calculator demonstrating the effect of well screen length and position on average borehole concentration.
25
ITRC – Overview of Groundwater Remediation Technologies for MTBE and TBA February 2005
3.2.4 Identification of Vertical Gradients
Groundwater elevations from on-site or nearby monitoring wells should be interpreted using potentiometric contour maps. For sites where vertical migration is a concern, clustered wells can be used to evaluate vertical gradients. An interactive calculator on USEPA’s OnSite Web site (http://www.epa.gov/athens/learn2model/part-two/onsite/vgradient.htm) can be used to estimate the vertical gradients in adjacent or nested wells. Horizontal and vertical gradients should be evaluated carefully; a hydraulic gradient represents the driving force for flow but does not indicate the magnitude of the flow. Steep vertical or horizontal gradients can indicate regions where there are barriers to flow (or major changes in hydraulic conductivity), where the rate of recharge is high, or where a large flux of groundwater is occurring (e.g., near a pumping well), or a combination of these conditions. Geologic controls on groundwater flow should be understood when interpreting groundwater levels, gradients, and potential flow directions. Groundwater pumping can have a major effect on the location and ultimate fate of many contaminant plumes. Pumping wells create converging groundwater flow lines, thereby drawing the contaminant plumes into their well screens. Concentrations in the pumping well are diluted if part of the captured water is contaminated groundwater, and part of the captured water originates from unaffected areas or water-bearing layers. In aquifers that are not separated by impervious layers, downgradient pumping can create or change hydraulic gradients that change plume geometry. 3.2.5 Site Characterization Analytes and Parameters
During site characterization, it is recommended that information on certain chemical parameters be collected that might help determine which remedial technologies could be effective, and which technologies might not be feasible. The following parameters should be considered for collection during site characterization: • water level (or piezometric (i.e., potentiometric) head), • dissolved oxygen (DO), • electrical conductivity, • pH, • oxidation-reduction potential (ORP), • temperature, and • total dissolved solids. Down-hole probes can be used to measure water level, DO, conductivity, temperature, pH, and ORP. Other potentially useful parameters include the following: • biochemical oxygen demand (BOD), • chemical oxygen demand (COD), • ferrous iron, • nitrate, • sulfate, • methane,
26

ITRC – Overview of Groundwater Remediation Technologies for MTBE and TBA February 2005
• hydrogen, and • alkalinity. Chapter 4 contains recommendations for analytes and parameters specific to particular remedial methods and treatment technologies. It is important to analyze groundwater samples, in at least one round, for all contaminants of potential concern. For subsequent rounds the analyte list can be reduced to those that were detected at concentrations of concern. This will be specific to the site history and the regulatory context of the site. Analytes to consider in addition to BTEX and MTBE could include TBA, DIPE, TAME, TAA, ETBE, the trimethylbenzenes, naphthalene, ethanol, methanol, ethylene dibromide, 1,2-dichloroethane, and lead, depending on the types of gasoline used at the site. If the site was a gas station at which auto repairs were historically conducted, it might be advisable to analyze a round of samples for a full analyte list of VOCs to detect chlorinated solvents and other chemicals that might conceivably have been released. Some states, such as Massachusetts and Alaska, also require analysis for petroleum fractions (e.g., C9–C10 aromatics or C5–C8 aliphatics). It is also important to measure groundwater elevations and from them to determine groundwater flow direction at different times of the year. At some sites, seasonal variability in groundwater flow direction can be significant. 3.2.6 Expedited Site Characterizations and Dynamic Work Plans
The expedited site characterization process is a framework for rapidly characterizing site conditions for input into corrective action decisions. Because of the nature of oxygenate plumes, expedited site characterizations make an excellent approach to site characterization. An expedited site characterization is made up of the following features • field-generated data and on-site interpretation, • a flexible sampling and analytical program, and • senior staff in the field that are authorized to make sampling and analytical decisions. Expedited site characterizations have been made possible in recent years by the development of improved, cost-effective methods for rapid collection and field analysis of soil, soil-gas, and groundwater samples. As new site information is generated, it is used to direct the assessment. Field-generated data is used to update the CSM as the assessment proceeds because the sampling and analysis plan is dynamic. In this way, data gaps are filled, and anomalies are resolved prior to demobilization. A number of excellent references exist about how to conduct expedited site characterizations. Expedited site characterization concepts are presented in the ASTM documents Standard Guide for Accelerated Site Characterization for Confirmed or Suspected Petroleum Releases (ASTM 2004a) and Standard Practice for Expedited Site Characterization of Vadose Zone and Ground Water Contamination at Hazardous Waste Contaminated Sites (ASTM 2004b), on the USEPA Triad Resource Center Web site at www.triadcentral.org, and in the ITRC document ITRC/ASTM
27
ITRC – Overview of Groundwater Remediation Technologies for MTBE and TBA February 2005
Partnership for Accelerated Site Characterization Summary Report (ITRC 1997). Gary Robbins of the University of Connecticut, in conjunction with the Connecticut Department of Environmental Protection, has produced a training compact disk entitled Expedited Site Assessment: The CD (Robbins 2001). This is a multimedia technical guidance document on investigating fuel releases at underground storage tank release sites. Another reference document on how to conduct an expedited site characterization is Expedited Site Characterization Tools for Underground Storage Tank Sites: A Guide for Regulators (USEPA 1997b). Cost-effective generation of data in real time permits a work flow strategy commonly known as “dynamic work plans,” which employs real-time decision making in the field by experienced staff following preapproved decision trees. When thoroughly planned and properly implemented, real-time decision making saves project costs because fewer remobilizations are needed to fill data gaps, and expensive equipment and labor (such as backhoes, drill rigs, and their operators) are more efficiently used. Dynamic work plans can also produce more thorough and accurate site characterizations because immediate feedback enables data gaps and unexpected discoveries to be rapidly resolved (USEPA 2003). The result is complete and accurate conceptual models that enable decision makers to design successful and cost-effective treatment systems and redevelopment options. Dynamic work plans are gradually increasing in acceptance with regulators. A proper CSM used in conjunction with a dynamic work plan can create the framework needed for explicitly managing both data and decision uncertainties, while simultaneously shortening project lifetimes and cutting overall project costs. 3.2.7 California Guidance
California has proposed a decision-making framework that centers on the development and continued modification of an CSM (see Section 3.1) (SWRCB 2000). The CSM is an assemblage of information regarding the distribution of chemicals at a site and its hydrologic setting. It describes the release scenario, surrounding land use, geology, well locations, and the likely distribution of chemicals at the site, existing and projected water use patterns, and other factors considered when making decisions about a case. It functions as the framework for the investigation, remediation, and ultimately the closure of the site and serves as the basis for communication between responsible parties, regulators, and other interested parties. The CSM is checked and updated when new data become available. When it is determined that a site requires remedial action, those actions should be taken quickly because of the rate of travel of MTBE. It is normally cheaper to remediate a small area of high concentration than a large area of lower concentration. Each subsequent phase of investigation seeks to fill a data gap in the CSM. After the source area and pathways to receptors have been adequately characterized, an appropriate remedial method can be selected and implemented. Sites with high concentrations and a large release mass may need an interim remedial action to reduce contamination in the source area. Periodic groundwater monitoring is used to supplement the information collected during the original site characterization data and to confirm assumptions about the CSM. Groundwater monitoring will confirm whether site conditions will meet regulatory requirements and may include evaluating seasonal changes in site conditions, documenting evidence of source
28
ITRC – Overview of Groundwater Remediation Technologies for MTBE and TBA February 2005
depletion, evaluating plume stability or migration, or assessing the effectiveness of corrective actions. Assessment strategies differ somewhat between BTEX and oxygenates, but periodic monitoring strategies are similar. The potential for more rapid migration of oxygenates should be a consideration when determining monitoring frequency and well spacing. 3.3 Regulatory Issues
Standards for MTBE and other nonregulated chemicals (including non-MTBE fuel oxygenates) are subject to a variety of gradually evolving local, state, and federal laws. Impacts on potable uses of groundwater are regulated by the Safe Drinking Water Act (SDWA), passed in 1974 and amended in 1986 and 1996. SDWA specifically grants USEPA the authority to set drinking water standards. Drinking water standards are regulations that USEPA sets to control the level of contaminants in the nation’s drinking water. Threshold concentrations, (typically) measured in milligrams per liter, are called maximum contaminant levels (MCLs) and have been established for the most critical contaminants. USEPA’s standards are part of SDWA’s “multiple barrier” approach to drinking water protection that essentially lumps suspect chemicals into three categories. The first two, the National Primary Drinking Water Regulations (NPDWR) and the National Secondary Drinking Water Regulations (NSDWR), are federal law. NPDWRs (or “primary standards”) protect public health by limiting the concentrations of contaminants in drinking water. They are legally enforceable standards that apply to public water systems. NSDWRs (or “secondary standards”) are nonenforceable guidelines regulating contaminants that may cause cosmetic effects (such as skin or tooth discoloration) or aesthetic effects (such as taste, odor, or color) in drinking water. USEPA recommends secondary standards to water systems but does not require systems to comply. States may choose to adopt them as enforceable standards. The third category encompasses all other suspect chemicals, simply calling them “unregulated contaminants.” Unregulated contaminants are not subject to any proposed or promulgated national primary drinking water regulation. However, states may, at their discretion, enact and enforce individual standards that exceed SDWA provisions. Although MTBE is a COC in many states, there is no federal primary drinking water standard or MCL for this compound. In 1997, as part of implementing the 1996 SDWA Amendments, USEPA’s Office of Water placed MTBE in the first draft of the Drinking Water Contaminant Candidate List (CCL) (Federal Register 1997). The CCL divided MTBE and 59 other chemical and microbiological contaminants among three priorities: those needing additional research, those needing more occurrence data, and those which could be considered for rulemaking. Comments submitted in response to the draft CCL were reviewed and incorporated into the final CCL, published March 2, 1998 (Federal Register 1998). After evaluating MTBE for risk to human health, its occurrence in drinking water, and the potential benefits of regulation, USEPA determined that “additional research” was necessary. In July 2003, USEPA published Announcement of Regulatory Determinations for Priority Contaminants on the Drinking Water Contaminant Candidate List (68 FR 42897), immediately removing nine CCL contaminants from further NPDWR consideration (Federal Register 2003). USEPA’s actions combined with a lengthy rule development process imply that an MCL for MTBE isn’t likely until 2010. A
29

ITRC – Overview of Groundwater Remediation Technologies for MTBE and TBA February 2005
drinking water advisory has been issued by USEPA (1997a) and is the basis for several state standards. The lack of federal drinking water requirements for MTBE and its frequent occurrence in public and private water supplies have forced many states to establish their own standards. These standards may be based on carcinogenic, noncarcinogenic, or aesthetic (taste and odor) concerns. Consequently, drinking water standards for MTBE vary widely among the 50 states, with Delaware, New York, New Hampshire, and California having the most stringent (10–13 μg/L) and Louisiana having the least restrictive (520 μg/L). Eight states have either chosen not to establish a standard or by state statute are prohibited from setting a standard and must depend on the establishment of a federal standard for drinking water contaminants. Other states do not have formal drinking water standards for this chemical but use various criteria for setting a standard for this chemical including the following: • groundwater standard, • groundwater action level, • groundwater cleanup level, • health risk guidance level, and • health advisory. Some of these standards are used in remediating groundwater and may not be enforceable by the state agency. These standards may be established by either rule or by policy and may be set for drinking water or as an action or cleanup level in groundwater. Figure 3-9 presents a map of MTBE cleanup standards for the 50 states (USEPA and Delta Environmental 2004). It is interesting to note that the state of Hawaii has a drinking water standard of 20 μg/L but at the same time has a non drinking water standard of 202,000 μg/L. As with MTBE, USEPA has no drinking water standard for TBA. However, unlike MTBE, TBA is not on USEPA’s CCL; therefore, establishment of an MCL for this chemical would likely not occur until well after 2010. Sixteen states have some requirement for remediation of TBA. Figure 3-10 presents a state-by-state map of TBA cleanup standards (USEPA and Delta Environmental 2004). Remedial objectives range from 12 μg/L for California to 3,900 μg/L for Michigan. The TBA standard for Oklahoma is “site specific” and offers no guidelines for a maximum permissible TBA concentration. The remaining 42 states have no standard for this chemical and in many instances do not even sample for this compound. With such a wide range of applicable standards for MTBE and TBA, regulators should investigate their state’s cleanup standards before proceeding with a cleanup action. Said differently, a remediation process that was required for the state of Louisiana may not be acceptable in Delaware or New Hampshire.
30

ITRC – Overview of Groundwater Remediation Technologies for MTBE and TBA February 2005
Figure 3-9. State groundwater action/cleanup levels for MTBE. Reproduced with permission.
3.4 Considerations in Choosing Appropriate Technologies
There are many factors that should be considered when selecting or approving the use of remediation and treatment technologies. Factors that affect the ability of the technology to meet remediation and/or treatment goals and the ability of the technology to meet federal, state and local requirements are those that require evaluation. In short, technologies which merit detailed evaluation must be able to meet remediation and/or treatment goals and must be capable of obtaining federal, state, and local permits and/or approval. Once identified, the following factors, listed in no particular order of importance, may need to be considered when selecting and or approving a specific remedial technology: • Cost—Cost is often one of the most heavily weighted factors used for selecting remedial
solutions. In many, but not all cases, the most cost effective solution is appropriate. • Stakeholder Acceptance—Early identification of stakeholder concerns is critical in a remedy
selection process. The evaluation of these concerns is most critical for situations in which the
31

ITRC – Overview of Groundwater Remediation Technologies for MTBE and TBA February 2005
Figure 3-10. State groundwater action/cleanup levels for TBA. Reproduced with permission.
public has direct and/or visible impact from the remedial solutions. For example, in situations where remedial solutions involve drinking water wellhead treatment, the public will need to understand remedial options and their effectiveness, and have the ability to provide input into the remedy selection process. o For biological remedial processes, obtaining public acceptance of the treatment approach,
especially for drinking water applications, may be very difficult due to the complexity of the process, the potential concerns over bi-product formation, and the concerns over reliability.
o In addition to technology performance factors, aesthetic issues should not be ignored when evaluating technologies. Disturbance to communities during remedy implementation and long-term operation and maintenance are critical factors that may influence the selection or approval of remedial solutions. For example, tall unsightly air stripping towers may lead to community opposition.
• Commercial Availability—Although some technologies have been successfully implemented
in limited pilot- and field-scale settings, the likelihood of the particular technology to meet standards at the particular site and technology vendor’s ability to implement the technology should be a major consideration when choosing a technology and vendor.
32
ITRC – Overview of Groundwater Remediation Technologies for MTBE and TBA February 2005
• Reliability—Reliability is a major concern related to many technologies used for
remediation. Biological processes have a significant sensitivity to upset conditions. In situ treatment processes have significant sensitivity to contaminant distribution and geologic uncertainty. Reliability requirements should be identified early on in the technology identification and selection process to best select the most appropriate solution. For example, for drinking water applications, reliability is likely to be extremely critical. Therefore, a “multibarrier” approach may be most appropriate to safeguard against discharge exceedances.
• Implementation Effort—Some remedial solutions may be viable only with significant
implementation effort. For example, remedies involving biological treatment need to be monitored closely to ensure continuous compliance with treatment standards. Biological treatment systems also require significant expertise related to the microbial degradation to be designed and implemented properly.
• Regulatory Agency Involvement—Some technologies require much more oversight by
regulatory agencies than other approaches. For example, an approach involving monitored natural attenuation requires a long-term commitment on the part of both the responsible parties and the regulators to regularly confirm that this type of approach is protective. Therefore, although MNA approaches may be protective and the least expensive approach to manage a particular LUST site, this approach creates a long-term resource commitment for regulatory agencies until the particular MNA cleanup is complete.
3.5 Performance Monitoring
3.5.1 Objectives
The primary objective of performance monitoring is to verify acceptable progress towards remedial goals. Objectives for any monitoring program should be met through routine hydraulic measurements of contaminant containment, contaminant and geochemical indicators of contaminant dissipation or persistence. These data are used to evaluate changes in three-dimensional plume boundaries, contaminant concentration, mass, or mass discharge, and hydrological and geochemical changes indicative of impacts to performance of the remedy (Pope et al. 2004). The objectives for all monitoring programs should include the following: • Determine whether contaminant concentrations are decreasing according to expectations. • Detect change in environmental conditions (e.g., hydrogeological, chemical, microbiological,
or other changes) that may reduce the efficiency of the remediation technology. • Identify any potentially toxic and/or mobile transformation products. • Determine whether or not that the plume is shrinking. • Verify no contaminant interception at downgradient receptors. • Detect any new releases to the environment that could affect the effectiveness of the remedy.
33

ITRC – Overview of Groundwater Remediation Technologies for MTBE and TBA February 2005
• Detect changes in groundwater flow rates or directions that may allow contaminants to move into previously unimpacted areas.
• Verify attainment of the remediation objectives. 3.5.2 Monitoring Program
The frequency of monitoring should be adequate to detect, in a timely manner, the potential changes in site conditions listed above. At a minimum, the monitoring program should be sufficient to enable a determination of the rate(s) of attenuation and how that rate is changing with time. The monitoring program developed for each site should specify the location, number, frequency, and type of samples and measurements necessary to evaluate whether the remedy is performing as expected and is capable of attaining remediation objectives. 3.5.3 Target Zones
Typically, groundwater monitoring wells are installed during site characterization activities. The fundamental objective of groundwater monitoring during remediation is to define the extent of contamination in three dimensions and to document trends in contaminant concentrations. Groundwater monitoring should be designed to ensure that the vertical and lateral extent of contaminants in groundwater is evaluated. Each distinct flow zone and geochemical regime should be monitored to assess remediation status. In general, for each distinct flow zone at the site, the following locations should be monitored: background, source area, main body of the plume, and distal portions and boundaries. The resolution and frequency of monitoring is strongly dependent on the hydrogeological complexity and the threat to current and potential receptors. Typical target zones for monitoring a contaminant plume include the following: • Source areas and within and immediately downgradient of potential source areas. The
monitoring objective is to estimate a source mass (or mass discharge), which can assist in determining potential source longevity or assessing threats to receptors. These sampling points also enable determination of future contaminant releases to the environment.
• Flow zones with highest contaminant concentrations or hydraulic conductivity. These are the zones where maintenance of a stable or shrinking plume is a primary concern. A change in conditions in these zones may lead to a relatively rapid impact to a downgradient receptor.
• Distal or fringe portions of the plume. These are areas where reductions of contaminants to concentrations required by remedial action objectives (e.g., site specific cleanup targets) may be attained most rapidly and where increases in concentrations that indicate impending plume expansion may be observed.
• Plume boundaries. Multilevel monitoring points should be placed at the sidegradient, downgradient, and vertical plume boundaries and between these boundaries and potential receptors. Results from these monitoring locations may directly demonstrate any unacceptable plume expansion.
34

ITRC – Overview of Groundwater Remediation Technologies for MTBE and TBA February 2005
• Zones in which contaminant reduction may be unacceptably slow. These are the areas where attaining cleanup targets within reasonable time frames may be impeded due to site conditions. Such areas, if present, will be determined through data obtained throughout the performance monitoring period. These areas may require additional remedial actions to reduce contaminant concentrations to desired levels.
• Background locations. Background locations include monitoring points that are hydraulically upgradient and sidegradient with respect to the plume. Multiple monitoring points should be used to determine the variability of background conditions.
3.5.4 Data Assessment
Data interpretation focuses on the spatial and temporal assessment of the fate of COCs and comparison with site-specific goals. Decisions regarding remedy effectiveness and the adequacy of the monitoring program will generally result in either continuation of the program, program modification, or implementation of a contingency or alternative remedy. Such decisions should be based on specific, quantifiable performance criteria documented in the monitoring plan. Continuation of the program without modification would be supported by contaminant concentrations behaving according to remedial expectations while groundwater flow and geochemical parameters remain within acceptable ranges. Modifications of the program, including increases or decreases in monitoring parameters, frequency, or locations, may be warranted to reflect changing conditions or increased understanding of attenuation processes at the site. Situations that might trigger implementation of a contingency or alternative remedy include the following: • increasing contaminant concentrations or trends not predicted during remedy selection or
indicative of new releases, • contaminant migration beyond established plume or compliance boundaries, • contaminants not decreasing at a rate sufficient to meet remedial objectives, • changes in land or groundwater use that have the potential to reduce protectiveness of the
remedy, • contaminants observed in locations posing or having the potential to pose unacceptable risk
to receptors, and • changes in cleanup goals or the discovery of additional COCs, including breakdown
products, which exceed cleanup goals. Performance monitoring should continue until the remedial objectives have been achieved, and generally for a period of one to two years of compliance monitoring to ensure that contaminant concentrations remain below the target goals. The results of predictive monitoring should, under no circumstances, be used to justify a decision to terminate performance monitoring. The decision to terminate performance monitoring should be based only on adequate field data that convincingly demonstrate that contaminant concentrations have met remediation objectives. If the remedial technology does not appear to be effective in remediating the contamination at the site within a reasonable time frame, then modifications to the remedial system should be made,
35

ITRC – Overview of Groundwater Remediation Technologies for MTBE and TBA February 2005
or an alternative remedial technology (as specified in the contingency plan) should be implemented. 3.5.5 Post-Remedial Monitoring
Rebound testing is an important part of monitoring when remediation involves circulation of water or air in the subsurface, as in the case of air sparging, pump and treat, and some in situ chemical oxidation or bioremediation applications. When monitoring data indicate that treatment goals have been achieved, it is critical to verify that concentrations have been decreased on a permanent basis. Often when these treatment systems are turned off, dissolved concentrations will increase (“rebound”) as residual droplets of product present in the subsurface continue to release contaminants that are not then diluted by moving streams of water or air (as they were previously when the treatment systems were running). Depending on hydrogeology, it may take many months for rebound to become apparent. One approach during remediation is to conduct rebound testing periodically, such as short tests annually. The resulting peaks in concentration that occur when the system is shut down should decrease over time; often the trend in these data can give a preliminary indication of approximately how long active remediation will be required, or when switching another technology (e.g., MNA) may be appropriate. Periodic rebound testing can also indicate whether significant source material is still present in the subsurface, for example, if the peaks do not decrease over time. Monitoring of the remediation system itself is often required in addition to environmental monitoring. The nature of the remediation system monitoring is highly site specific and dependent on the remediation technology(s) employed. Relevant parameters (depending on the technology) might include flow rates; pressures; temperatures; influent, midfluent, and effluent concentrations; pH; microbiological data on electron donors and acceptors, nutrients, or microbial populations; or concentrations of transformation products. 3.6 Public Considerations in Specifying a Treatment Technology
3.6.1 Public Involvement in the Remedial Selection Process
Although not required under federal regulations, many state LUST programs have a formal process to inform and involve the public during the remedial selection process. Public comment under this type of program is then typically incorporated into a final remedial action plan or record of decision. Efforts to involve the public may be merely informational, or they may actually solicit participation in the decision-making process. Vehicles for public involvement include mailings, fact sheets, meetings, hot lines, or even assigning someone to act as a public liaison. Of course, any of these could be used to obtain public input in a nonformal program as well. Even when there is no effort to include the public, local communities can and do sometimes influence the course of action. This influence could come in the form of simple objections or complaints from a few individuals but may also escalate to include whole neighborhoods, civic groups, and local government. Such response could come at any time during the selection process, or worse, after the remedial plan has been implemented.
36
ITRC – Overview of Groundwater Remediation Technologies for MTBE and TBA February 2005
It is important to recognize that pubic involvement, whether solicited or not, can have a considerable effect on the remediation process and should be considered carefully. 3.6.2 Public Education
MTBE is a relatively new subject to many people, and it may require a certain level of education to bring the public up to speed. Basic questions such as “What is it?”, “Why is it used?”, “How does it compare to other gasoline components?”, and “What is its percentage in fuel?” will have to be answered. The primary questions for most people will involve health-related issues associated with MTBE: “Is it dangerous?”, “How do I know if it is in my drinking water?”, “Does it cause cancer?”, and “Are there other health risks?” Like anything new or unknown, there may be confusion about the actual risks involved, leaving a general perception that it somehow poses a unique threat. Public education should be used to put MTBE in perspective with the other components of gasoline. Current standards and action levels should be discussed, including how these limits were developed (i.e., health based?, nuisance threshold?). Potential exposure routes should be clearly stated and put into perspective. It is not uncommon for people connected to a public water system to know very little about where this water actually comes from. It may be from a surface water reservoir system or from a wellfield that is protected by a confining layer or outside of the immediate area. Either way, in most cases municipal water supplies are routinely tested at the point of distribution to ensure quality. MTBE may pose a special concern for private well owners, however, and this should be pointed out. 3.6.3 Typical Public Concerns
The selection and implementation of a remedial strategy to address an MTBE plume may be of great interest and concern to the affected or potentially affected community. In suburban areas, many gasoline retail stations are located within a narrow commercial zone along a main corridor. Residential properties are typically located behind this zone, and, in many cases, directly border the commercial property. Sites which have a residential area in close proximity such as this will undoubtedly have additional criteria that must be factored into the remedial selection process. The typical concerns of the local community can be divided into two types: effectiveness issues and implementation issues. Effectiveness issues are usually first and foremost in the public’s mind, particularly for those who are directly affected by the plume or who may be affected at some point in the future. Effectiveness issues include the following: • Protection of Public Health—Will the proposed remedy fully mitigate current impacts to
residences such as vapor intrusion or impact to potable/irrigation wells, and/or will it prevent such impacts from occurring in the future?
• Protection of Water Supplies—Will the proposed remedy protect and restore the potable groundwater resource?
• Protection of Ecological Resources—If the groundwater discharges directly or indirectly (via conduit) to surface water such as streams, ponds, wetlands or other ecological habitat, will the remedy offer sufficient protection?
37

ITRC – Overview of Groundwater Remediation Technologies for MTBE and TBA February 2005
• Restoration of the Resource—To what degree will the remedy be successful in remediating the groundwater resource to prespill conditions? Will the resource remain impaired after the remedy is complete?
• Time—How long will it take to complete the remediation process? Can an alternative or supplemental technology shorten the time to completion?
• Cost—For some communities, the cost of the cleanup may be passed along to the taxpayer or the water customer. If the remedy represents a significant increase in certain fees or rates, cost will most certainly be an issue. If, on the other hand, the community is removed from this responsibility, it will not be as receptive to citing cost as an important consideration in the selection process.
• Implementation—Issues are usually of greatest concern to those in the immediate vicinity of the site who may be affected in some way during the construction phase or during the long-term operation of the system.
• Increased Health Risk—This may seem counterintuitive since the primary purpose of the remedy is to prevent health risk. However, many technologies which affect a mass transfer from groundwater to the vapor phase such as air stripping or air sparging may release MTBE or other VOCs into the ambient air. While the release may still be within standards or guidelines, it may also represent an increase beyond that which existed before remediation began.
• Property Values—How the remedial action will or will not effect localized property values. This may be merely a perception driven on behalf of public opinion but could result in real property value decreases. It does not mean that the appropriate remedial action should be avoided.
• Odor—Even if the discharge from an air stripping system or an air sparging/soil vapor extraction (SVE) system does not pose an increased health risk, it may still pose a nuisance problem. Emission stacks may actually direct vapors to the second story of an adjacent residence. Weather patterns, temperature inversions, etc. may exacerbate the problem. The sight of remediation equipment may also influence the perception of odor.
• Noise—Noise is always an issue when a residential area is close by. What may sound barely perceptible during the day may actually be an intolerable whine or hum during the stillness of a summer night.
• Visual—Although a 36-foot air stripping tower may be the best choice for removing MTBE at a particular site, the neighbor 30 feet away may find it less attractive. Towns and local building departments may also have height restrictions that apply. It may also “advertise” a problem, which area residents may want to downplay.
• Flooding/Lowered Water Table—Systems that recharge treated water may cause a localized rise in the water table, which may result in basement flooding, or other problems. Conversely, extracting and discharging groundwater to a positive drainage system may lower the water table over time. In certain conditions, this may cause concern of subsidence or running a neighboring (private) well dry.
In addition to the concerns regarding the effectiveness of the remedial action and the effect of the treatment system on the community discussed above, the public also may have concerns about treatment that are more general in nature and, consequently, more difficult to address. Some of the questions posed may include the following:
38

ITRC – Overview of Groundwater Remediation Technologies for MTBE and TBA February 2005
• Does the remediation provide total destruction of the contamination, or does it transfer the contamination from one phase to another?
• Will the remediation reduce the threat in “hot-spot” areas? • Will the remediation just dilute the contamination? • Will the remediation spread contamination to areas not previously affected? 4. TREATMENT METHODS
The section includes description, applicability, relative cost, and performance information for the following six technologies that are widely used for MTBE and TBA groundwater remediation: • groundwater pump and treat • air sparging • in situ bioremediation • in situ chemical oxidation • phytoremediation • monitored natural attenuation 4.1 Groundwater Extraction and Aboveground Treatment: Pump and Treat
4.1.1 Description
Conventional pump-and-treat (P&T) systems are based on the concept of extracting contaminated groundwater for treatment at the surface. The treated water may be replaced to the aquifer; discharged to a surface water body such as a stream; discharged to a sewer system; or in some cases, blended with water contributing to an industrial or public water supply. Existing and developing options for aboveground treatment of the extracted groundwater are described later in this section. The principal advantages of P&T with aboveground treatment over in situ treatment are hydraulic control, and the increased process control and confidence in treatment effectiveness because of the ability to directly monitor and modify treatment parameters. P&T systems can be designed for two possible objectives—restoration, containment, or a combination of both. • Restoration—to actively remove and treat the contaminant. Extraction rates are typically
aggressive, with the intention of significantly affecting hydraulic gradients, speeding the migration of contaminants towards the extraction system, and flushing clean water through the contaminated zone. P&T systems used for aquifer restoration are typically paired with a source-zone remedy.
• Containment—to prevent the contaminant from spreading and protect downgradient receptors. Extraction rates are typically the minimum sufficient to prevent further contaminant migration; to mitigate ecological and environmental impacts; and/or to be protective of human health. Because of the reduced pumping requirements, containment systems are generally less costly to operate than restoration systems.
39

ITRC – Overview of Groundwater Remediation Technologies for MTBE and TBA February 2005
For the purposes of the discussion below, the operation of restoration and containment systems is identical. Though groundwater extraction is typically an active process accomplished using wells designed specifically for the purpose, much of the following discussion is applicable to groundwater extraction or interception using trenches and other means of groundwater interception. While P&T primarily targets dissolved-phase contaminants, multiphase extraction (MPE)—the simultaneous recovery of groundwater, free product, soil vapor—can be achieved using multiple pump settings to target each contaminant phase or by applying a vacuum to a single pumping well to accomplish all objectives (USEPA 1999a). The mixed liquid/vapor stream is carried to the surface, where the phases are separated and treated using the appropriate aboveground treatment methodology. Application of vacuum to a well may mitigate impacts of free product smear where the water table is depressed. Successful applications suggest MPE may be particularly effective for remediation of lower-permeability materials (USEPA 1999a). Because MPE is primarily a source remediation technology and applications have focused on depths of less than 50 feet, MPE is not discussed further in this document. 4.1.2 Applicability
The efficacy of a P&T remedy for remediation of groundwater contaminated with MTBE and TBA is dependent primarily on hydrogeological and contaminant properties. As the complexity of the conditions and contaminants increases, the likelihood that a P&T system will meet stringent cleanup goals decreases. In addition, the efficacy of a P&T remedy is affected by the mass of contaminant released and the length of time the contaminant remained in the subsurface before P&T operations commenced. The length of time required for remediation increases with the amount of contaminant mass and the size of the source area. Assessment of a site for consideration of a P&T remedy requires information about the site-specific characteristics described below. Failure to account for these factors may lead to inappropriate system design, escalating remedial costs and even the erroneous selection of a P&T remedy where an alternative technology would be more appropriate. • Characteristics of the Subsurface—Since P&T systems depend on the rate of transmission of
groundwater through aquifer material, the ideal environment for P&T is homogeneous with a relatively high hydraulic conductivity. The principal characteristics of an aquifer affecting P&T efficacy include hydraulic conductivity (or transmissivity), anisotropy, lateral and vertical heterogeneity, and the type and nature of the fluid-filled porosity. Typically, high-permeability zones flush more quickly, and the time required to achieve cleanup standards is determined by the time required to flush lower-permeability zones (NRC 1994). Fractured-rock and karst aquifers present additional complexities, since regions within the fractured rock may store contaminants that the bulk of the groundwater does not reach. In addition, locating and installing effective extraction wells is more difficult than in distributed porous media settings.
• Characteristics of the Dissolved Contaminant(s)—The chemical characteristics described in earlier sections (i.e., relatively high solubility, low Henry’s law constant, and low sorption) make MTBE and TBA enter the mobile groundwater relatively readily and therefore be amenable to removal from the subsurface by groundwater extraction, compared to other fuel
40
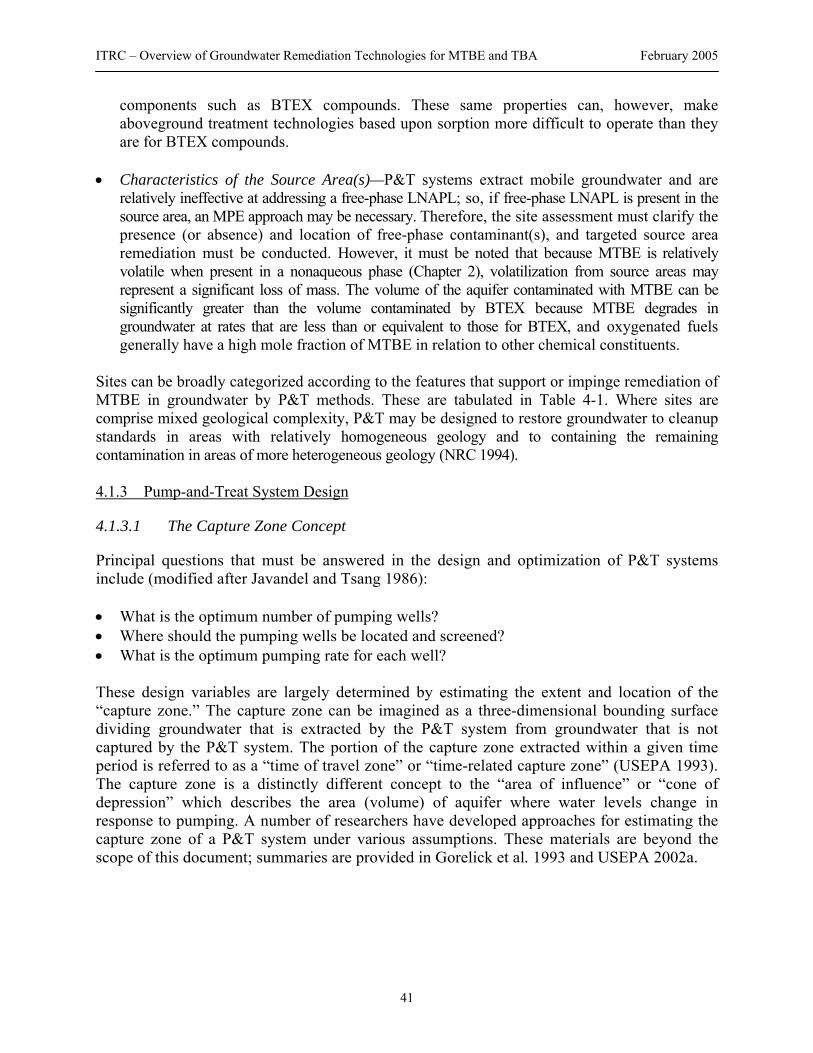
ITRC – Overview of Groundwater Remediation Technologies for MTBE and TBA February 2005
components such as BTEX compounds. These same properties can, however, make aboveground treatment technologies based upon sorption more difficult to operate than they are for BTEX compounds.
• Characteristics of the Source Area(s)—P&T systems extract mobile groundwater and are relatively ineffective at addressing a free-phase LNAPL; so, if free-phase LNAPL is present in the source area, an MPE approach may be necessary. Therefore, the site assessment must clarify the presence (or absence) and location of free-phase contaminant(s), and targeted source area remediation must be conducted. However, it must be noted that because MTBE is relatively volatile when present in a nonaqueous phase (Chapter 2), volatilization from source areas may represent a significant loss of mass. The volume of the aquifer contaminated with MTBE can be significantly greater than the volume contaminated by BTEX because MTBE degrades in groundwater at rates that are less than or equivalent to those for BTEX, and oxygenated fuels generally have a high mole fraction of MTBE in relation to other chemical constituents.
Sites can be broadly categorized according to the features that support or impinge remediation of MTBE in groundwater by P&T methods. These are tabulated in Table 4-1. Where sites are comprise mixed geological complexity, P&T may be designed to restore groundwater to cleanup standards in areas with relatively homogeneous geology and to containing the remaining contamination in areas of more heterogeneous geology (NRC 1994). 4.1.3 Pump-and-Treat System Design
4.1.3.1 The Capture Zone Concept
Principal questions that must be answered in the design and optimization of P&T systems include (modified after Javandel and Tsang 1986): • What is the optimum number of pumping wells? • Where should the pumping wells be located and screened? • What is the optimum pumping rate for each well? These design variables are largely determined by estimating the extent and location of the “capture zone.” The capture zone can be imagined as a three-dimensional bounding surface dividing groundwater that is extracted by the P&T system from groundwater that is not captured by the P&T system. The portion of the capture zone extracted within a given time period is referred to as a “time of travel zone” or “time-related capture zone” (USEPA 1993). The capture zone is a distinctly different concept to the “area of influence” or “cone of depression” which describes the area (volume) of aquifer where water levels change in response to pumping. A number of researchers have developed approaches for estimating the capture zone of a P&T system under various assumptions. These materials are beyond the scope of this document; summaries are provided in Gorelick et al. 1993 and USEPA 2002a.
41
ITRC – Overview of Groundwater Remediation Technologies for MTBE and TBA February 2005
Table 4-1. Typical features of a site that affect the selection of a P&T remedy Site type Contaminant
status Source area Hydrogeologic characteristics
Impacts on P&T cleanup times
Prospects for P&T remedy
Category 1
Fully dissolved
Remediated or isolated from dissolved plume
Uniform (homogeneous)
Optimal cleanup times potentially attainable
Well-designed systems should generally restore groundwater in a reasonable period of time
Category 2a
Fully dissolved
Remediated or isolated from dissolved plume
Nonuniform (heterogeneous)
Category 2b
Partially sorbed or residual free-phase exists
Remediated or isolated from dissolved plume
Uniform (homogeneous)
Determined by the time required to flush low-permeability zones and/or the rate of contaminant diffusion from low-permeability zones
Restoration possible, but less certain and likely to require significantly longer operation than Category 1 sites
Category 3a
Fully dissolved or partially sorbed or residual free-phase exists
Remediated or isolated from dissolved plume
Fractured rock or karst geology
Category 3b
Partially sorbed or residual free-phase exists
Remediated or isolated from dissolved plume
Nonuniform (heterogeneous)
Determined by the time required to flush low-permeability zones; rates of contaminant diffusion from low-permeability zones, or the time required to dissolve and extract free-phase contaminants
Restoration possible but uncertain: partial cleanup is more realistic unless residual phases can be removed or contained. P&T for containment may be the best option (LNAPL may be partially/entirely removed by MPE)
Category 4
Free-phase contaminants exist
Neither remediated nor isolated from dissolved plume
Fractured rock or karst geology or very heterogeneous geology
Determined by the time required to dissolve and extract free-phase contaminants
Restoration very unlikely; well-designed systems may contain the source area and/or mitigate off-site migration of contaminants
Source: Modified after NRC 1994. 4.1.3.2 Contaminant Mass Removal
The contaminant removal rate can be determined using the following equation (modified after USEPA 2002a):
⎟⎠⎞
⎜⎝⎛××××= 910
2.21440785.3CQM , (3)
where M = mass removal rate (pounds per day), Q = influent flow rate (gpm), C = influent concentration (μg/L).
42

ITRC – Overview of Groundwater Remediation Technologies for MTBE and TBA February 2005
4.1.3.3 Cleanup Times
The objective of a P&T remedy should be to return groundwater to a usable condition within a reasonable time frame. Therefore, estimated cleanup time is a large factor in determining whether a P&T remedy is feasible. Cleanup time varies widely, ranging from years to decades or more. Because cleanup times and remedial costs depend upon the pumping rate, estimates of cleanup time are explicitly or implicitly based upon the number of “pore volumes” that must be pumped—where one pore volume equals the amount of water stored in the contaminated portion of the aquifer. The number of pore volumes required for cleanup depends upon the cleanup goal(s), initial contaminant concentrations, and the site and contaminant characteristics described above. Significant mixing of clean and contaminated groundwater increases the total extracted volume. • Batch-Flush Models—Two common approaches for estimating groundwater cleanup times are
the “batch-flushing model” and the “continuous-flushing model,” which assume contaminant removal is by simple mass transfer from the aquifer materials to the clean water and extraction of the contaminated water. These consider only advective transport (i.e., no dispersion) with instantaneous equilibrium mixing and sorption (USEPA 1988) and typically underestimate cleanup times. The USEPA batch-flush model is an explicit finite-difference approximation of the solution to the governing differential equation, whose exact solution is given by (USEPA 1990)
⎟⎟⎠
⎞⎜⎜⎝
⎛−=
WO
WT
CC
RPV ln , (4)
where PV = number of pore volumes required to reach the cleanup concentration, Cwt = cleanup concentration in groundwater (mass/volume), R = retardation factor (dimensionless), Cwo = initial contaminant concentration in groundwater (mass/volume). Ideally, site-specific sorption effects are considered (Stephanatos et al. 1991), which may be estimated using site-specific leaching or partitioning tests (USEPA 1999b), USEPA’s Organic Leachate Model (USEPA 1985; Federal Register 1986), or USEPA’s Vadose Zone Leaching Model (USEPA 1996). Because of its relatively high solubility and low sorption, batch-flush models may be appropriate for estimating cleanup times at MTBE-contaminated sites within simple aquifer systems where the source area is remediated or isolated from the dissolved plume.
• Numerical Models—Detailed computer-based models include the major processes affecting
groundwater flow and contaminant transport (e.g., Harbaugh et al. 2000, Zheng and Wang 1999, NRC 1990, USEPA 1985). These models may incorporate aquifer heterogeneity, nonlinear sorption processes, or the existence of a NAPL source. They should be used where processes not considered by batch-flush models are determined to be significant. A great deal more data are required to characterize a site and construct a useful numerical model than are required for a batch-flush model.
43

ITRC – Overview of Groundwater Remediation Technologies for MTBE and TBA February 2005
4.1.4 Performance Evaluation
Operation of a P&T remedy should typically be considered a long-term project. System operation should be accompanied by continued site characterization and monitoring to determine the performance of the original design and to assess improvements in performance that might result from system modifications. Assessments of P&T system performance completed by numerous groups including USEPA, Oak Ridge National Laboratory, the American Petroleum Institute, Chevron, and the California Regional Water Quality Board (ADEQ 1999; API 1993; USEPA 1989a,b,c; Doty and Travis 1991) reported varying degrees of success or failure in reaching cleanup goals. Some of these failures may stem from poor site characterization, poor system design, or the establishment of unrealistic cleanup goals. In addition, these studies do indicate whether optimized designs and source area remediation may have significantly improved system performance. Collection of monitoring data should be targeted to assessing particular site- and system-specific performance objectives. Parameters to be monitored, and monitoring frequency are site specific; however, Table 4-2 shows typical requirements. Table 4-2. Selected parameters typically monitored for assessing P&T system performance
Cleanup goal or objective Monitoring data to guide performance assessment Elimination of contaminant migration beyond the extraction system
• Contaminant concentrations in groundwater at monitoring wells within and outside the contaminated zone
Establishment of hydraulic containment of dissolved contaminants (capture)
• Water levels or piezometric heads at wells within and outside the contaminated zone
• Extraction rates at each well and for the entire treatment system • Mass-balance assessment (flow balance)
Reduced size of the contaminated area
• Contaminant concentrations in groundwater at monitoring wells within and outside the contaminated zone
Decrease the contaminant concentration in the extracted groundwater
• Contaminant concentrations in the extracted groundwater • Contaminant concentrations in the treatment system effluent
Increase the cumulative mass of contaminants extracted
• Extraction rates at each well, and for the entire treatment system • Contaminant concentrations in the extracted groundwater • Contaminant concentrations in the treatment system effluent
Decrease the contaminant concentration remaining within the aquifer
• Contaminant concentrations in groundwater at monitoring wells within and outside the contaminated zone
• Rebound test(s) Compliance with discharge permits
• Flows and concentrations at discharge point(s) (water/air/solid)
Minimized operations and maintenance (O&M) costs
• General O&M parameters, including line pressures, water levels in injection wells, flow rates, that indicate proper operation or incipient failure of pumps and filters
• Contaminant concentrations in the treatment system effluent • Flow rates and contaminant concentrations at extraction wells
Source zone containment and/or restoration
• Source zone contamination—monitor the decrease or change in distribution of contaminant mass within source zones
44

ITRC – Overview of Groundwater Remediation Technologies for MTBE and TBA February 2005
If data suggest progress does not meet expectations, system design or operation modifications, or a review of the site characterization, may be necessary. Modifications may include installing additional wells, revising extraction rates, or modifying of the aboveground treatment system. Impacts of modifications should be predicted based on monitoring data and verified by subsequent monitoring. Where monitoring indicates concentrations or mass removal rates are tailing off, progress is still being made toward mass removal objectives, but progress toward reducing concentrations will be slow. Actions may be taken to enhance biological, chemical, and physical phenomena that cause MTBE to degrade or volatilize to speed the time to remediation. However, under these conditions the most reasonable remedial objective may be containment. 4.1.5 P&T System Optimization
System optimization can be designed to improve upon one or a number of aspects of the P&T system optimization:
• accelerating cleanup times, • reducing costs, and • reducing ecological and environmental impacts. Optimization programs have been applied to operational P&T systems with demonstrated success in terms of cost savings. The specifics of P&T system optimization are beyond the scope of this document; however, discussions with examples can be found in Gorelick et al. 1993, Zheng and Wang 2002, and USEPA 2002. P&T remedies may also be augmented using physical, chemical, or biological means to enhance degradation and volatilization processes, for example, when P&T is combined with SVE or bioventing.
Table 4-3. Interpretations and actions for selected monitoring data Time frame Monitoring program Interpretation Action Goal
Early time Monitoring indicates concentrations, mass removal, or water levels (drawdowns) differ from the assumptions used as the basis for design
Inadequate site characterization or poor problem understanding
Revisit conceptual basis for design, identify, collect and integrate necessary data to clarify misunderstandings and improve design
Optimize remedial system to achieve progress toward cleanup goals
Early-mid time
Monitoring suggests rapid cleanup of some portions of aquifer
Some wells may no longer effectively be removing mass
Modify pumping rates, or turn off ineffective extraction wells
Minimize costs while maintaining progress towards cleanup goals
Mid-late time Monitoring suggests cleanup goal(s) have been achieved
Remedial strategy has apparently been successful
Cease active remediation but retain monitoring program
Verification of successful cleanup
Long-term monitoring supports conclusion that cleanup goal(s) have been achieved
Remedial strategy has apparently been successful
Monitoring program may be halted, depending on liability and terms of exit agreement
Exit remedy program
Post system shutdown
Long-term monitoring indicates rebound of contaminant concentrations above action levels
Contaminants remain in the aquifer, possibly in sorbed/free phase (LNAPL)
Revisit conceptual site model; verify conclusion(s) with additional sampling; depending on terms of exit agreement, reenter remediation phase
Ascertain source of remaining contaminants, and design strategy for remediation
45

ITRC – Overview of Groundwater Remediation Technologies for MTBE and TBA February 2005
4.1.6 Aboveground Treatment Alternatives
Numerous options exist for removing MTBE, and to a lesser extent, TBA from the extracted groundwater, based on some combination of mass recovery, mass destruction, and mass transfer. This discussion focuses on treatment options for which demonstrated applications at the field scale are available. However, emerging technologies that have demonstrated applicability at the batch or pilot scale are also described. Identification of the most suitable technology for a site is contingent on the goals of the P&T system, the expected fluxes of extracted water and contaminants, the nature of the extracted water and contaminants, and options and constraints upon the discharge of the treated water. Additional criteria include (NRC 1994) • the ability to consistently meet relevant discharge criteria; • the simplicity of design, operation, and maintenance; • physical limitations such as constructability, access; • the compatibility with existing technologies; • the ability to deal with varying input rates and contaminant concentrations; • the impact of other constituents in water; and • the formation of by-products and the consequences of these by-products. The objective is to select the most cost-effective treatment option that meets the goals of the remedial system. The most cost-effective solution may be attained by combining technologies (NRC 1994). Note that some by-products of incomplete MTBE oxidation or destruction, such as TBA, TBF, acetone, formaldehyde, formate, acetate, and methanol, are also hazardous to human health, and may be more difficult to treat than MTBE (CMRP 2000). 4.1.6.1 Liquid-Phase Adsorption Processes
Liquid-phase adsorption processes are a relatively simple and established treatment technology for the removal of organic compounds, including MTBE, from groundwater. Contaminated groundwater is pumped through one or more vessels containing sorptive materials, and contaminants are physically adsorbed. Adsorption continues until all available adsorption sites are occupied, and the sorptive unit is “spent” or “saturated.” Typically, a mass transfer zone (MTZ) propagates downward from the entry point in the adsorber vessel, and breakthrough occurs when the leading edge of this MTZ reaches the bottom of the sorptive material bed (CMRP 2000). When the trailing edge of the MTZ reaches the bottom of the bed, the unit is considered saturated. Breakthrough patterns are chemical specific, so the design must be site and chemical specific (CMRP 2000). Depending on the application and sorptive material, the sorptive materials can be replaced, regenerated, or disposed in landfills. Sorptive processes are attractive because there is no off-gassing requiring further treatment, and typically, there are no by-products of incomplete chemical reactions. Two classes of sorptive material are available for the removal of MTBE—granular activated carbon (GAC) and synthetic resins (CMRP 2000). • Granular Activated Carbon—The principal sources of activated carbon are coal and coconut
shells. Manufacturers are able to customize GAC and absorber vessels to specific chemicals and expected fluxes (CMRP 2000). Activated carbon can be previously unused (virgin) or
46

ITRC – Overview of Groundwater Remediation Technologies for MTBE and TBA February 2005
regenerated from a previous application. Spent carbon is typically regenerated or disposed in landfills. GAC loading, or the weight percentage of contaminant adsorbed, varies with the chemical species and the influent contaminant concentration. Removal of MTBE generally requires substantially larger quantities of GAC than removal of a comparable amount of BTEX (ADEQ 1999, CMRP 2000). Modeling studies support field applications which indicate that GAC is most effective for treating groundwater with lower concentrations (e.g., 0.5 mg/L) of MTBE (CMRP 2000). GAC is generally not effective for treating groundwater contaminated with TBA.
• Resin Adsorption—Resin materials are synthetically manufactured adsorbants, typically shaped into small spherical beads. Possible advantages of resins over carbon include the ability to engineer systems meeting site- and contaminant-specific requirements; the possibility of steam and microwave regeneration, resulting in less effluent than aqueous methods; and potentially higher adsorption capacities for MTBE and TBA. These factors may identify resins as a preferred alternative for TBA-contaminated sites (CMRP 2000). Resin technology is still under development, is costly, and has not been demonstrated at full scale.
4.1.6.2 Air Stripping
Air stripping is a demonstrated technology for removing MTBE to meet drinking water standards. Contaminated water is brought into close contact with air such that dissolved contaminants transfer from the aqueous to the gaseous phase. The governing parameters in design of air stripping systems are water flow rates, the contaminants present, and contaminant concentrations. Efficiency is also dependent upon water temperature, the gas-to-liquid loading ratio (air/water ratio, or contact time,)—in turn a function of water droplet size, effective mixing, and the surface area available for mass transfer—and the Henry’s law constant of the compound being stripped (CMRP 2000). Because MTBE is relatively soluble in water and has a Henry’s law constant approximately 10% of that of benzene (see Chapter 2), air stripping of MTBE requires higher air/water ratios than for air-stripping BTEX (E&E 1999). Because the contaminant with the lowest Henry’s law constant typically dominates the design and cost of an air stripper system, MTBE may drive design costs in a system designed to remediate a fuel spill source (E&E 1999). Air stripping is generally not effective for treating groundwater contaminated with TBA. Aeration technologies differ principally in the method employed to maximize the air/water flow ratio or contact time by decreasing water droplet size and increasing mixing. Table 4-4 compares selected aeration technologies.
47

ITRC – Overview of Groundwater Remediation Technologies for MTBE and TBA February 2005
Table 4-4. Selected aeration technologies Technology Principal components Advantages and limitations*
Packed tower aeration
• Water gravity-fed through packing material • Air enters base of tower and flows
countercurrent to flow of water by forced- or induced-draft
• Distribution of water and air over column cross section achieved with vented orifice trays, influent troughs, or spray nozzles
Corrosion due to contact between acidic water and the aluminum/ steel tower Scaling due to high dissolved calcium carbonate/sulfate Iron fouling due to high dissolved iron Biological fouling (biofouling)
Low-profile aeration
• Water enters top of stripper via an inlet weir and baffled aeration tray
• Air passes through perforations in the tray bottom by forced- or induced-draft
• Contact time increased by number and size of trays, and liquid flow rate
MTBE removal efficiencies greater than 90% are expected to require the use of multiple stacked trays
Bubble diffusion
• Air is released through bubble diffusers at the bottom of a water-filled tank
• Contact time is increased using baffles and/or multiple chambers
MTBE removal efficiencies greater than 90% are expected to require the use of multiple units in series
Spray towers • Water passed through one or more nozzles and sprayed into a collection basin or tank
• There are three categories of spray towers—cocurrent; cyclone; and countercurrent
Countercurrent spray towers are the most common since they have demonstrated greater removal efficiencies
Aspiration, or centrifugal stripping
• Contaminated and/or recirculated water pumped through orifices into a cocurrent, tangential-flow aspirator
For high removal efficiencies, the treated water may be recirculated many times
*The limitations listed may occur depending upon groundwater chemistry. Source: Modified after CMRP 2000, E&E 1999.
4.1.6.3 Off-Gas Treatment Technologies
Numerous treatment technologies exist for extracting MTBE from the air stream. Some of these developed as counterparts to the closely related groundwater removal technologies. Table 4-5 compares some of these technologies. For thermal treatment technologies, the potential exists for the formation of undesirable by-products that may negatively influence acceptability.
Table 4-5. Selected technologies for treating contaminated air streams Technology Principal Components Advantages Limitations
Vapor-phase granular activated carbon
• Hydrocarbons are physically adsorbed to the surface of activated carbon particles
• Vapor-phase adsorption depends on pressure, temperature, and humidity
Operational considerations similar to liquid-phase GAC; adsorption rates theoretically higher than for liquid phase
Low affinity of GAC for MTBE; not applicable for TBA treatment
Catalytic oxidizer
• Contaminated air preheated and passed through bed composed of platinum-coated pellets or a platinum-coated monolith
• Oxidation occurs at temperatures ranging from 600–1,100°F
Typically for relatively low-flow gas streams with moderate contaminant concentrations; destruction efficiencies ranging 80%–99% reported
Limited operational range; sensitive to variable concentrations in influent stream
48

ITRC – Overview of Groundwater Remediation Technologies for MTBE and TBA February 2005
Technology Principal Components Advantages Limitations Open-flame thermal oxidizer (flares)
• Contaminated air exposed to oxygen-rich environment above the auto ignition point
• Supplemental fuel must be added due to the low fuel-value of MTBE
• Supplemental fuel costs can be prohibitive
Typically for relatively high contaminant concentrations, at greater than 100% of the lower explosive limit; destruction efficiencies in excess of 99% reported
Potential for odor; may need supplemental combustible fuels
Recuperative thermal oxidizer (oven)
• Oxidation is flameless and contained in an insulated chamber or oven
• Heat exchanger used to reduce heat losses
Typically for moderate contaminant concentrations: destruction efficiencies in excess of 99% reported
Potential for odor; may need supplemental combustible fuels
Regenerative thermal oxidizer
• Contaminated air passed through heated ceramic bed where oxidation occurs
• Flow-reversal used to reduce heat losses
May have lower operational costs than other oxidative methods
Potential for odor; may need supplemental combustible fuels
Biological oxidation
• Oxidation of contaminants mediated by microbes without thermal processes
• Biofilm or inert substrate (e.g., GAC) typically used
Low operating costs possible
Performance variable, especially during acclimation period; potential for odor; sensitive to variable concentrations in influent stream; must maintain moisture content
Source: Modified after CMRP 2000; E&E 1999. 4.1.6.4 Advanced Oxidation Processes
Advanced oxidation processes (AOPs) involve the generation of hydroxyl radicals to mineralize organic contaminants such as MTBE. MTBE dissolved in groundwater is degraded through the oxidative action of the hydroxyl radical (·OH). In existing technologies, the formation of the necessary ·OH is typically accomplished by the reaction of either ultraviolet (UV) light irradiation or ozone (O3) with liquid hydrogen peroxide (H2O2)(CMRP 2000, E&E 1999). Emerging technologies form ·OH using high-energy electron beam irradiation, ultrasonic and hydrodynamic cavitation, or titanium dioxide (TiO2) catalysis (CMRP 2000). Ideally, sufficient ·OH radical is formed to react completely with the dissolved MTBE and all its by-products until total mineralization is achieved. By-products of incomplete oxidation can be formed where ·OH generation is insufficient. This is a critical issue which must be considered and addressed in the performance monitoring program. Competing constituents in the water such as nontarget organics, carbonates, and ferrous iron can create a demand for the ·OH radicals, resulting in inefficient MTBE removal (CMRP 2000). Additionally, hydroxyl radicals tend to react preferably with aromatic compounds such as BTEX, which reduces the capacity of the ·OH to degrade the MTBE (CMRP 2000). The most common advanced oxidation processes, UV/H2O2 and O3/H2O2, are described in more detail below. Both processes require on-site storage and management of H2O2, a hazardous chemical (E&E 1999). Ozone-based processes also require on-site production and management of O3, a hazardous gas (E&E 1999). While laboratory and pilot-scale studies have investigated the performance of AOPs for degrading organic compounds, there are limited full-scale applications.
49

ITRC – Overview of Groundwater Remediation Technologies for MTBE and TBA February 2005
• UV/H2O2 Oxidation Process—The hydroxyl radical is formed by adding H2O2 to the influent
of a UV radiation contactor. Retention times for MTBE are longer than required for common organics such as VOCs, hence the contactor size required may be larger (CMRP 2000, E&E 1999). Primary design variables are the UV power radiated per unit volume of water treated (UV dose) and the concentration of H2O2. Calculations indicate that MTBE oxidation with UV/H2O2 requires a mass ratio of H2O2 to MTBE of 5.7:1. Lower ratios may achieve MTBE oxidation due to regeneration of H2O2 during the oxidation process (CMRP 2000, E&E 1999). High dissolved iron concentrations have been demonstrated to absorb UV, affecting ·OH radical formation (E&E 1999).
• O3/H2O2 Process—The hydroxyl radical is formed by the reaction of O3 with H2O2. For
optimum production of the ·OH radical, an O3/H2O2 ratio of 3:1 is required. Given the required ratio of H2O2 to MTBE of 3:1, the ratio of O3/H2O2/MTBE is approximately 9:3:1. That is, an ozone dose of 9 mg/L and a peroxide dose of 3 mg/L may be required to oxidize 1 mg/L of MTBE (CMRP 2000, E&E 1999).
4.1.6.5 Biological Treatment—Ex Situ Biodegradation
Ex situ biodegradation is based on developing a favorable environment to grow microorganisms that consume contaminants (FRTR 2002). An established technology for remediating BTEX compounds, biodegradation of MTBE is a developing technology with a limited number of full-scale applications. Despite early studies suggesting that MTBE is biologically recalcitrant, recent studies demonstrate MTBE degradation by bacterial and fungal cultures under aerobic (Deeb et al. 2000, Stocking et al. 2000) and anaerobic (Finneran and Lovley 2001, Wilson et al. 2000) conditions. Studies ranging from laboratory-scale inoculation to full-scale engineered systems, termed “bioreactors,” document both partial degradation of MTBE to metabolic intermediates and complete mineralization to carbon dioxide. TBA, a by-product of MTBE degradation, has also been the subject of biodegradation studies. In pure culture studies MTBE and TBA biodegradation rates are within the same order of magnitude (Deeb et al. 2000). MTBE biodegradation can occur either as a primary source of carbon and energy (“direct metabolism”) or following growth on another substrate (“cometabolism”). For MTBE and TBA degradation pathways, please refer to Section 2.2.3. • Direct metabolism—Pure and mixed microbial cultures from a number of sources have been
shown to directly metabolize MTBE and TBA under laboratory conditions. Cultures are typically enriched from natural sources or industrial sources such as activated or refinery sludges (Salanitro et al. 1994). MTBE removal rates typically decline with increasing MTBE concentration (e.g., >5 mg/L), and mineralization rates decrease at MTBE concentrations >20 mg/L (Deeb et al. 2000). TBA is often formed as an intermediate product during the degradation of MTBE. In some cases, TBA degradation occurs after MTBE has been completely utilized (Salanitro and Wisniewski 1996), while in other cases TBA is formed but does not accumulate during the biodegradation of MTBE (Deeb et al. 2001). However, mixed culture studies have been shown to degrade concentrations of MTBE and TBA of up to 550 and 800 mg/L, respectively, with no accumulation of TBA (Fortin et al. 2001; Deeb, Scow, and Alvarez-Cohen 2000). Pure culture studies have also demonstrated rapid and direct
50
ITRC – Overview of Groundwater Remediation Technologies for MTBE and TBA February 2005
MTBE degradation at concentrations up to 500 mg/L and to be capable of growth on TBA as sole carbon and energy source (Church, Tratnyek, and Scow 2000; Deeb, Scow, and Alvarez-Cohen 2000; Deeb et al. 2001).
• Cometabolism—Studies report the ability of pure and mixed cultures to degrade MTBE or TBA to carbon dioxide cometabolically following growth on either alkanes or aromatics (Garnier et al. 1999, Hardison et al. 1997, Hyman and O’Reilly 1999, Steffan et al. 1997, and others). In at least one instance, TBF has been identified as the first metabolic intermediate of MTBE degradation, subsequently converted to TBA. Subsequent TBA degradation has been documented, but degradation rates are slow and TBA degradation typically does not occur until MTBE is completely removed. Of interest to fuel spill sites, recent studies demonstrated significant impacts of the growth substrate for cultures derived from gasoline-contaminated soils (Garnier et al. 1999). For example, one study concluded that a culture that was enriched on benzene demonstrated MTBE degradation, but MTBE biodegradation was severely inhibited in the presence of benzene at concentrations as low as 0.15 mg/L due to competitive inhibition (Koenigsberg et al. 1999).
An engineered bioreactor is one that is designed to maximize the quantity of biomass retained in the treatment system (AEHS 2001). Bioreactors provide a physical and chemical substrate (e.g., a GAC vessel) that is “seeded” with a culture that grows and metabolizes the MTBE. One advantage of employing an active support such as GAC is that contaminants are absorbed and then slowly released to the microorganisms for degradation (FRTR 2002). Contaminated water is typically passed through primary clarification/filtration processes prior to entering the bioreactor. Bioreactors employed for degradation of MTBE are typically aerobic systems. Bioreactors can be open systems, such as constructed wetlands (Section 4.5), or enclosed systems. This section describes only enclosed, aerobic systems. Biodegradation of MTBE has been demonstrated using both suspended growth and attached growth bioreactors (FRTR 2002, Deeb et al. 2001): • Suspended Growth Bioreactors, including plug flow (PF), completely mixed or continuously
stirred tank reactor (CSTR), batch and sequencing batch, activated sludge, and membrane bioreactors—Cells are suspended within the reactor unit. Typically, contaminated water is circulated within an aeration basin or passed through an aerated column or pipe.
• Attached Growth Bioreactors (“fixed-film” or “immobilized cell” reactors), including fluidized-bed, fixed/packed bed, trickling filter bioreactors, and rotating biological contactors—Cells are established on an inert substrate. Attached growth reactors may retain slow-growing bacteria that may wash out from suspended growth reactors.
Studies indicate that the efficiency of MTBE treatment using bioreactors is dependent on effective biomass retention, which is in turn affected by the following: • temperature—as temperature decreases, effectiveness decreases; • dissolved oxygen—as DO decreases, effectiveness decreases; • MTBE concentration—as concentration increases, effectiveness decreases; • influent rate—as flux increases, effectiveness decreases; • residence time—as residence time decreases, effectiveness decreases;
51

ITRC – Overview of Groundwater Remediation Technologies for MTBE and TBA February 2005
• pH—effectiveness maximal for 6.5 < pH < 7.8); and • presence of other carbon sources—for direct cometabolism, as other carbon sources increase,
effectiveness decreases. For cometabolism, the nature of the carbon source may determine the impact on treatment efficiency.
It should be noted that it is probable that some degree of biodegradation takes place both in situ and within many ex situ treatment systems, such as standard GAC adsorbers and air strippers, and may contribute to the effectiveness of these processes. 4.1.7 Discharge of Treated Effluent
Reintroduction of treated water to the aquifer may be achieved via wells, trenches, galleries, and spreading fields. When appropriately designed, reinjection may improve the system’s efficiency and reduce cleanup times by increasing hydraulic gradients towards the extraction system and may provide additional protection of downgradient receptors by providing a hydraulic barrier to further contaminant migration. Other state and local restrictions or requirements may apply to reinjection of treated effluent. Discharge of extracted water to groundwater, sewer system, or a surface water body is acceptable where the contaminant concentration in the treated effluent is low enough that required discharge-permitted contaminant concentrations will not be exceeded. 4.1.8 Advantages and Limitations
The technologies employed in the P&T process are widely available and fairly well understood, and there is a wealth of literature describing P&T applications in practically all environmental settings. These studies indicate that P&T systems can reduce the risks of exposure to groundwater contamination by removing contaminant mass and by containing the plume to protect water supplies. However, because of the complexity of the contaminated subsurface, the performance of a P&T system will always be uncertain until the system is tested by beginning the cleanup process. Subsequent monitoring provides the information necessary to optimize the system’s performance and ultimately determine whether it will be able to reach cleanup goals. At sites with simple geology and dissolved contaminants, P&T systems may clean up groundwater to health-based standards. At many sites where P&T systems have attained cleanup goals, the COCs are readily biodegradable, and it is certain that the success of P&T systems at these sites may in part be due to biodegradation processes. P&T systems can restore aquifers only where source areas or NAPL are contained or removed and where suitable geologic conditions prevail. The presence of geologic heterogeneities, NAPL, and contaminant sources above the water table may make cleanup unfeasible. At sites where complete aquifer restoration is impossible or impractical, P&T systems are most suited to preventing contamination from spreading, by establishing a hydraulic barrier around the site, and cleaning up or shrinking the dissolved portion of the plume by pumping out contaminated water, which is then replaced at the outer edges of the plume with clean water. These accomplishments reduce the risk posed by the contamination by minimizing the area affected by the contamination. 4.1.9 Cost
Treatment costs depend on the characteristics of the site and contaminants. These include the location and size of the contaminant plume, predicted influent concentrations of MTBE and the
52
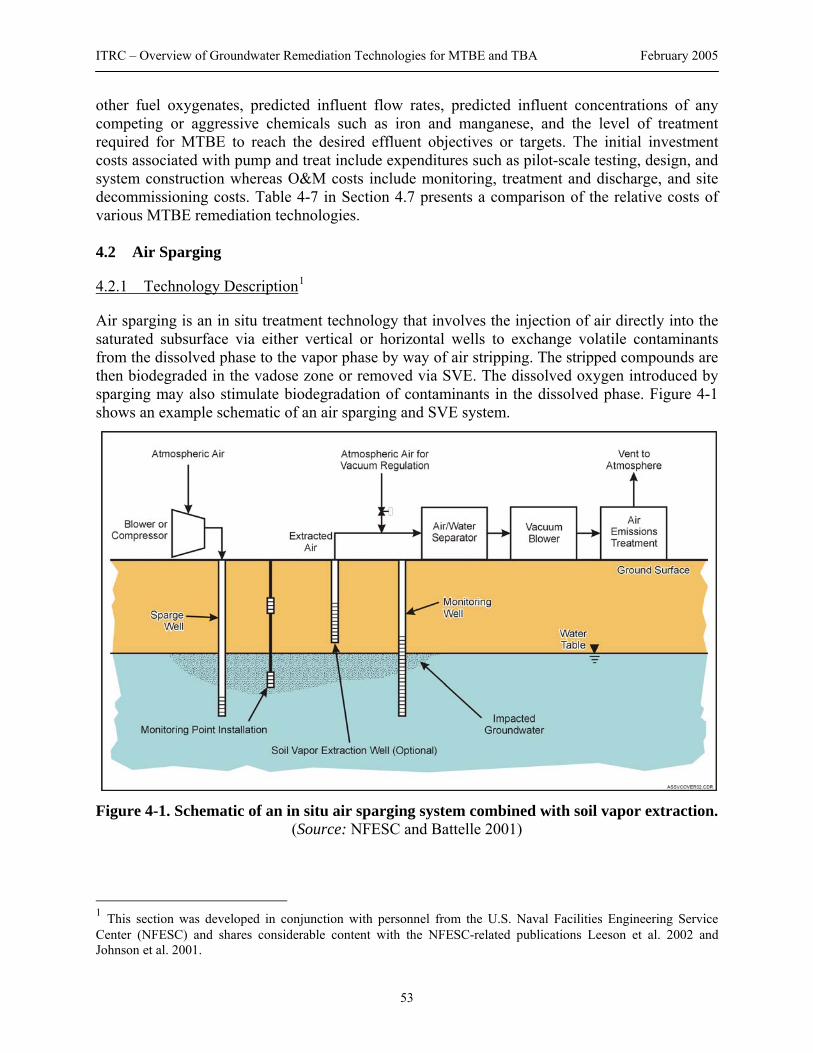
ITRC – Overview of Groundwater Remediation Technologies for MTBE and TBA February 2005
other fuel oxygenates, predicted influent flow rates, predicted influent concentrations of any competing or aggressive chemicals such as iron and manganese, and the level of treatment required for MTBE to reach the desired effluent objectives or targets. The initial investment costs associated with pump and treat include expenditures such as pilot-scale testing, design, and system construction whereas O&M costs include monitoring, treatment and discharge, and site decommissioning costs. Table 4-7 in Section 4.7 presents a comparison of the relative costs of various MTBE remediation technologies. 4.2 Air Sparging
4.2.1 Technology Description1
Air sparging is an in situ treatment technology that involves the injection of air directly into the saturated subsurface via either vertical or horizontal wells to exchange volatile contaminants from the dissolved phase to the vapor phase by way of air stripping. The stripped compounds are then biodegraded in the vadose zone or removed via SVE. The dissolved oxygen introduced by sparging may also stimulate biodegradation of contaminants in the dissolved phase. Figure 4-1
Figure 4-1. Schematic of an in situ air sparging system combin
shows an example schematic of an air sparging and SVE system.
ed with soil vapor extraction.
(Source: NFESC and Battelle 2001)
1 This section was developed in conjunction with personnel from the U.S. Naval Facilities Engineering Service Center (NFESC) and shares considerable content with the NFESC-related publications Leeson et al. 2002 and Johnson et al. 2001.
53
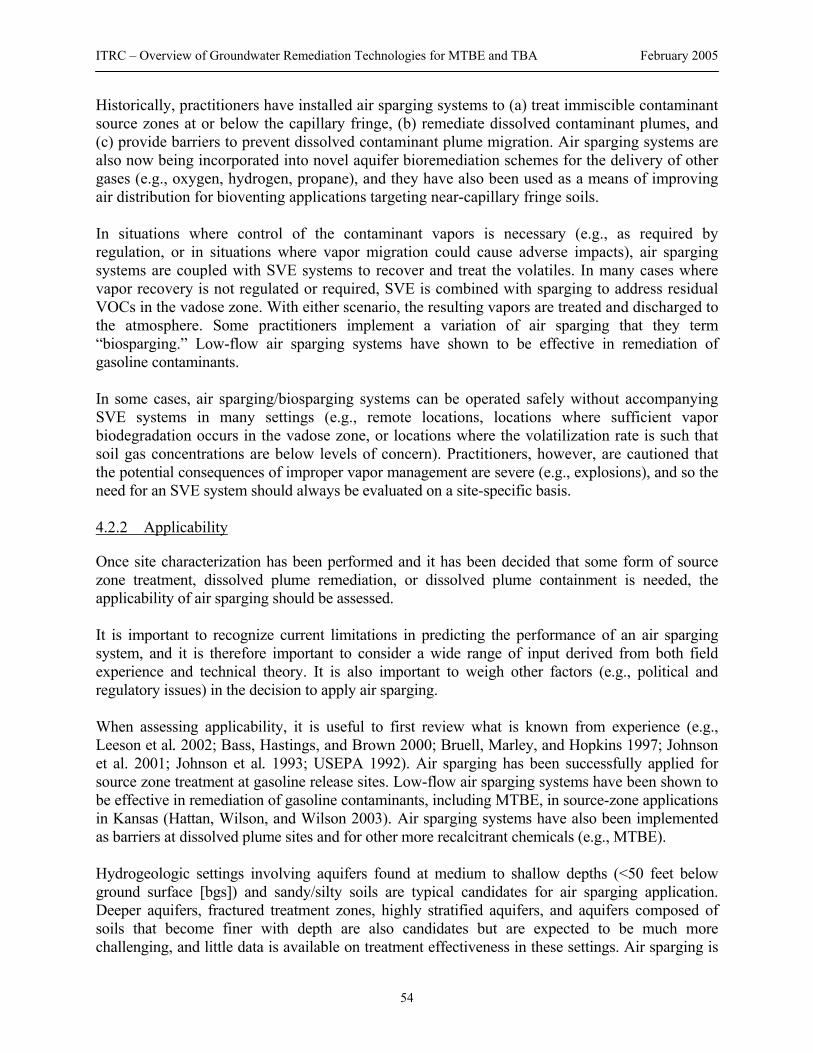
ITRC – Overview of Groundwater Remediation Technologies for MTBE and TBA February 2005
Historically, practitioners have installed air sparging systems to (a) treat immiscible contaminant source zones at or below the capillary fringe, (b) remediate dissolved contaminant plumes, and (c) provide barriers to prevent dissolved contaminant plume migration. Air sparging systems are also now being incorporated into novel aquifer bioremediation schemes for the delivery of other gases (e.g., oxygen, hydrogen, propane), and they have also been used as a means of improving air distribution for bioventing applications targeting near-capillary fringe soils. In situations where control of the contaminant vapors is necessary (e.g., as required by regulation, or in situations where vapor migration could cause adverse impacts), air sparging systems are coupled with SVE systems to recover and treat the volatiles. In many cases where vapor recovery is not regulated or required, SVE is combined with sparging to address residual VOCs in the vadose zone. With either scenario, the resulting vapors are treated and discharged to the atmosphere. Some practitioners implement a variation of air sparging that they term “biosparging.” Low-flow air sparging systems have shown to be effective in remediation of gasoline contaminants. In some cases, air sparging/biosparging systems can be operated safely without accompanying SVE systems in many settings (e.g., remote locations, locations where sufficient vapor biodegradation occurs in the vadose zone, or locations where the volatilization rate is such that soil gas concentrations are below levels of concern). Practitioners, however, are cautioned that the potential consequences of improper vapor management are severe (e.g., explosions), and so the need for an SVE system should always be evaluated on a site-specific basis. 4.2.2 Applicability
Once site characterization has been performed and it has been decided that some form of source zone treatment, dissolved plume remediation, or dissolved plume containment is needed, the applicability of air sparging should be assessed. It is important to recognize current limitations in predicting the performance of an air sparging system, and it is therefore important to consider a wide range of input derived from both field experience and technical theory. It is also important to weigh other factors (e.g., political and regulatory issues) in the decision to apply air sparging. When assessing applicability, it is useful to first review what is known from experience (e.g., Leeson et al. 2002; Bass, Hastings, and Brown 2000; Bruell, Marley, and Hopkins 1997; Johnson et al. 2001; Johnson et al. 1993; USEPA 1992). Air sparging has been successfully applied for source zone treatment at gasoline release sites. Low-flow air sparging systems have been shown to be effective in remediation of gasoline contaminants, including MTBE, in source-zone applications in Kansas (Hattan, Wilson, and Wilson 2003). Air sparging systems have also been implemented as barriers at dissolved plume sites and for other more recalcitrant chemicals (e.g., MTBE). Hydrogeologic settings involving aquifers found at medium to shallow depths (<50 feet below ground surface [bgs]) and sandy/silty soils are typical candidates for air sparging application. Deeper aquifers, fractured treatment zones, highly stratified aquifers, and aquifers composed of soils that become finer with depth are also candidates but are expected to be much more challenging, and little data is available on treatment effectiveness in these settings. Air sparging is
54
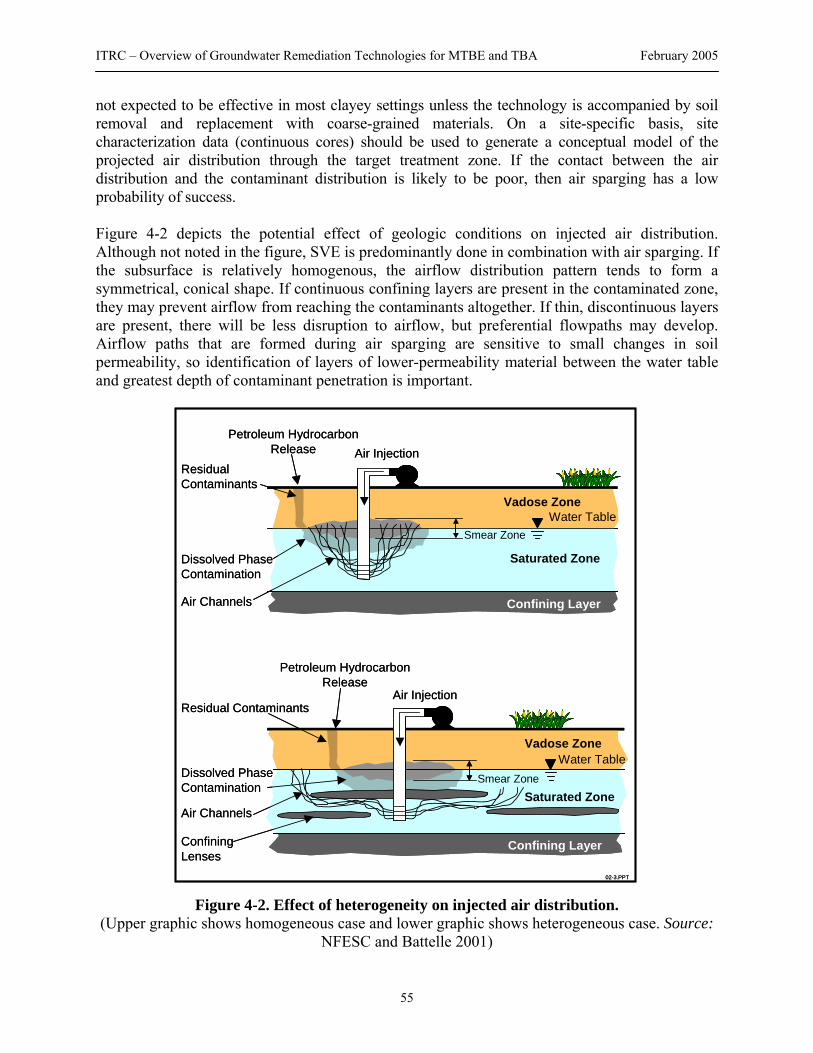
ITRC – Overview of Groundwater Remediation Technologies for MTBE and TBA February 2005
not expected to be effective in most clayey settings unless the technology is accompanied by soil removal and replacement with coarse-grained materials. On a site-specific basis, site characterization data (continuous cores) should be used to generate a conceptual model of the projected air distribution through the target treatment zone. If the contact between the air distribution and the contaminant distribution is likely to be poor, then air sparging has a low probability of success. Figure 4-2 depicts the potential effect of geologic conditions on injected air distribution. Although not noted in the figure, SVE is predominantly done in combination with air sparging. If the subsurface is relatively homogenous, the airflow distribution pattern tends to form a symmetrical, conical shape. If continuous confining layers are present in the contaminated zone, they may prevent airflow from reaching the contaminants altogether. If thin, discontinuous layers are present, there will be less disruption to airflow, but preferential flowpaths may develop. Airflow paths that are formed during air sparging are sensitive to small changes in soil permeability, so identification of layers of lower-permeability material between the water table and greatest depth of contaminant penetration is important.
02-3.PPT
Vadose Zone
Saturated Zone
Air Injection
Water Table
Confining Layer
Dissolved Phase Contamination
ConfiningLenses
Vadose Zone
Saturated Zone
Petroleum HydrocarbonRelease Air Injection
Water Table
Confining Layer
ResidualContaminants
Dissolved Phase Contamination
Petroleum HydrocarbonRelease
Residual Contaminants
Air Channels
Air Channels
Smear Zone
Smear Zone
Figure 4-2. Effect of heterogeneity on injected air distribution. (Upper graphic shows homogeneous case and lower graphic shows heterogeneous case. Source:
NFESC and Battelle 2001)
55

ITRC – Overview of Groundwater Remediation Technologies for MTBE and TBA February 2005
Although stratification and heterogeneity may reduce effectiveness, their presence does not directly lead to the conclusion that air sparging is not the best remedial approach. In general, sites having high clay or silt content in soils with hydraulic conductivities <1 × 10⁻³ cm/s are not typical candidates for this technology. However, a recent pilot test has demonstrated successful contaminant removal using pulsed air sparging in a low-permeability, highly stratified formation with hydraulic conductivities on the order of 6 × 10⁻⁷ to 3 × 10⁻⁴ cm/s (Kirtland and Aelion 2000). In these suboptimal cases, pilot testing may still be warranted. Figure 4-3 is a flowchart that can serve as an initial screening methodology for determining whether air sparging is appropriate for a given site (NFESC and Battelle 2001).
Figure 4-3. Air sparging applicability analysis. (Source: NFESC and Battelle 2001)
If experience suggests that the application of air sparging could be successful, then users should determine whether the cost of injection well installation is likely to be prohibitive, and if so, what injection well spacing is economically feasible. The results of this analysis are not only used for feasibility assessment, but are also critical to the pilot test design. The standard design approach path of the air sparging design paradigm calls for injection wells placed on 15- to 20-foot spacings
56

ITRC – Overview of Groundwater Remediation Technologies for MTBE and TBA February 2005
and, based on that, users should perform an initial cost analysis to determine whether the cost of that well spacing is cost-prohibitive (Johnson et al. 2001, Leeson et al. 2002). The 15- to 20-foot spacing recommendation stems from an understanding of air distributions in near-homogeneous and highly permeable settings; these are likely to yield the most spatially limited air distributions (generally, the lateral extent is not much more than 10 feet in any direction away from the injection well). If initial analyses indicate that air sparging may be a cost-effective treatment method, then site-specific pilot testing should be conducted to determine an appropriate well spacing in most situations. While the ability to confidently predict performance is limited at this time, it is possible to place some bounds on reasonable performance expectations. First, empirical summaries (e.g., Bass, Hastings, and Brown 2000; Bruell, Marley, and Hopkins 1997) and experience suggest that many of the air sparging systems installed for source zone treatment at service station–scale sites are operated for periods of less than three years; however, it is not clear what criteria are being used to decide termination, and it may very well be a combination of asymptotic performance and regulatory closure criteria. Clearly, air sparging barrier control systems may be operated for longer (or shorter) time periods, dictated not by air sparging performance but by the length of time the migration barrier is needed. Next, theory suggests that contaminant removal during air sparging occurs through a combination of volatilization and biodegradation. Thus, air sparging can be considered for any volatile and/or aerobically biodegradable chemical, including MTBE. Bruce et al. (1998) showed in a physical model that air sparging could remove a major fraction (85%) of residual phase MTBE from aquifer material. Which mechanism accounts for the greater amount of contaminant removal depends on the chemical properties, contaminant distribution, duration of air injection, and soil properties. Generally, volatilization dominates when systems are first turned on, and, for aerobically degradable compounds, biodegradation can dominate in later phases of treatment. Theoretical assumptions in air sparging include (a) that air flows through discrete air channels in most settings (within both the vadose and the saturated zones), (b) that removal of contaminants from within the air channels behaves much like contaminant removal during SVE (Johnson et al. 1990) and bioventing (Leeson and Hinchee 1996), and (c) that contaminant removal from water-saturated regions lying outside the air channels is limited by liquid-phase mass-transfer processes. Thus, contaminant removal is most rapid from within the air channels and slowest from outside the air channels. Furthermore, air channels occupy at most 20%–50% of the pore space, so typically most of the contaminant mass lies outside of the air channels. Compounds characterized by a high Henry’s law constant generally exhibit good strippability. The Henry’s law constant can be approximated by the ratio of a compound’s vapor pressure to its aqueous solubility. MTBE has a high vapor pressure of 245–256 mm Hg but a relatively high solubility of 43,000 mg/L. The Henry’s law constant of 1.8 × 10⁻² is significantly less than other gasoline constituents but still high enough to be considered a candidate for successful air sparging treatment. In general, compounds like MTBE with relatively low Henry’s law constants are more costly to treat with air sparging because a greater flow rate of injected air and/or extended treatment duration are likely to be required to achieve remedial objectives. In aquifers with high groundwater velocities, cost and difficulty of treatment may increase when treating
57

ITRC – Overview of Groundwater Remediation Technologies for MTBE and TBA February 2005
MTBE contamination, since degradation of MTBE may require longer residence times than other fuel constituents such as BTEX. At sites with LNAPL present, the majority of the contaminant mass is often contained in the smear zone, which is a band of residual product just above and below seasonal water table levels. If a smear zone is present, air sparging may be an effective approach because air moves vertically upward through this region. However, SVE alone may not be able to fully address the residual LNAPL source in the smear zone, especially in cases where a fluctuating water table causes submergence of this zone. The submergence may be seasonal in nature, or it may be an artifact of lens formation. 4.2.3 System Operation
Air sparging systems can be operated in either a continuous or pulsed mode, but cycling air injection in each well intermittently is thought to achieve more extensive air distribution. Cyclical or pulsed operation of banks of two to five injection wells is recommended for the following reasons: • Studies suggest that mass removal can be increased by 20%–30% through pulsed
operation (Johnson et al. 2001, Kirtland and Aelion 2000). • The difficulty of controlling a multiwell air injection system increases as the number of
wells manifolded together increases. This difficulty can be managed with proper engineering design.
• The total required system injection flow capacity is lower in pulsed mode, resulting in lower costs for air compressors.
• Pulsed operation may be necessary in sparge barrier applications to prevent groundwater bypassing due to water permeability reductions in the formation caused by air injection.
The most effective cycling frequency is site-specific and depends on the characteristics of site soils and the distribution of the dissolved contaminants. To date, there is little guidance on how to choose pulsing frequencies (defined by on and off times). SVE system data provide a direct measure of volatilization removal rates and therefore can be used to assess how changes in pulsing conditions affect volatilization rates. Some practitioners believe that the minimum injection period (the on times) for air sparging should be consistent with transient pressure transducer response data identified during pilot testing. Air injection needs to last at least as long as the time necessary to reach the peak in pressure transducer response, and preferably as long as the time required for pressures to return to near equilibrium or asymptotic values. This condition indicates that the injected air has emerged from the aquifer into the vadose zone and that near steady-state flow conditions have been achieved (Johnson et al. 2001). 4.2.4 System Optimization
The objective of system optimization is to achieve remedial goals with a minimum investment of time and money. Understanding the likely or typical behavior of these systems can provide opportunities to reduce costs in the initial design phase and throughout the life of the project. The practitioner should review current monitoring data and look for opportunities to improve removal
58

ITRC – Overview of Groundwater Remediation Technologies for MTBE and TBA February 2005
efficiency such as optimizing airflow rates and sparge well placement. Figure 4-4 is a flowchart showing a remedial action optimization process for air sparging.
REMEDIAL ACTION OPTIMIZATION (RAO)PROCESS FOR AIR SPARGING SYSTEMS System Optimization
• Review Regulatory History/Cleanup Goals• Review Current and Future Land Use Plans• Determine Process for Revising Cleanup Goals
• Review Feasibility Studies/Remedial Designs• Review Available Performance Data• Compare Actual vs. Predicted Performance• Estimate Time Frame to Achieve Existing Cleanup Goals
• Evaluate Potential for System Optimization• Evaluate Potential for Integrating Monitored Natural Attenuation into Remediation Strategy• Evaluate New/Proven Alternate Technologies• Develop Optimized Long-Term Monitoring Strategy• Compare Optimization of Existing System to New Technology Replacement Options and Select Most Effective System/Cost vs. Benefit Analysis• Reevaluate Time to Achieve Original or Revised Cleanup Goals
Evaluate Source Isolation/PlumeContainment Regulatory Options
Including Technical Impracticability
CanExisting
Remedial SystemAchieve Cleanup
Goals Within2 Years at a
Cost of <$100K/year
?
Can(Optimized or
New) RemedialSystem AchieveCleanup Goals
Within Reasonable Time Frame
?
AlternateIsolation/
ContainmentGoals
Accepted?
Continue Operations and Phase I Optimization
Implement (Optimized orNew) Remediation System
• Establish Performance Objectives and Performance Indicators• Continue to Perform Periodic System Monitoring• Develop Statistical Evidence for Site Closure
Continue Annual Evaluations orProceed to Site Closure
If Appropriate, ProposeRevised Goals
• Evaluate Whether Engineering/Institutional Controls Can Protect Receptors• Develop and Propose Risk-Based Cleanup Goals and Enforceable Land Use Controls
• Implement Source Isolation/Plume Containment System(s)
• Continue to Evaluate Regulatory Framework While Optimizing Existing System
• Continue to Evaluate Emerging Technologies
Evaluation of Cleanup Goals
Appeal Regulatory Decision
Modified from AFCEE, 1999
No
No
No
Yes
Yes
Yes
No
PTF
LOW
01.C
DR
Figure 4-4. Remedial optimization for air sparging systems. (Source: NFESC and Battelle 2001)
The experience of the environmental remediation industry, case histories of previously installed and operated air sparging systems, and knowledge of pertinent mass transfer mechanisms all can be incorporated into the design, installation, operation, optimization, management, and exit strategies for an air sparging project. It is expected that after a variable plateau period of maximum mass removal rates (possibly ranging from nonexistent to several weeks), the mass removal rate will rapidly decline over time as mass reaching the air/water interface comes from sites farther away from the injection wells and air channels. Literature has shown that significant mass removal for BTEX compounds (96%–98%) can be achieved in less than six months (Bass, Hastings, and Brown 2000). The following issues should be addressed during the design or optimization phase to ease transition of the system to final shutdown: • Focus strategic sparging well placement on localized areas with elevated contaminant
concentrations or along the plume core. This approach can greatly reduce the cost of installation (compared to complete plume coverage) without substantially increasing
59

ITRC – Overview of Groundwater Remediation Technologies for MTBE and TBA February 2005
operating time. When coupled with an SVE system that focuses on source remediation, the system can give the greatest mass removal for the least capital expenditure.
• Reduce the design capacity of air supply, vapor extraction, and vapor treatment units.
This approach will reduce the maximum mass removal capacity of the system but will result in a system that operates near its optimum design capacity (60 –80% of maximum capacity) for a longer duration. (Note that the trade-off of lower capital equipment expenses could extend the time required to achieve active remediation goals and should be evaluated accordingly. Reducing maximum removal capacity does not necessarily extend the required time of remediation, but it may.)
• Consider constructing air supply, vapor extraction, and vapor treatment units on mobile
trailers. This approach has been used at many installations to reduce the fixed costs of equipment and enable the equipment to be reused at other sites. Furthermore, the air supply and extraction equipment can be employed for multiple uses (beyond air sparging and soil vapor extraction). Typically these equipment items can be considered to have service lives of approximately five years, depending on their size, quality, and rate of use. Some sites initially may have extremely high removal rates followed by a huge drop. At sites such as these, additional cost and time savings may be realized by switching from a Thermox-equipped treatment trailer to a one equipped with a less expensive to operate carbon-equipped unit.
4.2.5 Evaluation of Cleanup Goals and Performance Objectives
Performance objectives should be evaluated periodically to review the regulatory history, review the current and future land-use plans, and evaluate the need to revise goals. Airflow and sparge well placement should be optimized. The objective of optimizing airflow is to maximize mass removal in a cost-effective manner. Typically, mass removal is maximized in homogeneous deposits by an approximately uniform distribution within the treatment area matching the likely distribution of contaminants. In heterogeneous deposits, contaminant distribution is more likely to be concentrated in zones of greater permeability. Focusing sparging activities in these areas of greater permeability is likely to be an efficient way to maximize removal. Placing additional sparging wells in areas where incoming data suggest that more wells might substantially accelerate removal and thus, decrease the time to system shutdown, might greatly benefit the remedial effort. 4.2.6 Cost
The potential economic benefit of air sparging has been an important driving force for use of this technology. The main categories of costs for air sparging projects are initial investment and O&M. Initial investment costs include expenditures such as additional site characterization, pilot-scale testing, design, and system construction, whereas O&M costs can include monitoring, vapor treatment, and site decommissioning costs. Although system design and installation costs may be comparable to those of competing technologies, O&M costs may be significantly reduced due to the typically short duration of operation. Developing a life-cycle approach to system design and optimization can help to minimize equipment and O&M costs. Typically, full-scale air sparging
60

ITRC – Overview of Groundwater Remediation Technologies for MTBE and TBA February 2005
remediation costs range from $150,000 to $350,000 per acre of groundwater treated (FRTR 2001). The remaining sections of this document highlight ways to improve system design and operation to ensure cost-effective implementation throughout the life of the project. The following is a list of the major factors that impact project design and installation and O&M costs: • type and concentration of contaminant, • area and depth of contaminant, • depth of groundwater, • site hydrogeology, • air sparging/SVE well spacing, • drilling method, • required flow rate and vacuum and pressure, • treatment duration, • regulatory requirements (e.g., monitoring, permitting, etc.), and • vapor treatment requirements. The installation costs of an air sparging system are based primarily on the number of air sparging and SVE wells required to adequately cover the target treatment area. The required number of wells is controlled by the areal extent of the contamination and the subsurface air distribution characteristics. The costs for well installation and construction also increase as the depth to the contaminated zone increases and the drilling becomes more costly. Equipment specifications, such as compressor and blower sizing, are greatly influenced by the required design pressure, which in turn directly affects a project’s capital equipment costs. The required air injection and extraction flow rates and the depth of the sparge point below the water table determine the design pressure requirements. Vapor treatment requirements determine the type and capacity of air pollution control equipment selected, which also affect initial equipment costs. The O&M costs are influenced primarily by those factors that tend to increase the time required to reach remedial action objectives. The presence of NAPLs can significantly increase project duration because they provide a continuing source of groundwater contamination. Site subsurface characteristics are also important because the achievable air injection rate and/or extraction rate affects the rate of contaminant removal and therefore the project duration. The soil characteristics also affect the required operating pressure for injection and the required vacuum for extraction, which can increase energy use at the site. Preferential airflow pathways are of paramount importance in air sparging applications because they can cause air to flow to unintended locations. As discussed in Chapter 3, vapor treatment requirements are often the most significant O&M costs for an air sparging project coupled with SVE. The replacement and disposal of activated carbon or the need for supplemental fuel for thermal/catalytic oxidation plays a large role in project economics. Table 4-7 presents a comparison of the relative costs of various MTBE remediation technologies.
61

ITRC – Overview of Groundwater Remediation Technologies for MTBE and TBA February 2005
4.2.7 Advantages and Limitations
Advantages to air sparging include the following: • Application of the technology is widely recognized by the regulatory community as an
effective remedial technology for removing volatile contaminants from groundwater. • Implementation is relatively simple, because only readily available commercial
equipment is utilized (i.e., polyvinyl chloride well casing, compressors or blowers, etc.). The equipment is relatively easy to install and causes minimal disturbance to site operations.
• Cleanup times are relatively short, typically taking less than two years to achieve
performance objectives (Bass, Hastings, and Brown 2000). • Use of low-cost, direct-push well installation techniques is possible. Direct-push
technologies are most applicable in unconsolidated sediments and at depths <30 feet. (However, in relatively coarse-grained lithologies, direct-push rigs may experience some difficulty in obtaining good material recovery, and specialized equipment may be needed to obtain relatively undisturbed samples from depths >10 feet [Kram 2001]). In soils where using this technology is feasible, this option offers the advantage of being more rapid and less expensive than traditional drilling techniques such as the hollow-stem auger method.
• If SVE is not necessary, minimal operational oversight is required once the system is
installed, and no waste streams are generated that require treatment. However, it is critical to determine that air is not flowing to unintended locations. If SVE is required, soil vapor treatment prior to discharge to the atmosphere is likely to be required. This process will necessitate obtaining an air discharge permit and additional labor to operate and maintain the treatment equipment.
Limitations of air sparging include the following: • Because air sparging increases the rate of contaminant volatilization and pushes air
away from the sparge points, it is important to be aware of the potential for migration of VOC-impacted vapor to human and/or ecological receptors at potential concentrations of concern. An SVE system can be used to reduce or eliminate vapor migration problems, but the proximity of the site to buildings or other structures should be taken into careful consideration. SVE is widely used and is one of the USEPA’s presumptive remedies for the remediation of VOC-contaminated vadose zone soils. SVE is relatively easy to implement, but depth to groundwater should generally be greater than 5 feet bgs to prevent SVE well submergence.
• If air sparging is applied to contain a dissolved-phase plume at a high air injection
rate in a sparging barrier configuration, the injection of air into the subsurface can produce a zone of reduced hydraulic conductivity. If operation of the air sparging
62

ITRC – Overview of Groundwater Remediation Technologies for MTBE and TBA February 2005
system is not managed properly, this condition could divert the plume away from the zone of air sparging influence and reduce treatment efficiency. Proper management includes pulsing airflow, which allows water to flow through the sparged zone when the system is turned off.
4.3 In Situ Bioremediation
4.3.1 Introduction
Biodegradation of MTBE or TBA in groundwater is the process by which microorganisms break down the dissolved MTBE or TBA as a direct or indirect function of their metabolic processes. When biodegradation is the primary process used to achieve remediation of MTBE, TBA, or other contamination within the subsurface environment, the remedial process is termed in situ bioremediation (ISB). At sites where bioremediation of contaminants occurs without human intervention, the remediation process is referred to as “intrinsic bioremediation,” “bioattenuation,” or “monitored natural attenuation.” When the conditions at a site require the implementation of a system to accelerate the rate of microbially mediated degradation reactions or to stimulate the activity of microorganisms by optimizing environmental conditions, the process is often referred to as “enhanced in situ bioremediation.” Enhanced in situ bioremediation (which consists of adding chemicals to stimulate biological activity [biostimulation] or adding microbes [bioaugmentation], or a combination of the two) typically involves the use of a system to supply oxygen or additional electron acceptors. In some cases, nutrients, such as phosphorus and nitrogen and or other growth-stimulating materials are also added (NRC 1993). If dissolved MTBE and or TBA cannot be used by indigenous microbial communities as the sole source of carbon and energy, the addition of a primary substrate may be needed. Finally, if the indigenous microbial community is not capable of contaminant degradation at an appreciable rate, the addition of a laboratory-enriched microbial community at the site may be necessary. This type of enhanced in situ bioremediation is referred to as bioaugmentation. Regardless of the terminology, it is generally accepted that MTBE and TBA can be degraded aerobically by both naturally occurring and/or cultured microorganisms (see Chapter 2). However, the details of the biological processes and the factors controlling the rate of MTBE and TBA degradation remain the subject of research and debate. Despite this uncertainty, the use of ISB, typically engineered ISB, for MTBE and TBA has been reported to have achieved a measure of success in both field tests and commercial-scale cleanups. The advantages of ISB of MTBE and TBA include the following: • the potential to degrade contaminants to less toxic by-products; • a reduced potential for cross-media transfer of contaminants compared to an ex situ process; • potentially lower cost than ex situ remedies (e.g., pump and treat); • the potential to remediate certain sites faster than conventional technologies; • eliminating the need for groundwater extraction, aboveground water treatment, and
wastewater discharge;
63

ITRC – Overview of Groundwater Remediation Technologies for MTBE and TBA February 2005
• the ability to reduce the quantity of waste generated since biological processes typically result in innocuous by-products; and
• reduced site disturbance compared to a number of other technologies. Detailed information on the general principles, advantages and limitations of ISB can be found in ITRC 2002c. In general, branched alkyl ethers such as MTBE are relatively resistant to microbial degradation due to the difficulty associated with the cleavage of the ether bond and the microbial attack of the branched tertiary or quaternary carbon structure (Deeb, Scow, and Alvarez-Cohen 2000; Stocking et al. 2000). Although early studies reported that MTBE is recalcitrant under both aerobic and anaerobic conditions, recent studies have revealed that several bacterial and fungal cultures from a number of environmental sources are capable of degrading MTBE either as a primary source of carbon and/or cometabolically following growth on other substrates (Schmidt et al. 2004). As detailed in Chapter 2, laboratory studies have reported both the partial degradation of MTBE to metabolic intermediates and its mineralization to CO2. The results from most laboratory and limited field studies suggest that bioremediation strategies involving direct metabolism, cometabolism, bioaugmentation, or some combination thereof can be used successfully at MTBE-affected sites if conditions at the site are amenable to biological activity and oxygen/nutrient delivery. ISB approaches for the destruction of MTBE in groundwater aquifers involve the use of either aerobic or anaerobic systems. A discussion of both is detailed below. 4.3.2 Aerobic MTBE Bioremediation
As discussed in Chapter 2, MTBE has been shown to be biologically metabolized or cometabolized under aerobic conditions. However, the metabolism of MTBE and TBA may not continue if anaerobic conditions develop. Therefore, the most important parameters to be measured prior to and during an aerobic ISB application are DO concentrations; concentrations of MTBE, TBA, BTEX, and other gasoline constituents; and in some cases, MTBE and TBA degradation products such as acetone. An overview of aerobic ISB of MTBE and TBA is provided by Wilson in Moyer and Kostecki 2003. 4.3.2.1 Natural Aerobic Biodegradation of MTBE
Field data have been presented which suggest that MTBE degrades naturally in groundwater aquifers. Degradation rate and lags between contaminant bioavailability and bioutilization are variable and site-specific, but the rate/lag is generally slower than for BTEX. For example, in a field study conducted to monitor the long-term attenuation of MTBE in subsurface environments, groundwater amended with MTBE, a number of other gasoline hydrocarbons and a conservative tracer were injected below the water table at the Borden Aquifer in Canada (Hubbard et al. 1994). While the concentrations of BTEX compounds decreased rapidly over time during the first 16 months, the initial mass of MTBE introduced into the aquifer persisted. Almost eight years later, a mass balance on the MTBE remaining in the groundwater revealed
64
ITRC – Overview of Groundwater Remediation Technologies for MTBE and TBA February 2005
that 97% of the initial mass was lost (Schirmer and Barker 1998). Based on the well-characterized properties of this site, sorption, abiotic degradation and volatilization were ruled out as significant MTBE loss mechanisms, and it was suggested that the majority of the missing MTBE was biodegraded. In support of this hypothesis, the biodegradation of MTBE was evaluated in microcosm and column batch studies using groundwater and aquifer materials from the site (Schirmer et al. 1999). Results from the laboratory studies confirmed the presence of indigenous aquifer microorganisms with the ability to degrade MTBE (Schirmer et al. 1999). Despite the laboratory and field data presented in published literature that suggest that the natural aerobic biodegradation of MTBE and TBA is a functional process, there are no known reports of the process being relied upon for the protection of a sensitive receptor. This situation is largely due to the fact that most plumes are anaerobic because the natural aerobic biodegradation has been overwhelmed by the flux of contaminants and the available oxygen has been consumed. However, there are a few cases studies where significant natural aerobic biodegradation of MTBE in groundwater has been observed at locations of MTBE-contaminated groundwater discharge to surface-water receptors (Landmeyer et al. 2001). The process by which contaminant degradation occurs naturally without the application of any enhancements is termed “intrinsic bioremediation.” Intrinsic bioremediation is a component of natural attenuation and is covered in more detail in Section 4.6. 4.3.2.2 Engineered In Situ Bioremediation Approaches for Aerobic Biodegradation of MTBE
The addition of amendments can greatly increase the rate and extent of biological processes. Several configurations are effective for engineering ISB at MTBE-impacted sites, including direct injection of amendments, groundwater recirculation, the use of permeable reactive barriers (PRBs) or panels and biosparging. As mentioned in the introduction, an engineered aerobic ISB approach can involve the addition of a number of amendments to stimulate biological activity in the subsurface. This option includes the addition of electron acceptors (e.g., oxygen), nutrients (e.g., nitrogen and phosphorus), cosubstrates (e.g., propane), or exogenous microorganisms. Oxygen sources include air, oxygen, hydrogen peroxide, and oxygen-release compounds. Case studies involving the direct injection of materials to enhance ISB at MTBE-affected sites are presented below. Of course, the major challenge of an engineered aerobic ISB approach involving the injection of amendments to the subsurface is the ability to contact the amendment with MTBE and the appropriate microbial populations. 4.3.2.3 Bioaugmentation Combined with Oxygen Injection
The most comprehensive studies of bioaugmentation combined with oxygen injection have been conducted at the Port Hueneme, California Naval Exchange Service Station, where an MTBE plume extends over 4,000 feet in length, 400 feet in width, and 10 feet in thickness. BTEX and TBA are also present. Studies at this site have involved the injection of both mixed and pure cultures of microorganisms into various zones of the aquifer, in addition to the addition of air and pure oxygen. In one study at Port Hueneme a pure-culture designated PM-1 was added to stimulate MTBE biodegradation in an area of the plume downgradient from areas contaminated with BTEX compounds. This strain was isolated by researchers at the University of California at Davis, and
65

ITRC – Overview of Groundwater Remediation Technologies for MTBE and TBA February 2005
the resulting biobarrier was shown to be effective in mitigating the area of the inoculated plume (Mackay et al. 2002). However, effective treatment also occurred in control plots receiving oxygen alone. In another study at the same site, a mixed bacterial culture designated BC-4, which was enriched by researchers at Shell Global Solutions, was also used to evaluate the feasibility of bioaugmentation (Salanitro et al. 2000). Three plots were evaluated in this study: a control plot where no treatment was performed, a plot supplemented with oxygen only, and a plot supplemented with oxygen and augmented with BC-4. The results of this study again provided evidence of successful biostimulation with oxygen injection alone; however, oxygen injection was shown to be less effective than the combined effect of oxygen and BC-4 injection. Furthermore, a longer lag time was observed when oxygen was used exclusively. An in situ barrier using BC-4 appeared to be capable of reducing MTBE concentrations to low levels without the accumulation TBA as a by-product. Furthermore, this study showed that the injected culture remained active up to 261 days under the conditions tested Because of the success of this demonstration, another mixed MTBE-degrading microbial culture (MC100) and a pure culture (SC100) isolated by Shell Global Solutions were subsequently used in a field-scale demonstration of the biobarrier principle. In December 2000, a 500-foot barrier was installed immediately downgradient from the BTEX plume. The various treatments used involved air-only injections at the plume fringes where low (<100 ppb) contaminant concentrations existed. In areas with high contaminant concentrations (>10 ppm), the barrier was augmented with either the SC100 or the MC100 MTBE-degrading cultures, and these zones were oxygenated using either air or pure oxygen. All areas of the biobarrier were shown to be highly effective in reducing organic contaminant concentrations in the aquifer, and all contaminant concentrations were reduced to nondetect levels (<5–10 ppb) within 18 months of operation. Results from this project show that use of ISB at Port Hueneme is expected to lead to cost savings exceeding $30M relative to a pump-and-treat approach (Miller 2002). A recent report describing the design, monitoring, and optimization of this type of aerobic MTBE-treating biobarrier was recently published (Johnson, Miller, and Bruce 2004). This report emphasizes the following main issues: (a) the need to fully delineate the source zone(s) to ensure all MTBE sources are treated by the barrier, (b) the suggested use of pulsed oxygen (rather than air) injections to maximize the zone of oxygenation and to provide continuing rather than temporary oxygenation, and (c) the ability of this system to treat not only MTBE and TBA but also other gasoline cocontaminants (e.g., BTEX). The report also outlines several important considerations affecting the use of bioaugmentation with commercially available or cultivated indigenous microbial cultures versus the alternative of stimulating indigenous microbial communities by the addition of oxygen alone (biostimulation). The principal issues addressed here are (a) the significant uncertainties associated with microcosm studies designed to assess whether indigenous organisms can be stimulated to effective levels in a particular environment and (b) the extended time (>1 year) that may be required to establish effective indigenous microbial communities capable of treating the existing contaminants. Although the collective experiences with in situ oxygenation approaches at Port Hueneme all observed MTBE treatment through biostimulation, the use of bioaugmentation should be viewed as a means to reduce the
66

ITRC – Overview of Groundwater Remediation Technologies for MTBE and TBA February 2005
time needed establish a stable and effective MTBE- and TBA-degrading microbial community in treatment zone. 4.3.2.4 Cosubstrate Addition
Envirogen conducted a demonstration at the Port Hueneme site whereby propane was added to the contaminated aquifer to stimulate the cometabolic biodegradation of MTBE (ESTCP 2003b). In addition to propane and a culture (ENV425) that can cometabolize MTBE, oxygen was also added at this site. After several months of operation, MTBE concentrations decreased dramatically in most wells; however, evaluators concluded that “…the technology did not meet the State of California’s treatability criteria” (Azadpour-Keeley 2002). 4.3.2.5 Oxygen-Only Addition
Several oxygen delivery methods have been tested at a number of field pilot sites. For example, air and pure oxygen have been tested at Port Hueneme as discussed above. At Vandenberg Air Force Base, oxygen was introduced into an MTBE-contaminated aquifer by diffusion through the walls of oxygen-pressurized polymeric (light-density polyethylene or silicone) tubing placed in contact with the flowing groundwater (Wilson, Mackay, and Scow 2002). As a result, MTBE was shown to biodegrade in the treatment zone by native microorganisms at the site at first-order biodegradation rates (k) ranging 4.4–8.6 per day. First-order biodegradation rates appear in the first-order biodegradation rate law, which is given by
C = Co e-kt , (5) where
C = contaminant concentration at time t (M/L3), Co = initial contaminant concentration (M/L3), k = first-order biodegradation rate (T-1).
The use of oxygen-release compounds has also been tested at many sites. A Regenesis, Inc. (San Clemente, Calif.) product, ORC, has been shown to enhance the aerobic biodegradation of MTBE in groundwater at a number of sites. In tests across three diverse sites throughout the country, degradation rates were such that the half-life (t1/2) of MTBE ranged from 5 to 61 days (Koenigsberg and Mahaffey 2001, Regenesis 2002). (Half-lives are derived from the above equation when C = 0.5 Co and t1/2 = 0.693/k.) 4.3.2.6 Factors Affecting the Success of Aerobic Biodegradation of MTBE
The reported field pilots of aerobic biodegradation of MTBE and TBA suggest common site characterization parameters should be considered when evaluating aerobic ISB as a pilot- or field-scale remedy. The physical parameters that are of primary relevance to ISB are hydraulic conductivity, hydraulic gradient, and organic content of the aquifer. The following chemical parameters also affect MTBE and TBA degradation:
67

ITRC – Overview of Groundwater Remediation Technologies for MTBE and TBA February 2005
• contaminant concentrations, • oxygen concentration, • pH, • organic and inorganic electron donor concentrations, • electron acceptor concentrations, • nutrient concentrations, and • nontarget inorganics that can consume oxygen (such as ferrous iron). These parameters can help determine which amendments would be helpful and how well they can be delivered to the contamination. Other site conditions such as access, available utilities, and depth to groundwater are also important to consider. In general, the best sites have highly permeable, homogeneous hydrogeology and sufficient natural nutrients. On the other hand, fractured-rock, low-permeability (K < 10-4 cm/sec), highly stratified deposits do not make good areas for successful aerobic ISB. 4.3.2.7 Performance
To date, performance information regarding the use of aerobic ISB is not widely available. Performance is highly site specific and largely a function of the skill of the remediation practitioner in discerning what amendments are needed and bringing microorganisms, contaminants, and amendments into contact with one another. The availability of complete case studies of remedial-scale applications is expected to increase as ISB becomes a more frequently attempted and or accepted remedy at MTBE-affected sites. 4.3.2.8 Cost
To date, cost information regarding the use of aerobic ISB applications is limited. Based on the costs involved in establishing a 500-foot biobarrier at Port Hueneme, it is estimated that future installation costs are between $800 and $1,050 per linear foot for aquifers less than 30 feet bgs (ESTCP 2003a). Approximately 70% of these costs are associated with the bioaugmentation of the aquifer. The annual O&M costs for a 500-foot biobarrier are estimated at approximately $75,000. Approximately 60% of these costs are associated with sampling and analysis, the remainder split evenly between utility costs and maintenance of the oxygen generating and distribution system. The availability of cost information is expected to increase as ISB becomes a more frequently attempted and/or accepted remedy at MTBE-impacted sites. Table 4-7 presents a comparison of the relative costs of various MTBE remediation technologies. 4.3.3 Anaerobic MTBE Bioremediation
Anaerobic biological processes take place in the absence of oxygen. Alternative electron acceptors include nitrate, ferric iron, manganese(IV), sulfate, and carbon dioxide as illustrated in Figure 4-5.
68

ITRC – Overview of Groundwater Remediation Technologies for MTBE and TBA February 2005
Figure 4-5. Geochemical evolution of groundwater. (Source: Bouwer and McCarty 1984)
4.3.3.1 Evidence for MTBE Anaerobic Biodegradation
A study conducted in 1994 investigated the biodegradation of MTBE under denitrifying, sulfate-reducing, and methanogenic conditions in microcosms using soil and groundwater from three different sites (Yeh and Novak 1994). The authors found no evidence of MTBE biodegradation under anaerobic conditions when nutrients and a hydrogen source were not added, or under denitrifying conditions or sulfate-reducing conditions when nutrients and a hydrogen source were added. The removal of MTBE was only shown to take place under methanogenic conditions and in the absence of more easily degraded organic compounds. A study conducted in 2000 evaluated the biodegradation of MTBE under methanogenic conditions in soil samples collected from a former fuel farm in North Carolina (Wilson et al. 2000). MTBE was degraded in the microcosms after more than 300 days and in some microcosms only after all other degradable compounds (e.g., alkylbenzenes) were depleted. More recently, Finneran and Lovley (2001) reported the anaerobic biodegradation of MTBE and TBA in aquifer materials from a contaminated site. MTBE and TBA were shown to degrade under iron-reducing conditions in the presence of humic substances. The authors speculated that the humic matter served as an electron shuttle, thereby facilitating the oxidation of MTBE and TBA. Finally, researchers have demonstrated that MTBE can be degraded under a range of electron acceptor conditions including nitrate-, iron- and sulfate-reducing conditions (Bradley et al. 2001a, 2001b; Bradley, Chapelle, and Landmeyer 2002; Landmeyer et al. 2001; Somsamak, Cowan, Haggblom 2001).
69
ITRC – Overview of Groundwater Remediation Technologies for MTBE and TBA February 2005
USGS work indicated that TBA degraded under aerobic, nitrate-reducing, manganese(IV)-reducing, and sulfate-reducing conditions; however, it did not under iron-reducing and methanogenic conditions after 198 days of incubation. TBA persistence under strongly reducing conditions has also been observed by others (Somsamak, Cowan, Haggblom 2001; Kolhatkar et al. 2002). 4.3.3.2 Limitations of Anaerobic In situ Bioremediation Applications
While these studies have reported the anaerobic biodegradation of MTBE in soil and groundwater samples from MTBE-impacted sites, there are no studies documenting the successful application of an engineered anaerobic ISB approach in the field. Knowledge regarding ways to enhance anaerobic processes in the field is currently limited, and no known engineered anaerobic ISB applications have been attempted. However, given that the majority of gasoline-impacted plumes are anaerobic (Kolhatkar, Wilson, and Dunlap 2000; McLoughlin et al. 2001), it is important to continue evaluation of the fate of MTBE and TBA and by-products of incomplete degradation such as acetone under anaerobic conditions. 4.4 Chemical Oxidation
This section presents an overview of in situ chemical oxidation (ISCO) specifically relative to remediation of MTBE and other oxygenates in groundwater. Readers are referred to the ITRC ISCO Team’s Technical and Regulatory Guidance for In Situ Chemical Oxidation of Contaminated Soil and Groundwater (ITRC 2001a) for more details of general application of ISCO and for use of ISCO to remediate source areas and soils. 4.4.1 Description
Remediation of groundwater contamination using ISCO involves injecting oxidants and other amendments as required directly into the subsurface soils and groundwater plumes. The specific types of oxidants used and the methods for delivery are discussed in the following subsections. The oxidant chemicals react with the MTBE and the subsurface environment to mineralize MTBE to carbon dioxide and water. During the oxidation of MTBE, a series of intermediate degradation products such as TBF, aldehydes, TBA, methyl acetate (MA), and acetone can be formed. However, the exact sequence of the reactions and mineralization into reaction intermediate compounds is not fully understood across the varying geochemical environments encountered in full-scale remedial application. The understanding of this mineralization process during oxidation in situ with different oxidants and in varying geologic settings is important to fully understand ISCO of MTBE and TBA. Although other oxygenates should mineralize based on their stochiometry, no significant study on the ISCO of oxygenates other than MTBE and TBA has been performed. Figure 4-6 depicts some of the products formed when MTBE is chemically oxidized (Dey, Rosenwinkel, and Wheeler 2002; Wheeler 2002). 4.4.2 Types of Oxidants
The chemical oxidants to be discussed in this document, in order of strength from strongest to weakest oxidation potential, are Fenton’s reagent, activated persulfate, ozone, sodium persulfate,
70
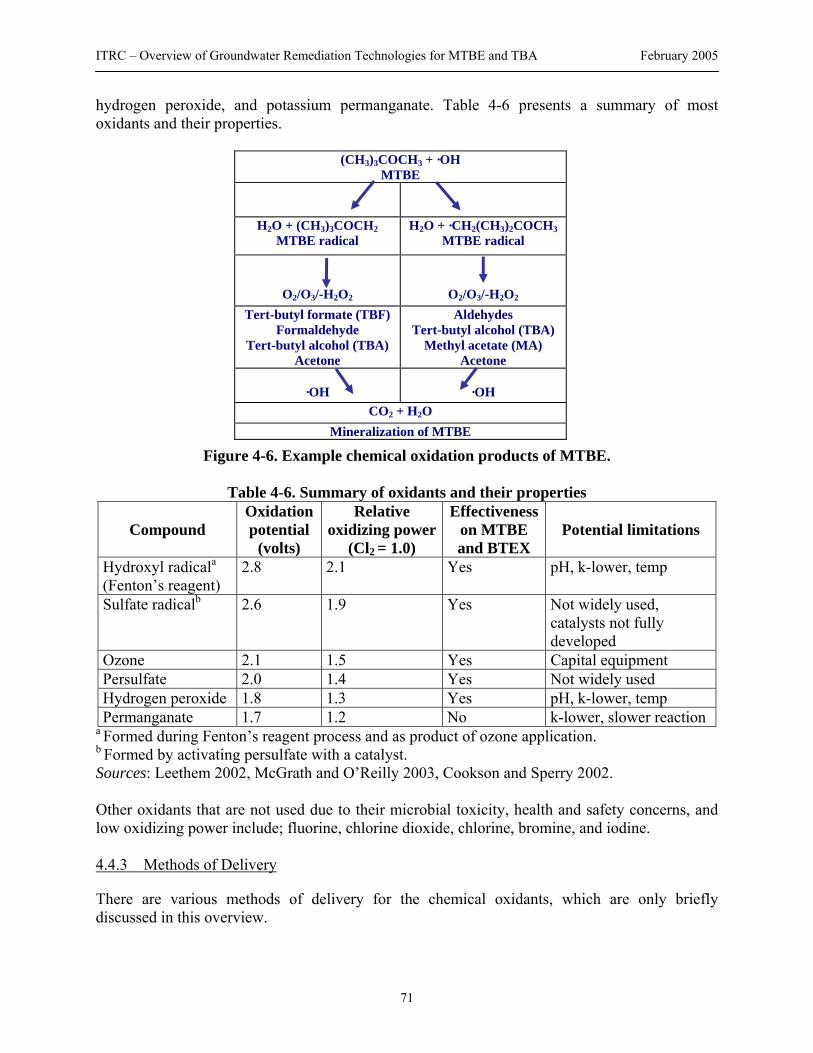
ITRC – Overview of Groundwater Remediation Technologies for MTBE and TBA February 2005
hydrogen peroxide, and potassium permanganate. Table 4-6 presents a summary of most oxidants and their properties.
(CH3)3COCH3 + ·OH MTBE
H2O + (CH3)3COCH2 MTBE radical
H2O + ·CH2(CH3)2COCH3 MTBE radical
O2/O3/-H2O2
O2/O3/-H2O2 Tert-butyl formate (TBF)
Formaldehyde Tert-butyl alcohol (TBA)
Acetone
Aldehydes Tert-butyl alcohol (TBA)
Methyl acetate (MA) Acetone
·OH
·OH
CO2 + H2O Mineralization of MTBE
Figure 4-6. Example chemical oxidation products of MTBE.
Table 4-6. Summary of oxidants and their properties
Compound Oxidation potential
(volts)
Relative oxidizing power
(Cl2 = 1.0)
Effectiveness on MTBE and BTEX
Potential limitations
Hydroxyl radicala (Fenton’s reagent)
2.8 2.1 Yes pH, k-lower, temp
Sulfate radicalb 2.6 1.9 Yes Not widely used, catalysts not fully developed
Ozone 2.1 1.5 Yes Capital equipment Persulfate 2.0 1.4 Yes Not widely used Hydrogen peroxide 1.8 1.3 Yes pH, k-lower, temp Permanganate 1.7 1.2 No k-lower, slower reaction
a Formed during Fenton’s reagent process and as product of ozone application. b Formed by activating persulfate with a catalyst. Sources: Leethem 2002, McGrath and O’Reilly 2003, Cookson and Sperry 2002. Other oxidants that are not used due to their microbial toxicity, health and safety concerns, and low oxidizing power include; fluorine, chlorine dioxide, chlorine, bromine, and iodine. 4.4.3 Methods of Delivery
There are various methods of delivery for the chemical oxidants, which are only briefly discussed in this overview.
71
ITRC – Overview of Groundwater Remediation Technologies for MTBE and TBA February 2005
Hydrogen peroxide and sodium permanganate are liquids that are most commonly delivered in situ by batch or continuous, metered injection through injections wells or infiltration galleries. These oxidants are delivered to the site in trucks for batch injections or temporarily stored in tanks on site for metered delivery. Ozone is a gas that is generated on site. Ozone is usually injected in situ as a gas through sparge wells. Ozone may be mixed with water or recirculated groundwater and reinjected. Persulfate and potassium permanganate are solids that are dissolved in water either on site or delivered at site-specific concentrations. These oxidants are usually batch injected through injection wells, infiltration galleries, or infiltration points. 4.4.4 Applicability
The applicability of ISCO versus other remedial technologies is critically dependent on hydrogeology, geochemistry, and contaminant concentrations and properties. A thorough understanding of the site hydrogeology is essential to appropriately evaluate, select, and design any remedial solution. Specific hydrogeology characteristics that affect the advective and dispersive transport of contaminants and oxidants are hydraulic conductivity, soil structure and stratification, and hydraulic gradient. The oxygen demand at a site is the single biggest factor relative to the specific mass of oxidant that may be consumed by the natural oxidant demand (NOD). The NOD is created by the reaction of oxygen and oxidants with organic or inorganic chemical species naturally present in the subsurface, such as iron or other reduced inorganic compounds dissolved in groundwater. This NOD must be satisfied along with the oxidant demand created by MTBE, other oxygenates, and all the other constituents of gasoline that are present in the subsurface plume. Generally, ISCO may not be applicable on sites where there is significant residual or mobile LNAPL, high concentrations of nontargeted organics or inorganics, in very low-permeability soil matrixes, or when sensitive utilities are located within the treatment area. It should be noted that combinations of other remedial technologies or engineering controls when combined with ISCO might make application under these conditions feasible. ISCO is applicable to the remediation of MTBE, TBA, and other oxygenates in groundwater to achieve the following results: • Plume Containment—Reduce the flux of dissolved constituents downgradient of the
treatment zone. This goal can be accomplished using a series of vertical points installed in a line, horizontal wells, or trenches to create an ozone sparging barrier or a line of oxidant addition at a strategic location within or on the downgradient edge of the groundwater plume.
• Plume Remediation—Reduce the size of the plume and the mass of dissolved MTBE and other oxygenates. This goal can be accomplished by batch or continuous injections methods throughout a predetermined contaminant concentration zone.
Source area treatment is not part of this overview; readers are referred to ITRC 2001a.
72

ITRC – Overview of Groundwater Remediation Technologies for MTBE and TBA February 2005
4.4.5 Performance, Effectiveness, Advantages and Disadvantages
The oxidant’s performance, effectiveness, advantages, and disadvantages is dependent on site conditions, including COCs, presence of separate-phase COCs, permeability, soil oxidant demand, soil alkalinity, groundwater pH/alkalinity, inorganic concentrations, soil clay content, and concentrations of soil and dissolved natural organic matter. Most of the ISCO projects implemented on MTBE, TBA, or other oxygenate sites to date have used hydrogen peroxide/Fenton’s reagent or ozone as the oxidant of choice. Combinations of hydrogen peroxide and ozone as well as persulfate are being tested and evaluated, and some promising results have been reported. As with most remedial technologies, a thorough collection and understanding of site characterization data and groundwater flow is critical to the selection, design, and operation of an effective ISCO remedial solution. This factor is at least as important as the technology selected. The experience of the engineers, consultants, and contractors is critical to safe and effective application of ISCO remedial solutions. Health and safety concerns particular to ISCO are addressed ITRC 2001a. 4.5 Phytoremediation
This section describes the application of phytoremediation to MTBE-impacted groundwater. Comprehensive discussions on phytoremediation and the use of phytotechnologies have been prepared by the ITRC Phytotechnologies Team (ITRC 2001b) and USEPA (2000b). Although the use of phytoremediation is being used to treat MTBE-affected groundwater at several sites, the applications and acceptance of this technology are still limited. 4.5.1 Description
The most basic definition of phytoremediation is “a technology that uses plants to remediate or stabilize contaminants in soil, groundwater, or sediments” (ITRC 1999). An expanded definition is “the use of vegetation to contain, sequester, remove, or degrade inorganic and organic contaminants in soils, sediments, surface waters, and groundwater.” (ITRC 2001b). Typical organic contaminants that can be addressed using phytotechnologies include petroleum hydrocarbons, gas condensates, crude oil, chlorinated compounds, pesticides, and explosive compounds. The specific phytotechnology mechanisms that could be considered for MTBE remediation in groundwater include rhizodegradation (the breakdown of contaminants in the soil through microbial activity that is enhanced by the presence of the rhizosphere), phytovolalitization (chemical removal via transpiration), and possibly phytodegradation (the breakdown of contaminants by plants through metabolic processes within or external to the plant). Additional information on these mechanisms is provided by USEPA 2000b and ITRC 1999 and 2001b.
73

ITRC – Overview of Groundwater Remediation Technologies for MTBE and TBA February 2005
4.5.2 Applicability
The applicability of phytoremediation at a specific site depends on certain conditions. ITRC 2001b suggests that phytotechnologies are well suited for sites where the following conditions exist: • Contamination exists at a depth accessible by the root zone. • Sufficient area exists for growing vegetation. • Treatment can be applied over long periods of time. • Concentrations of contaminants are nontoxic to the plants. • Other methods of remediation are not cost-effective or practicable. • Existing systems may be supplemented to achieve remedial goals more rapidly. • A transition from a primary treatment to a longer-term strategy may be desired. • Vegetation can be used as a final cap for closing or restoring the site. In Phytoremediation Technology Bulletin, Groundwater Application (CRTC 2001), Chevron Research and Technology Company adds that depth to groundwater and age of the plants should also be considered in evaluating the potential applicability of phytoremediation at a specific site. There are several potential applications of phytotechnologies for treating groundwater affected by MTBE. These include hydraulic barriers to control/remediate groundwater, vegetative stands to reduce infiltration and groundwater recharge, constructed wetlands to treat surface water runoff and near-surface groundwater seeps, and hydroponic systems as the treatment portion of a pump-and-treat system. Additional information on these applications is provided by ITRC 2001b. 4.5.3 Performance
CRTC (2001) and Zollinger, Ferro, and Greene (2002) reviewed data for several sites where phytoremediation is being evaluated. CRTC’s review included two sites that have groundwater affected by MTBE. Performance data collected at one of the sites, a service station in northern California, suggested that pine trees at the site may be inhibiting the off-site migration of MTBE and TBA. Data supporting this theory includes concentrations of MTBE and TBA in transpirate samples from the trees and reduced groundwater concentrations of MTBE and TBA in wells located within or downgradient of the tree stand. The second site, a former service station at Vandenberg Air Force Base (AFB), was reviewed by both CRTC and Zollinger; the data collected here were not as conclusive. Additional information on the Vandenberg AFB site is provided by Brown et al. (2001). In an earlier study conducted at the University of Washington using pure cell cultures of hybrid poplar, cell suspensions dosed with 14C-labeled MTBE produced products with 14C-labeled CO2 and soluble nonvolatile transformation products. This study was followed up with whole hybrid and eucalyptus plants in mass balance chambers. Labeled products were identified in the plant tissue and transpired gases (Newman et al. 1999).
74
ITRC – Overview of Groundwater Remediation Technologies for MTBE and TBA February 2005
Zollinger, Ferro, and Greene (2002) also reviewed data collected at several sites with groundwater affected by MTBE, including a phytoremediation system installed at a Shell-Equilon site in Houston, Texas to provide hydraulic control for a groundwater plume containing MTBE. It was installed to replace a pump-and-treat system installed during a previous remedial phase. Based on data review, Zollinger, Ferro, and Greene estimated that the phytoremediation system had removed approximately 441 thousand gallons of water during the growing season. However, no concentration data for MTBE in groundwater were available at the time of their review (2002). Another site included in the study was a service station near Beaufort, South Carolina. Analytical data from xylem core samples of mature trees collected at this site revealed detectable concentrations of MTBE; this was interpreted as suggesting that the trees were taking up MTBE-impacted groundwater (Landmeyer, Vroblesky, and Bradley 2000). 4.5.4 Cost
As phytoremediation is an emerging technology/application, there is little cost information regarding its use at MTBE-affected sites. Several studies cited in USEPA 2000b suggest the use of phytoremediation could result in significant cost savings over the life of a project; however, none of those studies dealt with MTBE-impacted groundwater. ITRC 2001b also does not include MTBE-specific data, but it cites information gathered by Glass (1998), who estimated that phytotechnologies could be at least 40% less costly than other in situ remedial approaches and ex situ technologies could be 90% less costly compared to alternatives. Table 4-7 presents a comparison of the relative costs of various MTBE remediation technologies. 4.5.5 Advantages and Limitations
Several factors need to be considered in determining whether a site is suitable for the implementation of phytoremediation technologies: growth habit of the planted system, root penetration of the selected plant(s), and the amount of land available for planting. If it is determined that phytoremediation is applicable for a site, it can present several advantages over conventional treatment alternatives: • low-maintenance, passive, in situ, self-regulating, solar-driven system; • potentially applicable in remote locations without utility access; • decreased air and water emissions as well as secondary wastes; • control of soil erosion, surface water runoff, infiltration, and fugitive dust emissions; • applicable to simultaneously remediate sites with multiple or mixed contaminants; • habitat creation or restoration provides land reclamation upon completion; • favorable public perception, increased aesthetics, and reduced noise; • increasing regulatory approval and standardization; and • carbon dioxide and greenhouse gas sequestration. Phytoremediation technologies also have limitations and, therefore, are not applicable at every site. Some potential limitations of applying phytoremediation at MTBE-impacted sites include the following: • slow plant growth rates;
75

ITRC – Overview of Groundwater Remediation Technologies for MTBE and TBA February 2005
• dependence on climate and growth season; • susceptible to infestation and diseases; • may be difficult to establish/maintain vegetation, • slow/shallow root penetration; • limited contaminant mass transfer into root zone; • phytotoxicity of contaminants; • limited database and performance data available; • potential transfer to secondary media; • by-products may be more toxic; • mechanisms not completely understood; • fate, transport, and efficacy not well documented; and • unfamiliarity by public/regulatory communities. Many of the limitations can be addressed using field engineering techniques (e.g., planting methods, lateral root growth inhibitors, down-hole hardware, irrigation systems, maintenance practices, and fertilizers); mixed/diverse plant communities; and bench, laboratory, or greenhouse studies. 4.6 Monitored Natural Attenuation
4.6.1 General Description
MNA is the reliance on naturally occurring subsurface processes to achieve site-specific remediation goals in a reasonable period of time, in the context of a site that is carefully controlled and monitored. Natural attenuation processes act without human intervention to reduce the mass, toxicity, mobility, volume, or concentration of contaminants in soil or groundwater and include dispersion; dilution; sorption; volatilization; radioactive decay; and chemical or biological stabilization, transformation, or destruction of contaminants (USEPA 1999c). MNA generally requires a higher level of site characterization detail than active remediation, including a very thorough understanding of aquifer hydraulics, contaminant sources and plumes, and chemical properties. MNA involves long-term monitoring until, and for a period of time after, remediation goals for the site have been achieved. To be competitive with active remediation alternatives, MNA must be capable of achieving goals in a reasonable period of time. 4.6.2 Strategy
USEPA 1999c describes three tiers of site-specific information or “lines of evidence” that can be developed during MNA. First-line evidence includes historical data showing decreasing contaminant concentration and/or mass, which may include an analysis of concentration versus time at specific locations, and concentrations versus distance along an inferred plume centerline. Second-line evidence is hydrogeologic and geochemical data that can indirectly demonstrate the type(s) of natural attenuation processes at work and their rates; while third-line evidence might
76
ITRC – Overview of Groundwater Remediation Technologies for MTBE and TBA February 2005
include field or microcosm data which directly demonstrate the type(s) of natural attenuation processes at work and their rates (typically used to demonstrate biodegradation only). At some sites, the quality and duration of historical data (first-line evidence) are sufficient to support MNA. At others, additional indirect (second-line evidence) data may be required, and if these data are not sufficiently conclusive, direct (third-line evidence) data may also be necessary. In all cases, it is extremely important that the monitoring network utilized for the first line of evidence be designed to detect whether and how the MTBE plume has moved away from the original position. The network must be able to detect downgradient and/or downward movement of the plume. An improperly designed or incomplete system of shallow downgradient monitoring wells may miss a meandering or diving plume, which could lead to the erroneous interpretation that the observed decrease in contaminant concentrations represents the leading edge of the plume. Uncertainty in plume stability can be reduced by restricting the interpretation of spatial trends to wells located within the geochemical footprint of the plume. In some cases, MNA will be accepted only when contaminants are destroyed or strongly immobilized by a natural process, i.e., biodegradation, precipitation, strong sorption, and radioactive decay. Of these, only biodegradation will be potentially applicable to MTBE because of its chemical and physical properties. Therefore, the MNA strategy at some MTBE sites must provide evidence of biodegradation. The level of evidence required is agency and site specific, depending on such factors as COCs and their concentrations, plume size, physical setting, and proximity and potential risk to receptors. 4.6.3 Applicability
NRC (2000) indicated that the state of understanding of biodegradation processes for MTBE was moderate, while the likelihood for success for natural attenuation was low. Yet there are many cases in which significant biodegradation of MTBE has been demonstrated (e.g., Kolhatkar et al. 2002; Kolhatkar, Wilson, and Hinshalwood 2001; Kolhatkar, Wilson, and Dunlap 2000; Shorr and Rifai 2002; Wilson et al. 2000). In addition, plume length studies involving large numbers of sites in Texas (Mace and Choi 1998), Florida (Integrated Science and Technology 1999), and California (Happel, Beckenbach, and Halden 1998) suggest that natural attenuation may be limiting the length of MTBE plumes. Enough positive evidence exists to warrant further consideration of MNA for MTBE. However, Happel, Beckenbach, and Halden (1998) acknowledge that the California study used existing monitoring well networks that were not designed to detect MTBE plumes and that many of the plumes were probably longer than indicated from that study. However, MNA is appropriate only in conjunction with source control and remediation of high concentrations. LNAPL should be removed prior to implementing MNA, and in many cases active remediation of high dissolved concentrations will be necessary prior to MNA. MNA limited in application to the fringes of the plume may be appropriate with other active remediation technologies in the source area (Wilson and Kolhatkar 2002).
77

ITRC – Overview of Groundwater Remediation Technologies for MTBE and TBA February 2005
MNA is most appropriate for a shrinking plume and is often the last phase in a sequence of technologies that protect receptors, control sources, remediate dissolved constituents, and naturally attenuate the last remaining low concentrations of dissolved constituents. The ideal MTBE site for MNA will have simple hydrogeology; slow groundwater flow (allowing sufficient time for biodegradation); controlled sources and no LNAPL; low contaminant concentrations; a shrinking and well-defined plume; no nearby sensitive receptors; appropriate electron acceptors and donors, nutrients, pH, and other conditions to support biodegradation; a relatively short estimated time frame to reach remediation goals; no need for use of the groundwater resource for the estimated time frame of remediation; and a responsible party to ensure implementation of MNA throughout and beyond the remediation time frame. Because MNA requires a good understanding of subsurface hydraulics, it is generally inappropriate at sites in complex geologic settings, such as those featuring fractured or karstic bedrock, where preferential pathways make such an understanding difficult or impossible. It is not appropriate if receptors could be adversely affected as a consequence of selecting MNA as the remedial option. It is not appropriate if the estimated time frame of remediation is “unreasonable” compared to active remediation alternatives. The “reasonable” time frame for attaining remediation objectives is site specific and is determined through an analysis of all appropriate alternatives. Typically, monitoring is continued for a specified period (e.g., one to three years) after remediation objectives have been achieved, to demonstrate that goals have been achieved on a permanent basis (USEPA 1999c). 4.6.4 Performance
As mentioned previously, the amount of data required to document MNA is site specific, but at all MNA sites, it is necessary to have a thorough understanding of subsurface hydraulics and the nature and extent of all contaminants. The groundwater monitoring well network must be sufficient, in three dimensions, to ensure that contaminants are actually attenuating and not merely migrating away from the area along some unknown flow path. An MNA program might begin with a relatively large number of groundwater samples collected frequently and analyzed for a large suite of analytes. After a period of time, the data can be reviewed with an eye toward paring the number of samples, frequency of collection, and analyte list. Another strategy is to analyze frequently for a reduced list of analytes from a subset of wells, with less frequent sampling rounds involving a larger number of analytes and sampling locations. At an MTBE-blended gasoline release site (assuming prior site assessment work has ruled out the possibility of any other sources/types of contamination), analyses for contaminants of concern, covering the first tier of data described in Section 4.6.2 might initially include MTBE, TBA, DIPE, TAME, ETBE, TAA, TAEE, EDB, BTEX, gasoline- and diesel- range petroleum hydrocarbons, and acetone. (Some of these constituents may have already been shown to be absent in prior assessment work, in which case they probably do not need to be included.) Satisfying the requirements of the second tier of data described in Section 4.6.2 is more involved. Prior to undertaking this work, it is advisable to use a simple model such as BIOSCREEN, without a biodegradation term, to see whether physical attenuation mechanisms alone are
78
ITRC – Overview of Groundwater Remediation Technologies for MTBE and TBA February 2005
sufficient to attenuate the plume (Newell, McLeod, and Gonzales 1996). If they are, it may not be necessary to evaluate the biodegradation component of natural attenuation. To demonstrate the biodegradation mechanisms at work in a plume, laboratory analyses and field measurements related to electron acceptors and their associated products could include DO, dissolved inorganic carbon (H2CO3 + HCO3
- + CO2), nitrate, sulfate, manganese, ferrous iron, methane, and/or dissolved hydrogen in some cases. It is important to keep in mind that different terminal electron accepting processes (TEAPs) may be operating in different portions of the plume. DO is difficult to measure accurately; nitrate is more reliably measured and is a good surrogate for DO because it is used at approximately the same rate as oxygen. Ferrous iron data are often inconclusive; high concentrations indicate that DO concentrations are low but not why they are low. Sulfate reduction is commonly associated with MTBE/TBA plumes (and with gasoline plumes in general) and is therefore important to measure. A “halo” of sulfate and/or nitrate around a plume, with depletion or complete removal within the plume, provides indirect evidence of biodegradation. Sulfate and nitrate data, in conjunction with compound-specific stable isotope analysis (e.g., 13carbon) (see below), can provide a strong body of evidence for biodegradation. As noted in Chapter 2, there are a number of biodegradation intermediates of MTBE: TBA, formaldehyde, TBF, MHP, HIBA, 2-propanol, formaldehyde, and acetone. Of these, it is typically necessary to analyze for only TBA because the other compounds are usually short-lived and do not tend to accumulate. Part of the second tier of data potentially required in an MNA project is an evaluation of the rate at which contaminant concentrations are decreasing either spatially or temporally. Newell et al. (2002) provide guidance on calculating MNA first-order rate constants and using them in fate-and-transport models to predict MNA. It discusses three useful types of rates—concentration versus time at a single location, concentration versus distance, and biodegradation rate—and how to calculate and apply them in MNA evaluations. Microcosms or field studies may be needed to provide direct evidence of biodegradation (the third tier of MNA data required if the first two tiers are inconclusive). Microcosm studies typically do not accurately reflect field behavior, and they are expensive and time-consuming. A more powerful tool is compound-specific isotope analysis (Kolhatkar et al. 2002, Huenkeler et al. 2001, Gray et al. 2002), which can provide direct evidence of biodegradation at a much lower cost. Analyses of carbon isotope ratios, sulfate, and nitrate are recommended to demonstrate that biodegradation is occurring and also to indicate the TEAP(s) that may be at work. Institutional controls may be required to avoid site disturbance while MNA is taking place. USEPA (1999c) believes that contingency remedies should generally be included as part of a MNA plan. The need for contingency remedies would be triggered if contaminant concentrations do not decrease fast enough, if there is a new release, or if land or groundwater use changes could adversely affect the protectiveness of the MNA remedy. Contingency remedies would generally involve active remediation of some kind (e.g., P&T, ISCO, ISB, air sparging, groundwater oxygenation, control of a new source, etc.).
79
ITRC – Overview of Groundwater Remediation Technologies for MTBE and TBA February 2005
4.6.5 Cost
Like everything else in this field, MNA cost will be site specific. Key factors affecting cost will be plume dimensions, depth to groundwater, geology, and attenuation rates, and thus total time required to achieve remediation goals. Obviously, thorough source characterization and control will be key to minimizing the cost of an MNA program. After installation of a monitoring well network, it would not be unusual for a MNA program at a gasoline LUST site to cost $10,000–$50,000 per year for monitoring and reporting. Table 4-7 presents a comparison of the relative costs of various MTBE remediation technologies. 4.6.6 Advantages and Limitations
Potential advantages of MNA include the following: • like other in situ processes, reduced site disturbance and remediation waste generation; • biodegradation component can include destruction, rather than just cross-media transfer, of
contaminants; • can be useful in conjunction with, or after, active remediation; and • potentially lower costs than active remediation (if appropriately applied). Potential disadvantages include the following: • potentially longer time frames than for active remediation, and hence, increased monitoring
costs; • site characterization more complex and costly than for active remediation; • incomplete biodegradation could lead to temporary accumulation of intermediates that could
pose a risk to human health or the environment; • institutional controls may be needed to ensure long-term protectiveness; • potential may exist for continued contaminant migration; and • may be more difficult to gain public acceptance. 4.7 Cost Comparison Summary
Table 4-7 presents a comparison of the relative costs of various MTBE remediation technologies.
80

ITRC – Overview of Groundwater Remediation Technologies for MTBE and TBA February 2005
Table 4-7. Relative costs and durations of remedial technologies for MTBE and TBA in groundwater
Technology Character-ization
Capital cost (equipment
and construction)
Operation and
mainte-nance
Monitoring and
reporting
Time-frame
Ability to control process
Primary limitations
Pump and treat $$ $$–$$$ $$–$$$ $$ Months–years
High Sensitive to discharge requirements
Air sparging $–$$ $–$$ $–$$ $ Months–years
Moderate Fine grain material; fugitive emissions
In situ bioremedia-tion
$$$ $ $ $$–$$$ Months–years
Low–moderate
Accurate delivery; mixing
In situ chemical oxidation
$$–$$$ $$–$$$ $ $$ Days–months
Low–moderate
Accurate delivery; mixing
Phytoremedia-tion
$$ $$ $–$$ $$–$$$ Years Low Root depth and residence time; seasonality
Monitored natural attenuation
$$$ $ $ $$$ Years–decades
Low Timeframe; going to completion (e.g., meeting cleanup goals)
Note: Table applies to dissolved-phase (plume) remediation and is not specific to source zones. 5. SUMMARY AND CONCLUSIONS
MTBE has been added to gasoline in the United States since 1979. Widespread use of MTBE as an oxygenate in reformulated gasoline began in 1995. TBA has been less extensively added to gasoline but is often found in association with MTBE in groundwater since it is an intermediate by-product of the breakdown of MTBE. Releases of gasoline from LUSTs, subsurface vapor releases from USTs, surface spills, and other sources have resulted in sites with groundwater impacts from MTBE, requiring remedial action throughout the country. The higher content of MTBE in reformulated gasoline compared with benzene (typically 11% by volume versus <1%) and the higher solubility of MTBE (28 times that of benzene) can make MTBE the primary focus of any petroleum release. Analytical methods are available for the detection of MTBE and TBA. However, selection of method must consider the minimum detection limit required by the state or local regulatory agency. Although MTBE has a density less than that of water, when dissolved in water, MTBE responds to localized groundwater gradients and aquifer recharge. This effect can result in a “diving” contaminant plume and, if not taken into consideration, the inadvertent placement of monitoring wells above all or the major portion of the plume, thereby missing the plume. Consequently,
81

ITRC – Overview of Groundwater Remediation Technologies for MTBE and TBA February 2005
multilevel wells with relatively short well screens should be considered at MTBE sites to ensure correct plume characterization. In addition, geochemical characterization can aid in locating depth-discrete or conventional monitoring wells within the path of the plume. The leading edge of MTBE and TBA plumes frequently extends beyond that of the BTEX plume. In some instances (e.g., high groundwater velocity), MTBE and TBA plumes can separate from the BTEX plume, adding to the difficulty of plume detection and characterization. The determination of whether MTBE is the most significant contaminant in a petroleum-related plume depends on the configuration of the plume and the drinking water standards and/or MTBE action levels in the state where the plume is located. In states where the drinking water standard is high, such as Louisiana, MTBE seldom drives the remediation effort; however, in states such as California, Delaware, New York, and New Hampshire the MTBE concentration often controls the remedial effort to a greater degree than does benzene. The physical properties of ethers and alcohols such as MTBE and TBA are different from those of other gasoline components, and these properties must be considered in remediation design. The same technologies used for the remediation of nonoxygenated gasoline–contaminated sites can be used for the remediation of oxygenated gasoline–contaminated sites with some adjustments to the application of the technologies. The adjustments required are based on the properties of the compounds present. Groundwater remediation technologies shown to be effective for the treatment and removal of MTBE and TBA include ex situ technologies (pump and treat) and in situ technologies (air sparging, bioremediation, chemical oxidation, phytoremediation, and MNA). These technologies can treat both MTBE and TBA to concentrations acceptable in all states. However, the technologies chosen must be specific to the COC and cannot be applied equally to both contaminants. Conventional processes, such as air stripping and GAC, which are effective for MTBE treatment, are at best marginally effective for TBA treatment. P&T processes, which have been shown to have a lower effectiveness for petroleum contaminants, are effective in treating MTBE and TBA due to the low affinity these compounds have for organics in the soil and the ability to “flush” these contaminants from the soil. MTBE and TBA can be biologically degraded both under aerobic and anaerobic conditions and both in situ and ex situ, as part of a P&T process; however, degradation of MTBE can be incomplete, resulting in the formation of TBA. Generally, aerobic conditions have been shown to be far more effective in the complete treatment and removal of these compounds. The recalcitrant nature of MTBE may result in contaminated sites remaining open for longer periods of time and require monitoring of MTBE plumes over a larger area, as compared with BTEX plumes.
82

ITRC – Overview of Groundwater Remediation Technologies for MTBE and TBA February 2005
6. REFERENCES
ADEQ (Arizona Department of Environmental Quality). 1999. Draft Report of the Methyl Tertiary Butyl Ether (MTBE) Work Group.
AEHS (Association for Environmental Health and Sciences). 2001. AEHS Special Oxygenated Fuels Issue, Contaminated Soil Sediment and Water, spring issue.
APHA (American Public Health Association). 1998. Standard Methods for the Examination of Water and Wastewater. Washington, D.C.
API (American Petroleum Institute). 1993. Pump and Treat—The Petroleum Industry Perspective. Washington, D.C.
API. 1998. Ten Frequently Asked Questions about MTBE in Water. Technical Bulletin 3, Version 1.1. On the Internet at http://api-ep.api.org/filelibrary/ACF11E.pdf.
API. 2000. Strategies for Characterizing Subsurface Releases of Gasoline Containing MTBE. Publication 4699. On the Internet at http://api-ep.api.org/filelibrary/4699b.pdf.
ASTM (ASTM International). 2004a. Standard Guide for Accelerated Site Characterization for Confirmed or Suspected Petroleum Releases. E1912-98(2004). On the Internet at http://www.astm.org.
ASTM. 2004b. Standard Practice for Expedited Site Characterization of Vadose Zone and Ground Water Contamination at Hazardous Waste Contaminated Sites. D6235-04. On the Internet at http://www.astm.org.
Azadpour-Keeley, A. 2002. Envirogen Propane Biostimulation Technology for In-Situ Treatment of MTBE-Contaminated Ground Water.” EPA/600/R-02/092. On the Internet at http://www.epa.gov/ORD/NRMRL/Pubs/600R02092/600R02092.pdf.
Baehr, A. L., E. G. Charles, and R. J. Baker. 2001. “Methyl tert-Butyl Ether Degradation in the Unsaturated Zone and the Relation between MTBE in the Atmosphere and Shallow Ground Water,” Water Resources Research 37: 223–33.
Barker, J. F., R. W. Gillham, L. Lemon, C. I. Mayfield, M. Poulsen, and E. A. Sudicky. 1991. Chemical Fate and Impact of Oxygenates in Groundwater-Solubility of BTEX from Gasoline-Oxygenate Compounds. API Publication 4531. Washington, D.C.
Bass, D. H., N. A. Hastings, and R. A. Brown. 2000. “Performance of Air Sparging Systems: A Review of Case Studies,” Journal of Hazardous Materials 72: 101–19.
Bauman, B. 2003. Do We Need to Worry about MTBE Acid Hydrolysis? L.U.S.T. Line Bulletin 43. Lowell, Mass.: New England Interstate Water Pollution Control Commission.
Black, L., and D. Fine. 2001. “High Levels of Monoaromatic Compounds Limit the Use of Solid-Phase Microextraction of Methyl tert-Butyl Ether and tert-Butyl Alcohol,” Environmental Science and Technology 35(15): 3190–92.
Bouwer, E. J., and P. L. McCarty. 1984. “Modeling of Trace Organics Biotransformation in the Subsurface,” Ground Water 22: 433–40.
Bradley, P. M., F. H. Chapelle, and J. E. Landmeyer. 2001a. “Methyl t-Butyl Ether Mineralization in Surface-Water Sediment Microcosms under Denitrifying Conditions,” Applied and Environmental Microbiology, 67(4): 1975–78.
Bradley, P. M., F. H. Chapelle, and J. E. Landmeyer. 2001b. “Effect of Redox Conditions on MTBE Biodegradation in Surface Water Sediments,” Environmental Science and Technology 35(23): 4643–47.
Bradley, P. M., F. H. Chapelle, and J. E. Landmeyer. 2002. “TBA Biodegradation in Surface Water Sediments under Aerobic and Anaerobic Conditions,” Environmental Science and Technology 36(19): 4087–90.
83

ITRC – Overview of Groundwater Remediation Technologies for MTBE and TBA February 2005
Brooks, F. C., D. L. Rose, M. C. Noriega, L. K. Nurtagh, and S. R. Abney. 1998. Method of Analysis by the USGS National Water Quality Laboratory—Determination of 86 Volatile Organic Compounds in Water by Capillary Gas Chromatography/Mass Spectrometry, including Detections Less than Reporting Limits. U.S. Geological Survey Open File Report 97-829.
Brown, K., L. Tyner, D. Grainger, and T. Perina. 2001. “Impact of Natural Attenuation and Phytoremediation on MTBE and Fuel,” in Bioremediation of MTBE, Alcohols, and Ethers. Proceedings, Sixth International In Situ and On-Site Bioremediation Symposium, V. Magar, J. T. Gibbs, K. T. O’Reilly, M. R. Hyman, and A. Leeson, eds., pp. 51–58. Columbus, Ohio: Battelle Press.
Bruce, C. L., C. D. Gilbert, R. L. Johnson, and P. C. Johnson. 1998. “Methyl tert-Butyl Ether Removal by In Situ Air Sparging in Physical Model Studies,” in Proceedings, First International Conference on Remediation of Chlorinated and Recalcitrant Compounds, Monterey, Calif., May 18–21, pp. 293–98. Columbus, Ohio: Battelle Press.
Bruell, C. J., M. C. Marley, and H. Hopkins. 1997. “American Petroleum Institute Air Sparging Database,” Journal of Soil Contamination 6(2): 169–85.
Butler, J. J, J. M. Healey, G. W. McCall, E. J. Garnett, and S. P. Loheide II. 2002. “Hydraulic Tests with Direct-Push Equipment,” Ground Water 40(1): 25–36.
Butler, J. J., J. M. Healey, L. Zheng, W. McCall, and M. K. Schulmeister. 1999. Hydrostratigraphic Characterization of Unconsolidated Alluviual Deposits with Direct-Push Sensor Technology. Kansas Geological Survey, Open File Report 99-40. On the Internet at http://www.kgs.ku.edu/Hydro/Publications/OFR99_40/index.html.
California EPA. 2000. Guidelines for Investigation and Cleanup of MTBE and Other Ether-Based Oxygenates. Final draft (March 27).
Cassada, D. A., Y. Zhang, D. D. Snow, and R. F. Spalding. 2000. “Trace Analysis of Ethanol, MTBE, and Related Oxygenate Compounds in Water Using Solid-Phase Microextraction and Gas Chromatography/Mass Spectrometry,” Analytical Chemistry 72(19): 4654–58.
Church, C. D., L. M. Isabelle, J. F. Pankow, D. L. Rose, and P. G. Tratnyek. 1997. “Method for Determination of Methyl tertiary-Butyl Ether and Its Degradation Products in Water,” Environmental Science and Technology 31(12): 3723–26.
Church, C. D., P. G. Tratnyek, K. M. Scow. 2000. “Pathways for the Degradation of MTBE and Other Fuel Oxygenates by Isolate PM1,” American Chemical Society, Division of Environmental Chemistry, Preprints of Extended Abstracts 40(1): 261–63.
CMRP (California MTBE Research Partnership). 2000. Treatment Technologies for Removal of Methyl Tertiary Butyl Ether (MTBE) from Drinking Water. Fountain Valley, Calif.: Center for Groundwater Restoration and Protection, National Water Research Institute.
Cookson, J., and K. L. Sperry. 2002. “In Situ Chemical Oxidation: Design and Implementation.” NJDEP and ITRC Classroom Training (October 30).
CRTC (Chevron Research and Technology Company). 2001. Phytoremediation Technology Bulletin, Groundwater Application, Vers. 2.0.
Dakhel, N., G. Pasteris, D. Werner, and P. Hohener. 2003. “Small Volume Releases of Gasoline in the Vadose Zone: Impact of the Additives MTBE and Ethanol on Groundwater Quality,” Environmental Science and Technology 10: 2127–33.
Dean, J. (ed.). 1999. Lange’s Handbook of Chemistry. 15th ed. McGraw-Hill.
84

ITRC – Overview of Groundwater Remediation Technologies for MTBE and TBA February 2005
Deeb, R. A., H.-Y. Hu., J. R. Hanson, K. M. Scow, and L. Alvarez-Cohen. 2001. “Substrate Interactions in BTEX and MTBE Mixtures by an MTBE-Degrading Isolate,” Environmental Science and Technology 35(20): 312–17.
Deeb, R. A., S. Nishino, J. Spain, H.-Y. Hu, K. Scow, and L. Alvarez Cohen 2000. “MTBE and Benzene Biodegradation by a Bacterial Isolate via Two Independent Monooxygenase-Initiated Pathways,” American Chemical Society, Division of Environmental Chemistry, Preprints of Extended Abstracts 40(1): 280-282
Deeb, R. A., K. Scow, and L. Alvarez-Cohen. 2000. “Aerobic MTBE Biodegradation: An Examination of Past Studies, Current Challenges and Future Research Directions,” Biodegradation 11(2–3): 171–86.
Dernbach, L. S. 2000. “The Complicated Challenge of MTBE Cleanups,” Environmental Science and Technology 34(23): 516A–21A.
Dey, J. C., P. A. Rosenwinkel, and K. P. Wheeler. 2002. “In Situ Remediation of MTBE Utilizing Ozone,” Remediation Journal, winter issue.
Doty, C. B., and C. C. Travis. 1991. The Effectiveness of Groundwater Pumping as a Restoration Technology. Knoxville, Tenn.: University of Tennessee, Waste Management Research and Education Institute.
E&E (Ecology and Environment, Inc.). 1999. Draft Summary of MTBE Treatment Technologies under Evaluation at Santa Monica Arcadia Wellfield and Charnock Sub-Basin Sites. For the U.S. Environmental Protection Agency.
Ekwurzel, B., J. E. Moran, C. J. Koester, M. L. Davisson, and G. F. Eaton. 2002. “Nonpoint Source Methyl tert-Butyl Ether Movement through the Environment: Ultra-Low Level (ppt) Measurements in California,” American Chemical Society Symposium Series 799: 17–27.
ESTCP (Environmental Security Technology Certification Program). 2003a. In-Situ Bioremediation of MTBE in Groundwater. ESTCP Cost and Performance Report CU-0013. On the Internet at http://www.estcp.org/documents/techdocs/CU-0013.pdf.
ESTCP. 2003b. In-Situ Remediation of MTBE Contaminated Aquifers Using Propane Biosparging. ESTCP Cost and Performance Report CU-0015. On the Internet at http://www.estcp.org/documents/techdocs/CU-0015.pdf.
Evans, J. D., and M. R. Closman. 2003. “A GC-MS Purge Trap Method Comparison Study for MTBE Analysis in Groundwater,” LCGC North America 21(1): 42–52. On the Internet at http://www.lcgcmag.com/lcgc/article/articleDetail.jsp?id=50278.
Federal Register. 1986. “Identification and Listing of Hazardous Waste; Final Exclusion and Final Organic Leachate Model (OLM), Hazardous Waste Management Systems.” 51: 41088.
Federal Register. 1997. “Announcement of the Draft Drinking Water Contaminant List.” 62: 52193–219.
Federal Register. 1998. “Announcement of the Drinking Water Contaminant List.” 63: 10273. Federal Register. 2003. “Announcement of Regulatory Determinations for Priority Contaminants
on the Drinking Water Contaminant Candidate List.” 68(138). Finneran, K. T., and D. R. Lovley. 2001. “Anaerobic Degradation of Methyl tert-Butyl Ether
(MTBE) and tert-Butyl Alcohol (TBA),” Environmental Science and Technology 35(9): 1785–90.
Fortin, N. Y., M. Morales, Y. Nakagawa, D. D. Focht, and M. A. Deschusses. 2001. “Methyl tert-Butyl Ether (MTBE) Degradation by a Microbial Consortium,” Environmental Microbiology 3(6): 407–16.
85
ITRC – Overview of Groundwater Remediation Technologies for MTBE and TBA February 2005
FRTR (Federal Remediation Technologies Roundtable). 2001. “Air Sparging (In Situ Ground Water Remediation Technology).” On the Internet at
http://www.frtr.gov/matrix2/section4/4_38.html. FRTR. 2002. “Remediation Technologies Screening Matrix and Reference Guide,” Vers. 4. On
the Internet at http://www.frtr.gov/. FRTR. 2003. “Remedial Technologies Screening Matrix—Chemical Oxidation.” On the Internet
at http://www.frtr.gov/matrix2/section4/4_4.html. Garnier, P. M., R. Auria, C. Augur, and S. Revah. 1999. “Cometabolic Biodegradation of Methyl
t-Butyl Ether by Pseudomonas aeruginosa Grown on Pentane,” Applied Microbiology and Biotechnology 51(4): 498–503.
Geoprobe Systems. N.d. “Membrane Interface Probe (MIP).” On the Internet at http://www.geoprobe-di.com/mip.htm.
Glass, D. 1998. The 1998 United States Market for Phytoremediation. Needham, Mass.: D. Glass Associates, Inc.
Gorelick, S. M., R. A. Freeze, D. Donohue, and J. F. Keely. 1993. Groundwater Contamination: Optimal Capture and Containment. Boca Raton, Fla.: Lewis.
Gray, J. R., G. Lacrampe-Couloume, D. Gandhi, K. M. Scow, R. D. Wilson, D. M. Mackay, and B. S. Lollar. 2002. “Carbon and Hydrogen Isotopic Fractionation during Biodegradation of Methyl tert-Butyl Ether,” Environmental Science and Technology 36(9): 1931–38.
Happel, A. M., E. H. Beckenbach, and R. U. Halden. 1998. An Evaluation of MTBE Impacts to California Groundwater Resources. UCRL-AR-130897. Livermore, Calif.: Lawrence Livermore National Laboratory.
Harbaugh, A. W., E. R. Banta, M. C. Hill, and M. G. McDonald. 2000. MODFLOW-2000, the U.S. Geological Survey Modular Ground-Water Model—User Guide to Modularization Concepts and the Ground-Water Flow Process. U.S. Geological Survey Open File Report 00-92.
Hardison, L. K., S. S. Curry, L. M. Ciuffetti, and M. R. Hyman. 1997. “Metabolism of Diethyl Ether and Cometabolism of Methyl tert-Butyl Ether by a Filamentous Fungus, a Graphium sp.,” Applied and Environmental Microbiology 63(8): 3059–67.
Hattan, G., B. Wilson, and J. Wilson. 2003. “Performance of Conventional Remedial Technology for Treatment of MTBE and Benzene at UST Sites in Kansas,” Remediation: The Journal of Environmental Cleanup Costs, Technologies and Techniques 14(1): 85–94.
Hubbard C. E., J. F Barker, S. F. O’Hannesin, M. Vandegriendt, and R. W. Gillham. 1994. Transport and Fate of Dissolved Methanol, Methyl tertiary-Butyl Ether, and Monoaromatic Hydrocarbons in a Shallow Sand Aquifer. API Publication 4601. Washington, D.C.
Hunkeler, D., B. J. Butler, R. Aravena, and J. F. Barker. 2001. “Monitoring Biodegradation of Methyl tert-Butyl Ether (MTBE) Using Compound-Specific Carbon Isotope Analysis,” Environmental Science and Technology 35(4): 676–81.
Hyman, M. R., and K. O’Reilly. 1999. “Physiological and Enzymatic Features of MTBE-Degrading Bacteria,” in In Situ Bioremediation of Petroleum Hydrocarbons and Other Organic Compounds, B. C. Alleman and A. Leeson, eds., pp. 7–12. Columbus, Ohio: Battelle Press.
Integrated Science and Technology, Inc. 1999. “Comparative MtBE Versus Benzene Plume Behavior: BP Oil Company Florida Facilities.” Cleveland, Ohio.
86
ITRC – Overview of Groundwater Remediation Technologies for MTBE and TBA February 2005
ITRC (Interstate Technology & Regulatory Council). 1997. ITRC/ASTM Partnership for Accelerated Site Characterization Summary Report. ASC-1. On the Internet at http://www.itrcweb.org.
ITRC. 1999. Phytoremediation Decision Tree. On the Internet at http://www.itrcweb.org. ITRC. 2001a. Technical and Regulatory Guidance for In Situ Chemical Oxidation of
Contaminated Soil and Groundwater. ISCO-1. On the Internet at http://www.itrcweb.org. ITRC. 2001b. Phytotechnology Technical and Regulatory Guidance Document. On the Internet
at http://www.itrcweb.org. ITRC. 2002a. Recommendations for the Use of Polyethylene Diffusion Bag Samplers for the
Long Term Monitoring of Volatile Organic Compounds in Groundwater—Final Report. On the Internet at http://ds.itrcweb.org/DS_positionpaper_Final_Report.pdf.
ITRC. 2002b. “In Situ Chemical Oxidation: Design and Implementation Training.” New Jersey Department of Environmental Protection (October 30).
ITRC. 2002c. A Systematic Approach to In Situ Bioremediation, including Decision Trees on In Situ Bioremediation for Nitrates, Carbon Tetrachloride, and Perchlorate. ISB-8. On the Internet at http://www.itrcweb.org.
Javandel, I., and C.-F. Tsang. 1986. “Capture-Zone Type Curves: A Tool for Aquifer Cleanup,” Ground Water 24(5): 616–25.
Johnson, P. C. 1998. “Assessment of the Contributions of Volatilization and Biodegradation to In Situ Air Sparging Performance,” Environmental Science and Technology 32(2): 276–81.
Johnson, P. C., M. W. Kemblowski, and J. D. Colthart. 1990. “Quantitative Analysis for the Cleanup of Hydrocarbon-Contaminated Soils by In Situ Soil Venting,” Ground Water 28(3): 413–29.
Johnson, P. C., A. Leeson, R. L. Johnson, C. M. Vogel, R. E. Hinchee, M. Marley, T. Peargin, C. L. Bruce, I. L. Amerson, C. T. Coonfare, and R. D. Gillespie. 2001. “A Practical Approach for the Selection, Pilot Testing, Design, and Monitoring of In Situ Air Sparging/Biosparging Systems,” Bioremediation Journal 5(4): 267–81.
Johnson, P. C., K. D. Miller, C. L. Bruce. 2004. A Practical Approach to the Design, Monitoring, and Optimization of In Situ MTBE Aerobic Biobarriers. TR-2257-ENV. Naval Facilities Engineering Service Center, sponsored by the Environmental Security Technology Certification Program.
Johnson, P. C., C. C. Stanley, M. W. Kemblowski, D. L. Byers, and J. D. Colthart. 1990. “A Practical Approach to the Design, Operation, and Monitoring of In Situ Soil-Venting Systems,” Ground Water Monitoring Review 10(2): 159–78.
Johnson, R. L., P. C. Johnson, D. B. McWhorter, R. Hinchee, and I. Goodman. 1993. “An Overview of In Situ Air Sparging,” Ground Water Monitoring and Remediation 13(4): 127–35.
Kelley, K. L., M. C. Marley, and K. L. Sperry. 2002. “In-Situ Chemical Oxidation of MTBE,” Contaminated Soil Sediment and Water July/August: 36–40.
Kirtland, B. C., and C. M. Aelion. 2000. “Petroleum Mass Removal from Low-Permeability Sediment Using Air Sparging/Soil Vapor Extraction: Impact of Continuous or Pulsed Operation,” Journal of Contaminant Hydrology 41: 367–83.
Koenigsberg, S., C. Sandefur, W. Mahaffey, M. Deshusses, and N. Fortin. 1999. “Peroxygen-Mediated Bioremediation of MTBE,” in Proceedings of the Fifth International In Situ and On-Site Bioremediation Symposium, B. C. Alleman and A. Leeson, eds., Vol. 3, pp. 13–18, Columbus, Ohio: Battelle Press.
87
ITRC – Overview of Groundwater Remediation Technologies for MTBE and TBA February 2005
Koenigsberg, S., and W. Mahaffey. 2001. “The Use of Oxygen Release Compound for Bioremediation of MTBE.” Contaminated Soil Sediment and Water, spring special issue: 42.
Kolhatkar, R., T. Kuder, P. Philip, J. Allen, and J. T. Wilson. 2002. “Use of Compound-Specific Stable Carbon Isotope Analyses to Demonstrate Anaerobic Biodegradation of MTBE in Groundwater at a Gasoline Release Site,” Environmental Science and Technology 36(23): 5139–46.
Kolhatkar, R., J. Wilson, and L. E. Dunlap. 2000. “Evaluating Natural Biodegradation of MTBE at Multiple LUST Sites,” in Proceedings, API/NWGA/STEP Conference on Petroleum Hydrocarbons and Organic Chemicals in Ground Water: Prevention, Detection and Remediation, pp. 32–49. American Petroleum Institute and National Ground Water Association.
Kolhatkar, R., Wilson, J. and G. Hinshalwood. 2001. “Natural Biodegradation of MTBE at a Site on Long Island, NY,” Proceedings, Conference on In Situ and On-Site Bioremediation: The Sixth International Symposium, San Diego.
Kopfler, F. C., R. G. Melton, R. D. Lingg, and W. E. Coleman. 1976. “GC/MS Determination of Volatiles for the National Organics Reconnaissance Survey (NORS) of Drinking Water,” in Identification and Analysis of Organic Pollutants in Water, L. H. Keith, ed.. Ann Arbor, Mich.: Ann Arbor Science Publishers.
Kovacs, D. A., and D. H Kampbell. 1999. “Improved Method for the Storage of Groundwater Samples Containing Volatile Organic Analytes,” Archives of Environmental Contamination and Toxicology 36(3): 242–47.
Kram, M. 2001. Performance Comparison: Direct-Push Wells Versus Drilled Wells. TR-2120-ENV. Washington, D.C.: Naval Facilities Engineering Service Center.
Kuder, T., J. T. Wilson, P. Kaiser, R. Kolhatkar, P. Philp, and J. Allen. N.d. “Enrichment of Stable Carbon and Hydrogen Isotopes during Anaerobic Biodegradation of MTBE—Microcosm and Field Evidence,” Environmental Science and Technology (in press).
Landmeyer, J. E., F. H. Chapelle, P. M. Bradley, J. F. Pankow, C. D. Church, and P. G. Tratnyek. 1998. “Fate of MTBE Relative to Benzene in a Gasoline-Contaminated Aquifer (1993–1998),” Ground Water Monitoring and Remediation 18(4): 93–102.
Landmeyer, J. E., F. H Chapelle, H. H. Herlong, and P. M. Bradley. 2001. “Methyl tert-Butyl Ether Biodegradation by Indigenous Aquifer Microorganisms under Natural and Artificial Oxic Conditions,” Environmental Science and Technology 35(6): 1118–26.
Landmeyer, J. E., Vroblesky, D. A., and Bradley, P. M. 2000. “MTBE and BTEX in Trees above Gasoline-Contaminated Ground Water,” in Case Studies in the Remediation of Chlorinated and Recalcitrant Compounds, pp. 17–24. Columbus, Ohio: Battelle Press.
Lahvis, M. A., and L. C. Rehmann. 2000. Simulation of Transport of Methyl tert-Butyl Ether (MTBE) to Groundwater from Small Volume Releases of Gasoline in the Vadose Zone. Soil and Groundwater Research Bulletin No. 10. Washington, D.C.: American Petroleum Institute.
Leeson, A., and R. E. Hinchee. 1996. Soil Bioventing: Principles and Practice. Boca Raton, Fla.: CRC Press.
Leeson, A., P. C. Johnson, R. L. Johnson, C. M. Vogel, R. E. Hinchee, M. Marley, T. Peargin, C. L. Bruce, I. L. Amerson, C. T. Coonfare, R. D. Gillespie, and D. B. McWhorter. 2002. Air Sparging Design Paradigm. Prepared for Environmental Security Technology Certification Program. On the Internet at http://www.estcp.org/documents/techdocs/Air_Sparging.pdf.
88

ITRC – Overview of Groundwater Remediation Technologies for MTBE and TBA February 2005
Leethem, J. T. 2002. “In-Situ Chemical Oxidation of MTBE: A Case Study of the Successful Remediation of a Large Gasoline Release,” Contaminated Soil Sediment and Water July/August: 55–58.
Lin, Z., J. T. Wilson, and D. D. Fine. 2003. “Avoiding Hydrolysis of Fuel Ether Oxygenates during Static Headspace Analysis,” Environmental Science and Technology 37(21): 4994–5000.
Mace, R. E., and W.-J. Choi. 1998. “The Size and Behavior of MTBE Plumes in Texas,” Proceedings, API/NWGA/STEP Conference on Petroleum Hydrocarbons and Organic Chemicals in Ground Water—Prevention, Detection, and Remediation Conference, A. Stanley, ed., pp. 1–11. American Petroleum Institute and National Ground Water Association.
Mace, R. E., R. S. Fisher, D. M. Welch, and S. P. Parra. 1997. Extent, Mass, and Duration of Hydrocarbon Plumes from Leaking Underground Petroleum Storage Tank Sites in Texas. Geologic Circular 97-1. Austin, Tex.: The University of Texas, Bureau of Economic Geology.
Mackay, D. M., R. D. Wilson, C. Naas, I. Wood, K. Scow, A. Smith, D. Gandhi, K. Hristova, B. Watanabe, and M. Einarson. 2002. “In Situ Treatment of MTBE-Contaminated Groundwater at Two Sites in California,” Groundwater Quality: Natural and Enhanced Restoration of Groundwater Pollution, Proceedings, Groundwater Quality 2001 Conference, Sheffield, U.K., June 2001. IAHS Pub. No. 275, pp. 333–39. Abstract on the Internet at http://www.cig.ensmp.fr/~iahs/redbooks/a275/27550.htm.
Massmann, J., and D. F. Farrier. 1992. “Effects of Atmospheric Pressures on Gas Transport in the Vadose Zone,” Water Resources Research 28(3): 777–91.
McGrath, A. E., and K. T. O’Reilly. 2003. “Rapid Evaluation of In-Situ Chemical Oxidation.” Appendix 4-3 of MTBE Technology Demonstration Program Report. ChevronTexaco Energy Research and Technology Company and SECOR International, Inc.
McLoughlin, P. 2002. Presentations by Microseeps for U.S. Environmental Protection Agency, Nov. 8, 2001 and Feb. 26, 2002.
McLoughlin, P., R. Pirkle, T. E. Buscheck, R. Kolhatkar, and N. Novick. 2001. “Redox Conditions at Fuel Oxygenate Release Sites,” in Bioremediation of MTBE, Alcohols, and Ethers. Proceedings, Sixth International In Situ and On-Site Bioremediation Symposium, V. S. Magar, J. T. Gibbs, K. T. O’Reilly, M. R. Hyman, and A. Leeson, eds., pp. 35–42. Columbus, Ohio: Battelle Press.
Miller, K. 2002. “Large-Scale In Situ Biobarrier for MTBE Remediation at NBVC, Port Hueneme, California, Naval Facilities Engineering Service Center,” presented at Biological Treatment of MTBE Contamination in Groundwater: Ex Situ and In Situ Challenges, the Fifth Symposium on Groundwater Contaminants, San Jose, Calif. Groundwater Resources Association of California with the Santa Clara Valley Water District.
Mortensen, A. P., K. H. Jesen, T. O. Sonnenborg, and E. Arvin. 2000. “Laboratory and Numerical Investigations of Air Sparging Using MTBE as a Tracer,” Ground Water Monitoring and Remediation 16(4): 87–97.
Moyer, E. E., and P. T. Kostecki (eds.). 2003. MTBE Remediation Handbook. Amherst, Mass.: Amherst Scientific Publishers.
National Science and Technology Council. 1997. Interagency Assessment of Oxygenated Fuels. Washington, D.C.: Office of Science and Technology Policy, The Executive Office of the President.
89

ITRC – Overview of Groundwater Remediation Technologies for MTBE and TBA February 2005
NFESC (Naval Facilities Engineering Service Center) and Battelle. 2001. Air Sparging Guidance Document. NFESC TR-2193-ENV. Port Hueneme, Calif. and Columbus, Ohio.
Newell, C. J., R. K. McLeod, and J. Gonzales. 1996. BIOSCREEN Natural Attenuation Decision Support System. EPA/600/R-96/087. On the Internet at
http://www.epa.gov/ada/csmos/models/bioscrn.htmlNewell, C. J, H. S. Rifai, J. T. Wilson, J. A. Connor, J. A. Aziz, and M. P. Suarez. 2002.
Calculation and Use of First-Order Rate Constants for Monitored Natural Attenuation Studies. U.S. Environmental Protection Agency Ground Water Issue EPA/540/S-02/500. On the Internet at http://www.epa.gov/ada/download/issue/540S02500.pdf.
Newman, L., M. P. Gordon, P. Heilman, D. L. Cannon, E. Lory, K. Miller, J. Osgood, and S. E. Strand. 1999. “Phytoremediation of MTBE at a California Naval Site.” Soil and Groundwater Cleanup February/March: 42–45.
NRC (National Research Council). 1990. Ground Water Models: Scientific and Regulatory Applications. Washington, D.C.: National Academy Press.
NRC. 1993. In Situ Bioremediation: When Does It Work? Washington, D.C.: National Academy Press.
NRC. 1994. Alternatives for Ground Water Cleanup. Washington, D.C.: National Academy Press. NRC. 2000. Natural Attenuation for Groundwater Remediation. Washington, D.C.: National
Academy Press. O’Reilly, K. T., M. E. Moir, C. D. Taylor, C. A. Smith, and M. R. Hyman. 2001. “Hydrolysis of
tert-Butyl Methyl Ether (MTBE) in Dilute Aqueous Acid,” Environmental Science and Technology 35(19): 3954–61.
Oxygenated Fuels Association. 2003. MTBE Technical Bulletin. Washington, D.C. Pope, D. F., S. D. Acree, H. Levine, S. Mangion, J. van Ee, K. Hurt, and B. Wilson. 2004.
Performance Monitoring of MNA Remedies for VOCs in Ground Water. EPA/600/R-04/027. Cincinnati: U.S. Environmental Protection Agency, Office of Research and Development, National Risk Management Research Laboratory. On the Internet at
http://www.epa.gov/ada/pubs/reports.htmlPotter, T. L. 1996. “Analysis of Petroleum-Contaminated Water by GC/FID with Direct Aqueous
Injection,” Groundwater Monitoring and Remediation 16(3): 157–62. Ramstad, T., and T. J. Nestrick. 1981. “Determination of Polar Volatiles in Water by Volatile
Organics Analysis,” Water Research 15(3): 375–81. Regenesis. 2002. Potential for the Bioremediation of MTBE. ORC Technical Bulletin #2.2.3.1.
On the Internet at http://www.regenesis.com/resources/bulletins/orc.aspx. Robbins, G. A. 2001. Expedited Site Assessment: The CD. Hartford, Conn.: Connecticut
Department of Environmental Protection. On the Internet at http://web.uconn.edu/esacd. Rong, Y., and H. B. Kerfoot. 2003. “Much Ado: How Big Is the Problem of Hydrolysis of
Methyl tertiary Butyl Ether to Form tertiary Butyl Alcohol (tBA)?” Environmental Forensics 4: 239–43.
Rutherford, K. W. and P. C. Johnson. 1996. “Effects of Process Control Changes on Aquifer Oxygenation Rates during In Situ Air Sparging,” Ground Water Monitoring and Remediation 16(4): 132–41.
Salanitro, J. P., L. A. Diaz, M. P. Williams, and H. L. Wisniewski. 1994. “Isolation of a Bacterial Culture that Degrades Methyl t-Butyl Ether,” Applied and Environmental Microbiology 60(7): 2593–96.
90

ITRC – Overview of Groundwater Remediation Technologies for MTBE and TBA February 2005
Salanitro, J. P., P. C. Johnson, G. E. Spinnler, P. M. Maner, H. L. Wisniewski, and C. Bruce. 2000. “Field-Scale Demonstration of Enhanced MTBE Bioremediation through Aquifer Bioaugmentation and Oxygenation,” Environmental Science and Technology 34(19): 4152–62.
Salanitro, J. P., and H. L. Wisniewski. 1996. “Observations on the Biodegradation and Bioremediation Potential of Methyl t-Butyl Ether,” in Proceedings, 17th Annual Meeting of the Society of Environmental Toxicology and Chemistry, Washington, D.C.
Schirmer, M. and J. Barker. 1998. “A Study of Long-Term MTBE Attenuation in the Borden Aquifer, Ontario, Canada,” Ground Water Monitoring and Remediation 18(2): 113–22.
Schirmer, M., B. J. Butler, J. F. Barker, C. D. Church, and K. Schirmer. 1999. “Evaluation of Biodegradation and Dispersion as Natural Attenuation Processes of MTBE and Benzene at the Borden Field Site,” Physics and Chemistry of the Earth (B) 24(6): 557–60.
Schirmer, M., B. J. Butler, C. D. Church, J. F. Barker, and N. Nadarajah. 2003. “Laboratory Evidence of MTBE Biodegradation in Borden Aquifer Material,” Journal of Contaminant Hydrology 60(3–4): 229–49.
Schmidt, T. C., M. Schirmer, H. Weiß, S. B. Haderlein. 2004. “Microbial Degradation of Methyl tert-Butyl Ether and tert-Butyl Alcohol in the Subsurface,” Journal of Contaminant Hydrology 70: 173–203.
Schulmeister, M. K., J. J. Butler, J. M. Healey, L. Zheng, D. A. Wysocki, and G. W. McCall. 2003. “Direct-Push Electrical Conductivity Logging for High-Resolution Hydrostratigraphic Characterization,” Ground Water Monitoring and Remediation 23(3): 52–62.
Shell Global Solutions (US) Inc. 2003. Study of Tert-Butyl Alcohol (TBA) at Selected Underground Storage Tank Remediation Project Sites in Orange County, California. Prepared for S. J. Daugherty, Orange County Health Care Agency, Santa Ana, Calif.
Shorr, G. L., and H. S. Rifai. 2002. “Characterizing the Intrinsic Remediation of MTBE at Field Sites in Texas,” in Proceedings, Third International Battelle Conference on Remediation of Chlorinated and Recalcitrant Compounds, Monterey, Calif., A. R. Gavaskar and A. S. C. Chen, eds. Columbus, Ohio: Battelle Press.
Smith, C. A., K. O’Reilly, and M. R. Hyman. 2003. “Cometabolism of Methyl tertiary Butyl Ether and Gaseous n-Alkanes by Pseudomonas mendocina KR-1 Grown on C5 to C8 n-Alkanes,” Applied and Environmental Microbiology 69(12): 7385–94.
Somsamak, P., R. M. Cowan, and M. M. Haggblom. 2001. “Anaerobic Biotransformation of Fuel Oxygenates under Sulfate-Reducing Conditions,” FEMS Microbiology Ecology 37: 259–64.
Steffan, R., P. Hatzinger, Y. Farhan, and S. Drew. 2001. “In Situ and Ex Situ Biodegradation of MTBE and TBA,” in Proceedings, Conference on Petroleum Hydrocarbons and Organic Chemicals in Ground Water: Prevention, Detection and Remediation, pp. 252–64. American Petroleum Institute and National Ground Water Association.
Steffan, R. J., K. McClay, S. Vainberg, C. W. Condee, and D. Zhang. 1997. “Biodegradation of the Gasoline Oxygenates Methyl tert-Butyl Ether, Ethyl tert-Butyl Ether, and tert-Amyl Methyl Ether by Propane-Oxidizing Bacteria,” Applied and Environmental Microbiology 63(11): 4216–22.
Stephanatos, B. N., K. Walter, A. Funk, and A. MacGregor, 1991. “Pitfalls Associated with the Assumption of a Constant Partition Coefficient in Modeling Sorbing Solute Transport through the Subsurface,” Proceedings, International Symposium on Ground Water, Nashville, Tenn., pp. 13–20. American Society of Civil Engineers.
91
ITRC – Overview of Groundwater Remediation Technologies for MTBE and TBA February 2005
Stocking, A., R. A. Deeb, A. Flores, W. Stringfellow, J. Talley, R. Brownell, and M. Kavanaugh. 2000. “Bioremediation of MTBE: A Review from a Practical Perspective,” Biodegradation 11(2–3): 187–201.
Subsurface Contaminants Focus Area. 1999. In Situ Chemical Oxidation Using Potassium Permanganate. Innovative Technology Summary Report DOE/EM-0496. U.S. Department of Energy, Office of Environmental Management.
SWRCB (State Water Resources Control Board). 2000. Guidelines for Investigation and Cleanup of MTBE and Other Ether-Based Oxygenates, final draft. California Environmental Protection Agency, Water Quality Division. On the Internet at
http://www.swrcb.ca.gov/ust/cleanup/docs/mtbe_finaldraft.pdf. USEPA (U.S. Environmental Protection Agency). 1985. Modeling Remedial Actions at
Uncontrolled Hazardous Waste Sites. EPA/540/2-85-001. Risk Reduction Engineering Laboratory.
USEPA. 1986. “Hazardous Waste Management Rule: Final Organic Leachate Model (OLM).” 51 FR 41100. Washington D.C.: Office of Solid Waste and Emergency Response.
USEPA. 1988. Guidance on Remedial Actions for Contaminated Ground Water at Superfund Sites. EPA/540/G-88-003. Washington D.C.: Office of Solid Waste and Emergency Response.
USEPA. 1989a. Evaluation of Groundwater Extraction Remedies, Volume 1: Summary Report. EPA/540/2-89-054a.
USEPA. 1989b. Evaluation of Groundwater Extraction Remedies, Volume 2: Case Studies. EPA/540/2-89-054b.
USEPA. 1989c. Evaluation of Groundwater Extraction Remedies, Volume 3: General Site Data, Data Base Reports. EPA/540/2-89-054c.
USEPA. 1990. Basics of Pump-and-Treat Ground-Water Remediation Technology, R. S. Kerr, ed. EPA/600/8-90-003. Environmental Research Laboratory.
USEPA. 1992. A Technology Assessment of Soil Vapor Extraction and Air Sparging. EPA/600/R-92-173. Washington, D.C.: Office of Research and Development.
USEPA. 1993. Guidelines for Delineation of Wellhead Protection Areas. EPA/440/5-93-001. Washington, D.C.: Office of Water, Office of Ground Water Protection.
USEPA. 1996. VLEACH: A One-Dimensional Finite Difference Vadose Zone Leaching Model (Version 2.2a). Washington, D.C.: Office of Research and Development, Center for Subsurface Modeling Support.
USEPA. 1997a. Drinking Water Advisory: Consumer Acceptability Advice and Health Effects Analysis on Methyl Tertiary-Butyl Ether (MtBE), EPA-822-F-97-009. Washington, D.C.: Office of Water. On the Internet at http://www.epa.gov/OST/drinking/mtbe.html.
USEPA. 1997b. Expedited Site Characterization Tools for Underground Storage Tank Sites: A Guide for Regulators. EPA/510/8-97-001. Washington, D.C.: Office of Solid Waste and Emergency Response, Office of Underground Storage Tanks.
USEPA. 1999a. Multi-Phase Extraction: State-of-the-Practice. EPA-542-R-99-004. USEPA. 1999b. Understanding Variation in Partition Coefficient, Kd, Values, Volume I: The Kd
Model, Methods of Measurement, and Application of Chemical Reaction Codes. EPA/402/R-99-004A. Washington, D.C.: Office of Solid Waste and Emergency Response, Office of Radiation and Indoor Air.
92
ITRC – Overview of Groundwater Remediation Technologies for MTBE and TBA February 2005
USEPA. 1999c. Use of Monitored Natural Attenuation at Superfund, RCRA Corrective Action, and Underground Storage Tank Sites. OSWER Directive 9200.4. Washington, D.C.: Office of Solid Waste and Emergency Response.
USEPA. 2000a. Engineered Approaches to In Situ Bioremediation of Chlorinated Solvents: Fundamentals and Field Applications. EPA/542/R-00-008.
USEPA. 2000b. Introduction to Phytoremediation. EPA/600/R-99/107. USEPA. 2001a. “Average Borehole Concentrations.” On the Internet at http://www.epa.gov/athens/learn2model/part-two/onsite/abc.htm. USEPA. 2001b. “Plume Diving.” On the Internet at http://www.epa.gov/athens/learn2model/part-two/onsite/diving.htmUSEPA. 2002. Elements for Effective Management of Operating Pump and Treat Systems.
EPA/542/R-02-009. Washington, D.C.: Office of Solid Waste and Emergency Response. USEPA. 2003. Using Dynamic Field Activities for On-Site Decision Making: A Guide for
Project Managers. EPA/540/R-03/002, OSWER No. 9200.1-40. Washington, D.C.: Office of Solid Waste and Emergency Response. On the Internet at
http://www.epa.gov/superfund/programs/dfa/guidoc.htm. USEPA and Delta Environmental. 2004. “Groundwater Cleanup Levels for Oxygenates at LUST
Sites: Current and Proposed.” On the Internet at http://www.epa.gov/oust/mtbe. Weaver, J. M., J. E. Haas, and C. B. Sosik. 1999. “Characteristics of Gasoline Releases in the
Water Table Aquifer of Long Island,” in Proceedings, National Ground Water Association/American Petroleum Institute Conference, 1999 Petroleum Hydrocarbons Conference and Exposition, Houston.
Weaver, J. M., J. E. Haas, and J. T. Wilson. 1996. “Analysis of the Gasoline Spill at East Patchogue, New York,” in Proceedings, American Society of Civil Engineers Conference on Nonaqueous Phase Liquids in the Subsurface Environment: Assessment and Remediation, Washington, D.C.
Weaver, J. W., and J. T. Wilson. 2000. “Diving Plumes and Vertical Migration at Petroleum Hydrocarbon Release Sites,” L.U.S.T. Line Bulletin 36. Lowell, Mass.: New England Interstate Water Pollution Control Commission.
Wheeler, K. P. 2002. “In-Situ Ozone Remediation of MTBE in Groundwater,” presented at the Annual International Conference on Contaminated Soils, Sediments, and Water.
White, H., B. Lesnik, and J. Wilson. 2002. “Analytical Methods for Fuel Oxygenates.” L.U.S.T. Line Bulletin 42. Lowell, Mass: New England Interstate Water Pollution Control Commission.
Wilson, J. T., J. S. Cho, B. H. Wilson, and J. A. Vardy. 2000. Natural Attenuation of MTBE in the Subsurface under Methanogenic Conditions. EPA/600/R-00/006. Washington, D.C: U.S. Environmental Protection Agency, Office of Research and Development.
Wilson, R., D. Mackay, and K. Scow. 2002. “In-Situ MTBE Biodegradation Supported by Diffusive Oxygen Release,” Environmental Science and Technology 36(2): 190–99.
Wilson, J. T., and R. Kolhatkar. 2002. “Role of Natural Attenuation in the Life Cycle of MTBE Plumes,” Journal of Environmental Engineering 128(9): 876–82.
Yeh, C. K., and J. T. Novak. 1994. “Anaerobic Biodegradation of Gasoline Oxygenates in Soils,” Water Environmental Resources 66(5): 744–52.
Zhang, Y. and R. Spalding. 2003. “Impact of Preservation Techniques and GC Injector Temperature on Loss of Fuel Oxygenates,” Contaminated Soil Sediment and Water May/June.
93

ITRC – Overview of Groundwater Remediation Technologies for MTBE and TBA February 2005
Zheng, C., and P. P. Wang. 1999. MT3DMS: A Modular Three-Dimensional Multispecies Transport Model for Simulation of Advection, Dispersion, and Chemical Reactions of Contaminants in Groundwater Systems; Documentation and User’s Guide. SERDP-99-1. U.S. Army Corps of Engineers, Engineer Research and Development Center, Strategic Environmental Research and Development Program.
Zheng, C., and P. P. Wang. 2002. “A Field Demonstration of the Simulation-Optimization Approach for Remedial System Design,” Ground Water 40(3): 258–65.
Zogorski, J. S., A. Morduchowitz, A. L. Baehr, B. J. Bauman, D. L. Conrad, R. T. Drew, N. E. Korte, W. W. Lapham, J. F. Pankow, and E. R Washington. 1997. Fuel Oxygenates and Water Quality, an Interagency Assessment of Oxygenated Fuels. Washington D.C.: Office of Science and Technology Policy, Executive Office of the President.
Zollinger, N., A. M. Ferro, and J. M. Greene. 2002. “Potential for Plant Uptake and Phytovolatilization of MTBE,” Contaminated Soil Sediment and Water July/August: 85–87.
Zwank, L., T. C. Schmidt, S. B. Haderlein, and M. Berg. 2002. “Simultaneous Determination of Fuel Oxygenates and BTEX Using Direct Aqueous Injection Gas Chromatography Mass Spectrometry (DAI-GC/MS),” Environmental Science and Technology 36(9), 2054–59.
94

APPENDIX A
Acronyms

ACRONYMS AFB Air Force Base AOP advanced oxidation process API American Petroleum Institute ASTM American Society for Testing and Materials bgs below ground surface BOD biochemical oxygen demand BTEX benzene, toluene, ethylbenzene, and xylenes CAR Carboxen CCL contaminant candidate list COC contaminant of concern COD chemical oxygen demand CPT cone penetrometer technology CRTC Chevron Research and Technology Company CSM conceptual site model CSTR continuously stirred tank reactor DAI direct aqueous injection DIPE diisopropyl ether DME dimethyl ether DO dissolved oxygen DVB divinylbenzene ETBE ethyl tertiary-butyl ether EtOH ethanol FID flame ionization detector GAC granular activated carbon GC chromatography HIBA 2-hydroxyisobutyric acid ISB in situ bioremediation ISCO in situ chemical oxidation ITRC Interstate Technology & Regulatory Council LNAPL light, nonaqueous-phase liquid LUST leaking underground storage tank MA methyl acetate MCL maximum contaminant level MDL method detection limit MeOH methanol MIP membrane interface probe MNA monitored natural attenuation MPE multiphase extraction MS mass spectrometry MTBE (or MtBE) methyl tertiary-butyl ether MTZ mass transfer zone MW molecular weight of chemical (g/mol) NAPL nonaqueous-phase liquid
A-1

NFESC Naval Facilities Engineering Service Center NOD natural oxidant demand NPDWR National Primary Drinking Water Regulations NSDWR National Secondary Drinking Water Regulations O&M operation and maintenance ORP oxidation-reduction potential P&T pump and treat PDB passive diffusion bag PDMS polydimethlysiloxane PF plug flow PID photoionization detector PRB permeable reactive barrier SDWA Safe Drinking Water Act SPME solid phase microextraction SVE soil vapor extraction TAA tertiary-amyl alcohol TAEE tertiary-amyl ethyl ether TAME tertiary-amyl methyl ether TBA (or tBA) tertiary-butyl alcohol TBF tertiary-butyl formate TEAP terminal electron accepting process TSP trisodium phosphate USEPA U.S. Environmental Protection Agency USGS U.S. Geological Survey UST underground storage tank UV ultraviolet light irradiation VOC volatile organic compound
A-2

APPENDIX B
Response to Review Comments

RESPONSE TO REVIEW COMMENTS NOTE: Specific pages and line numbers cited in the comments refer to a review draft of this document. In many instances those references no longer correspond to this published version. USEPA Review Comments Chapter/ section Line(s) Comment Team response
Entire report
Be sure to use consistent language throughout the report. For example both “groundwater” and “ground water” appear in the document.
Changed to “groundwater” except in use by others.
Section 4 Inconsistent subsectioning among technologies which makes it difficult to compare and follow information flow. Should use the same sectioning approach for the top 3 section levels for all technologies discussed.
Will change first three subsections. Subsection 1 = “Description” and subsection 2 = “Applicability”. The majority of subsection 3s will be renamed “Performance.”
Executive Summary
Add summary paragraph. Agree to add additional summary text.
Executive Summary
Comment on ability to download document from ITRC Website.
This text is already included in the “About ITRC” section, within the front matter.
Executive Summary
Add page numbers. Done.
Table of Contents
Add page numbers. Done.
Table of Contents
Add more levels in the TOC (display 4.1.1. etc.) The standard for ITRC documents TOCs is two levels.
Table of Contents – List of Tables
Fix table and figure numbers so they are consistent (e.g. Table 2.1 should be Table 2.1-1, Figure 2.1 should be Figure 2.1-1)
ITRC document template is followed.
Table of Contents
Why would you place the acronym list in the Appendix? It should be up front for easy reference
An acronym list is added as Appendix A, as is consistent with ITRC document formatting.
Section 1 Add page number Done.
Section 1 19 Does (cite) refer to citation? If so, add correct citation. This holds true for other missing citations throughout the report.
Done – a reference has been added.
Table 2.1-1
2/3 Table columns should be even in width. This could also be effectively shown as bulleted lists
Done.
B-1

Chapter/ section Line(s) Comment Team response
2.2 30 Should be Henry’s Law Constants (note the capital C)
Not according to our technical dictionary.
2.2.1 2 Should be (Appendix A, Figure A-1) Also, why is this in the Appendix? You directly refer to its contents so they should be listed in the body of the report. Could improve explanation of figure as well.
Agreed. The table and figure were moved into Chapter 2 of the document.
2.2.1 11 Add equation # Done. 2.2.1 22 Add equation # Done. 2.2.1 14-16 Add dimensions for variables Done. 2.2.2.1 and 2.2.2.2
16 This section is completely void of information. 1 line cannot be a section. It should be expanded. Again, information in the Appendix that is referred in the text should be moved to the body of the report. Supporting info is placed in the Appendix not the items that you directly discuss in the text.
The table and figure were moved into the body of the document. For more information the reader is referred to the table.
2.2.2.3 24 What are the dimensions of R? Added units. 2.2.3.1 42 What is TBF? Added definition. 2.2.3.3 4 Move caption for figure to page 9 Done. 2.2.3.4 Should comment that MtBE tends to migrate faster
than other contaminants which can play a role in the applicability of MNA.
Added: “The relatively high mobility of MTBE may affect the applicability of MNA.”
2.3 5 Include description in caption that explains the length of arrows for M&B in figure
Added caption “Length of arrow indicates relative significance of process.”
2.3.2 29 Should be (Appendix A, Table A-1). Again I still think this table should be in the body of the report
Done.
2.4 19 Insert “method” after analytical Done. 2.4 Any data on errors from bad sample prep (e.g. 25%
error introduced)? No, we chose to not include this type of data. Additional information is available from various references cited throughout the document.
2.4.1 28 Delete “regarding” Deleted “concerning.” 2.4.2.1 11 What does w/w mean? Changed to “by weight.”2.4.2.2. 24 Define MDL term Done. 2.4.2.3 45 Define DVB/CAR/PDMS Added full text for
acronym. 2.4.2.4 Should include a summary table that outlines the
MDL, pros and cons of each method Team feels adding a table would be redundant as information is provided in the narrative.
B-2

Chapter/ section Line(s) Comment Team response
3.1 43 Should use acronym, SCM for site conceptual model, comment that also called the conceptual site model (CSM)
Changed to “conceptual site model” and “CSM.”
3.2.1 25 Should be “These MtBE plumes…” Changed to “MTBE Plumes…”
3.2.1 23 This is a pretty bad example as it appears the way it was written that project was supposed to document the very behavior that it failed to find. The way it is written, it says that the study was not designed properly. Would be more effective to include information from studies that actually do document this behavior.
More relevant citations were added.
3.2.1 37 How close? Include a numeric value (e.g 5-10 ft) There is no general consensus on spacing as this is state and site specific.
3.2.1 27-58 You include figures that are not referenced in the body of the text at all. You should refer to them at least once in this section
Added figure callouts and rearranged figure order.
3.2.1 50 Text in caption is redundant as it is clearly legible in the figure itself. This should be removed in the caption
Deleted caption text.
3.2.2 19 Membrane Interface Probe should also be referred to as a MIP
Done.
3.2.2 35 and 42 Include titles for EPA calculators and URLs for these tools
Done.
3.2.2 44 Remove the reference to “you” in this paragraph, should be “users”
Text deleted by other reviewer.
3.2.2 1 (page 22) Should be “Figure 3.2-5 shows screenshots…” Done. Figure 3.2-5
Page 23 Figure should be moved to page 22 directly below the text that references it
Done.
3.2.4 8-15 These items should be displayed as a bulleted list Done. 3.2.5 37 Was UST previously defined? Added definition. 3.2.5 Entire
section This section does not reference the Triad even though it discusses major elements of it. Should mention the concept of triad and may want to point people to new website (www.triadcentral.org) which will be advertised via EPA and clu-in soon. You can double-check on this with Deana Crumbling from TIP
Added citation and references for Triad documents and Web site.
3.2.6 Entire section
This entire section is redundant based on section 3.1 on SCMs. Should write a brief paragraph stating that CA is looking to make this a requirement and then eliminate this entire section
The section was condensed.
B-3
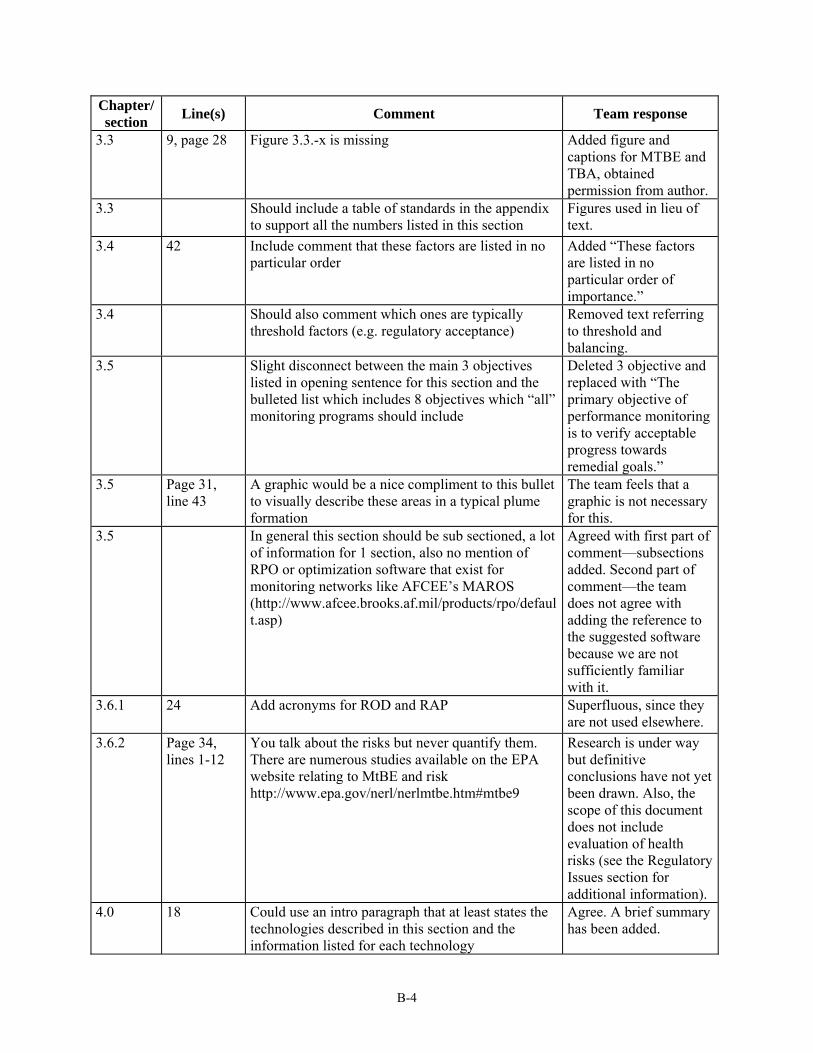
Chapter/ section Line(s) Comment Team response
3.3 9, page 28 Figure 3.3.-x is missing Added figure and captions for MTBE and TBA, obtained permission from author.
3.3 Should include a table of standards in the appendix to support all the numbers listed in this section
Figures used in lieu of text.
3.4 42 Include comment that these factors are listed in no particular order
Added “These factors are listed in no particular order of importance.”
3.4 Should also comment which ones are typically threshold factors (e.g. regulatory acceptance)
Removed text referring to threshold and balancing.
3.5 Slight disconnect between the main 3 objectives listed in opening sentence for this section and the bulleted list which includes 8 objectives which “all” monitoring programs should include
Deleted 3 objective and replaced with “The primary objective of performance monitoring is to verify acceptable progress towards remedial goals.”
3.5 Page 31, line 43
A graphic would be a nice compliment to this bullet to visually describe these areas in a typical plume formation
The team feels that a graphic is not necessary for this.
3.5 In general this section should be sub sectioned, a lot of information for 1 section, also no mention of RPO or optimization software that exist for monitoring networks like AFCEE’s MAROS (http://www.afcee.brooks.af.mil/products/rpo/default.asp)
Agreed with first part of comment—subsections added. Second part of comment—the team does not agree with adding the reference to the suggested software because we are not sufficiently familiar with it.
3.6.1 24 Add acronyms for ROD and RAP Superfluous, since they are not used elsewhere.
3.6.2 Page 34, lines 1-12
You talk about the risks but never quantify them. There are numerous studies available on the EPA website relating to MtBE and risk http://www.epa.gov/nerl/nerlmtbe.htm#mtbe9
Research is under way but definitive conclusions have not yet been drawn. Also, the scope of this document does not include evaluation of health risks (see the Regulatory Issues section for additional information).
4.0 18 Could use an intro paragraph that at least states the technologies described in this section and the information listed for each technology
Agree. A brief summary has been added.
B-4

Chapter/ section Line(s) Comment Team response
4.1.1 23-27 Check the font size on these lines, they appear smaller than the rest of the text
Done.
4.1.3.1 Page 39 Add page number, also where did the line numbers go?
Fixed.
4.1.3.1 Page 39 Add eqn number Done. 4.1.3.3 Page 40 Add dimensions to variables in the equation Done. 4.1.3.3 Page 40,
last bullet Why not mention MODFLOW? It’s a widely used numerical program
Added citation for MODFLOW.
4.1.4 Page 40 Heading should be moved to following page Done. 4.1.6.2 Page 44,
last paragraph
Lowercase b for benzene Done.
4.1.6.2 Page 45 Why is aeration technologies bulleted? Deleted bullet and reformatted.
4.1.6.2 Page 45 Refer to table 4.1-4 somewhere in the body of the report
Added table callout.
4.1.6.2 Page 45 Text in table should not be bulleted and justified, makes it hard to read
Left-justified all text in table.
4.1.6.4 Page 45, last paragraph
Rather than OH, I’m used to seeing -OH OH is standard usage.
4.1.6.4 Page 47 Table 4.1-5, last column should be two separate columns (one for advantages and one for limitations)
Agreed. Table modified accordingly.
4.1.6.5 Last sentence in 1st paragraph
What is the order of magnitude of the biodegradation rates? This was not previously stated.
The intent of the sentence was clarified such that the comment is no longer relevant.
4.1.6.5 2nd line on page 49
Remove “significantly’ at start of sentence. Should be “Of interest to fuel spill sites, …”
Done.
4.1.6.5 Page 49, last line of second paragraph
Should be either suspended growth (note the lower case) or Suspended Growth (SG) and the same for Attached Growth
Changed to lowercase.
4.1.6.5 1st bulleted item
Include acronyms for items like plug flow (PF) and CSTR etc.
Added PF and CSTR.
4.1.7 What about discharging to local sewer system? Any reason why this would not be considered?
Added mention of sewer system discharge.
4.1.9 I think its fairly well understood that costs are very much so a site-specific factor, but aren’t there ANY costs that you could list here? Even a ballpark or range of costs would add to this section and make it more useful.
While specific costs are not included, a table of relative costs was added in an appendix to address this comment.
4.2.2 Page 52 No reference in text to fig 4.2-1, should reference this figure at least once in the body of the report
Added callout, moved figure.
B-5

Chapter/ section Line(s) Comment Team response
4.2.2 Page 54, 2nd paragraph, 1st line
Change to “Figure 4.2-3” Figure numbering adjusted to be consistent with ITRC document style.
4.2.2 Page 54, 2nd line from bottom of page
What is the Standard Design Approach? I assume this must be a specific method developed by an agency which would warrant the use of capital letters. If so, you should identify where this concept came from.
Cited Johnson et al. 2001.
4.2.2 Page 55, 2nd paragraph
Change “our” to “the” Done.
4.2.2 Page 55, last paragraph
Should be “Henry’s Law constant” (note the uppercase L)
Not according to our technical dictionary.
4.2.4 Page 56 Move section title to following page Done. 4.2.4 Page 57,
first paragraph
Change reference to “Figure 4.2-4” Done.
4.2.4 Page 58, 1st bullet, 2nd line
Should better define the plume centerline… this can be strongly influenced by GW flow and soil properties meaning that the geometric center may not necessarily be the true center of the plume
Changed to “or along the plume core”.
4.2.4 Page 58, 2nd bullet
Cite source for this information Citations added.
4.2.5 Page 58, 2nd paragraph
The objective of optimization should also include reducing costs not just maximizing mass removal
Additional text added.
4.2.7 Page 60, 3rd bullet
Should cite the source for this statement Citation added.
4.2.7 Page 60, last line
Change text to “Limits of air sparging are listed below. “
Not parallel construction.
4.3.1 Page 61, first line
No need to redefine MtBE and TBA this far into document
Changed.
4.3.1 Page 62, 1st paragraph, last line
Add period (.) at end of sentence Done.
4.3.1 Page 62, sentence following bullets
Please list the references where additional information can be found in the text rather than a citation. The citation format makes it unclear whether you are citing the statement that more info is available or that the additional info can be found in the citation document. This problem occurs throughout the document.
Changed.
4.3.2 Page 63, last sentence, 1st paragraph
Eliminate the following text at the end of sentence “described in Section 2”.
Changed.
B-6

Chapter/ section Line(s) Comment Team response
4.3.2.1 Page 63, 2nd paragraph
Correct reference to section 6, there is no 6th section in this report
Changed to Section 4.6.
4.3.3.5 Add eqn number Changed. 4.4 Page 68 Eliminate the word “they” in second sentence,
instead use “the team” Changed.
4.4.1 Page 68 Do we really need to define things like water and carbon dioxide this far into the report?
Changed.
4.4.2 Page 69 Table 4.4-1 should be Figure 4.4-1 Changed. 4.4-2 Page 69 Table 4.4-2 should have a citation in the caption References were added. Appendix A
Table A-1 Should include references for the data listed in this table
References are cited in table notes
Appendix A
Figure A-1 This figure could be improved. There is no explanation of the bars (although I understand this shows the range in values, with the line representing the average, correct?). Also there is no reference for the data shown in this figure
The figure was deleted as this information is now contained within Table 2-2.
Appendices
A The acronym list is not provided in this appendix as listed on the TOC
Acronym list has been added as Appendix A.
Appendix B
B I’d rather see the references combined and listed alphabetically by author rather than grouped by report section.
Agreed, change implemented.
Appendix C
C Where is the product list and user survey listed on the cover to this appendix?
This information will be added to the document just before publication.
EPA Review Comments
Chapter/ section Line(s) Comment Team response
General na Document needs a thorough technical edit…many sections read like they were written by different people (which they probably were)
Executive Summary
na The statement “Oxygenates tend to migrate with the average groundwater flow…” reveals a fundamental lack of understanding about advective-dispersive contaminant transport. The issue is with “average”. Just as some water molecules move faster than the average molecule and some slower, so do contaminant molecules…some faster than average, some slower than average, and some everywhere in between. A more correct statement is that “Oxygenates tend to migrate at the same velocity as flowing groundwater.”
Suggested wording was used—thank you.
B-7
Chapter/ section Line(s) Comment Team response
Entire document & 3.0
Na The issue of Conceptual Site Model is an important one and it’s just as important to express it correctly…it’s Conceptual Site Model (CSM) and NOT Site Conceptual Model (SCM). This change should be made throughout the entire document.
Implemented global change to “conceptual site model (CSM)”
2.1 page 5
9 In the sentence “TBA also may be detected in groundwater samples through hydrolysis…” the verb should be “generated” or “created” or “formed” rather than “detected”…hydrolysis causes the formation of TBA, it has nothing to do with “detection”.
Sentence clarified.
2.2.1.3 page 7
Figure 2-1 Good graphic! Agree— thank you.
2.2.2 page 8
4 The Heading “Adsorption” should simply be “Sorption”. (This is a common error throughout the document—e.g., Section 2.3.1 on page 12…but you can’t just do a global change because Section 4.1.6.1 [on page 50] on Resin Adsorption must remain “Adsorption”.)
Agree— change implemented.
2.2.2.3 page 8
20-22 The discussion of “average” groundwater flow velocity, which was commented on earlier, needs to be corrected here as well.
Wording was clarified.
2.4.1 page 14
10-21 The point about raising the temperature during purging is to enhance the sensitivity of the analytical method. Heating to 45-deg C, which agreeably won’t cause ether hydrolysis, may not be sufficiently high to achieve a desired level of sensitivity, especially for TBA (and the other alcohols).
Additional sentence added.
2.4.2.4 page 16
19 The reference to FID being Method 5030 is incorrect…5030 is purge and trap preparation, and has nothing to do with an FID
The method number was changed to 8015.
3.1 page 17
12-22 Change Site Conceptual Model (SCM) to Conceptual Site Model (CSM) throughout the entire document.
This change has been implemented.
3.1 page 17
26 Bullet list should include “three-dimensional hydrogeologic maps, cross-sections, and fence diagrams”
Additional text added to applicable bullets.
3.2.1 Fig 3.2-4 This figure would be greatly improved with the addition of a typical shallow monitoring well that misses the plume.
A different figure was used to illustrate the concept.
3.2.2 p.23
9 and 15 This section references USEPA 2001a and 2001b, but neither reference is in the bibliography. And, further, it’s not clear that there’s any difference between these two paragraphs…they seem to be redundant.
The references and text have been corrected.
B-8

Chapter/ section Line(s) Comment Team response
3.2.4 page 29
17 The term “’piezometric” is obsolete…use “potentiometric” instead.
Terms are similar—suggested term added.
3.2.4 page 29
23 The chemical test for BOD is “Biochemical Oxygen Demand” NOT “Biological Oxygen Demand”
Agree—change implemented.
3.2.5 page 30
28-40 In the discussion of “dynamic work plans”, mention should be made of EPA’s guidance on the subject…it’s document # EPA/540/R-03/002 (May 2003) and is available on Superfund’s web site at: http://www.epa.gov/superfund/programs/dfa/guidoc.htm. Then this reference should be added to the bibliography.
Added.
3.3 Regulatory Issues
na This section completely misses discussion of EPA’s drinking water advisory for MTBE (see http://www.epa.gov/OST/drinking/mtbe.html for complete information)
Added.
DoD Review Comments
Chapter/ section
Line(s) Comment Team response
Acknow-ledgements
2nd paragraph
Kathy Greene formally worked for NFESC now works for USACE
Changed affiliation to USACE.
Over all Would like to see a section in 4.1.5 on how to calculate time to meet clean up goals, a specially for in situ treatment where the groundwater enters a treatment zone - for some plumes this could be over a hundred years
Team feels that a discussion of such tools is beyond the scope of the document.
Over all I think it is good the team is considering addressing source removal – from a cost and time to remediate stand point – the source needs to be removed to reduce continual “bleeding” of contaminant into the groundwater
Comment noted.
2.4.1 421 Check: TSP… which raises the pH to >11 Changed to …” which normally raises the sample pH to >11”.
2.4.1 422 US EPA is introduced should be spelled out Defined at first occurrence.
2.4.2 430 Use the acronym US EPA Text changed. 3.4 1057 May want to add Monitored Natural
Attenuation into the title – many of the parameters and issues presented in this section would also be considered when evaluating MNT, the Navy must consider MNT first and compare all other alternatives
MNA is discussed in detail later in Section 4.6.
B-9

Chapter/ section
Line(s) Comment Team response
to it
3.5.3 1213 chemicals of interest concern (may want to introduce the acronym (COC) here)
Change made.
4.1.7 1859 Some states maybe restrictive on how the treated water be re-introduced into the groundwater
Inserted “Other state and local restrictions or requirements may apply to re-injection of treated effluent.”
4.2.2 1955 May want to add Leeson et al. 2002 (this is the most comprehensive report on the air sparging topic) Leeson, A., P.C. Johnson, R.L. Johnson, C.M. Vogel, R.E. Hinchee, M. Marley, T. Peargin, C.L. Bruce, I.L. Amerson, C.T. Coonfare, R.D. Gillespie, and D.B. McWhorter. 2002. “Air sparging design paradigm.” Report prepared for ESTCP, 12 August 2002 {this report is available on the ESTCP website}
Added citation.
4.2.2 2008 Air Sparging Design Paradigm may want to reference it: Leeson, A., P.C. Johnson, R.L. Johnson, C.M. Vogel, R.E. Hinchee, M. Marley, T. Peargin, C.L. Bruce, I.L. Amerson, C.T. Coonfare, R.D. Gillespie, and D.B. McWhorter. 2002. “Air sparging design paradigm.” Report prepared for ESTCP, 12 August 2002 {this report is available on the ESTCP website}
Added citation.
4.3.2.3 2385 NEX Navy Exchange Text changed. 4.3.2.4 2422 This paragraph is little misleading –
Envirogen conducted the propane demonstration at Port Hueneme references: Steffan, R., 2003. “In-Situ Remediation of MTBE Contaminated Aquifers Using Propane Biosparging.” Report prepared for ESTCP, CU-0015, January 2003 {available on ESTCP web site}. and Azadpour-Keeley, A., 2002. “Envirogen propane biostimulation technology for in-situ treatment of MTBE-contaminated ground water.” US EPA ITER EPA/600/R-02/092, November 2002 {available on EPA website}
Changed to “Envirogen conducted a demonstration at the Port Hueneme site whereby propane was added to the contaminated aquifer to stimulate the cometabolic biodegradation of MTBE (ESTCP 2003b). In addition to propane and a culture that can co-metabolize MTBE (ENV425), oxygen was also added at this site. After several months of operation, MTBE concentrations decreased
B-10

Chapter/ section
Line(s) Comment Team response
dramatically in most wells (Azadpour-Keeley 2002).”
4.5.3 2720 May want to add/reword: In an earlier study conducted at the University of Washington using pure cell cultures of hybrid poplar indicated cell suspension dosed with 14C- labeled MTBE produced products with labeled CO2 and soluble nonvolatile transformation products. This study was followed up with whole hybrid and eucalyptus plants in mass balance chambers. Labeled products were identified in the plant tissue and transpired gases. Reference: Newman, L., M.P. Gordon, P. Heilman, D.L. Cannon, E. Lory, K. Miller, J. Osgood, and S.E. Strand. 1999. “Phytoremediation of MTBE at a California naval site.” Soil & Groundwater Cleanup, February/March 1999, 42-45
Added “In an earlier study conducted at the University of Washington using pure cell cultures of hybrid poplar, cell suspensions dosed with 14C- labeled MTBE produced products with 14C-labeled CO2 and soluble nonvolatile transformation products. This study was followed up with whole hybrid and eucalyptus plants in mass balance chambers. Labeled products were identified in the plant tissue and transpired gases (Newman et al. 1999).“
Peer Review Comments
Chapter/ section Line(s) Comment Team response
General Please ensure that the document reads consistently across all sections. I know various authors worked on it, so the editor should modify it for better flow.
Further editing conducted.
Exec summary
1st page, 4th para starting “Fuel oxygenates”
• Change “often will be” to “is likely to be” in the statements stating with “Oxygenates tend to migrate…”
• Rephrase the last sentence to indicate that because MTBE may migrate longer, it may dive more given the right conditions
Text changed.
Exec summary
Last para Rephrase the last sentence as “Compared to …….MTBE and TBA are likely to remain active for longer periods of time and may require more extensive monitoring both in time and space
Text changed.
B-11

Chapter/ section Line(s) Comment Team response
1.0 Page 3, 18-19 24
Provide range of % MTBE Provide range of % TBA
MTBE content is discussed in Section 1, where the following statement and citation have been added: “Typically, MTBE used for blending contains TBA ranging from about 0.03% to 0.8% (Shell Global Solutions 2003).”
2.1 40 Were/are DME and TAEE used as oxygenates commercially?
Not to our knowledge. Added “or proposed for use” to the list description.
2.1 Page 5, line 10
Provide citations Added citations (Shell Global Solutions 2003, Schmidt et al. 2004, O’Reilly et al. 2001. Lin et al. 2003).
2.2.1.1 Page 6, line 5-6
Figure 1 is an excellent way to represent a lot of data. Suggest either changing units on the fig. to mg/L or changing in the text
The necessary units conversion is discussed in sec. 2.2.1.2.
2.2.1.4 Page 7, 46 Add “compared to BTEX” at the end of sentence starting “In-situ..” Same comment for the following statement starting as “Similarly, water treatment…”
Text added.
2.2 Just curious if the information on physical and chemical properties would be better presented as a Table, the columns being (property/significance in F&T, equations etc/reported values/reference)
Table moved from appendix to text.
2.2.3.1 36 Delete “for example” Deleted. 2.2.3.2 11
12 Replace “molecular structure” with “carbon” Replace “simple” with “straight chain”
Text changed.
2.2.3.3 21 Add “Somsamak et al. 2001” reference for sulfate reducing conditions
Citation added.
2.3 26-27 Rephrase as “As long as the rate of fuel release is greater than the rate of removal by natural processes….”
Changed to “As long as the rate of fuel release is greater than the rate of removal by natural processes, the subsurface extent of the fuel components will expand until it reaches a physical barrier or until natural processes remove the fuel components at the same rate at which they are introduced.”
B-12

Chapter/ section Line(s) Comment Team response
2.3.1 Add a small para on “small volume releases and potential GW impacts”
dded this text: “Recent modeling studies (Lahvis and Rehmann 2000) and field studies (Dakhel et al. 2003) have shown that small-volume releases of oxygenated gasoline containing MTBE have the potential to impact groundwater at underground storage tank (UST) sites. These results indicate that groundwater near the gasoline release is likely to be enriched in MTBE relative to BTEX, which is consistent with empirical groundwater data.”
2.3.2 28 Delete “”floats” and” Replace “on top of” with “at”
Text changed.
2.3.2 Page 13 Line 8
Delete “lateral” and add a reference for diving plume discussion
Deleted noted text and cited Weaver et al. 1999, Weaver and Wilson 2000.
2.4 This section can use a lot of trimming. Method details not necessary in the text and should be cited.
Method details were judged important to the document.
Peer Review Comments
Chapter/ section Comment Team response
4.2 The IAS section is a little schizophrenic because the discussion is not specifically tailored towards the treatment of dissolved plumes - there is a lot of source treatment-related language. I noticed that a few paragraphs in that section look like I wrote them - so you might be careful about having text that too closely resembles the original source documents w/out referencing. This IAS section relies very heavily on the Battelle/NFESC documents - those are actually derivative of other original documents and also contain flowcharts that imply more precise understanding of the processes than truly exists - the best references for IAS basics and system design and monitoring are the series of five or so articles that appeared as a special edition of the Bioremediation Journal a few years ago - they are the best documentation of the original source material.
A footnote was added to clarify the sources used in creating the air sparging section.
B-13
Chapter/ section Comment Team response
4.2 With respect to IAS - Cristin Bruce’s PhD dissertation looked at the effect of IAS on MTBE remediation - you wouldn't find it in a literature search, but I can send you the relevant chapters if you are interested. It's the best IAS/MTBE-related data set that I know of.
Added text referring to Cristin Bruce’s work in Sections 2.2.2 and 4.2.2.
4.3 With respect to bioremediation - I recently produced a "how to make an MTBE biobarrier" document for ESTCP. I don't know if they've posted the final version on their web site, but Andrea Leeson could tell you. Plus there is a final report available from their web site on all the data collected from the large-scale biobarrier at PH.
The document was cited in Section 4.3.2.3.
4.1.9 I'm not sure that I agree with all the entries in the one table that outlines the diners guide to costs with indicators like "$, $$, $$$", etc. - you might see if that is consistent with the text... For example, the monitoring and O&M costs on the large biobarrier are very low compared to any other engineered technology, but you wouldn't deduce that from the table.
Additional cost information about biobarriers was added to Section 4.3.2.8. A reference was also added.
2.4 The analytical section should mention that the headspace methods have fairly high TBA detection limits (it might say that and I missed it).
TBA detection limits for headspace analysis now discussed in Section 2.4.2.3.
3.2 Finally - this is the least self-serving of the comments - the document very carefully points out the need to understand the vertical nature of the plume, through the use of graphs and discussions of sampling strategies. That's great and very needed. However, you should equally emphasize the need to know which way the plume is heading in the first place. I've been to quite a few sites where the direction of flow was not really the direction of flow and people were off by 20 degrees or more (sometimes even 180!). This is probably more common than not based on my experience and what I know of UST monitoring networks. If you start marching off in the wrong direction by only 20 degrees with a typical LUST site plume width, you will lose the plume in about 250 ft (does that distance ring a bell?). I think that concept needs to be explained as much as the vertical concept does.
A new section, 3.2.2, titled “Horizontal Characterization” was added.
USEPA Review Comments
Chapter/ section
Comment (text in red indicates edits made directly to the document by the peer reviewer) Team response
Table 2.2 Why are density and specific gravity listed separately? Are they not the same thing? I would report only density, and specify the temperature. Specify the units for Henry’s constant as Cair/Cwater. Avoid using dashes to indicate a range. It might be confused with a negative sign; use the word “to”. Spell out TBF.
Table changed as specified.
B-14
Chapter/ section
Comment (text in red indicates edits made directly to the document by the peer reviewer) Team response
2.2.2.1 Delete As predicted by the Clausius-Clapeyron equation, Vp of volatile fuel components is highly temperature dependent. [Don’t tell us this unless you are going to use the information]
Text deleted.
2.2.2.1 The vapor pressure of MTBE and other ether oxygenates is higher than fuel components (except TAME) such as benzene and therefore it volatilizes more readily (Table 2-2). [Is this true for all other gasoline components, or just for some of the BTEX compounds? Do you really mean to say that the fuel oxygenates are more volatile than the bulk volatility of gasoline, or the average volatility of the natural hydrocarbon components of gasoline?]
Changed to ”With the exception of TAME, MTBE and other ether oxygenates have higher vapor pressures than commonly encountered monoaromatics (e.g., BTEX), and therefore volatilize more readily from LNAPL (Table 2-2).”
2.2.2.1 Solubility is less temperature dependent than vapor pressure. [Again, don’t tell us this unless you are willing to show us how to use the information]
Text deleted
Eq. 2 Vp = vapor pressure of chemical (mm Hg° atm), P = atmospheric pressure (1 atm = 760 mm Hg°), P is just a conversion factor for mmHg to atmospheres. It is not needed if Vp is expressed in atmospheres.
In the table vapor pressure is in mmHg; therefore, for consistency it was left as mmHg.
2.2.1.1 The constant Kh is generally reported as a dimensionless value (mole fraction of the chemical in air divided by the mole fraction of the chemical in water concentration in air divided by the concentration in water). [Equation 2 really works out to be the ratio of the concentration units (mg/L), not the ratio of the mole fractions.]
Text changed as suggested.
2.2.1.2 Generally, ether oxygenates have slightly lower values for Kh than benzene, and MTBE does not readily volatilize from water (note that the dashed Kh line separates easily volatilized components from those of lesser volatility). [There is an order of magnitude difference in the Kh of benzene and MTBE, ETBE and TAME. I would not consider this “slightly lower”. There is three orders of magnitude difference between benzene and the alcohols. The contrast is between “not very volatile from water compared to benzene” and “not really volatile at all”. This discussion as written does not make this point.]
Changed to: “Generally, ether oxygenates have lower Kh values than benzene, MTBE is less volatile in water, and the alcohol oxygenates are essentially nonvolatile in water.”
2.2.1.3 This allows for preferential component removal in the “source areas” where gasoline released from a leak or spill may exist in either a residual or mobile form in the subsurface above the water table. The partial pressure of MTBE and other ether oxygenates in a recent release of oxygenated fuels is initially higher than other fuel components and they will therefore volatilize more readily during the time period immediately following the release. [They will volatilize more readily as long as they are still present in the gasoline.] During volatilization, both the contact efficiency [what is this?] and
Changed to: “This allows for preferential component removal in the “source areas” where gasoline released from a leak or spill may exist in either a residual or mobile form in the subsurface near the water table. The partial pressure
B-15
Chapter/ section
Comment (text in red indicates edits made directly to the document by the peer reviewer) Team response
the partial vapor pressure are reduced, making it more difficult for the component to completely volatilize.
of MTBE and other ether oxygenates in recently released oxygenated fuels is initially higher than other fuel components and they will therefore volatilize more readily during the time period immediately following the release. As a result of volatilization, the partial vapor pressure is reduced, making it more difficult for the remaining component to completely volatilize.”
2.2.2 Bruce et al. (1998) showed in a physical model that air sparging could remove a major fraction of residual phase MTBE (85%) from aquifer material. Mortensen et al. (2000) also showed that major fractions of MTBE could be sparged for water, but they found that the efficiency of sparging was sensitive to the texture of the geological material being treated. Coarse sands were more subject to channeling of the sparged air and were not treated as effectively. In laboratory physical models, Rutherford and Johnson (1996) achieved rates of oxygen transfer to ground water during sparging in the range of 10 to 170 mg/L per day. The rates of oxygen transfer were sensitive to the rate of advective flow of ground water in the aquifer. Johnson (1998) conducted model simulations that showed that “… in situ air sparging has significant potential of remediating spills of very soluble, but slowly degrading fuel oxygenates, such as MTBE.”
Added suggested text and citations.
2.2.4.1 [This discussion applies only to aerobic biodegradation. Anaerobic biodegradation proceeds through hydrolysis of the ether bond. Enrichment of Stable Carbon and Hydrogen Isotopes during Anaerobic Biodegradation of MTBE – Microcosm and Field Evidence, Tomasz Kuder, John T. Wilson, Phil Kaiser, Ravi Kolhatkar, Paul Philp and Jon Allen, Environmental Science an Technology, In Press.]
Added text: Using the above method Lin et al. 2003 reported MDLs of 0.8 μg/L and 18 μg/L for TBA and ethanol, respectively.
2.2.4.3 Biodegradation in the vapor phase also can occur [Do you mean in the unsaturated zone, above the water table? There are no active bacteria in the vapor phase.], particularly if atmospheric exchange allows the continued introduction of oxygen to promote aerobic respiration.
Changed “vapor phase” to “unsaturated zone.”
2.3.1 [Gasoline is usually redistributed by capillary attraction in the “capillary fringe” above the water table. As a consequence, it can be redistributed efficiently in geological material with a low permeability. The statement about stratification and
Changed to read “The extent of migration of liquid fuel, dissolved fuel components, and gas-
B-16

Chapter/ section
Comment (text in red indicates edits made directly to the document by the peer reviewer) Team response
permeability is potentially confusing. The concept should be developed further, or it should be deleted.]
phase fuel components will depend on the volume of fuel released, the properties of the native soil materials, the rate of water infiltration, and other physical and biological processes.”
2.3.1 The low soil moisture in arid and semiarid environments provides limited opportunity for volatilized fuel constituents from leaked fuels to solubilize dissolve into the water phase; however, if the soil moisture content in the vadose zone is moderate to high, then components such as MTBE and TBA with a relatively low Henry’s law constant will partition into the water phase.
Changed text as suggested.
2.3.2 A release of fuel may migrate to the water table, where the fuel spreads at the top of the water table due to its lower density [the fuel spreads because it is wicked up (imbibed) by the geological material due to capillary attraction. The fuel is the wetting phase in the capillary zone.]
Changed to “A release of fuel may migrate to the water table, where it spreads and becomes distributed above and below the water table.”
2.3.2 Diffusion effects are most apparent in highly stratified aquifer units. [You may want to elaborate on what you mean by highly stratified aquifer units. The meaning is not obvious to people who do not already understand that you mean alternating layers of silt and clay sandwiched between layers of sands and gravels]
Changed to “Diffusion effects are most apparent in highly stratified aquifers consisting of alternating layers of fine-grained and coarse-grained materials.”
2.4.2.1 [Also discuss Lin et al. 2003. Their MDLs using heated headspace were a little better than McLoughlin 2002.]
Added mention of Lin et al. detection limits at the end of Section 2.4.1.
3.1 Cross-sections along axis of pollution migration showing three-dimensional representations of hydrogeology and soil and groundwater chemistry, and fence diagrams,[Mention either cross sections or fence diagrams, but not both. They are the same thing.] Cross-sections perpendicular to axis of pollution migration showing three-dimensional representations of hydrogeology and soil and groundwater chemistry, and fence diagrams,
Text deleted.
3.1 [I recommend that each round of water table data be interpreted to produce an estimate of average flow direction and magnitude. The data should be collected into a “flow rose” where the length of the arrow is equal to the distance ground water would flow in one year under the conditions pertaining at each round of sampling.]
Added bullet item “Estimates of groundwater flow velocities) and directions, with comparisons to previous interpretations.”
3.2.1 All chemicals dissolved in groundwater will move hydraulically with the groundwater. If the groundwater tends…
Text changed.
B-17

Chapter/ section
Comment (text in red indicates edits made directly to the document by the peer reviewer) Team response
3.2.1 [This is a good place to mention Jim Weaver’s plume diving calculator on the Athens Laboratory web page.]
Added text “USEPA provides the OnSite Web site, which contains an interactive calculator for estimating the magnitude of plume dive (USEPA 2001b).”
3.2.1 During site characterization, closely spaced direct-push sampling points at multiple depths placed normal perpendicular [Your usage is technically correct, but potentially confusing to your reader] to the…
Text changed as suggested.
3.2.2 [This is correct for expanding plumes with a continuing source. If the source is removed, or weathers away rapidly, it is possible to find the highest concentrations of MTBE in the less conductive material, because the MTBE has flushed out of the more conductive material.]
Added text “Conversely, if the source is removed, or weathers away rapidly, it is possible to find the highest concentrations of MTBE in the less conductive material, because the MTBE has flushed out of the more conductive material.”
3.2.2 …provide depth-discrete detection of dissolved phase organics (Geoprobe Systems N.d.). Detection limits and general applicability for oxygenates is still under evaluation. Cone Penetrometer Technology (CPT) can also be used to classify soil types and detect the presence of a variety of contaminants. CPT data can be used to identify site geology and zones of high and low hydraulic conductivity. [In my experience measuring electrical conductivity with Geoprobe tools is more cost effective, and provides interpretable data at most sites. Reference James Butler’s papers.] Butler, J.J, J.M. Healey, G.W. McCall, E.J. Garnett, and S.P. Loheide II. 2002. Hydraulic tests with direct-push equipment. Ground Water 40, no. 1: 25-36. Butler, J.J., J.M. Healey, L. Zheng, W. McCall, and M.K. Schulmeister. 1999. Hydrostratigraphic characterization of unconsolidated alluviual deposits with direct-push sensor technology. Kansas Geological Survey, Open File Report 99-40. Available http://www.kgs.ku.edu/Hydro/Publications/OFR99_40/index.html. Schulmeister, M.K., J.J. Butler, J.M. Healey, L. Zheng, D.A. Wysocki, and G.W. McCall. 2003. Dirct-push electrical conductivity logging for high-resolution hydrostratigraphic characterization. Ground Water Monitoring and Remediation
Changed text and added references.
B-18

Chapter/ section
Comment (text in red indicates edits made directly to the document by the peer reviewer) Team response
23(3):52-62.
3.2.4 • Electrical Conductivity • … • Turbidity. [Why?]
Added “electrical” and deleted “turbidity.”
3.2.4 Analytes to consider in addition to BTEX and MTBE could include: TBA, DIPE, TAME, TAA, ETBE, the trimethylbenzenes, naphthalene, ethanol, methanol, ethylene dibromide, 1,2-dichloroethane and lead, depending on the types of gasoline used at the site.
Text changed as suggested.
3.5.1 [This would be a good place to reference Pope, D.F., S.D. Acree, H. Levine, S. Mangion, J. van Ee, K. Hurt, and B. Wilson. 2004. Performance Monitoring of MNA Remedies for VOCs in Ground Water. EPA/600/R-04/027 April 2004. Available on the Ada (Kerr Center) web page, under the U.S. EPA web page.]
Added reference.
3.5.3 Zones in which contaminant reduction may be impeded [Impeded by what? Do you mean “unacceptably slow”?]
Changed “impeded” to “unacceptably slow.”
3.6.1 Such response could come at any time during the selection process, or worse [Do you want to imply that responses from public groups is bad?], after the remedial plan has been implemented.
Subject text previously eliminated.
4.1.6.5 For example, one study concluded that a culture that was enriched on benzene demonstrated MTBE degradation, but MTBE biodegradation was severely inhibited…
Text changed as suggested.
4.2.6 [You may want to include our comparison of the relative performance of conventional technology (mostly air sparge and SVE) for removing MTBE and Benzene at gasoline spill sites. Performance of Conventional Remedial Technology for Treatment of MTBE and Benzene at UST Sites in Kansas. Greg Hattan, Barbara Wilson, John T. Wilson. Remediation: The Journal of Environmental Cleanup Costs, Technologies & Techniques. 14(1):85-94. (2003)]
A sentence and the suggested reference was added.
4.3.2.4 After several months of operation, MTBE concentrations decreased dramatically in most wells ,(Azadpour-Keeley 2002). [Give your reader the rest of the story. Azadpour-Keeley also concluded that “…the technology did not meet the State of California's treatability criteria.”]
Changed text to “After several months of operation, MTBE concentrations decreased dramatically in most wells, however, evaluators concluded that “…the technology did not meet the State of California's treatability criteria.” (Azadpour-Keeley 2002).”
B-19

Chapter/ section
Comment (text in red indicates edits made directly to the document by the peer reviewer) Team response
4.3.2 [You might want to mention my review. Aerobic In-Situ Bioremediation. 2003. John T. Wilson. In: Handbook for Managing Releases of Gasoline Containing MTBE. Editors: Ellen Moyer and Paul Kostecki. Amherst Scientific Publishers. Pages 243-260.]
Added citation in Section 4.3.2.
4.6.4 A "halo" of sulfate and/or nitrate around a plume but depletion or complete removal within the plume provides indirect evidence of biodegradation.
Text changed as suggested.
4.6.4 US EPA (1999c) believes that contingency remedies should generally be included as part of a MNA plan if MNA has been selected primarily based on predictive analysis rather than documented historical trends of decreasing contaminant concentrations.
Text deleted as suggested.
USEPA Review Comments
Chapter/ section Line(s) Comment Team response
1 19 Need to add citation (perhaps Zogorski and others, 1997?)
Added API 1998.
2.2.1.1 1 2
…The vapor pressure of MTBE and other oxygenates (except TAME) is higher… (Appendix A Figure 1)
“(Except TAME)” added to sentence.
2.2.1.1 6 Change font of S to S Font revised. 2.2.1.1 11/22 Equations need to be numbered for text reference. Numbers added. 2.2.1.2 2 Generally, ether oxygenates have slightly lower Kh
values than benzene, and MTBE volatilizes from water (remove readily and does not).
Text was changed in response to other comments.
2.2.1.4 44 Change Khs to Kh’s. Text revised. 2.2.2.1 9 A compound’s adsorption potential… “potential” was added. 2.2.3.2 7 …in terms of a single property value. Text was changed in
response to other comments.
2.2.3.2 10-11 …under aerobic conditions (Schirmer et al. 2003; Bradley et al., 2002) and anaerobic conditions (Bradley et al., 2002).
Added citation.
2.2.3.3 Fig. 2-2 Need to add explanation for difference between dashed and not-dashed arrows.
Changed figure and added explanation to caption.
2.2.3.3 7 Add reference to support MTBE biodegradation of vapor phase; Baehr, A.L., Charles, E.G., and Baker, R.J. 2001. Methyl tert-butyl ether degradation in the unsaturated zone and the relation between MTBE in the atmosphere and shallow ground water. Water Resources Research, 37: 223-233.
Added citation.
B-20
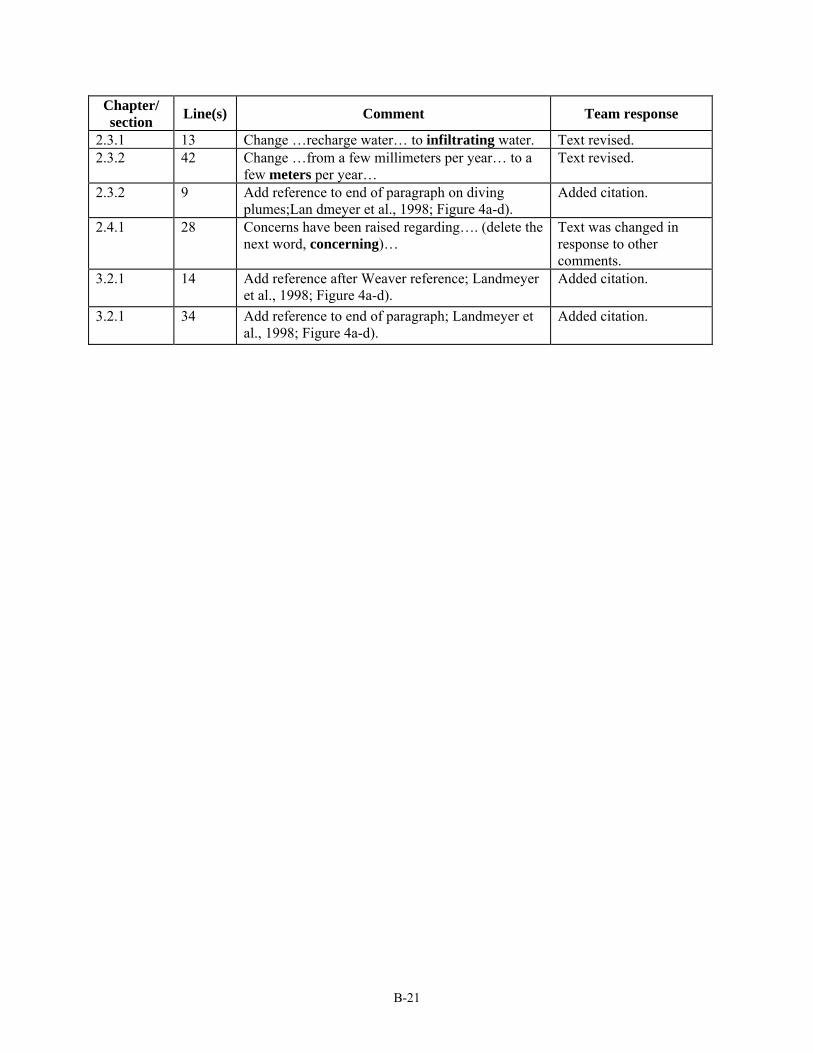
Chapter/ section Line(s) Comment Team response
2.3.1 13 Change …recharge water… to infiltrating water. Text revised. 2.3.2 42 Change …from a few millimeters per year… to a
few meters per year… Text revised.
2.3.2 9 Add reference to end of paragraph on diving plumes;Lan dmeyer et al., 1998; Figure 4a-d).
Added citation.
2.4.1 28 Concerns have been raised regarding…. (delete the next word, concerning)…
Text was changed in response to other comments.
3.2.1 14 Add reference after Weaver reference; Landmeyer et al., 1998; Figure 4a-d).
Added citation.
3.2.1 34 Add reference to end of paragraph; Landmeyer et al., 1998; Figure 4a-d).
Added citation.
B-21
APPENDIX C
ITRC Contacts, Fact Sheet, and Product List
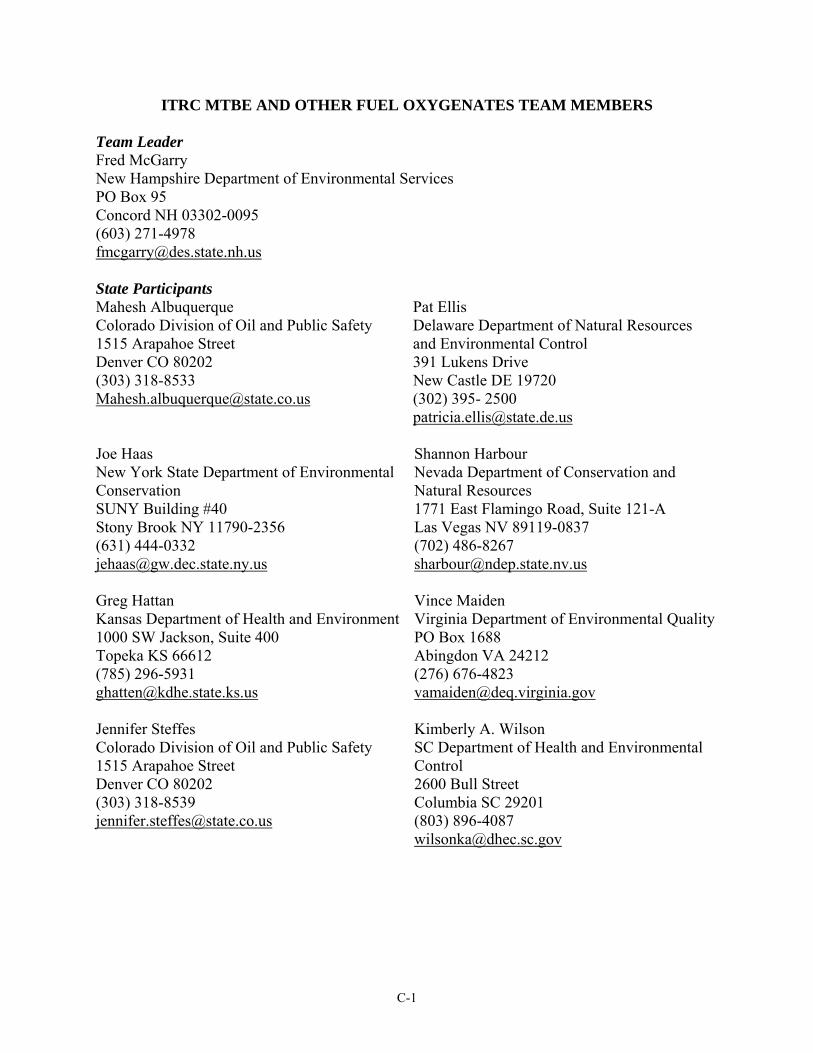
ITRC MTBE AND OTHER FUEL OXYGENATES TEAM MEMBERS Team Leader Fred McGarry New Hampshire Department of Environmental Services PO Box 95 Concord NH 03302-0095 (603) 271-4978 [email protected] State Participants Mahesh Albuquerque Colorado Division of Oil and Public Safety 1515 Arapahoe Street Denver CO 80202 (303) 318-8533 [email protected]
Pat Ellis Delaware Department of Natural Resources and Environmental Control 391 Lukens Drive New Castle DE 19720 (302) 395- 2500 [email protected]
Joe Haas New York State Department of Environmental Conservation SUNY Building #40 Stony Brook NY 11790-2356 (631) 444-0332 [email protected]
Shannon Harbour Nevada Department of Conservation and Natural Resources 1771 East Flamingo Road, Suite 121-A Las Vegas NV 89119-0837 (702) 486-8267 [email protected]
Greg Hattan Kansas Department of Health and Environment 1000 SW Jackson, Suite 400 Topeka KS 66612 (785) 296-5931 [email protected]
Vince Maiden Virginia Department of Environmental Quality PO Box 1688 Abingdon VA 24212 (276) 676-4823 [email protected]
Jennifer Steffes Colorado Division of Oil and Public Safety 1515 Arapahoe Street Denver CO 80202 (303) 318-8539 [email protected]
Kimberly A. Wilson SC Department of Health and Environmental Control 2600 Bull Street Columbia SC 29201 (803) 896-4087 [email protected]
C-1

Academic Participants Michael Hyman North Carolina State University Department of Microbiology Gardner Hall Raleigh NC 27695 (919) 515-7814 [email protected]
Roy Spalding University of Nebraska at Lincoln Department of Agronomy and Horticulture 131 Kelm Hall Lincoln NE 68583-0844 (402) 472-8214 [email protected]
Private Sector Participants Michael Day Applied Hydrology Associates 950 South Cherry Street, Suite 810 Denver CO 80246 (303) 782-0164 [email protected]
Rula Deeb Malcolm Pirnie, Inc. 2000 Powell Street, Suite 1180 Emeryville CA 94608 (510) 735-3005 [email protected]
Jeff Dey Resource Control Corporation 1274 North Church Street Moorestown NJ 08057 (856) 273-1009 [email protected]
Ellen E. Moyer Greenvironment, LLC 258 Main Road Montgomery, MA 01085 (413) 862-3452 [email protected]
Eric M. Nichols LFR, Inc. 78 Piscassic Road Newfields NH 03856 (603) 773-9979 [email protected]
Kirk O’Reilly ChevronTexaco Energy Research and Technology Company 100 Chevron Way, Box 1627 Richmond, CA 94802-0627 (510) 242-5365 [email protected]
Matt Tonkin S.S. Papadopulos & Associates 7944 Wisconsin Avenue Bethesda MA 20814 (301) 718-8900 [email protected]
C-2

Federal Partners Linda Fiedler U.S. Environmental Protection Agency 1200 Pennsylvania Avenue, Mail Code 5102-G Washington DC 20460 (703) 603-7194 [email protected]
Michael Gill U.S. Environmental Protection Agency Region 9 75 Hawthorne Street San Francisco CA 94105 (415) 972-3054 [email protected]
Jim Weaver U.S. Environmental Protection Agency National Exposure Research Laboratory 960 College Station Road Athens, GA 30605 (706) 355-8329 [email protected]
Stakeholder Participants Jimmy N. Mackey Community Stakeholder 3019 Ratel Drive Beaufort, SC 29902 (843) 228-8552 [email protected]
Charlie Sosik Ridge Civic Association 9 Peconic Road Ridge NY 11961 (631) 589-8705 [email protected]
Team Advisors Todd Margrave Razor Resources, Inc. 2015 Wedgemere Road El Cajon CA 92020 (619) 589-0784 [email protected] or [email protected]
Amber Sogorka RegTech, Inc. 1613 Shields Avenue Encinitas, CA 92024 (760) 632-6854 [email protected]
C-3