overview of global warming, ozone depletion, and...
TRANSCRIPT
Overview of Global Warming, Ozone Depletion, and Air Quality
AOSC 434/658R & CHEM 434/678A
Ross Salawitch
Class Web Site: http://www.atmos.umd.edu/~rjs/class/spr2011
Lecture 2
Notes:
• Tim and Ross co-teach this class; please include both on any class related email
• Lectures are the “glue” that hold this class together:
therefore, attendance is strongly encouraged
• We like to “ask questions” for many reasons: to get to know you, to keep you
engaged, etc. Please participate at your own level of comfort
• Problem sets tend to quantitative and exams tend to be qualitative:
problem set #1, due 2 weeks from today, has been posted.
We strongly encourage students to not wait until
the night before the P. Set is due to get started
1Copyright © 2011 University of Maryland.
This material may not be reproduced or redistributed, in whole or in part, without written permission from Ross Salawitch or Tim Canty.
1 February 2011
Overview of Global Warming, Ozone Depletion, and Air Quality
• Course theme: effect of human activity on atmospheric composition
– climate change
– air quality
– stratospheric ozone depletion and recovery
Today’s goals:
1) Overview of climate change, air quality, and ozone depletion
2) We’ll provide lots of “detail” today … we do not expect all of these
details to “stick”, but we do expect, when you review this lecture
at the end of this semester, for these details to be understandable
3) Linkages between these topics, which are often thought of as
“disparate”, but actually are linked in profoundly important manners
2Copyright © 2011 University of Maryland.
This material may not be reproduced or redistributed, in whole or in part, without written permission from Ross Salawitch or Tim Canty.
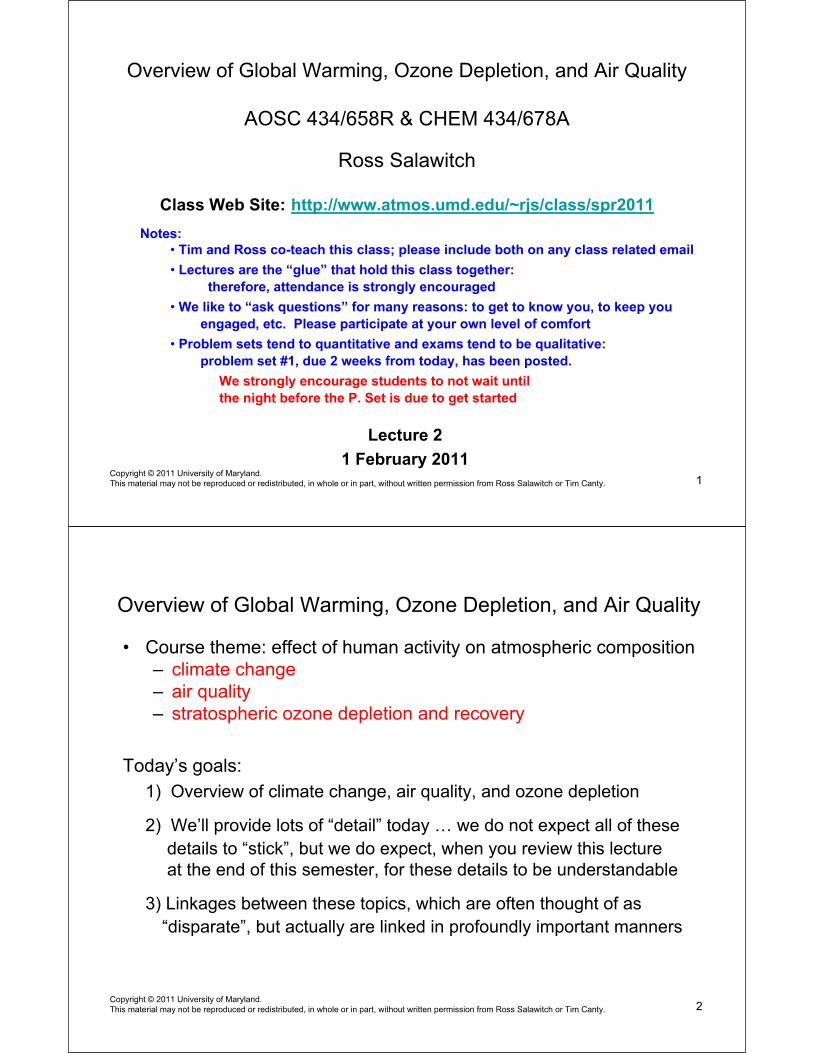
Greenhouse Effect
3Copyright © 2011 University of Maryland.
This material may not be reproduced or redistributed, in whole or in part, without written permission from Ross Salawitch or Tim Canty.
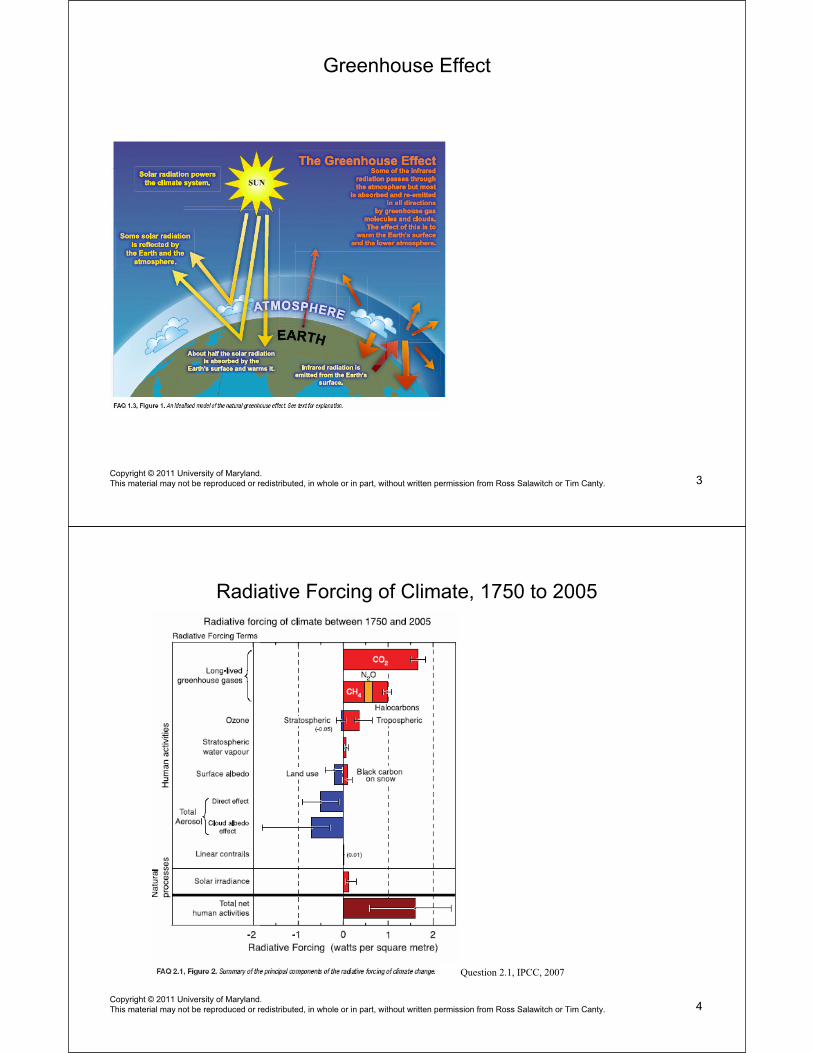
Radiative Forcing of Climate, 1750 to 2005
Question 2.1, IPCC, 2007
4Copyright © 2011 University of Maryland.
This material may not be reproduced or redistributed, in whole or in part, without written permission from Ross Salawitch or Tim Canty.
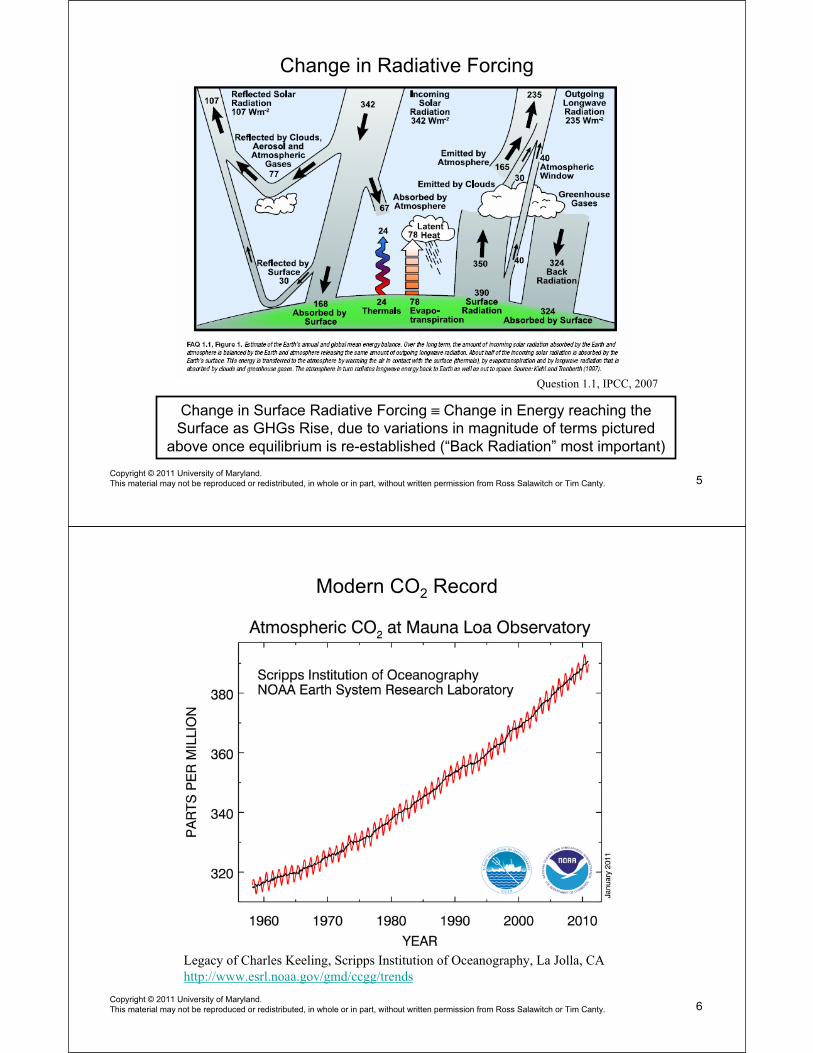
Change in Radiative Forcing
Question 1.1, IPCC, 2007
Change in Surface Radiative Forcing ≡ Change in Energy reaching the
Surface as GHGs Rise, due to variations in magnitude of terms pictured
above once equilibrium is re-established (“Back Radiation” most important)
5Copyright © 2011 University of Maryland.
This material may not be reproduced or redistributed, in whole or in part, without written permission from Ross Salawitch or Tim Canty.
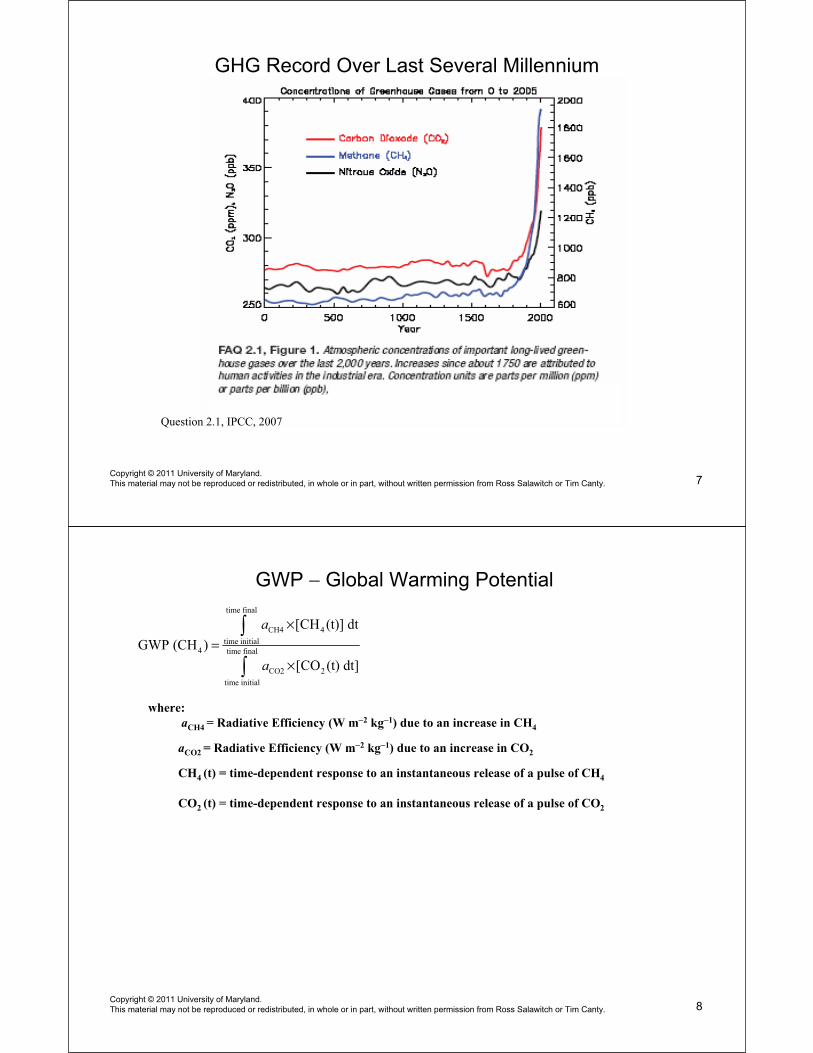
Modern CO2 Record
Legacy of Charles Keeling, Scripps Institution of Oceanography, La Jolla, CA
http://www.esrl.noaa.gov/gmd/ccgg/trends
6Copyright © 2011 University of Maryland.
This material may not be reproduced or redistributed, in whole or in part, without written permission from Ross Salawitch or Tim Canty.
GHG Record Over Last Several Millennium
Question 2.1, IPCC, 2007
7Copyright © 2011 University of Maryland.
This material may not be reproduced or redistributed, in whole or in part, without written permission from Ross Salawitch or Tim Canty.
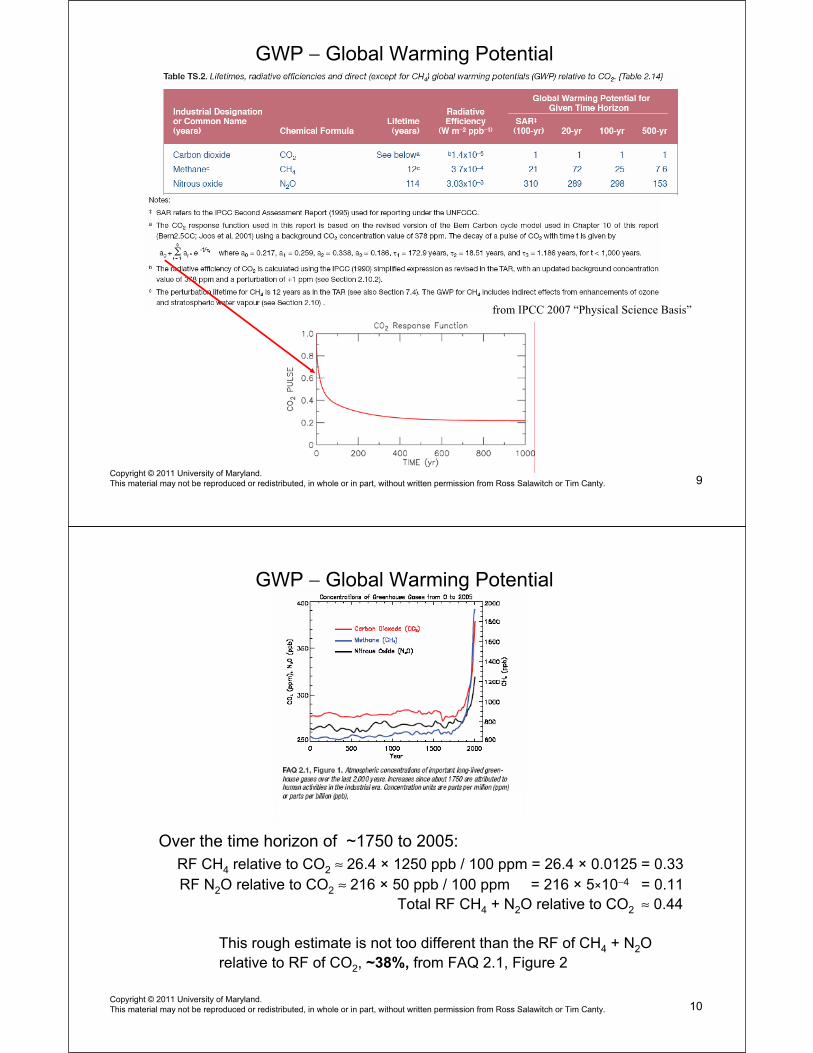
GWP − Global Warming Potential
time final
CH4 4
time initial4 time final
CO2 2
time initial
[CH (t)] dt
GWP (CH )
[CO (t) dt]
a
a
×=
×
where:
aCH4 = Radiative Efficiency (W m−2 kg−1) due to an increase in CH4
aCO2 = Radiative Efficiency (W m−2 kg−1) due to an increase in CO2
CH4 (t) = time-dependent response to an instantaneous release of a pulse of CH4
CO2 (t) = time-dependent response to an instantaneous release of a pulse of CO2
8Copyright © 2011 University of Maryland.
This material may not be reproduced or redistributed, in whole or in part, without written permission from Ross Salawitch or Tim Canty.
GWP − Global Warming Potential
9Copyright © 2011 University of Maryland.
This material may not be reproduced or redistributed, in whole or in part, without written permission from Ross Salawitch or Tim Canty.
from IPCC 2007 “Physical Science Basis”
GWP − Global Warming Potential
Over the time horizon of ~1750 to 2005:
RF CH4 relative to CO2 ≈ 26.4 × 1250 ppb / 100 ppm = 26.4 × 0.0125 = 0.33
RF N2O relative to CO2 ≈ 216 × 50 ppb / 100 ppm = 216 × 5×10−4 = 0.11
Total RF CH4 + N2O relative to CO2 ≈ 0.44
This rough estimate is not too different than the RF of CH4 + N2O
relative to RF of CO2, ~38%, from FAQ 2.1, Figure 2
10Copyright © 2011 University of Maryland.
This material may not be reproduced or redistributed, in whole or in part, without written permission from Ross Salawitch or Tim Canty.
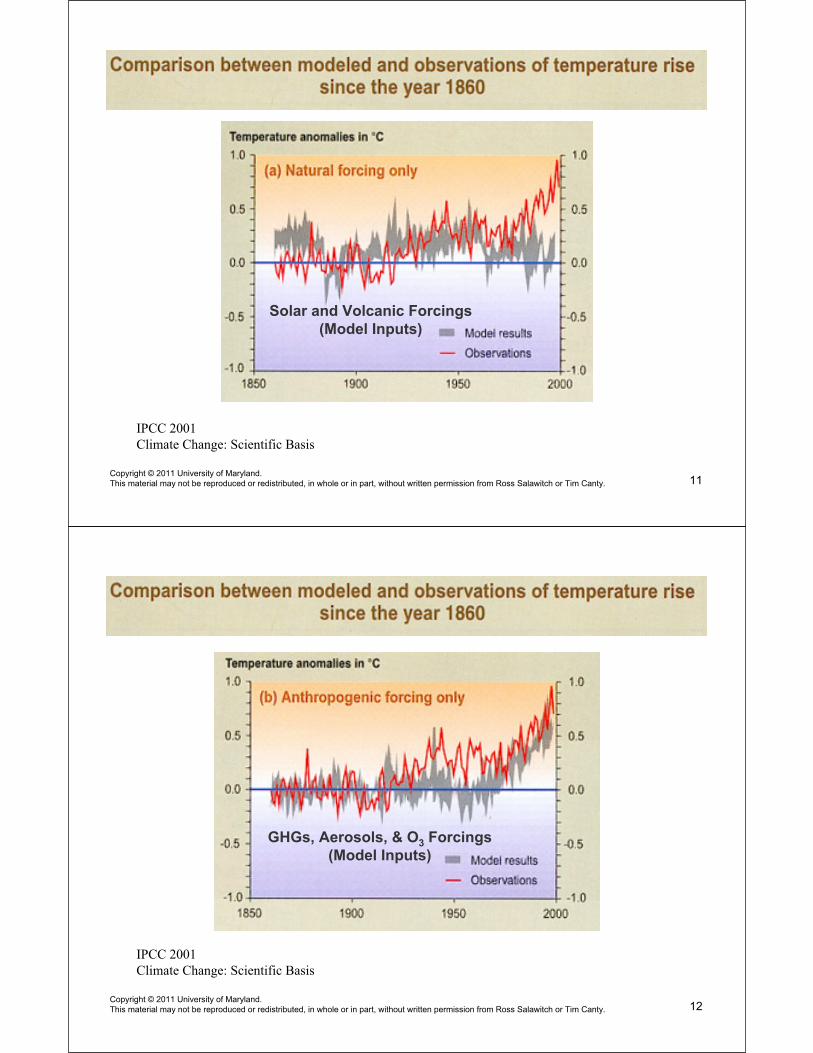
Solar and Volcanic Forcings
(Model Inputs)
IPCC 2001
Climate Change: Scientific Basis
11Copyright © 2011 University of Maryland.
This material may not be reproduced or redistributed, in whole or in part, without written permission from Ross Salawitch or Tim Canty.
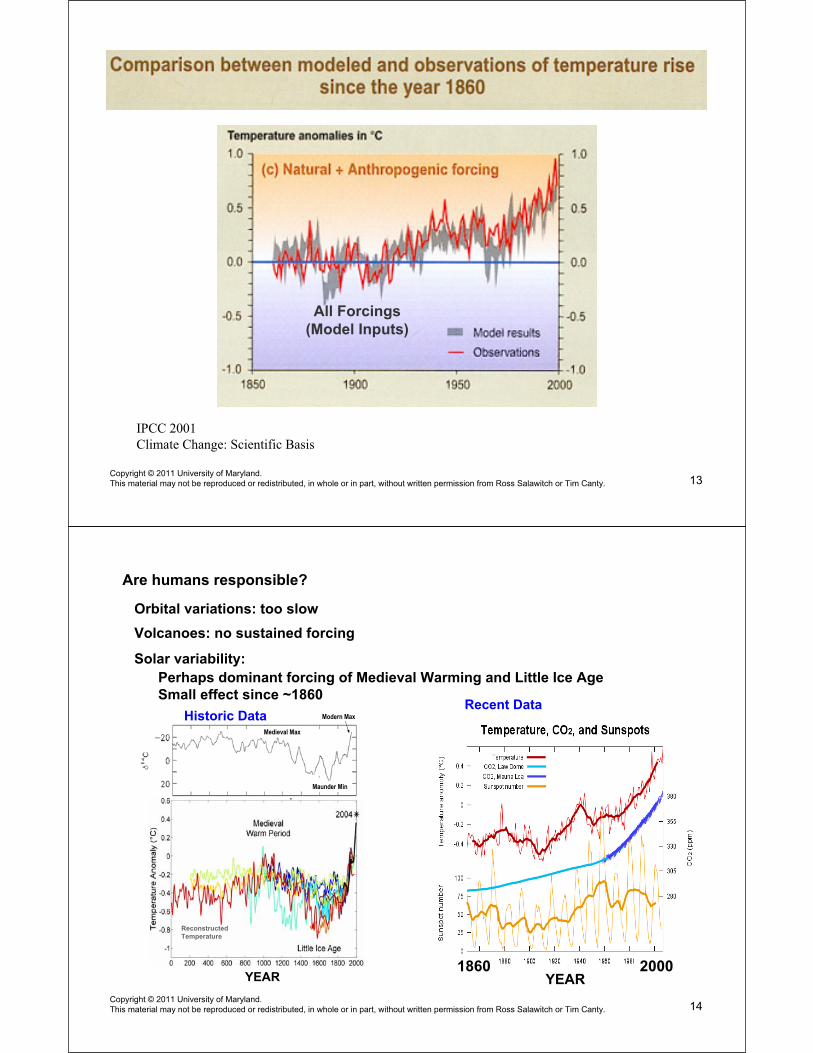
GHGs, Aerosols, & O3 Forcings
(Model Inputs)
IPCC 2001
Climate Change: Scientific Basis
12Copyright © 2011 University of Maryland.
This material may not be reproduced or redistributed, in whole or in part, without written permission from Ross Salawitch or Tim Canty.
All Forcings
(Model Inputs)
IPCC 2001
Climate Change: Scientific Basis
13Copyright © 2011 University of Maryland.
This material may not be reproduced or redistributed, in whole or in part, without written permission from Ross Salawitch or Tim Canty.
Modeling Climate ChangeAre humans responsible?
Orbital variations: too slow
Volcanoes: no sustained forcing
Solar variability:
Perhaps dominant forcing of Medieval Warming and Little Ice Age
Small effect since ~1860Recent Data
1860 2000YEAR
Medieval Max
Maunder Min
Modern Max
Medieval Max
Maunder Min
Modern Max
Reconstructed
Temperature
Historic Data
YEAR
14Copyright © 2011 University of Maryland.
This material may not be reproduced or redistributed, in whole or in part, without written permission from Ross Salawitch or Tim Canty.
Modeling Climate Change
15Copyright © 2011 University of Maryland.
This material may not be reproduced or redistributed, in whole or in part, without written permission from Ross Salawitch or Tim Canty.
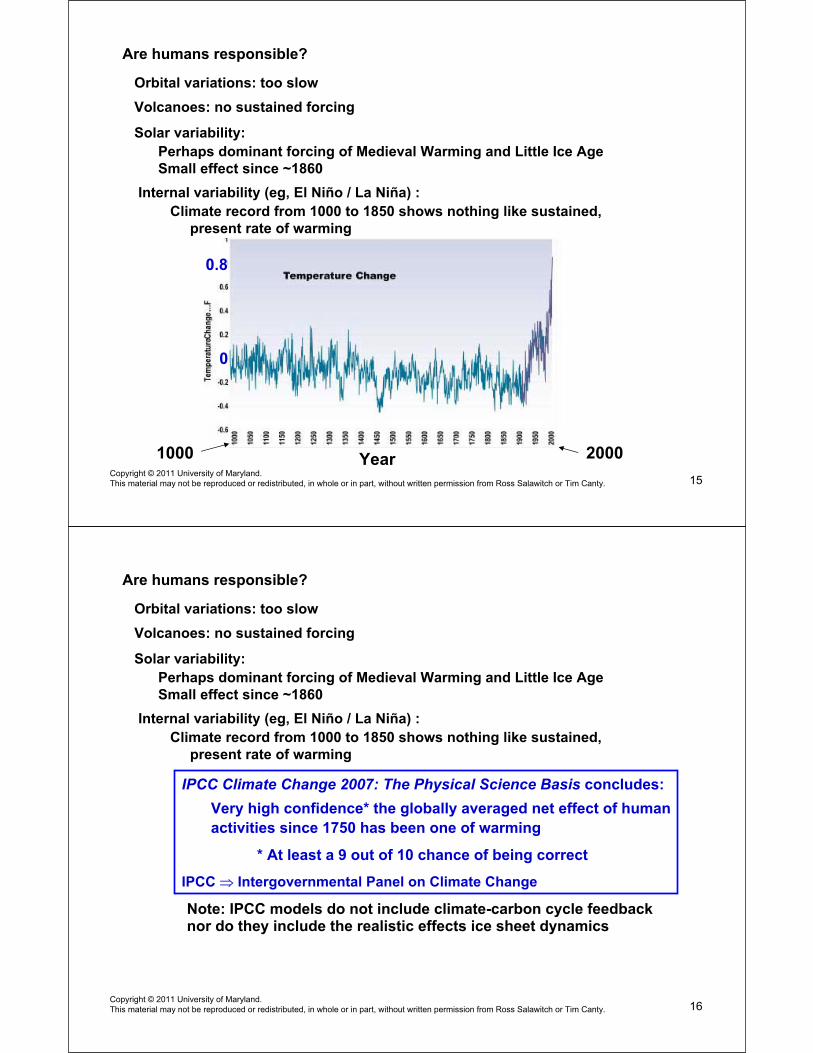
Are humans responsible?
Orbital variations: too slow
Volcanoes: no sustained forcing
Solar variability:
Perhaps dominant forcing of Medieval Warming and Little Ice Age
Small effect since ~1860
Internal variability (eg, El Niño / La Niña) :
Climate record from 1000 to 1850 shows nothing like sustained,
present rate of warming
1000 2000Year
0.8
0
Modeling Climate ChangeAre humans responsible?
Orbital variations: too slow
Volcanoes: no sustained forcing
Solar variability:
Perhaps dominant forcing of Medieval Warming and Little Ice Age
Small effect since ~1860
Internal variability (eg, El Niño / La Niña) :
Climate record from 1000 to 1850 shows nothing like sustained,
present rate of warming
IPCC Climate Change 2007: The Physical Science Basis concludes:
Very high confidence* the globally averaged net effect of human
activities since 1750 has been one of warming
* At least a 9 out of 10 chance of being correct
IPCC Intergovernmental Panel on Climate Change
Note: IPCC models do not include climate-carbon cycle feedbacknor do they include the realistic effects ice sheet dynamics
16Copyright © 2011 University of Maryland.
This material may not be reproduced or redistributed, in whole or in part, without written permission from Ross Salawitch or Tim Canty.
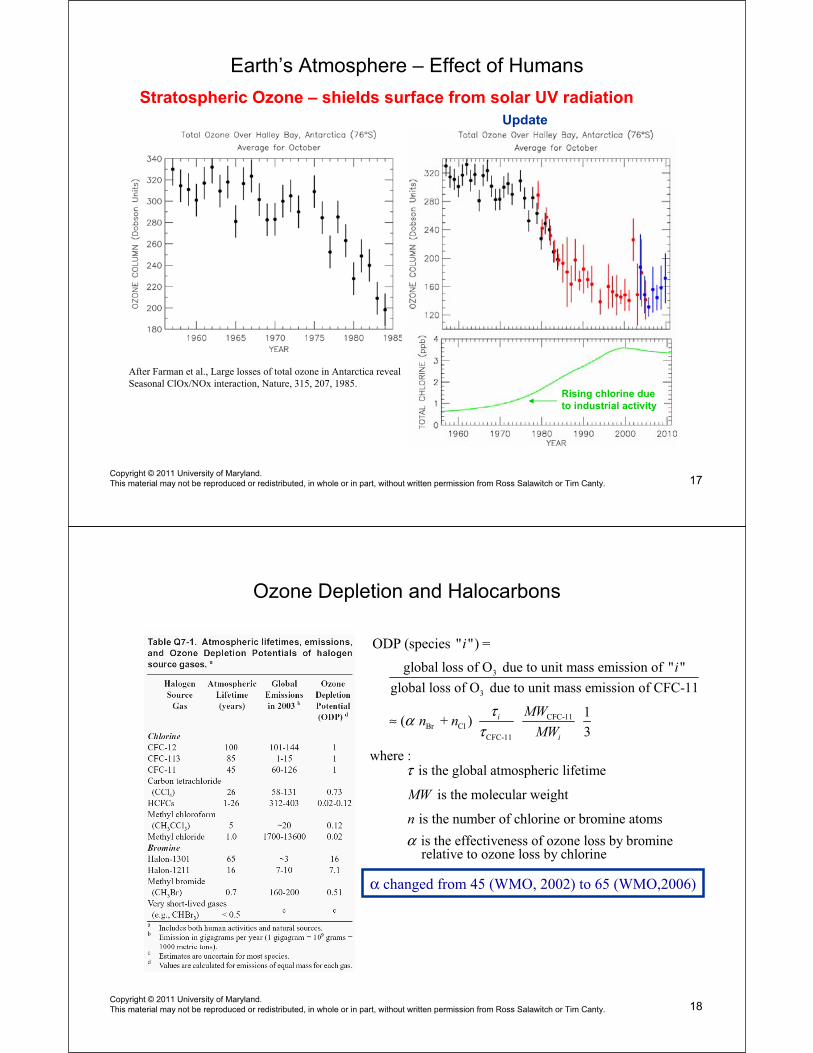
Earth’s Atmosphere – Effect of Humans
Stratospheric Ozone – shields surface from solar UV radiation
Update
After Farman et al., Large losses of total ozone in Antarctica reveal
Seasonal ClOx/NOx interaction, Nature, 315, 207, 1985.Rising chlorine due
to industrial activity
17Copyright © 2011 University of Maryland.
This material may not be reproduced or redistributed, in whole or in part, without written permission from Ross Salawitch or Tim Canty.
Ozone Depletion and Halocarbons
ODP (species " ") =i
3
3
global loss of O due to unit mass emission of " "
global loss of O due to unit mass emission of CFC-11
i
CFC-11
Br Cl
CFC-11
1( + )
3
i
i
MWn n
MW
τατ
≈
where :is the global atmospheric lifetimeτ
is the molecular weightMW
is the number of chlorine or bromine atomsn
is the effectiveness of ozone loss by bromineαrelative to ozone loss by chlorine
α changed from 45 (WMO, 2002) to 65 (WMO,2006)
18Copyright © 2011 University of Maryland.
This material may not be reproduced or redistributed, in whole or in part, without written permission from Ross Salawitch or Tim Canty.
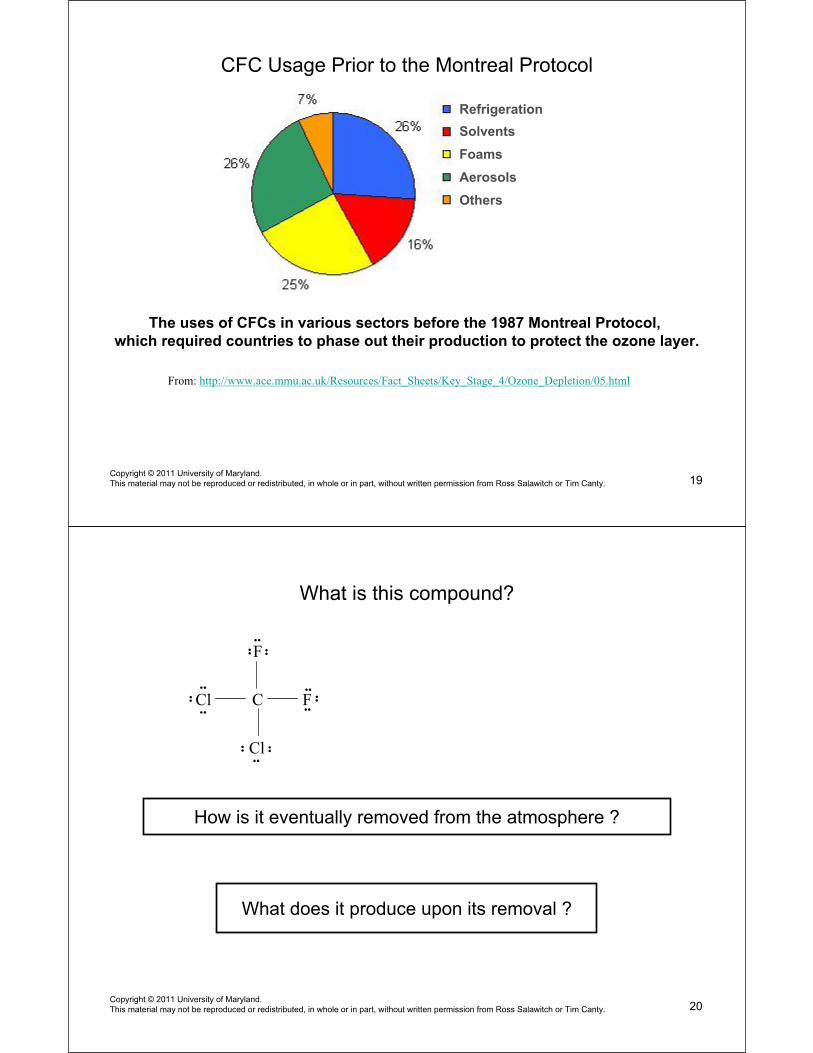
CFC Usage Prior to the Montreal Protocol
Refrigeration
Solvents
Foams
Aerosols
Others
The uses of CFCs in various sectors before the 1987 Montreal Protocol,
which required countries to phase out their production to protect the ozone layer.
From: http://www.ace.mmu.ac.uk/Resources/Fact_Sheets/Key_Stage_4/Ozone_Depletion/05.html
19Copyright © 2011 University of Maryland.
This material may not be reproduced or redistributed, in whole or in part, without written permission from Ross Salawitch or Tim Canty.
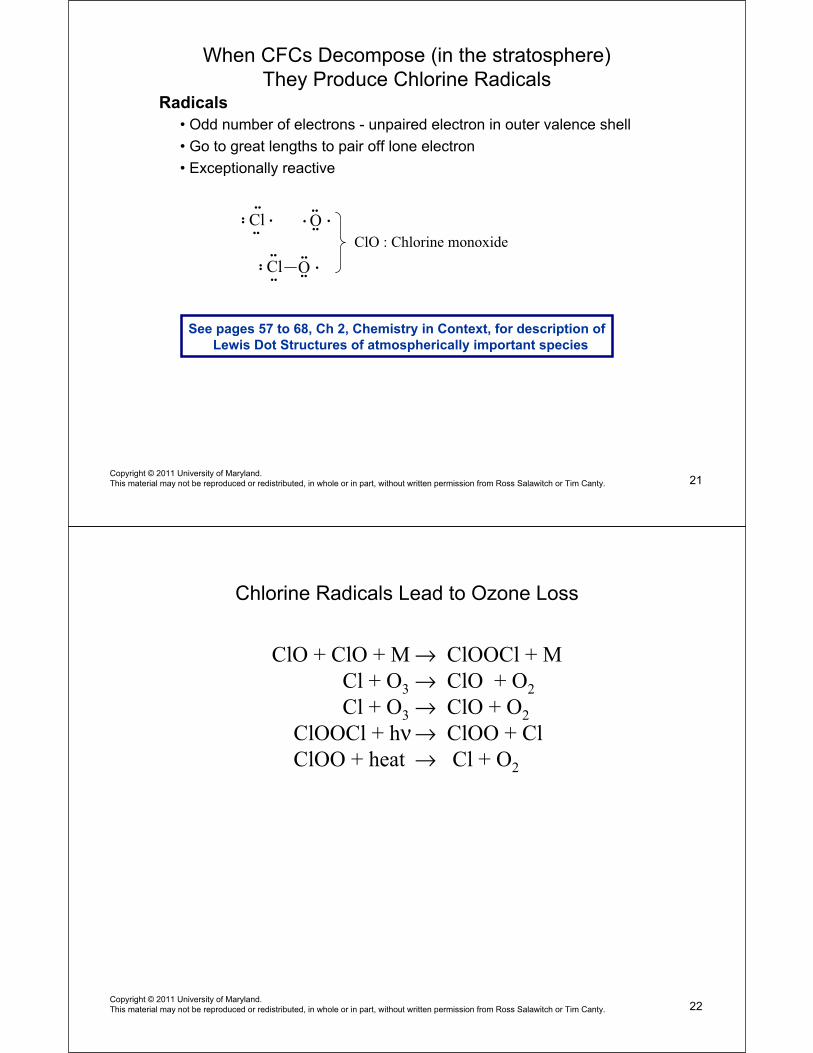
What is this compound?
••
Cl••
••
FC
Cl
F••
••
•••••• ••
••
••
••
How is it eventually removed from the atmosphere ?
What does it produce upon its removal ?
20Copyright © 2011 University of Maryland.
This material may not be reproduced or redistributed, in whole or in part, without written permission from Ross Salawitch or Tim Canty.
Radicals
• Odd number of electrons - unpaired electron in outer valence shell
• Go to great lengths to pair off lone electron
• Exceptionally reactive
When CFCs Decompose (in the stratosphere)
They Produce Chlorine Radicals
Cl
O••
Cl
•• •
••
••
••• •
••••
••
••
O••
•
ClO : Chlorine monoxide
See pages 57 to 68, Ch 2, Chemistry in Context, for description of
Lewis Dot Structures of atmospherically important species
21Copyright © 2011 University of Maryland.
This material may not be reproduced or redistributed, in whole or in part, without written permission from Ross Salawitch or Tim Canty.
Chlorine Radicals Lead to Ozone Loss
ClO + ClO + M → ClOOCl + M
Cl + O3 → ClO + O2
Cl + O3 → ClO + O2
ClOOCl + hν → ClOO + Cl
ClOO + heat → Cl + O2
22Copyright © 2011 University of Maryland.
This material may not be reproduced or redistributed, in whole or in part, without written permission from Ross Salawitch or Tim Canty.
Montreal Protocol Has Banned Most Industrial Production
of CFCs and Halons
Rising chlorine due
to industrial activityTwenty Questions and Answers About The
Ozone Layer: 2006 Update (WMO, 2006)
and the ozone layer is perhaps in initial phase of “recovery”
23Copyright © 2011 University of Maryland.
This material may not be reproduced or redistributed, in whole or in part, without written permission from Ross Salawitch or Tim Canty.
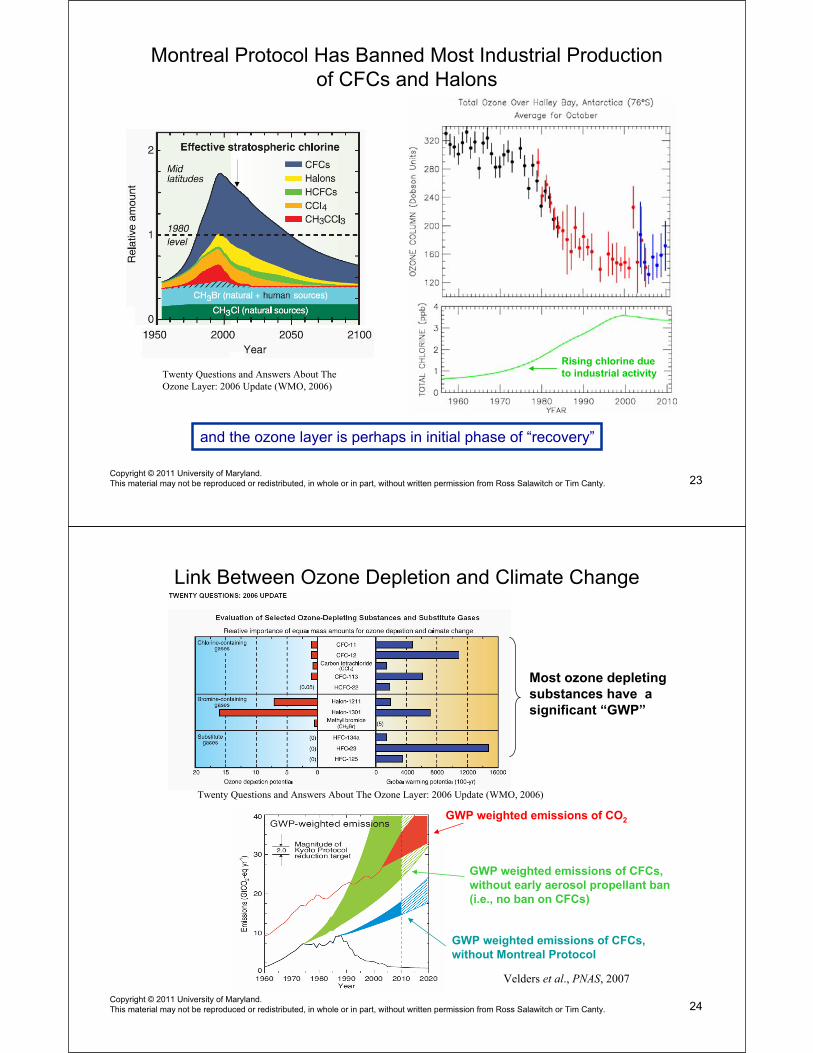
Link Between Ozone Depletion and Climate Change
Most ozone depleting
substances have a
significant “GWP”
GWP weighted emissions of CO2
GWP weighted emissions of CFCs,
without early aerosol propellant ban
(i.e., no ban on CFCs)
GWP weighted emissions of CFCs,
without Montreal Protocol
Velders et al., PNAS, 2007
Twenty Questions and Answers About The Ozone Layer: 2006 Update (WMO, 2006)
24Copyright © 2011 University of Maryland.
This material may not be reproduced or redistributed, in whole or in part, without written permission from Ross Salawitch or Tim Canty.
NO & NO2 : Emitted by fossil fuel combustion & biomass burning
N2 + O2 2 NO
CO: Emitted by fossil fuel combustion & biomass burning
Complete combustion:
2 C8H18 + 25 O2 16 CO2 + 18 H2O
Extreme, incomplete combustion:
2 C8H18 + 17 O2 16 CO + 18 H2O
Tropospheric Ozone Production
OH + CO → CO2 + H
H + O2 + M → HO2 + M
HO2 + NO → OH + NO2
NO2 + hν → NO + O
O + O2 + M → O3 + M
High T
25Copyright © 2011 University of Maryland.
This material may not be reproduced or redistributed, in whole or in part, without written permission from Ross Salawitch or Tim Canty.
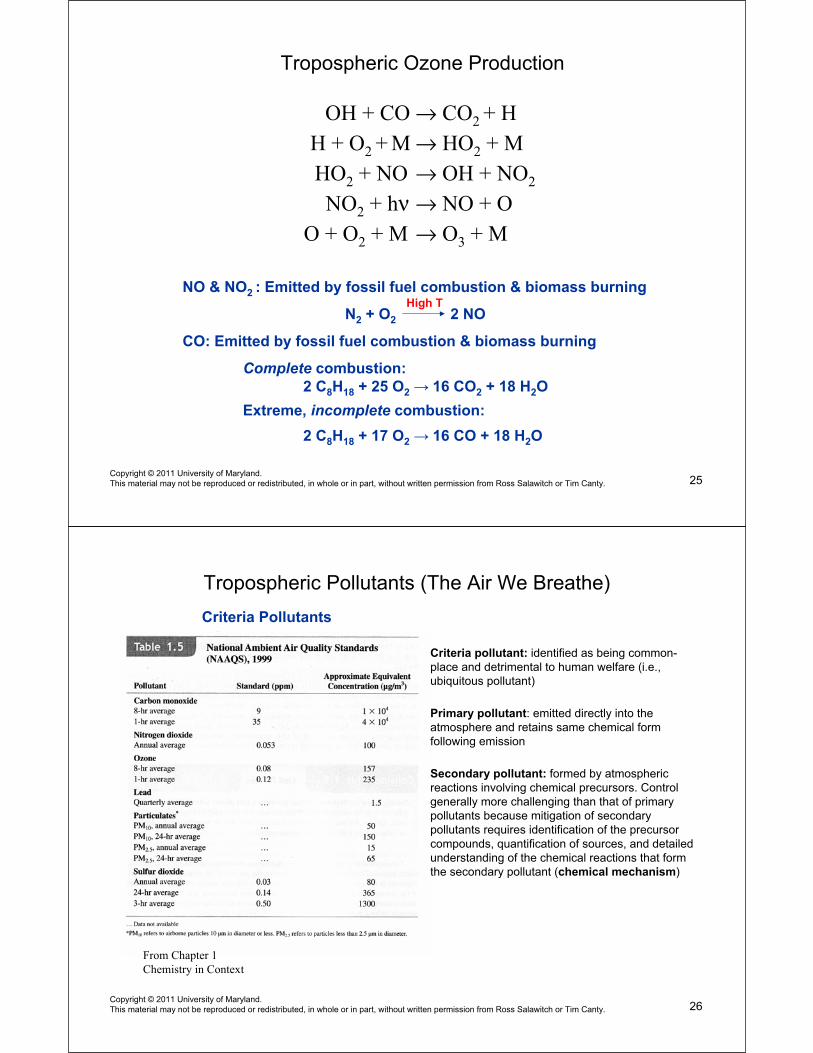
Tropospheric Pollutants (The Air We Breathe)
Criteria Pollutants
From Chapter 1
Chemistry in Context
Criteria pollutant: identified as being common-
place and detrimental to human welfare (i.e.,
ubiquitous pollutant)
Primary pollutant: emitted directly into the
atmosphere and retains same chemical form
following emission
Secondary pollutant: formed by atmospheric
reactions involving chemical precursors. Control
generally more challenging than that of primary
pollutants because mitigation of secondary
pollutants requires identification of the precursor
compounds, quantification of sources, and detailed
understanding of the chemical reactions that form
the secondary pollutant (chemical mechanism)
26Copyright © 2011 University of Maryland.
This material may not be reproduced or redistributed, in whole or in part, without written permission from Ross Salawitch or Tim Canty.
Significant Improvements in Air Quality since early 1980s
Chapter 1
Chemistry in Context
27Copyright © 2011 University of Maryland.
This material may not be reproduced or redistributed, in whole or in part, without written permission from Ross Salawitch or Tim Canty.
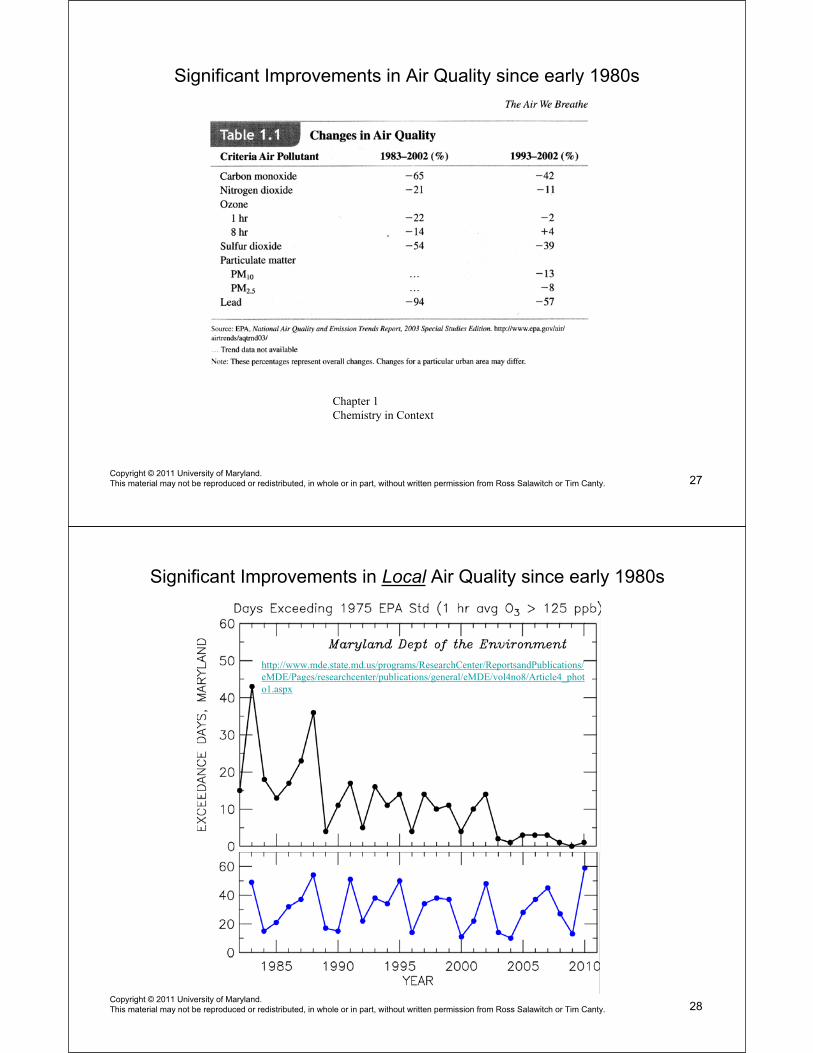
Significant Improvements in Local Air Quality since early 1980s
http://www.mde.state.md.us/programs/ResearchCenter/ReportsandPublications/
eMDE/Pages/researchcenter/publications/general/eMDE/vol4no8/Article4_phot
o1.aspx
28Copyright © 2011 University of Maryland.
This material may not be reproduced or redistributed, in whole or in part, without written permission from Ross Salawitch or Tim Canty.
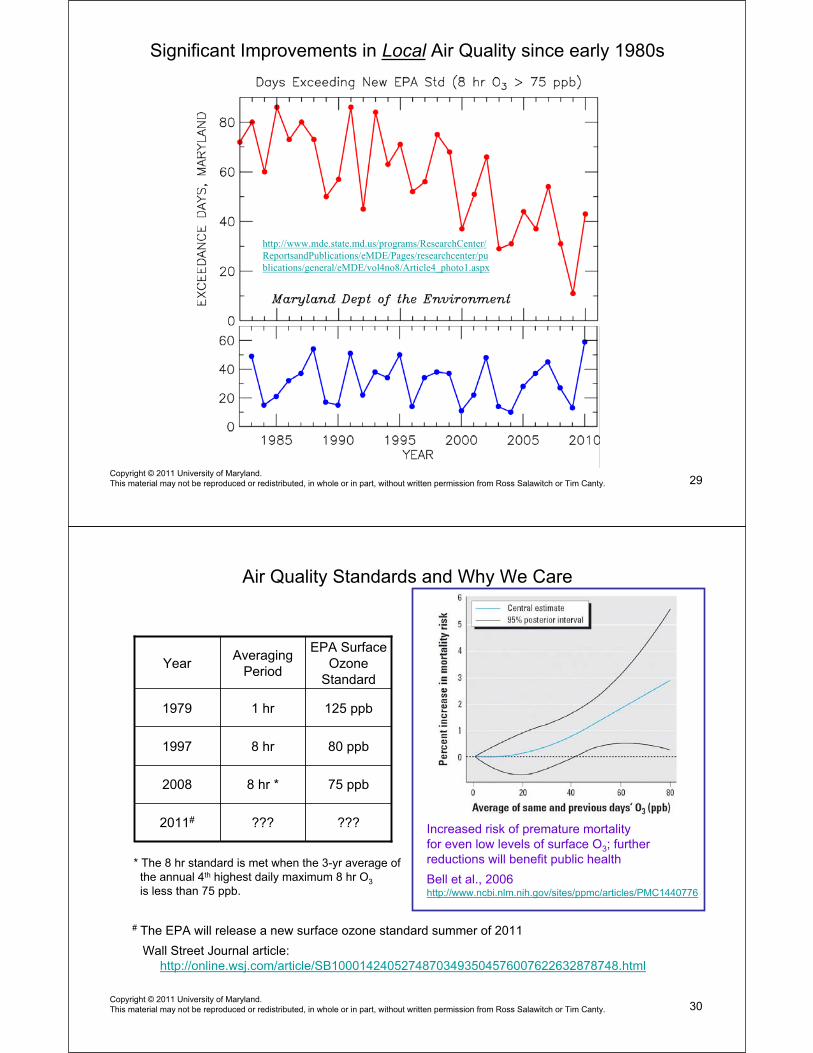
Significant Improvements in Local Air Quality since early 1980s
http://www.mde.state.md.us/programs/ResearchCenter/
ReportsandPublications/eMDE/Pages/researchcenter/pu
blications/general/eMDE/vol4no8/Article4_photo1.aspx
29Copyright © 2011 University of Maryland.
This material may not be reproduced or redistributed, in whole or in part, without written permission from Ross Salawitch or Tim Canty.
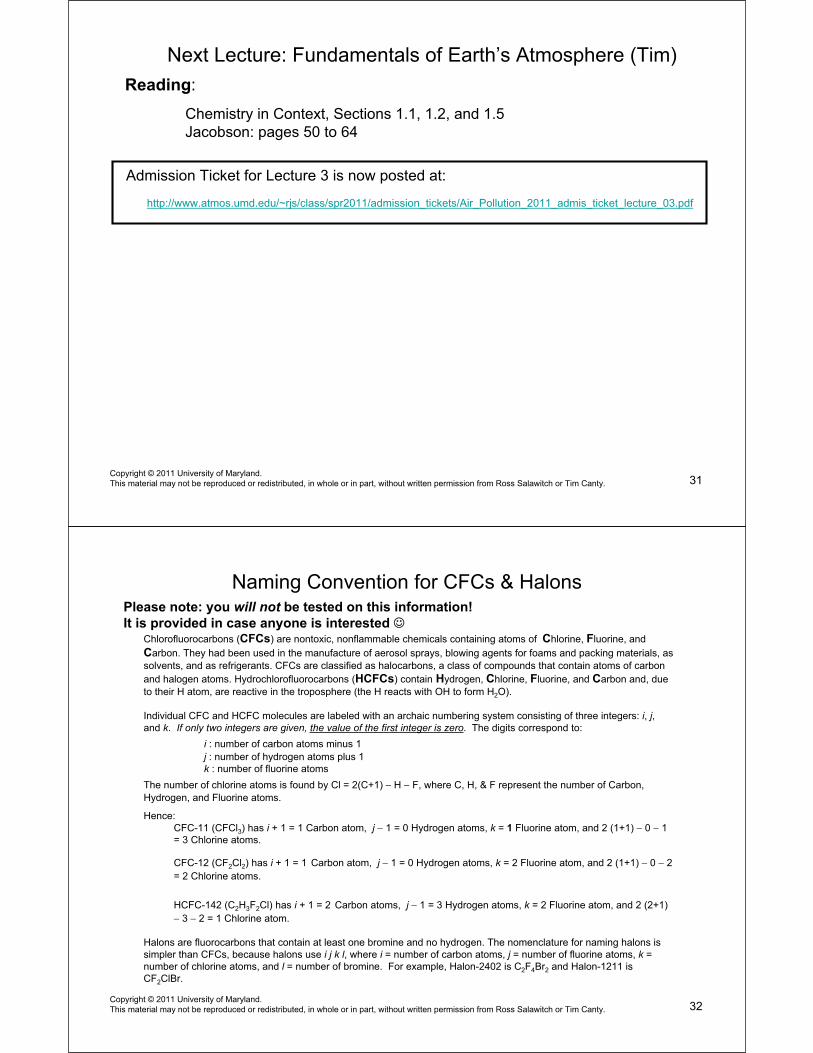
Air Quality Standards and Why We Care
YearAveraging
Period
EPA Surface
Ozone
Standard
1979 1 hr 125 ppb
1997 8 hr 80 ppb
2008 8 hr * 75 ppb
2011# ??? ???
* The 8 hr standard is met when the 3-yr average of
the annual 4th highest daily maximum 8 hr O3
is less than 75 ppb.
Increased risk of premature mortality
for even low levels of surface O3; further
reductions will benefit public health
Bell et al., 2006http://www.ncbi.nlm.nih.gov/sites/ppmc/articles/PMC1440776
# The EPA will release a new surface ozone standard summer of 2011
Wall Street Journal article:
http://online.wsj.com/article/SB10001424052748703493504576007622632878748.html
30Copyright © 2011 University of Maryland.
This material may not be reproduced or redistributed, in whole or in part, without written permission from Ross Salawitch or Tim Canty.
Next Lecture: Fundamentals of Earth’s Atmosphere (Tim)
Reading:
Chemistry in Context, Sections 1.1, 1.2, and 1.5
Jacobson: pages 50 to 64
Admission Ticket for Lecture 3 is now posted at:
http://www.atmos.umd.edu/~rjs/class/spr2011/admission_tickets/Air_Pollution_2011_admis_ticket_lecture_03.pdf
31Copyright © 2011 University of Maryland.
This material may not be reproduced or redistributed, in whole or in part, without written permission from Ross Salawitch or Tim Canty.
Naming Convention for CFCs & HalonsPlease note: you will not be tested on this information!
It is provided in case anyone is interested Chlorofluorocarbons (CFCs) are nontoxic, nonflammable chemicals containing atoms of Chlorine, Fluorine, and
Carbon. They had been used in the manufacture of aerosol sprays, blowing agents for foams and packing materials, as
solvents, and as refrigerants. CFCs are classified as halocarbons, a class of compounds that contain atoms of carbon
and halogen atoms. Hydrochlorofluorocarbons (HCFCs) contain Hydrogen, Chlorine, Fluorine, and Carbon and, due
to their H atom, are reactive in the troposphere (the H reacts with OH to form H2O).
Individual CFC and HCFC molecules are labeled with an archaic numbering system consisting of three integers: i, j,
and k. If only two integers are given, the value of the first integer is zero. The digits correspond to:
i : number of carbon atoms minus 1
j : number of hydrogen atoms plus 1
k : number of fluorine atoms
The number of chlorine atoms is found by Cl = 2(C+1) − H − F, where C, H, & F represent the number of Carbon,
Hydrogen, and Fluorine atoms.
Hence:
CFC-11 (CFCl3) has i + 1 = 1 Carbon atom, j − 1 = 0 Hydrogen atoms, k = 1 Fluorine atom, and 2 (1+1) − 0 − 1
= 3 Chlorine atoms.
CFC-12 (CF2Cl2) has i + 1 = 1 Carbon atom, j − 1 = 0 Hydrogen atoms, k = 2 Fluorine atom, and 2 (1+1) − 0 − 2
= 2 Chlorine atoms.
HCFC-142 (C2H3F2Cl) has i + 1 = 2 Carbon atoms, j − 1 = 3 Hydrogen atoms, k = 2 Fluorine atom, and 2 (2+1)
− 3 − 2 = 1 Chlorine atom.
Halons are fluorocarbons that contain at least one bromine and no hydrogen. The nomenclature for naming halons is
simpler than CFCs, because halons use i j k l, where i = number of carbon atoms, j = number of fluorine atoms, k =
number of chlorine atoms, and l = number of bromine. For example, Halon-2402 is C2F4Br2 and Halon-1211 is
CF2ClBr.
32Copyright © 2011 University of Maryland.
This material may not be reproduced or redistributed, in whole or in part, without written permission from Ross Salawitch or Tim Canty.