over-fertilization does not build soil ... - soil fertility 2018.pdf · which the soil’s nutrient...
TRANSCRIPT
56 Agronomy Journa l • Volume110 , I s sue1 • 2018
Profitable P and K fertilizer application requires an adequate assessment of the soil’s nutrient supplying capacity so fertilizer can be applied at the rate needed to optimize
crop production. Routine soil testing is an integral part of this pro-cess and is oft en used to address P and K nutrient management in conjunction with long-term production goals. Additionally, long-term soil test trends can provide insight regarding the frequency of crop response to fertilization and the temporal variability of plant-available nutrient concentrations (Peterson and Krueger, 1980; Mallarino et al., 1991a; Dodd and Mallarino, 2005). Monitoring long-term agricultural production has provided a way to evaluate crop nutrient removal in the context of P and K soil test trends (Li and Barber, 1988; Fixen and Murrell, 2002) and the ability to docu-ment changes in soil P and K from baseline, or initial, soil test levels (McCollum, 1991; Mallarino et al., 1991a; Dodd and Mallarino, 2005). Soil testing also establishes a basis for fertilizer recom-mendations within regional production areas (Vitosh et al., 1995; Fernandez and Hoeft , 2009; Mallarino et al., 2013) and these fertil-izer recommendations oft en infl uence long-term soil test trends.
Potassium removal in corn and soybean grain exceeded fertilizer K input in the United States in the 1990s (Fixen and Murrell, 2002). Similarly, P balance in the western Lake Erie drainage basin has shift ed from an overall surplus in the 1970s and 1980s to a defi cit in the 2000s. Th is shift is a result of increased crop yields and subse-quent P removal in harvested grain without corresponding increases in P fertilization throughout the region (Bruulsema et al., 2011; Bruulsema, 2016). Phosphorus and K fertilizer rate recommenda-tions in Ohio were last updated by Vitosh et al. (1995) through the Tri-State Fertilizer Recommendations. Th ey based these recommen-dations on the concept of building and maintaining soil test levels above critical levels (15 mg kg–1 Bray-P1; 88–150 mg kg–1 ammo-nium acetate extractable-K [AA-K]), and yet, negative nutrient balances are evident in the Corn Belt, including the western portion of Ohio (Fixen et al., 2011). Murrell et al. (2015) reported that the proportion of Ohio soil samples testing below their selected critical STK level increased from 33% in 2001 to 35% in 2015. Likewise, Murrell et al. (2015) reported the proportion of Ohio soil samples testing below their selected critical STP level increased from 31 to 48% from 2001 to 2015, respectively.
Dodd and Mallarino (2005) suggested that long-term nutrient response trials provide the results needed to identify soil test trends in response to cropping and fertilization. However, there is a lack of published data from the Tri-State region of Indiana, Michigan,
Over-FertilizationDoesNotBuildSoilTestPhosphorusandPotassiuminOhio
AnthonyM.Fulford*andSteveW.Culman
Published in Agron. J. 110:56–65 (2018)doi:10.2134/agronj2016.12.0701Available freely online through the author-supported open access option
Copyright © 2018 American Society of Agronomy5585 Guilford Road, Madison, WI 53711 USATh is is an open access article distributed under the CC BY-NC-ND license (http://creativecommons.org/licenses/by-nc-nd/4.0/)
ABSTRACTAppropriate P and K fertilizer recommendations for corn (Zea mays L.) and soybean [(Glycine max (L.) Merr.] in Ohio are essential, as water quality and nutrient management issues in the region have intensifi ed over the last several years. Th e objec-tives of this study were to: (i) evaluate corn and soybean grain yield response to P and K fertilization, (ii) examine soil test phosphorus (STP) and potassium (STK) and corn Leaf P and Leaf K trends, and (iii) compare the ability of soil and leaf tis-sue testing to refl ect corn and soybean response to fertilization. We evaluated three P and K fertilizer rates, no fertilizer (0×), an estimated nutrient removal rate (1×), and twice the estimated nutrient removal rate (2×), in corn–soybean rotations at three sites over 9 yr. Grain yield was generally non-responsive to P and K fertilization, with only 9 of 42 site-years yielding signifi cantly positive responses. Soil test P and K started in the maintenance range, but signifi cantly declined with the 1× rate at two of three sites for P and at all sites for K. Furthermore, the 2× rate of P and K failed to build STP and STK at any site, with signifi cant declines at one site. Th e results revealed an inability to main-tain initial STP and STK levels with the 1× rate and call into question the suitability of current fertilizer P and K recom-mendations aimed at maintaining STP and STK. Th ese recom-mendations require updating to better refl ect fertilizer needs of modern corn and soybean.
School of Environment and Natural Resources, Ohio State Univ. OARDC, Wooster, OH 44691. Received 6 Dec. 2016. Accepted 8 Oct. 2017. *Corresponding author ([email protected]).
Abbreviations: RGY, relative grain yield; STP, soil test phosphorus; STK, soil test potassium.
Core Ideas• Corn and soybean yield seldom responded to P and K fertilization
over 9 yr.• Soil test P and soil test K signifi cantly decreased from values initially
in the recommended maintenance range.• Corn Leaf P and Leaf K was oft en below the suffi ciency concentration.
AGRONOMY, SOILS & ENVIRONMENTAL QUALITY
Published online January 4, 2018
Agronomy Journa l • Volume110, Issue1 • 2018 57
and Ohio, evaluating long-term soil test trends under corn and soybean production with P and K fertilization. Additionally, there are few published results on leaf tissue testing of P and K for corn and soybean, despite growing interest from the agricultural com-munity. Therefore, the objectives of this study were to: (i) evaluate corn and soybean grain yield response to P and K fertilization, (ii) examine STP, STK, corn Leaf P and Leaf K trends in response to multiple P and K fertilizer rates, and (iii) compare the ability of soil and leaf tissue testing to reflect corn and soybean response to P and K fertilization.
MATERIALS AND METhODSThree field trials were established in 2006 at one site each in
Clark County on a Kokomo silt loam (fine, mixed, superactive, mesic Typic Argiaquoll; Soil Survey Staff, Natural Resources Conservation Service, U.S. Department of Agriculture, 2016) at the Western Agricultural Research Station (39°51¢39² N, 83°40¢45² W), Wayne County on a Canfield silt loam (fine-loamy, mixed, active, mesic Aquic Fragiudalf; Soil Survey Staff, Natural Resources Conservation Service, U.S. Department of Agriculture, 2016) at the Ohio Agricultural Research and Development Center (40°46¢43² N, 81°50¢22² W), and in Wood County on a Hoytville clay loam (fine, illitic, mesic Mollic Epiaqualf; Soil Survey Staff, Natural Resources Conservation Service, U.S. Department of Agriculture, 2016) at the Northwest Agricultural Research Station (41°12¢46² N, 83°45¢50² W) in Ohio and continued until 2014. We evaluated the main effects of: (i) fertilizer P rate (three levels), (ii) fertilizer K rate (three levels), and (iii) crop rotation (two levels) using a factorial arrangement established in a randomized complete block design with four blocks.
Fertilizer P and K was applied at rates of: (i) zero (0×), (ii) the estimated crop removal rate (1×), and (iii) twice the estimated crop removal rate (2×). The estimated nutrient removal of each crop was determined by multiplying the 2005 Ohio state-wide average corn (9.1 Mg ha–1) and soybean (2.7 Mg ha–1) yield by the estimated removal rates (kg nutrient Mg–1 grain) for P2O5 (i.e., 6.6 kg Mg grain–1 or 60.1 kg ha–1) and K2O (i.e., 4.8 kg Mg grain–1 or 43.7 kg ha–1) for corn, or a removal rate for P2O5 (i.e., 13.3 kg Mg grain–1 or 35.9 kg ha–1) and K2O (i.e., 23.3 kg Mg grain–1 or 62.9 kg ha–1) for soybean (Vitosh et al., 1995). Corn and soybean production in 2005 was similar to the most recent 5-yr (2000–2004) statewide average corn (8.6 Mg ha–1) and soybean (2.7 Mg ha–1) grain yields (USDA-NASS, 2015). Also, because this study began in 2006, fertilizer P and K rates based on the 2005 statewide average corn and soybean yields were selected as the basis for the 1× and 2× fertilizer P and K rate requirements of corn and soybean. The 1×and 2× fertilizer P and K rates remained
constant and did not change yearly based on prior grain yield at the three sites of this study. Therefore, while crop removal rates would differ based on actual grain yield from 2006 to 2014, we have main-tained the designation of “1×” and “2×” to refer only to fertilizer rates based on the 2005 corn and soybean estimated grain nutrient removal rates. Phosphorus (diammonium phosphate) and K (muri-ate of potash) fertilizer was surface broadcast and incorporated via chisel tillage. Initial P and K fertilization occurred in fall 2005 (Wood County) or spring 2006 (Clark and Wayne counties) and subsequent P and K fertilization occurred in the fall at all sites fol-lowing soybean harvest.
Two rotations were established, corn–soybean (C–S) and corn–corn–soybean (C–C–S). Corn was planted in four row plots using 76-cm row spacing at all sites and soybean was planted using 19-cm row spacing from 2006 to 2014 with the exception of the Clark County site where 38-cm row spacing was used beginning in 2013. Individual plot size was 3 by 12 m at Clark and Wayne county sites and plot size was 3 by 23 m at the Wood County site.
Nitrogen fertilizer was supplied to corn as urea at planting and urea ammonium nitrate at sidedress (i.e., V4–V6 growth stage). The total fertilizer N rate was 202 kg ha–1 for corn following soybean and 235 kg ha–1 for corn following corn. Nitrogen was applied entirely before planting at Clark County, whereas both pre-plant and sidedress N were applied at Wayne and Wood County sites. Management of weeds, insects, and crop diseases followed established cultural practices outlined by Ohio State University recommendations for the agronomic production of corn and soybean (Loux et al., 2016; Beuerlein and Dorrance, 2005; Thomison et al., 2005).
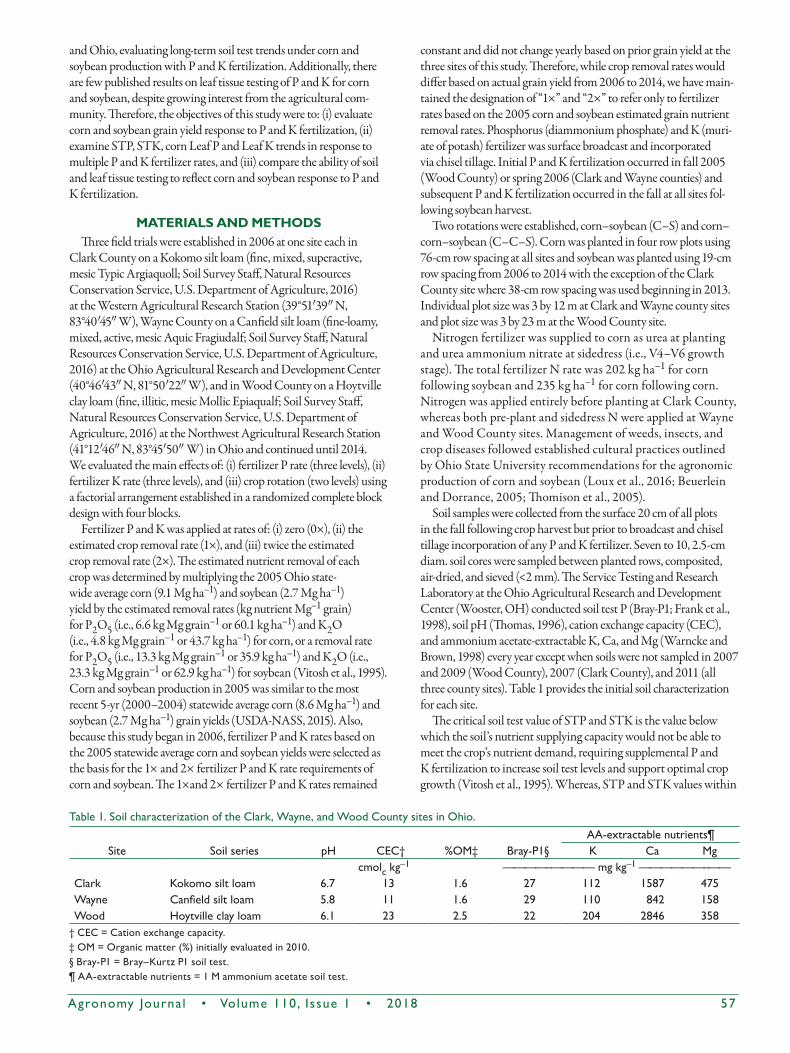
Soil samples were collected from the surface 20 cm of all plots in the fall following crop harvest but prior to broadcast and chisel tillage incorporation of any P and K fertilizer. Seven to 10, 2.5-cm diam. soil cores were sampled between planted rows, composited, air-dried, and sieved (<2 mm). The Service Testing and Research Laboratory at the Ohio Agricultural Research and Development Center (Wooster, OH) conducted soil test P (Bray-P1; Frank et al., 1998), soil pH (Thomas, 1996), cation exchange capacity (CEC), and ammonium acetate-extractable K, Ca, and Mg (Warncke and Brown, 1998) every year except when soils were not sampled in 2007 and 2009 (Wood County), 2007 (Clark County), and 2011 (all three county sites). Table 1 provides the initial soil characterization for each site.
The critical soil test value of STP and STK is the value below which the soil’s nutrient supplying capacity would not be able to meet the crop’s nutrient demand, requiring supplemental P and K fertilization to increase soil test levels and support optimal crop growth (Vitosh et al., 1995). Whereas, STP and STK values within
Table1.SoilcharacterizationoftheClark,Wayne,andWoodCountysitesinOhio.
Site Soilseries pH CEC† %OM‡ Bray-P1§AA-extractablenutrients¶K Ca Mg
cmolckg–1 ————–————mgkg–1——————–——
Clark Kokomosiltloam 6.7 13 1.6 27 112 1587 475Wayne Canfieldsiltloam 5.8 11 1.6 29 110 842 158Wood Hoytvilleclayloam 6.1 23 2.5 22 204 2846 358†CEC=Cationexchangecapacity.‡OM=Organicmatter(%)initiallyevaluatedin2010.§Bray-P1=Bray–KurtzP1soiltest.¶AA-extractablenutrients=1Mammoniumacetatesoiltest.
58 Agronomy Journa l • Volume110, Issue1 • 2018
the maintenance range receive fertilizer P and K recommenda-tions that are designed to replace P and K removed by the crop, thereby maintaining soil P and K fertility (for P: kg P2O5 ha–1 to apply = yield potential (YP) × nutrient removed (CR); for K: kg K2O ha–1 to apply = (YP × CR) + 20 (for non-forage crops); Vitosh et al., 1995). Note that all three sites were within the recom-mended maintenance range for STP (i.e., 15–30 mg kg–1 Bray-P1), while the Clark and Wayne sites were within the recommended maintenance range for STK (i.e., 100–130 mg kg–1 AA-K). The STK at the Wood County site was greater than the current recom-mended Tri-State Fertilizer Recommendations maintenance ranges (Tables 1 and 2).
Leaf tissue samples were collected at the beginning of the repro-ductive phase (R1) for corn and soybean. Corn ear-leaves (10–12 per plot) and soybean upper, fully developed, trifoliates (12–16 per plot) were sampled, oven-dried, ground, digested with nitric-perchloric acid and analyzed for P and K using inductively coupled plasma optical emission spectroscopy (ICP–OES; Jones and Case, 1990). Grain yield was determined by harvesting the center two corn rows or center six soybean rows of each plot with a plot combine. Grain yields were adjusted to a harvest moisture content of 15.5% for corn and 13% for soybean.
Statistical Analyses
Analysis of variance was initially conducted by site and crop for grain yield, soil, and plant data using PROC MIXED in SAS v9.3 (SAS Institute, Cary, NC). Crop rotation and fertilizer rate of P and K were fixed effects and block was a random effect. Year was consid-ered a repeated measure and significant treatment effects were deter-mined using α = 0.05. Crop rotation (C–S and C–C–S) was found to not significantly influence corn (P = 0.24) or soybean (P = 0.29) grain yield. Therefore, the ANOVA was rerun without crop rota-tion and averaged values across rotations are reported here. The F statistics from ANOVA were used to gauge the magnitude of effect that fertilization had on soil tests relative to leaf tissue tests, with a larger F statistic indicating that fertilization had a greater influence on that measurement.
Relative grain yield (RGY) was calculated as a function of the unfertilized yield within each fertilizer P or K treatment divided by the fertilized yield and the result multiplied by 100. The full factorial of fertilizer treatments in this study (3 P rates × 3 K rates; nine fertilizer treatments total) enabled multiple RGY comparisons per site-year. Thus, for every site-year by crop combination, there were six unique RGY calculated for P and K. The RGY calculation uses the treatment combinations within each fertilizer P or K rate group (0×, 1×, or 2×) to obtain multiple RGY for each site-year,
an approach that differs from calculating RGY as the control yield relative to the yield of a maximum, or yield maximizing fertilizer rate (Dodd and Mallarino, 2005; Clover and Mallarino, 2013). The Cate–Nelson procedure (Cate and Nelson, 1971; Attia et al., 2015; Appelhans et al., 2016) was used to evaluate soil and tissue concen-trations of P and K in relation to the RGY of corn and soybean with the “rcompanion” package (Mangiafico, 2017) of R (R Core Team, 2015). Soil and tissue test trends that developed over 9 yr were evaluated using a regression analysis in R and significance of the linear model was evaluated at P ≤ 0.05. Grain yields were evaluated using Tukey’s pairwise comparisons and unless stated otherwise sig-nificant differences between fertilizer treatments were interpreted at P ≤ 0.05. All figures were produced with the “ggplot2” package (Wickham, 2009) of R.
RESULTS AND DISCUSSIONResponse of Corn and Soybean to Phosphorus
and Potassium FertilizerGrain yield of unfertilized (0× P and 0× K) corn averaged 10.7,
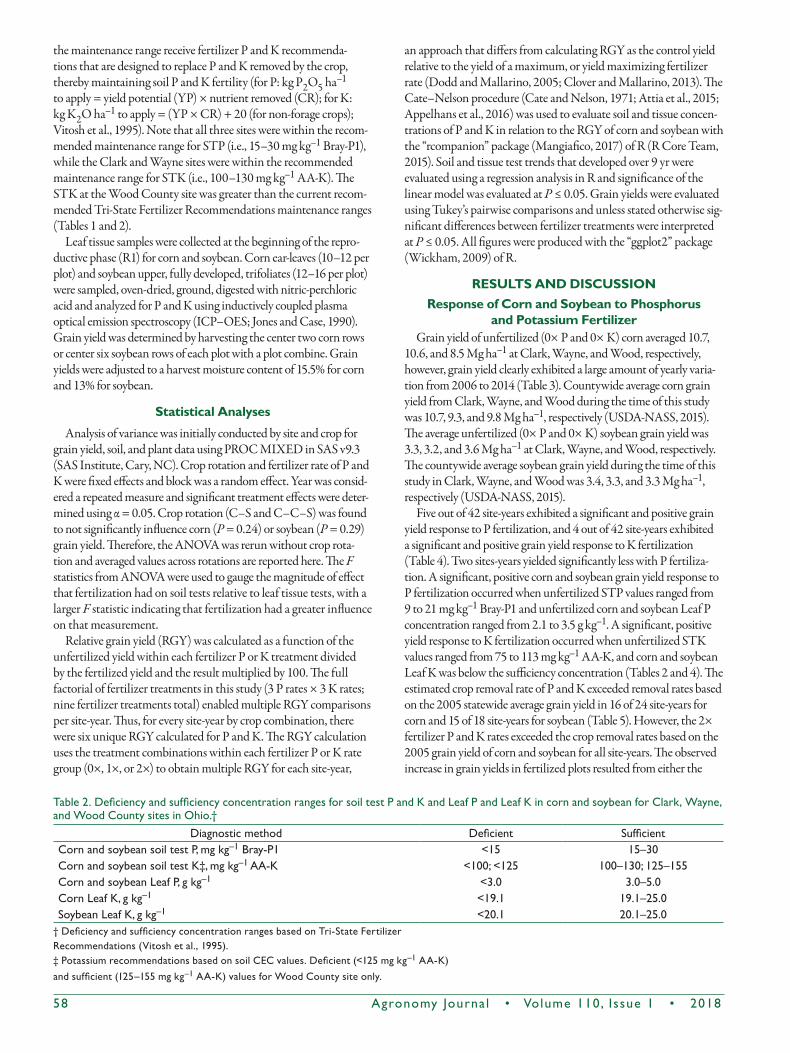
10.6, and 8.5 Mg ha–1 at Clark, Wayne, and Wood, respectively, however, grain yield clearly exhibited a large amount of yearly varia-tion from 2006 to 2014 (Table 3). Countywide average corn grain yield from Clark, Wayne, and Wood during the time of this study was 10.7, 9.3, and 9.8 Mg ha–1, respectively (USDA-NASS, 2015). The average unfertilized (0× P and 0× K) soybean grain yield was 3.3, 3.2, and 3.6 Mg ha–1 at Clark, Wayne, and Wood, respectively. The countywide average soybean grain yield during the time of this study in Clark, Wayne, and Wood was 3.4, 3.3, and 3.3 Mg ha–1, respectively (USDA-NASS, 2015).
Five out of 42 site-years exhibited a significant and positive grain yield response to P fertilization, and 4 out of 42 site-years exhibited a significant and positive grain yield response to K fertilization (Table 4). Two sites-years yielded significantly less with P fertiliza-tion. A significant, positive corn and soybean grain yield response to P fertilization occurred when unfertilized STP values ranged from 9 to 21 mg kg–1 Bray-P1 and unfertilized corn and soybean Leaf P concentration ranged from 2.1 to 3.5 g kg–1. A significant, positive yield response to K fertilization occurred when unfertilized STK values ranged from 75 to 113 mg kg–1 AA-K, and corn and soybean Leaf K was below the sufficiency concentration (Tables 2 and 4). The estimated crop removal rate of P and K exceeded removal rates based on the 2005 statewide average grain yield in 16 of 24 site-years for corn and 15 of 18 site-years for soybean (Table 5). However, the 2× fertilizer P and K rates exceeded the crop removal rates based on the 2005 grain yield of corn and soybean for all site-years. The observed increase in grain yields in fertilized plots resulted from either the
Table2.DeficiencyandsufficiencyconcentrationrangesforsoiltestPandKandLeafPandLeafKincornandsoybeanforClark,Wayne,andWoodCountysitesinOhio.†
Diagnosticmethod Deficient SufficientCornandsoybeansoiltestP,mgkg–1Bray-P1 <15 15–30CornandsoybeansoiltestK‡,mgkg–1AA-K <100;<125 100–130;125–155CornandsoybeanLeafP,gkg–1 <3.0 3.0–5.0CornLeafK,gkg–1 <19.1 19.1–25.0SoybeanLeafK,gkg–1 <20.1 20.1–25.0†DeficiencyandsufficiencyconcentrationrangesbasedonTri-StateFertilizerRecommendations(Vitoshetal.,1995).‡PotassiumrecommendationsbasedonsoilCECvalues.Deficient(<125mgkg–1AA-K)andsufficient(125–155mgkg–1AA-K)valuesforWoodCountysiteonly.
Agronomy Journa l • Volume110, Issue1 • 2018 59
Table3.Unfertilized(0×Pand0×K)cornandsoybeangrainyieldmeansandstandarderrors(SE)atClark,Wayne,andWoodCountysitesaswellastherangeofannualcountywidegrainmeansfrom2006to2014.YearswhenPorKfertilizationsignificantlyimpactedyieldsarereportedinTable4.
Crop Year Clark Wayne Wood—————————————————Mgha–1————————————————
Corn 2006 10.2±0.4 7.1±0.3 9.9±0.12007 7.1±1.4 10.9±1.2 9.6±0.12008 11.3±1.2 9.4±0.3 5.5±0.32009 13.5±0.6 14.1±0.7 8.8±0.22010 14.8±0.4 10.2±0.2 7.0±0.22012 6.8±0.4 11.0±0.5 6.3±0.22013 12.5±0.5 11.0±1.0 10.6±1.02014 9.0±0.6 10.7±0.4 9.9±0.3
Soybean 2007 3.2±0.4 3.8±0.1 4.5±0.12008 2.8±0.0 1.9±0.2 2.0±0.12009 3.7±0.1 3.9±0.2 3.5±0.12011 3.6±0.1 4.3±0.1 4.6±0.12013 3.0±0.2 1.9±0.2 3.6±0.02014 3.6±0.2 3.6±0.2 3.4±0.0
Countywiderange†Corn 8.7–12.2 7.9–10.4 8.4–11.4
Soybean 2.7–3.8 2.7–3.6 2.3–3.6†Countywidegrainyieldrangeduringthestudyperiod(USDA-NASS,2015).
Table4.YearswherePandKfertilizationsignificantly(positiveornegative)impactedcornandsoybeangrainyieldsatClark,Wayne,andWoodCountysitesinOhio.Grainyields,soiltestphosphorus(STP),andsoiltestpotassium(STK)ofbothunfertilized(0×Pand0×K)andfertilizedplots,aswellasLeafPandLeafKofunfertilizedplotsareshown.†
Year Site Crop
GrainyieldSTP(Bray-P1)¶
LeafPSTK(AA-K)#
LeafKUnfertilized‡Fertilized§1× 2× 0× 1× 2× 0× 1× 2×
——————Mgha–1————– –—–mgkg–1—–– gkg–1 ——–mgkg–1——— gkg–1
PFertilizernutrient2007 Wood Corn 9.3 8.8 22 30 35 –††2008 Wood Soybean 2.0 1.8 18 24 28 3.52010 Clark Corn 15.1 15.9 13 21 30 3.52012 Clark Corn 6.7 7.8 9.1 9 20 31 2.12012 Wood Corn 6.3 6.7 6.7 15 34 58 2.22014 Wood Soybean 3.1 3.7 21 36 38 3.22014 Wayne Corn 10.7 12.4 16 27 37 3.0
KFertilizernutrient2006 Clark Corn 10.0 10.7 113 114 117 15.22008 Clark Soybean 2.7 3.2 3.1 104 121 119 14.52011 Clark Soybean 3.6 4.0 4.0 – – – 13.62013 Clark Soybean 2.9 3.6 3.6 75 96 114 16.0
†Soilandtissueconcentrationsshowninboldrepresentsite-yearswhereapositivefertilizerresponsewouldbeexpectedbasedonthesoilandtis-suetestsufficiencyconcentrationsoutlinedbyVitoshetal.(1995).‡Averageoftheunfertilized(0×Pand0×K)yield.§ForP,thefertilizedyield(1×Por2×P)averagedacrossallfertilizerKrates;andforK,thefertilizedyield(1×Kor2×K)averagedacrossallfertil-izerPratesareshownwhensignificantlydifferent(P≤0.05)thantheunfertilized(0×Pand0×K)yield.¶SoiltestPvalueforeachfertilizerPrate(0×,1×,or2×P)averagedacrossallfertilizerKrates.#SoiltestKforeachfertilizerKrate(0×,1×,or2×K)averagedacrossallfertilizerPrates.††Site-yearnotsampled.
Table5.Estimatednutrientbalance(nutrientapplied–nutrientremoved;kgha–1)atClark,Wayne,andWoodCountysitesinOhiofrom2006to2014.
Nutrient Fertilizerrate† Clark Wayne Wood—————————————————–kgha–1————————————
Phosphorus(P2O5) 1× –72 –53 92× 380 411 480
Potassium(K2O) 1× –100 –20 –62× 445 470 483
†Cumulativenutrientappliedfrom2006to2014fortherespective1×and2×fertilizerPratewas473and946kgP2O5ha–1andthecumulative
nutrientappliedfortherespective1× and2×fertilizerKratewas501and1002kgK2Oha–1.
60 Agronomy Journa l • Volume110, Issue1 • 2018
fertilizer applied or from the higher residual soil test levels in the fertilized plots relative to the unfertilized (0× P and 0× K) plots, or a combination of both. Our experimental design does not allow us to tease apart the contribution of these factors, but both may have played a role when responses were observed.
Th e combined application of fertilizer P and K signifi cantly increased grain yield in only 2 out of 42 site-years. In 2006, corn yield was 7.7 Mg ha–1 with application of the 2× P and 1× K treat-ment, which was signifi cantly greater than the yield of the 0× P and 1× K treatment (6.4 Mg ha–1; P < 0.002) at the Wayne County site. In 2013, soybean yield was 3.0 Mg ha–1 with the application of the 1× P and 1× K treatment and was signifi cantly greater than unfertil-ized (0× P and 0× K) soybean yield (1.9 Mg ha–1; P < 0.004) at the Wayne County site.
Soil and Plant Tissue Concentration Trends with Phosphorus and Potassium Fertilization
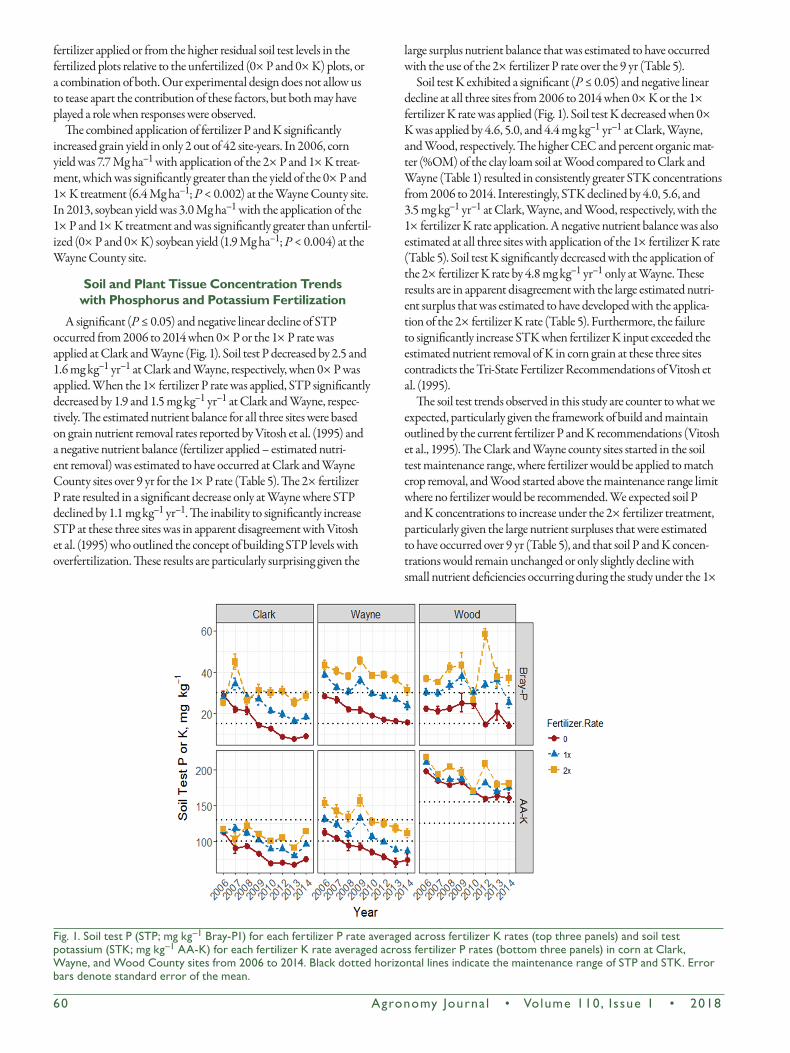
A signifi cant (P ≤ 0.05) and negative linear decline of STP occurred from 2006 to 2014 when 0× P or the 1× P rate was applied at Clark and Wayne (Fig. 1). Soil test P decreased by 2.5 and 1.6 mg kg–1 yr–1 at Clark and Wayne, respectively, when 0× P was applied. When the 1× fertilizer P rate was applied, STP signifi cantly decreased by 1.9 and 1.5 mg kg–1 yr–1 at Clark and Wayne, respec-tively. Th e estimated nutrient balance for all three sites were based on grain nutrient removal rates reported by Vitosh et al. (1995) and a negative nutrient balance (fertilizer applied – estimated nutri-ent removal) was estimated to have occurred at Clark and Wayne County sites over 9 yr for the 1× P rate (Table 5). Th e 2× fertilizer P rate resulted in a signifi cant decrease only at Wayne where STP declined by 1.1 mg kg–1 yr–1. Th e inability to signifi cantly increase STP at these three sites was in apparent disagreement with Vitosh et al. (1995) who outlined the concept of building STP levels with overfertilization. Th ese results are particularly surprising given the
large surplus nutrient balance that was estimated to have occurred with the use of the 2× fertilizer P rate over the 9 yr (Table 5).
Soil test K exhibited a signifi cant (P ≤ 0.05) and negative linear decline at all three sites from 2006 to 2014 when 0× K or the 1× fertilizer K rate was applied (Fig. 1). Soil test K decreased when 0× K was applied by 4.6, 5.0, and 4.4 mg kg–1 yr–1 at Clark, Wayne, and Wood, respectively. Th e higher CEC and percent organic mat-ter (%OM) of the clay loam soil at Wood compared to Clark and Wayne (Table 1) resulted in consistently greater STK concentrations from 2006 to 2014. Interestingly, STK declined by 4.0, 5.6, and 3.5 mg kg–1 yr–1 at Clark, Wayne, and Wood, respectively, with the 1× fertilizer K rate application. A negative nutrient balance was also estimated at all three sites with application of the 1× fertilizer K rate (Table 5). Soil test K signifi cantly decreased with the application of the 2× fertilizer K rate by 4.8 mg kg–1 yr–1 only at Wayne. Th ese results are in apparent disagreement with the large estimated nutri-ent surplus that was estimated to have developed with the applica-tion of the 2× fertilizer K rate (Table 5). Furthermore, the failure to signifi cantly increase STK when fertilizer K input exceeded the estimated nutrient removal of K in corn grain at these three sites contradicts the Tri-State Fertilizer Recommendations of Vitosh et al. (1995).
Th e soil test trends observed in this study are counter to what we expected, particularly given the framework of build and maintain outlined by the current fertilizer P and K recommendations (Vitosh et al., 1995). Th e Clark and Wayne county sites started in the soil test maintenance range, where fertilizer would be applied to match crop removal, and Wood started above the maintenance range limit where no fertilizer would be recommended. We expected soil P and K concentrations to increase under the 2× fertilizer treatment, particularly given the large nutrient surpluses that were estimated to have occurred over 9 yr (Table 5), and that soil P and K concen-trations would remain unchanged or only slightly decline with small nutrient defi ciencies occurring during the study under the 1×
Fig.1.SoiltestP(STP;mgkg–1Bray-P1)foreachfertilizerPrateaveragedacrossfertilizerKrates(topthreepanels)andsoiltestpotassium(STK;mgkg–1AA-K)foreachfertilizerKrateaveragedacrossfertilizerPrates(bottomthreepanels)incornatClark,Wayne,andWoodCountysitesfrom2006to2014.BlackdottedhorizontallinesindicatethemaintenancerangeofSTPandSTK.Errorbarsdenotestandarderrorofthemean.
Agronomy Journa l • Volume110, Issue1 • 2018 61
fertilizer treatment. Previous research would support this hypoth-esis, noting a build-up of STP or STK over time with surplus nutri-ent inputs (McLean, 1976; Mallarino et al., 1991a, 1991b; Dodd and Mallarino, 2005).
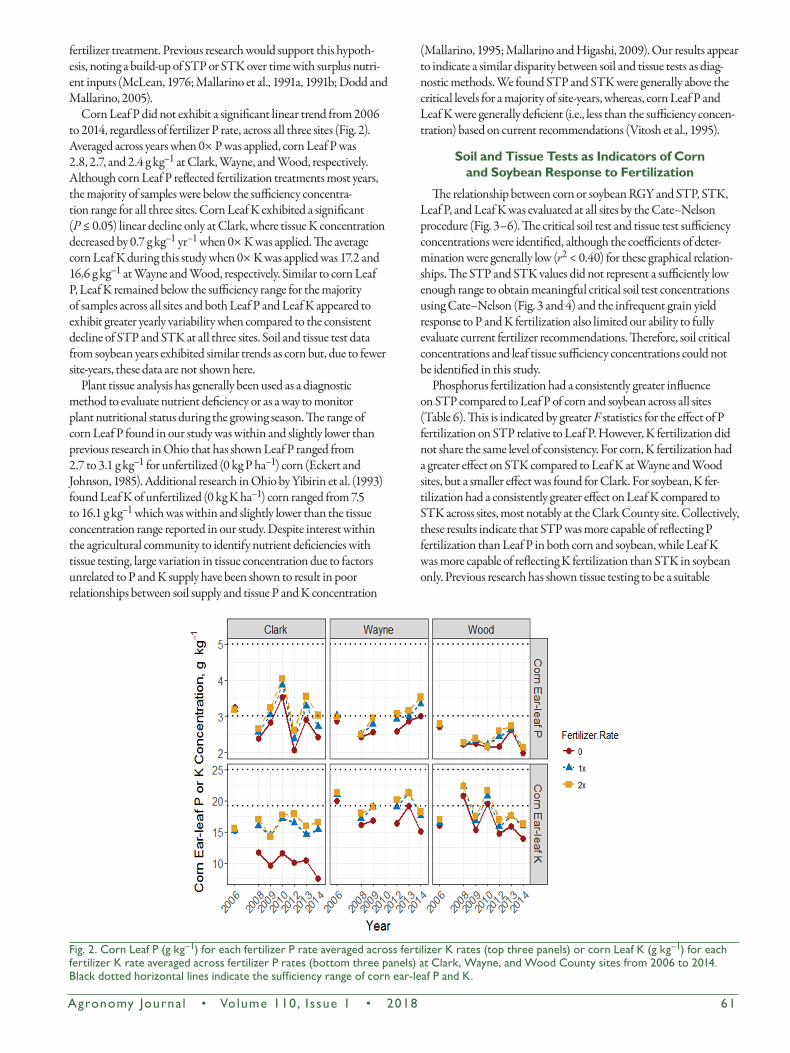
Corn Leaf P did not exhibit a signifi cant linear trend from 2006 to 2014, regardless of fertilizer P rate, across all three sites (Fig. 2). Averaged across years when 0× P was applied, corn Leaf P was 2.8, 2.7, and 2.4 g kg–1 at Clark, Wayne, and Wood, respectively. Although corn Leaf P refl ected fertilization treatments most years, the majority of samples were below the suffi ciency concentra-tion range for all three sites. Corn Leaf K exhibited a signifi cant (P ≤ 0.05) linear decline only at Clark, where tissue K concentration decreased by 0.7 g kg–1 yr–1 when 0× K was applied. Th e average corn Leaf K during this study when 0× K was applied was 17.2 and 16.6 g kg–1 at Wayne and Wood, respectively. Similar to corn Leaf P, Leaf K remained below the suffi ciency range for the majority of samples across all sites and both Leaf P and Leaf K appeared to exhibit greater yearly variability when compared to the consistent decline of STP and STK at all three sites. Soil and tissue test data from soybean years exhibited similar trends as corn but, due to fewer site-years, these data are not shown here.
Plant tissue analysis has generally been used as a diagnostic method to evaluate nutrient defi ciency or as a way to monitor plant nutritional status during the growing season. Th e range of corn Leaf P found in our study was within and slightly lower than previous research in Ohio that has shown Leaf P ranged from 2.7 to 3.1 g kg–1 for unfertilized (0 kg P ha–1) corn (Eckert and Johnson, 1985). Additional research in Ohio by Yibirin et al. (1993) found Leaf K of unfertilized (0 kg K ha–1) corn ranged from 7.5 to 16.1 g kg–1 which was within and slightly lower than the tissue concentration range reported in our study. Despite interest within the agricultural community to identify nutrient defi ciencies with tissue testing, large variation in tissue concentration due to factors unrelated to P and K supply have been shown to result in poor relationships between soil supply and tissue P and K concentration
(Mallarino, 1995; Mallarino and Higashi, 2009). Our results appear to indicate a similar disparity between soil and tissue tests as diag-nostic methods. We found STP and STK were generally above the critical levels for a majority of site-years, whereas, corn Leaf P and Leaf K were generally defi cient (i.e., less than the suffi ciency concen-tration) based on current recommendations (Vitosh et al., 1995).
Soil and Tissue Tests as Indicators of Corn and Soybean Response to Fertilization
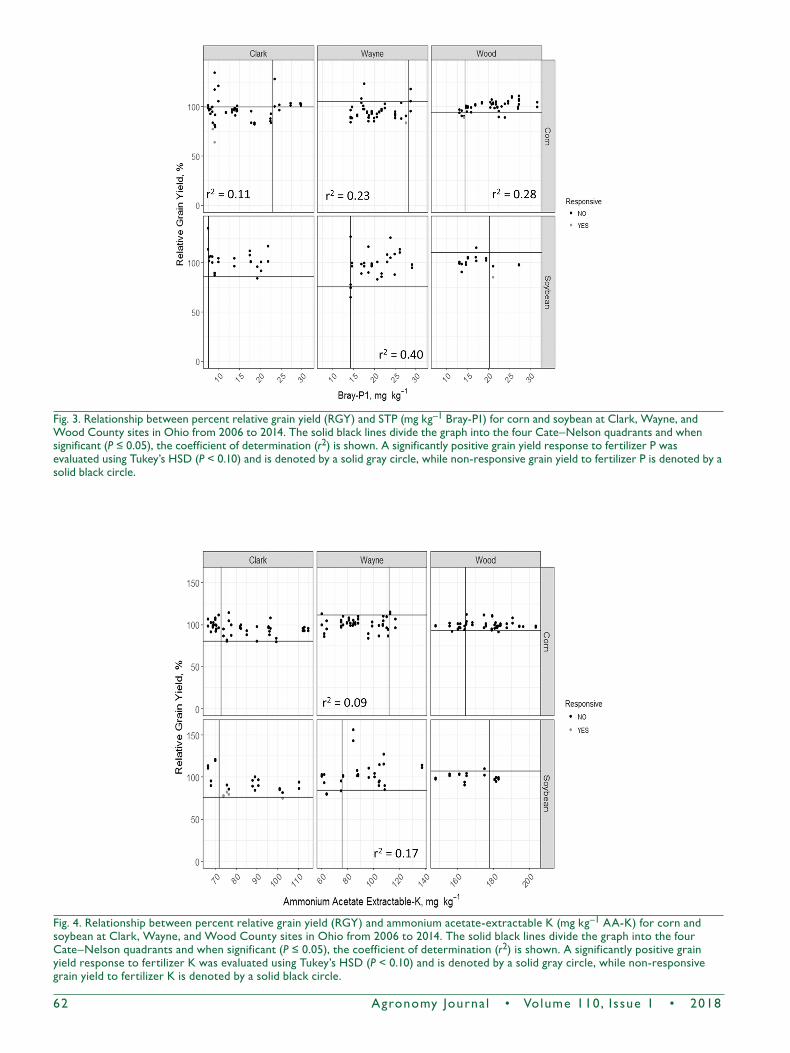
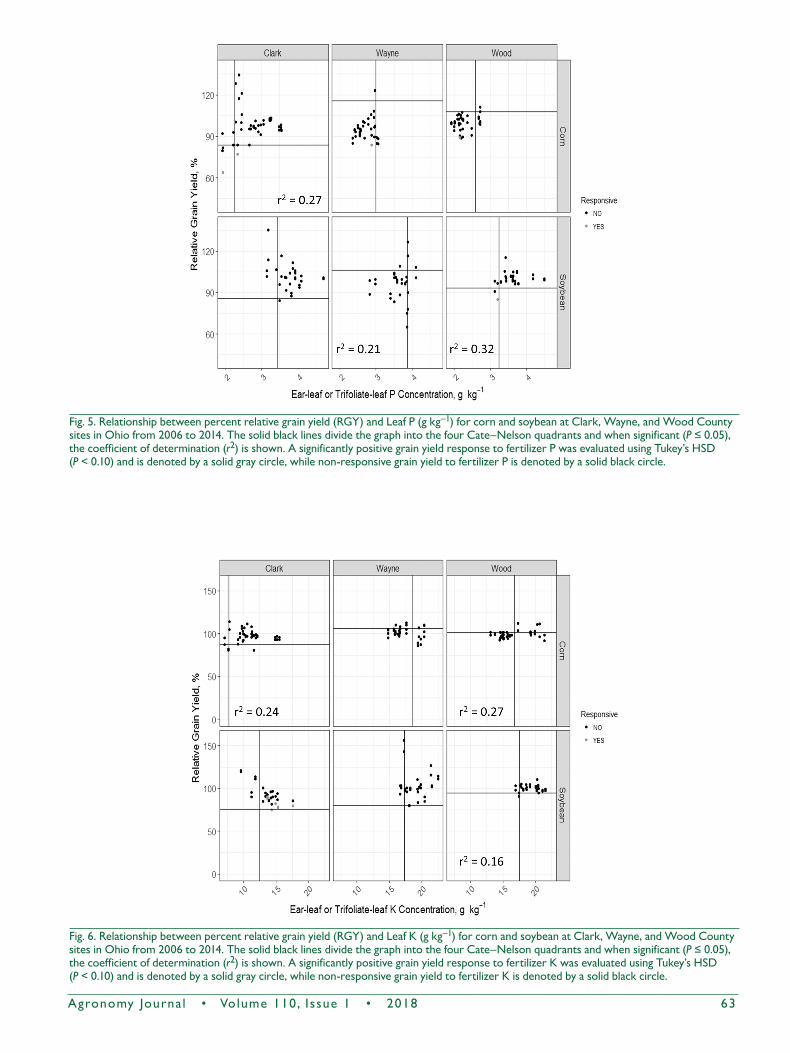
Th e relationship between corn or soybean RGY and STP, STK, Leaf P, and Leaf K was evaluated at all sites by the Cate–Nelson procedure (Fig. 3–6). Th e critical soil test and tissue test suffi ciency concentrations were identifi ed, although the coeffi cients of deter-mination were generally low (r2 < 0.40) for these graphical relation-ships. Th e STP and STK values did not represent a suffi ciently low enough range to obtain meaningful critical soil test concentrations using Cate–Nelson (Fig. 3 and 4) and the infrequent grain yield response to P and K fertilization also limited our ability to fully evaluate current fertilizer recommendations. Th erefore, soil critical concentrations and leaf tissue suffi ciency concentrations could not be identifi ed in this study.
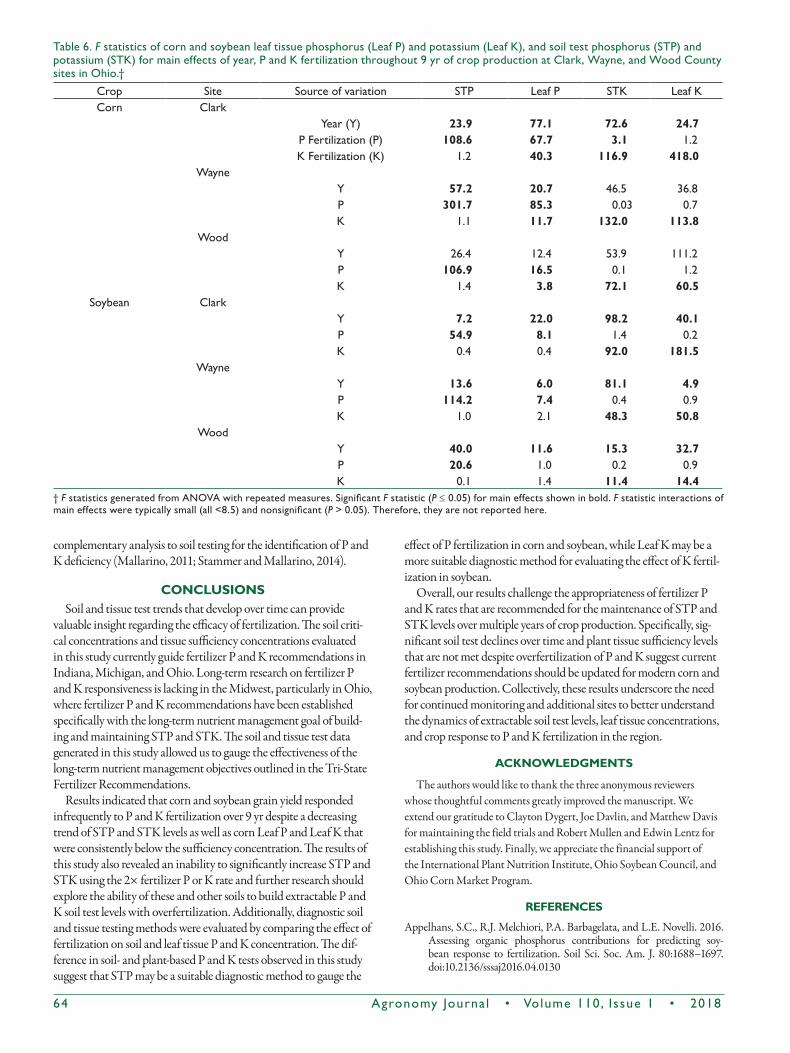
Phosphorus fertilization had a consistently greater infl uence on STP compared to Leaf P of corn and soybean across all sites (Table 6). Th is is indicated by greater F statistics for the eff ect of P fertilization on STP relative to Leaf P. However, K fertilization did not share the same level of consistency. For corn, K fertilization had a greater eff ect on STK compared to Leaf K at Wayne and Wood sites, but a smaller eff ect was found for Clark. For soybean, K fer-tilization had a consistently greater eff ect on Leaf K compared to STK across sites, most notably at the Clark County site. Collectively, these results indicate that STP was more capable of refl ecting P fertilization than Leaf P in both corn and soybean, while Leaf K was more capable of refl ecting K fertilization than STK in soybean only. Previous research has shown tissue testing to be a suitable
Fig.2.CornLeafP(gkg–1)foreachfertilizerPrateaveragedacrossfertilizerKrates(topthreepanels)orcornLeafK(gkg–1)foreachfertilizerKrateaveragedacrossfertilizerPrates(bottomthreepanels)atClark,Wayne,andWoodCountysitesfrom2006to2014.Blackdottedhorizontallinesindicatethesufficiencyrangeofcornear-leafPandK.
62 Agronomy Journa l • Volume110, Issue1 • 2018
Fig.3.Relationshipbetweenpercentrelativegrainyield(RGY)andSTP(mgkg–1Bray-P1)forcornandsoybeanatClark,Wayne,andWoodCountysitesinOhiofrom2006to2014.ThesolidblacklinesdividethegraphintothefourCate–Nelsonquadrantsandwhensignificant(P≤0.05),thecoefficientofdetermination(r2)isshown.AsignificantlypositivegrainyieldresponsetofertilizerPwasevaluatedusingTukey’sHSD(P<0.10)andisdenotedbyasolidgraycircle,whilenon-responsivegrainyieldtofertilizerPisdenotedbyasolidblackcircle.
Fig.4.Relationshipbetweenpercentrelativegrainyield(RGY)andammoniumacetate-extractableK(mgkg–1AA-K)forcornandsoybeanatClark,Wayne,andWoodCountysitesinOhiofrom2006to2014.ThesolidblacklinesdividethegraphintothefourCate–Nelsonquadrantsandwhensignificant(P≤0.05),thecoefficientofdetermination(r2)isshown.AsignificantlypositivegrainyieldresponsetofertilizerKwasevaluatedusingTukey’sHSD(P<0.10)andisdenotedbyasolidgraycircle,whilenon-responsivegrainyieldtofertilizerKisdenotedbyasolidblackcircle.
Agronomy Journa l • Volume110, Issue1 • 2018 63
Fig.5.Relationshipbetweenpercentrelativegrainyield(RGY)andLeafP(gkg–1)forcornandsoybeanatClark,Wayne,andWoodCountysitesinOhiofrom2006to2014.ThesolidblacklinesdividethegraphintothefourCate–Nelsonquadrantsandwhensignificant(P≤0.05),thecoefficientofdetermination(r2)isshown.AsignificantlypositivegrainyieldresponsetofertilizerPwasevaluatedusingTukey’sHSD(P<0.10)andisdenotedbyasolidgraycircle,whilenon-responsivegrainyieldtofertilizerPisdenotedbyasolidblackcircle.
Fig.6.Relationshipbetweenpercentrelativegrainyield(RGY)andLeafK(gkg–1)forcornandsoybeanatClark,Wayne,andWoodCountysitesinOhiofrom2006to2014.ThesolidblacklinesdividethegraphintothefourCate–Nelsonquadrantsandwhensignificant(P≤0.05),thecoefficientofdetermination(r2)isshown.AsignificantlypositivegrainyieldresponsetofertilizerKwasevaluatedusingTukey’sHSD(P<0.10)andisdenotedbyasolidgraycircle,whilenon-responsivegrainyieldtofertilizerKisdenotedbyasolidblackcircle.
64 Agronomy Journa l • Volume110, Issue1 • 2018
complementary analysis to soil testing for the identification of P and K deficiency (Mallarino, 2011; Stammer and Mallarino, 2014).
CONCLUSIONSSoil and tissue test trends that develop over time can provide
valuable insight regarding the efficacy of fertilization. The soil criti-cal concentrations and tissue sufficiency concentrations evaluated in this study currently guide fertilizer P and K recommendations in Indiana, Michigan, and Ohio. Long-term research on fertilizer P and K responsiveness is lacking in the Midwest, particularly in Ohio, where fertilizer P and K recommendations have been established specifically with the long-term nutrient management goal of build-ing and maintaining STP and STK. The soil and tissue test data generated in this study allowed us to gauge the effectiveness of the long-term nutrient management objectives outlined in the Tri-State Fertilizer Recommendations.
Results indicated that corn and soybean grain yield responded infrequently to P and K fertilization over 9 yr despite a decreasing trend of STP and STK levels as well as corn Leaf P and Leaf K that were consistently below the sufficiency concentration. The results of this study also revealed an inability to significantly increase STP and STK using the 2× fertilizer P or K rate and further research should explore the ability of these and other soils to build extractable P and K soil test levels with overfertilization. Additionally, diagnostic soil and tissue testing methods were evaluated by comparing the effect of fertilization on soil and leaf tissue P and K concentration. The dif-ference in soil- and plant-based P and K tests observed in this study suggest that STP may be a suitable diagnostic method to gauge the
effect of P fertilization in corn and soybean, while Leaf K may be a more suitable diagnostic method for evaluating the effect of K fertil-ization in soybean.
Overall, our results challenge the appropriateness of fertilizer P and K rates that are recommended for the maintenance of STP and STK levels over multiple years of crop production. Specifically, sig-nificant soil test declines over time and plant tissue sufficiency levels that are not met despite overfertilization of P and K suggest current fertilizer recommendations should be updated for modern corn and soybean production. Collectively, these results underscore the need for continued monitoring and additional sites to better understand the dynamics of extractable soil test levels, leaf tissue concentrations, and crop response to P and K fertilization in the region.
ACKNOWLEDGMENTS
The authors would like to thank the three anonymous reviewers whose thoughtful comments greatly improved the manuscript. We extend our gratitude to Clayton Dygert, Joe Davlin, and Matthew Davis for maintaining the field trials and Robert Mullen and Edwin Lentz for establishing this study. Finally, we appreciate the financial support of the International Plant Nutrition Institute, Ohio Soybean Council, and Ohio Corn Market Program.
REFERENCES
Appelhans, S.C., R.J. Melchiori, P.A. Barbagelata, and L.E. Novelli. 2016. Assessing organic phosphorus contributions for predicting soy-bean response to fertilization. Soil Sci. Soc. Am. J. 80:1688–1697. doi:10.2136/sssaj2016.04.0130
Table6.Fstatisticsofcornandsoybeanleaftissuephosphorus(LeafP)andpotassium(LeafK),andsoiltestphosphorus(STP)andpotassium(STK)formaineffectsofyear,PandKfertilizationthroughout9yrofcropproductionatClark,Wayne,andWoodCountysitesinOhio.†
Crop Site Sourceofvariation STP LeafP STK LeafKCorn Clark
Year(Y) 23.9 77.1 72.6 24.7PFertilization(P) 108.6 67.7 3.1 1.2KFertilization(K) 1.2 40.3 116.9 418.0
WayneY 57.2 20.7 46.5 36.8P 301.7 85.3 0.03 0.7K 1.1 11.7 132.0 113.8
WoodY 26.4 12.4 53.9 111.2P 106.9 16.5 0.1 1.2K 1.4 3.8 72.1 60.5
Soybean ClarkY 7.2 22.0 98.2 40.1P 54.9 8.1 1.4 0.2K 0.4 0.4 92.0 181.5
WayneY 13.6 6.0 81.1 4.9P 114.2 7.4 0.4 0.9K 1.0 2.1 48.3 50.8
WoodY 40.0 11.6 15.3 32.7P 20.6 1.0 0.2 0.9K 0.1 1.4 11.4 14.4
†FstatisticsgeneratedfromANOVAwithrepeatedmeasures.SignificantFstatistic(P ≤0.05)formaineffectsshowninbold.Fstatisticinteractionsofmaineffectsweretypicallysmall(all<8.5)andnonsignificant(P>0.05).Therefore,theyarenotreportedhere.
Agronomy Journa l • Volume110, Issue1 • 2018 65
Attia, A., C. Shapiro, W. Kranz, M. Mamo, and M. Mainz. 2015. Improved yield and nitrogen use efficiency of corn following soybean in irri-gated sandy loams. Soil Sci. Soc. Am. J. 79:1693–1703. doi:10.2136/sssaj2015.05.0200
Beuerlein, J., and A. Dorrance. 2005. Soybean production. Ohio agronomy guide. 14th ed. Ext. Bull. 472. Ohio State Univ. http://agcrops.osu.edu/sites/agcrops/files/imce/fertility/Ohio_Agronomy_Guide_b472.pdf (accessed 6 Dec. 2016). p. 57–71.
Bruulsema, T.W. 2016. Soil phosphorus trends in the Lake Erie region. Bet-ter Crops Plant Food 100:4–6.
Bruulsema, T.W., R.W. Mullen, I.P. O’Halloran, and D.D. Warncke. 2011. Agricultural phosphorus balance trends in Ontario, Michigan and Ohio. Can. J. Soil Sci. 91:437–442. doi:10.4141/cjss10002
Cate, R.B., and L.A. Nelson. 1971. A simple statistical procedure for par-titioning soil test correlation data into two classes. Soil Sci. Soc. Am. Proc. 35:658–660. doi:10.2136/sssaj1971.03615995003500040048x
Clover, M.W., and A.P. Mallarino. 2013. Corn and soybean tissue potas-sium content responses to potassium fertilization and relationships with grain yield. Soil Sci. Soc. Am. J. 77:630–642. doi:10.2136/sssaj2012.0223
Dodd, J.R., and A.P. Mallarino. 2005. Soil-test phosphorus and crop grain yield responses to long-term phosphorus fertilization for corn-soybean rotations. Soil Sci. Soc. Am. J. 69:1118–1128. doi:10.2136/sssaj2004.0279
Eckert, D.J., and J.W. Johnson. 1985. Phosphorus fertilization in no-tillage corn production. Agron. J. 77:789–792. doi:10.2134/agronj1985.00021962007700050028x
Fernandez, F.G., and R.G. Hoeft. 2009. Managing soil pH and crop nutri-ents. In: R.G. Hoeft and E. Nafziger, editors, Illinois agronomy hand-book. 24th ed. Univ. of Illinois Ext.-College of Agric., Consumer and Environ. Sci., Urbana-Champaign. p. 91–112.
Fixen, P.E., and T.S. Murrell. 2002. P and K reserves growing thinner. Fluid J. 10:8–11.
Fixen, P.E., R. Williams, and Q.B. Rund. 2011. NUGIS: A nutri-ent use geographic information system for the U.S. IPNI Publ. 30-3270. Int. Plant Nutrition Inst. http://www.ipni.net/NuGIS (accessed 5 July 2017).
Frank, K., D. Beegle, and J. Denning. 1998. Phosphorus. In: J.R. Brown, edi-tor, Recommended chemical soil test procedures for the North Cen-tral region. North Central Regional Publ. 221 (Rev.). Missouri Exp. Stn. Publ. SB 1001. Univ. of Missouri, Columbia. http://extension.missouri.edu/explorepdf/specialb/sb1001.pdf (accessed 6 Dec. 2016). p. 21–30.
Jones, J.B., Jr., and V.W. Case. 1990. Sampling, handling, and analyzing plant tissue samples. In: R.L. Westerman, editor, Soil testing and plant analysis. 3rd ed. SSSA Book Ser. 3. SSSA, Madison, WI. p. 389–428.
Li, R.-G., and S.A. Barber. 1988. Effect of phosphorus and potassium fertil-izer on crop response and soil fertility in a long-term experiment. Fert. Res. 15:123–136. doi:10.1007/BF01050674
Loux, M.M., D. Doohan, A.F. Dobbels, W.G. Johnson, B.G. Young, T.R. Legleiter, and A. Hager. 2016. Weed control guide for Ohio, Indiana and Illinois. Ext. Publ. WS16. Bull. 789/IL15. Ohio State Univ., Columbus.
Mangiafico, S. 2017. rcompanion: Functions to support extension education program evaluation. R package version 1.5.7. Rutgers Coop. Ext., New Brunswick, NJ. https://CRAN.R-project.org/package=rcompanion (accessed 6 July 2017).
Mallarino, A.P. 1995. Evaluation of excess soil phosphorus supply for corn by the ear-leaf test. Agron. J. 87:687–691. doi:10.2134/agronj1995.00021962008700040014x
Mallarino, A.P. 2011. Interpretation of plant tissue test results for phospho-rus and potassium in corn and soybean: Proc. NCERA-13 Commit-tee, editors, North Central Region Soil and Plant Analyst Workshop, Iowa City, IA. 26–27 Feb. 2011. Univ. of Missouri, Columbia.
Mallarino, A.P., and S.L. Higashi. 2009. Assessment of potassium supply for corn by analysis of plant parts. Soil Sci. Soc. Am. J. 73:2177–2183. doi:10.2136/sssaj2008.0370
Mallarino, A.P., J.E. Sawyer, and S.K. Barnhart. 2013. A general guide for crop nutrient and limestone recommendations in Iowa. Publ. PM-1688 (Revised October 2013) Iowa State Univ. Ext., Ames.
Mallarino, A.P., J.R. Webb, and A.M. Blackmer. 1991a. Corn and soybean yields during 11 years of phosphorus and potassium fertilization on a high-testing soil. J. Prod. Agric. 4:312–317. doi:10.2134/jpa1991.0312
Mallarino, A.P., J.R. Webb, and A.M. Blackmer. 1991b. Soil test values and grain yields during 14 years of potassium fertilization of corn and soy-bean. J. Prod. Agric. 4:562–566.
McCollum, R.E. 1991. Buildup and decline in soil phosphorus: 30-year trends on a Typic Umprabuult. Agron. J. 83:77–85. doi:10.2134/agronj1991.00021962008300010019x
McLean, E.O. 1976. Exchangeable K levels for maximum crop yields on soils of different cation exchange capacities. Commun. Soil Sci. Plant Anal. 7:823–838.
Murrell, T.S., P.E. Fixen, T.W. Bruulsema, T.L. Jensen, R.L. Mikkelsen, S.B. Phillips, and W.M. Stewart. 2015. The fertility of North American soils: A preliminary look at the 2015 results. Better Crops Plant Food 99:28–31.
Peterson, L.A., and A.R. Krueger. 1980. Variation in content of available P and K (bray 1) in soil samples from a cropped N, P, and K fertility experiment over 8 years. Commun. Soil Sci. Plant Anal. 11:993–1004. doi:10.1080/00103628009367098
R Core Team. 2015. R: A language and environment for statistical comput-ing. R Foundation for Statistical Computing, Vienna, Austria. https://www.R-project.org/ (accessed 2 Nov. 2016).
Soil Survey Staff, Natural Resources Conservation Service, U.S. Depart-ment of Agriculture. 2016. Web soil survey. Natl. Resources Conserv. Serv. https://websoilsurvey.sc.egov.usda.gov/ (accessed 27 Mar. 2017).
Stammer, A., and A.P. Mallarino. 2014. Field correlation of tissue testing for phosphorus and potassium in corn and soybean: Proceedings North Central Extension-Industry Soil Fertility Conference, Des Moines, IA. 19–20 Nov. 2014. Int. Plant Nutrition Inst., Brookings, SD.
Thomas, G.W. 1996. Soil pH and soil acidity. In: D.L. Sparks et al., edi-tors, Methods of soil analysis. Part 3. SSSA Book Ser. 5. SSSA, Madison, WI.
Thomison, P., P. Lipps, R. Hammond, R. Mullen, and B. Eisley. 2005. Corn production. Ohio agronomy guide. 14th ed. Ext. Bull. 472. Ohio State Univ. http://agcrops.osu.edu/sites/agcrops/files/imce/fertility/Ohio_Agronomy_Guide_b472.pdf (accessed 6 Dec. 2016). p. 31–56.
USDA-NASS. 2015. Quick stats. U.S. Dep. of Agric.-National Agric. Statistics Serv., Washington, DC. https://quickstats.nass.usda.gov/ (accessed 2 Nov. 2016).
Vitosh, M.L., J.W. Johnson, and D.B. Mengel. 1995. Tri-State fertilizer rec-ommendations for corn, soybeans, wheat and alfalfa. Ext. Bull. E-2567. Michigan State Univ., East Lansing.
Warncke, D., and J.R. Brown. 1998. Potassium and other basic cations. In: J.R. Brown, editor, Recommended chemical soil test procedures for the North Central region. North Central Regional Publ. 221 (Rev.). Mis-souri Exp. Stn. Publ. SB 1001. Univ. of Missouri, Columbia. http://extension.missouri.edu/explorepdf/specialb/sb1001.pdf (accessed 6 Dec. 2016). p. 31–34.
Wickham, H. 2009. ggplot2: Elegant graphics for data analysis. Springer, New York.
Yibirin, H., J.W. Johnson, and D.J. Eckert. 1993. No-till corn production as affected by mulch, potassium placement, and soil exchangeable potas-sium. Agron. J. 85:639–644. doi:10.2134/agronj1993.00021962008500030022x