outreach and efficiency of microfinance institutions
TRANSCRIPT
World Development Vol. 39, No. 6, pp. 938–948, 2011� 2011 Elsevier Ltd. All rights reserved
0305-750X/$ - see front matter
www.elsevier.com/locate/worlddevdoi:10.1016/j.worlddev.2009.10.018
Outreach and Efficiency of Microfinance Institutions
NIELS HERMESUniversity of Groningen, The Netherlands
ROBERT LENSINKUniversity of Groningen, The Netherlands
Wageningen University and CREDIT, The NetherlandsUniversity of Nottingham, UK
and
ALJAR MEESTERS *
University of Groningen, The Netherlands
Summary. — This paper uses stochastic frontier analysis to examine whether there is a trade-off between outreach to the poor and effi-ciency of microfinance institutions (MFIs). We find convincing evidence that outreach is negatively related to efficiency of MFIs. Morespecifically, we find that MFIs that have a lower average loan balance (a measure of the depth of outreach) are also less efficient. More-over, we find evidence showing that MFIs that have more women borrowers as clients (again a measure of the depth of outreach) are lessefficient. These results remain robustly significant after having added a number of control variables.� 2011 Elsevier Ltd. All rights reserved.
Key words — microfinance, outreach, sustainability
*Final revision accepted: October 30, 2009
1. INTRODUCTION
Microfinance institutions (MFIs) focus on providing creditto the poor who have no access to commercial banks, in orderto reduce poverty and to help the poor with setting up theirown income generating businesses. In the literature, this focusis generally described as outreach. Because providing credit tothe poor in many cases is a very costly activity, focusing onoutreach may, at least potentially, conflict with the financialsustainability of MFIs. Therefore, Western donors and NGOshave provided financial support by offering MFIs loansagainst below-market interest rates, helping them in lendingto domestic small companies and poor agents.
Recently, however, there seems to be a shift from subsidiz-ing MFIs institutions to a focus on financial sustainabilityand efficiency of these institutions. This goal stresses theimportance of being able to cover the cost of lending moneyout of the income generated from the outstanding loan portfo-lio and to reduce these costs as much as possible. Among otherthings, this increased focus on financial sustainability and effi-ciency is due to a number of developments the microfinancebusiness has been recently confronted with, such as theincreasing competition among MFIs, the commercializationof microfinance (i.e., the interest of commercial banks andinvestors to finance MFIs), technological change that alsohas become available for, and implemented in microfinance,and financial liberalization and regulation policies of the gov-ernment (Rhyne & Otero, 2006). These developments have in-duced microfinance institutions to change their behavior, andto broaden their services and activities.
The question that pops up is whether and to what extentshifting the focus towards increased financial sustainabilityand efficiency has implications for the outreach of MFIs. Onthe one hand, the commercialization of microfinance may at-
938
tract increased commercial funds, which may contribute tosupporting the outreach goal of MFIs. They may enlarge theamount of loans to the poor and/or ensure the provision ofsuch loans for a longer period of time. Thus, the absolutenumber of poor people that have access to MFIs may be in-creased. Moreover, increased competition, technologicalchange, and financial market policies, which focus onstrengthening market forces and improving the stability ofMFIs, may positively contribute to the efficiency of MFIs.This, in turn, may help generating more financial resourceswith which the poor can be helped. Under these circumstances,outreach and financial sustainability and efficiency seem to becompatible objectives.
Yet, focusing on financial sustainability and efficiency mayalso go at the cost of lending to the poor. As lending moneyto the poor—especially the very poor and/or the ruralpoor—can be very costly, the outreach and sustainability goalmay be conflicting. Especially in policy circles there is a heftydebate on the compatibility versus the trade-off between sus-tainability and outreach. Whereas the so-called welfarist viewstresses the importance of outreach and the threat of focusingtoo much on sustainability, the institutionalist view claimsthat MFIs should focus on sustainability.
While from a policy perspective it is very important to knowwhether the strife for financial sustainability and efficiency iscompatible or conflicting with the outreach goal, there are sur-prisingly few studies that have investigated this issue in a sys-tematic and appropriate way. Most studies only provideanecdotal evidence and use small datasets and/or simple anal-yses, except for Cull, Demirguc�-Kunt, and Morduch (2007).
OUTREACH AND EFFICIENCY OF MICROFINANCE INSTITUTIONS 939
Our study aims at going beyond the existing empirical anal-yses in two important ways. First, we provide an indepth anal-ysis of the potential compatibility or trade-off betweenefficiency of MFIs and their outreach by using a large dataset,containing information for a large number of MFIs over alonger period of time than previous studies in this field. Sec-ond, we use different measures of sustainability. In particular,we use stochastic frontier analysis (SFA)—a technique thathas not been used extensively in the field of microfinance—to measure the efficiency of individual MFIs. We then linkthe efficiency measures obtained from the SFA to measuresof outreach. For the analysis we use data for 435 MFIs, whichwe obtained from MixMarkete over the period 1997–2007.
The remainder of the paper is organized as follows. Section2 discusses the literature on the relationship between financialsustainability, efficiency, and outreach of MFIs. In Section 3we set out the research methodology and explain the SFA insome detail. Section 4 continues with a description of the data-set, after which the estimation results are presented in Section5. In Section 6 we summarize the main findings and providethe conclusions we derive from the analysis.
2. FINANCIAL SUSTAINABILITY, EFFICIENCY,AND OUTREACH: A SHORT DISCUSSION OF
THE LITERATURE
Recently, MFIs have been confronted with a number ofchallenges that have affected their way of doing business. 1
First, in several countries competition among MFIs has in-creased rapidly (Rhyne & Otero, 2006). The consequences ofthis increased competition for MFIs can be manifold, forexample, lower interest rates, lower costs, more efficiency,and the introduction of new financial services, such as savingaccounts and insurance services. Bolivia is an example of acountry that has experienced increasing competition in themicrofinance industry since the late 1990s. Since then interestrates have gone down from 30% in 1998 to 21% in 2005. More-over, Bolivian MFIs have become more efficient and they haveincreased the range of financial services they offer to their cli-ents (Rhyne & Otero, 2006).
Second, commercial banks have started to become inter-ested in providing microfinance, since in the past MFIs haveshown that this can be a successful and profitable business.K-REP in Kenya and the Commercial Bank of Zimbabweare two examples of commercial banks that have become in-volved in lending to the poor (referred to as “downscaling”)recently. 2 Moreover, in some countries the government hasactively stimulated commercial banks to become involved inmicrofinance. 3 Again, this may have put pressure on MFIsto reduce interest rates and costs and raise efficiency.
Third, commercial banks and investors, especially thosefrom developed countries, have become increasingly interestedin financing MFIs. Large banks such as Citigroup, DeutscheBank, and HSBC, for example, have separate microfinancedivisions, supporting activities of MFIs. The interest of multi-national banks is due to the so-called “double bottom line” offinancing and supporting MFIs: it allows banks and investorsto show their corporate social responsibility, while at the sametime these investments provide attractive risk-return profiles(Deutsche Bank Research, 2007). The first example of com-mercial capitalization of MFIs was the creation of an invest-ment fund called Profund in 1995, which raised $23 millionto finance Latin American MFIs. In 2006 private investmentfunds, also known as microfinance investment vehicles(MIVs), held portfolios of MFIs shares with a total value of
$2.3 billion (CGAP, 2007). Yet, the increased interest fromcommercial players may have also raised the need for MFIsto become financially sustainable and enhance their efficiency.
Moreover, two additional recent developments have helpedMFIs to improve their sustainability and efficiency. First, newbanking technology, such as charge cards, ATMs, the use ofcell phones, and the internet has begun to enter the microfi-nance business, helping to reduce costs and improve the deliv-ery of services (Kapoor, Ravi, & Morduch, 2007; Rhyne &Otero, 2006). Second, several developing countries have re-cently liberalized financial markets, while at the same timeinstalling regulations to help in improving the stability of themicrofinance business. These changes of financial market pol-icies may also contribute to improving the sustainability andefficiency of microfinance (Hartarska & Nadolnyak, 2007).
The above developments and the resulting emphasis on sus-tainability and efficiency of MFIs may go at the cost of theiroutreach, however. Reaching the poor and providing themwith credit may be very costly. Making very small loans in-volves high transaction costs, in terms of screening, monitor-ing, and administration costs, per loan. Several authors,therefore, argue that the unit transaction costs for small loansto the poor are high as compared to unit costs of larger loans(Conning, 1999; Hulme & Mosley, 1996; Lapenu & Zeller,2002; Paxton & Cuevas, 2002). Thus, there may be a trade-off between efficiency and outreach, implying that the shiftingfocus towards increasing sustainability and efficiency reducesthe scope for the more traditional aim of many MFIs, whichis lending to the poor.
What is the evidence on this trade-off between efficiency andoutreach? In policy circles there has been a hefty debate on thisissue between the welfarists, who propagate the dominance ofthe outreach goal (Hashemi & Rosenberg, 2006; Montgomery& Weiss, 2005; Woller, 2002), and the institutionalists, whostress the importance of sustainability and efficiency (Christen,2001; Isern & Porteous, 2005; Rhyne, 1998). Both camps pro-vide (in many cases mostly anecdotal) evidence to supporttheir view. Recently, however, representatives from bothcamps seem to have moved towards the center, concludingthat, under certain conditions, sustainability and outreachmay be compatible (Morduch, 2005).
In the academic literature, however, we find surprisingly fewrigorous testings of this issue. The most comprehensive studyis from Cull et al. (2007). They examine the financial perfor-mance (using measures of profitability) and outreach in a largecomparative study, based on a new and extensive dataset of124 MFIs in 49 countries. The study suggests that MFIs thatfocus on providing loans to individuals perform better interms of profitability. Yet, the fraction of poor borrowersand female borrowers in the loan portfolio of these MFIs islower than for MFIs that focus on lending to groups. It alsosuggests that individual-based MFIs, especially if they growlarger, focus increasingly on wealthier clients, a phenomenontermed as “mission drift.” This mission drift does not occuras strongly for the group-based MFIs. Thus, Cull et al.(2007) do find evidence for a trade-off between efficiency andoutreach. In a more recent, largely descriptive paper, Cull,Demirguc�-Kunt, and Morduch (2009) provide further evi-dence indicating that a trade-off between outreach and com-mercialization may exist.
Cull et al. (2007) support the findings of several earlier stud-ies, which, however, used less rigorous techniques and/orsmaller datasets. Olivares-Polanco (2005) investigates thedeterminants of outreach in terms of the loan size of MFIs,using data for 28 MFIs in Latin America for the years1999–2001. The analysis includes only one observation for
940 WORLD DEVELOPMENT
each MFI in the dataset. Using simple OLS, Olivares-Polan-co’s study confirms the existence of a trade-off between sus-tainability and outreach. Makame and Murinde (2006)analyze the outreach versus sustainability trade-off using a bal-anced panel dataset for 33 MFIs in five East African countriesfor the period 2000–05. Using different measures of the depth(loan size) and breadth (number of borrowers) of outreach,they find strong evidence for a trade-off between outreachand sustainability and efficiency. In contrast, Gonzalez andRosenberg (2006), using data of 2,600 MFI in 2004, suggestthat there seems to be no conflict between financial sustain-ability and outreach. Although their dataset looks impressive,the limitation of the analysis is that their data are largely self-reported and unadjusted (Cull et al., 2009).
Navajas, Conning, and Gonzalez-Vega (2003) do not di-rectly analyze the existence of the trade-off, but their studymay have implications for outreach versus sustainability. Theydiscuss the Bolivian microfinance market developments sincethe mid-1990s and show that due to increased competitionMFIs changed their lending technologies and the borrowerson which they focus their activities. In particular, their discus-sion suggests that the new competitor in the market (in Boli-via, this was Caja Los Andes) offered loan contracts thatattracted less poor and more productive borrowers. Conse-quently, the first mover in the microfinance market (Bancosol)had to adjust its lending policies and, according to Navajaset al. (2003), it switched to loan contracts that prevented theless poor, more productive borrowers to move to Caja LosAndes. Implicitly, this suggests that competition leads to lessaccess to credit for the poorest, that is, less outreach. In a re-lated paper, McIntosh, De Janvry, and Sadoulet (2005) focuson the effects of increased competition in microfinance. Intheir study, they empirically show that wealthier borrowersare likely to benefit from increasing competition among micro-finance institutions, but that it leads to lower levels of welfarefor the poorer borrowers. This seems to support the view thatoutreach is hurt by the pressure of competition on the businessof microfinance.
To conclude, the above review shows that there is only lim-ited empirical evidence on the compatibility or trade-off be-tween sustainability and outreach of MFIs. The few studiesavailable suggest that there is a trade-off, yet they mostly usesmall datasets and/or simple analyses, except for Cull et al.(2007). Our study aims at going beyond the existing empiricalanalyses in two important ways. First, we use a substantiallylarger dataset, containing information for a large number ofMFIs over a longer period of time than any of the previousstudies in this field. Secondly, we use different measures of sus-tainability. In particular, we look at the cost efficiency ofmicrofinance institutions. In order to do this, we formulate acost function, apply the so-called stochastic frontier analysis(SFA) to determine a cost frontier, and determine which fac-tors may explain the distance from the best practice cost func-tion (i.e., cost inefficiency). We focus on cost efficiency, andnot on profit efficiency (which has also been used in the liter-ature on efficiency of banks), because for MFIs the focus withrespect to efficiency is not on being profitable as such. Theirultimate goal is to reduce poverty and they focus more onhow to be cost efficient (and thus financially sustainable) inattaining this ultimate goal.
To be sure, we are not the first analyzing the efficiency ofMFIs and its determinants. Actually, there are a few recentstudies that have looked into this issue. Qayyum and Ahmad(2006) narrowly focus on measuring the efficiency of 19 MFIsin three South Asian countries (i.e., without looking at theunderlying determinants) for which they use data envelopment
analysis (DEA). Desrochers and Lamberte (2003) measureefficiency for a sample of 50 co-operative rural banks, usingdifferent methodologies, such as SFA and the distribution freeapproach. They focus on aspects of corporate governance andshow that more efficient rural banks are the ones that arebetter able to control agency costs. Gutierrez-Nieto,Serrano-Cinca, and Mar Molinero (2007), who also useDEA, investigate the efficiency of 30 Latin American MFIsand show that differences in efficiency levels are associatedwith the location of the MFIs (i.e., in which country theyare) as well as with their institutional type. Paxton (2007) usesSFA to measure the efficiency of 190 Mexican Popular Savingsand Credit Institutions and concludes that differences in effi-ciency are associated with differences in technology, averageloan size, rural outreach, and the age of the institution. Caud-ill, Gropper, and Hartarska (2009) use data from 137 MFIs in21 Eastern European and Central Asian countries. They use amixture modeling approach to estimate cost functions, allow-ing for heterogeneity of cost functions of MFIs. Based on theiranalysis, they show that MFIs become more efficient overtime, yet this is dependent on their size and whether they offerdeposits, as well as on the extent to which they receive subsi-dies.
We draw two conclusions from the above review of studieson the efficiency of MFIs. First, none of the above studiesexplicitly deals with the question of the trade-off between effi-ciency and outreach. Although some studies (e.g., Caudillet al., 2009; Paxton, 2007) take into account determinants thatare related to outreach, they all focus more generally on thedeterminants of efficiency of these institutions. Second, theabove studies use data from relatively small samples of MFIsand restrict themselves to one or a few countries, or to coun-tries located in just one region. Thus, in our view the paperdefinitely makes an important contribution to the existing lit-erature on the efficiency of MFIs by explicitly focusing on thetrade-off between outreach and efficiency, using informationfor a large set of 435 MFIs for which we have over 1,300 insti-tutional-year observations.
3. METHODOLOGY
In our analysis we measure cost efficiency in terms of howclose the actual costs of the lending activities of an MFI areto what the costs of a best-practice MFI would have been incase it produces identical output under the same conditions.Cost efficiency measures the reduction in cost that could havebeen achieved if an MFI were both allocatively and technicallyefficient. As cost functions are not directly observable, ineffi-ciencies are measured in comparison with an efficient costfrontier. Most studies on cost efficiency use data envelopmentanalysis (DEA) or stochastic frontier analysis (SFA) to calcu-late this frontier. We use SFA, since it controls for measure-ment errors and other random effects. 4 More specifically, weuse the SFA suggested by Battese and Coelli (1995), hence-forth the BC model. An advantage of the BC model as com-pared to the standard two-step SFA of Aigner, Lovell, andSchmidt (1977) and Meeusen and van den Broeck (1977) isthat the BC model simultaneously estimates the cost frontierand the coefficients of the efficiency variables. Thus, the modelwe apply is a one-step approach using SFA to investigate thedeterminants of the inefficiency of individual MFIs vis-a-vis acommon cost frontier. Wang and Schmidt (2002) show that atwo-step approach suffers from the assumption that the effi-ciency term is independent and identically truncated, normallydistributed in the first step, while in the second step the
OUTREACH AND EFFICIENCY OF MICROFINANCE INSTITUTIONS 941
efficiency terms are assumed to be normally distributed anddependent on the explanatory variables. Therefore, this meth-od inherently renders biased coefficients.
The general BC model specifies a stochastic cost frontierwith the following properties:
ln Ci;t ¼ Cðyi;t;wi;t; qi;t; bÞ þ ui;t þ vi;t; ð1Þ
where Ci,t is the total cost MFI i faces at time t andCðyi;t;wi;t; bÞ is the cost frontier. In this cost frontier, yi;t repre-sents the logarithm of output of MFI i at time t, wi;t is a vectorof the logarithm of input prices of MFI i at time t, q are MFIspecific control variables and b is a vector of all parameters tobe estimated. The term ui,t captures cost inefficiency and isindependent and identically distributed with a truncated nor-mal distribution. 5 vi,t captures measurement errors and ran-dom effects, for example, good and bad luck, and isdistributed as a standard normal variable. Both ui,t and vi,t
are time and MFI specific and can be represented as:
ui;t � Nþðmi;t; r2uÞ; ð2Þ
vi;t � iidNð0; r2vÞ: ð3Þ
Next, we model the inefficiency of an MFI as:
mi;t ¼ d0 þX
n
dnzn;i;t: ð4Þ
In Eqn. (4), z represents the vector of n variables that deter-mine the inefficiency (m) of MFI i at time t. The deltas repre-sent the coefficients. Eqns. (1) and (4) are solved in one step byusing maximum likelihood.
For the specification of the cost function we use the modeldeveloped by Sealey and Lindley (1977), who state that a bankacts as an intermediate between funders and borrowers. Inparticular, we use total expenses per unit of labor and theinterest expenses per unit of deposits held as input prices,whereas we use the gross loan portfolio of an MFI as our mea-sure of output. The cost function has a translog specification,and can be specified as follows:
ln TCi;tð Þ ¼ b0 þ b1 ln SALARY i;tð Þ þ b2 ln Ri;tð Þ þ b3
� ln GLP i;tð Þ þ b4 ln SALARY i;tð Þ2 þ b5
� ln Ri;tð Þ2 þ b6 ln GLP i;tð Þ2 þ b7
� ln SALARY i;tð Þ ln Ri;tð Þ þ b8
� ln SALARY i;tð Þ ln GLP i;tð Þ þ b9
� ln Ri;tð Þ ln GLP i;tð Þ þ b10YEARt þ b11YEAR2t
þ b12YEARtðSALARY i;tÞ þ b13YEARðRi;tÞ
þX17
j¼14
bjMFITYPEi;t þ b18EQUITY i;t þ b19LLRi;t
þ ui;t þ vi;t: ð5ÞIn Eqn. (5) TC represents total costs an MFI faces, SAL-
ARY represents the price of a unit of labor for one year, Ris the interest expenses per unit of deposits held, GLP is thegross loan portfolio, and MFITYPE refers to the type ofMFI. TC is measured as the total expenses of an MFI; SAL-ARY is measured as the total operating expenses per employeeof an MFI; R is the MFI’s total financial expenses per dollarof deposits; and GLP is the gross loan portfolio of theMFI. 6 The cost function specification takes into account theindividual input and output variables, the square of these vari-ables, as well as combinations of these variables. All variables
in Eqn. (5) are taken in logs. We also include a year dummy(YEAR), which runs from 1 to 11, the square of the year dum-my, and its interactions with the input variables to account fortechnology changes over time. 7
In order to control for the fact that different types of MFIsmay have different cost functions, we add a vector of dummiesfor the type of MFI (MFITYPE). In particular, cost functionsmay differ between types of MFI due to differences in the levelsof subsidies these institutions receive from outside. The datawe use (discussed in more detail below) do not provide de-tailed information about subsidies received, which stressesthe need for adding controls for the MFI type. 8 In the estima-tion outcomes discussed below we report the results for thespecific dummy variables we have created for the type ofMFI. In particular, we have dummy variables for banks(BANK), cooperatives (COOP), non-bank financial institu-tions (NONBANK) non-governmental organizations (NGO),rural banks (RURBANK), and other organizations (OTHER).The dummy variable OTHER is left out of the empirical anal-ysis for reasons of singularity.
Finally, we add a number of additional control variables.First, we include the equity to total assets ratio (EQUITY)as a measure of the differences in risk taking by MFIs as issuggested by, among others, Berger and De Young (1997),Dietsch and Lozano-Vivas (2000), Lozano-Vivas, Pastor,and Hasan (2001) and Grigorian and Manole (2006). Second,as some other studies do, we also include loan loss reserves di-vided by gross loans outstanding (LLR) to control for differ-ences in the risk taking strategies among MFIs (Fries &Taci, 2005; Lensink, Meesters, & Naaborg, 2008).
As mentioned before, the central aim of the paper is toinvestigate the trade-off (or compatibility) between sustainabil-ity and efficiency versus outreach of MFIs. In the frameworkwe use, mi,t is our measure of inefficiency of an MFI. To ana-lyze the relationship between efficiency and outreach we spec-ify an empirical model, in which the inefficiency variable is thedependent variable and in which we have a number of mea-sures of outreach. Additionally, we include a number of con-trol variables that may also influence the inefficiency of MFIs.
The general specification of the inefficiency equations weestimate is as follows:
mi;t ¼ d0 þ d1ALBi;t þ d2WOMANi;t þ di¼3:::6LOANTYPEi;t
þ d7AGEi;t: ð6Þ
In this equation m stands for the first moment of the ineffi-ciency distribution for MFI i at time t. The higher this mo-ment, the more likely it is that the MFI is inefficient. Thefirst two variables in this equation are generally accepted mea-sures of outreach. They have also been used in other studies(e.g., Ferro Luzzi and Weber, 2006; Makame & Murinde,2006; Olivares-Polanco, 2005; Paxton, 2007). These variablesare central to our analysis. ALB is the log of the average loanbalance per borrower (in US dollars). Higher values of ALBindicate less depth of outreach, since in this case the MFI isexpected to provide fewer loans to poor borrowers. WOMANdenotes the percentage of female borrowers in the total loanportfolio of the MFI. Higher values for this measure indicatemore depth of outreach, since lending to women is associatedwith lending to poor borrowers.
We acknowledge that our measures are perhaps roughapproximations of outreach. First, they cover only one aspector dimension, that is, the depth of outreach. As discussed inSchreiner (2002), outreach may have several dimensions, suchas the value a microfinance loan has for the client (i.e., theworth of the loan), the cost of the loan to the client, the
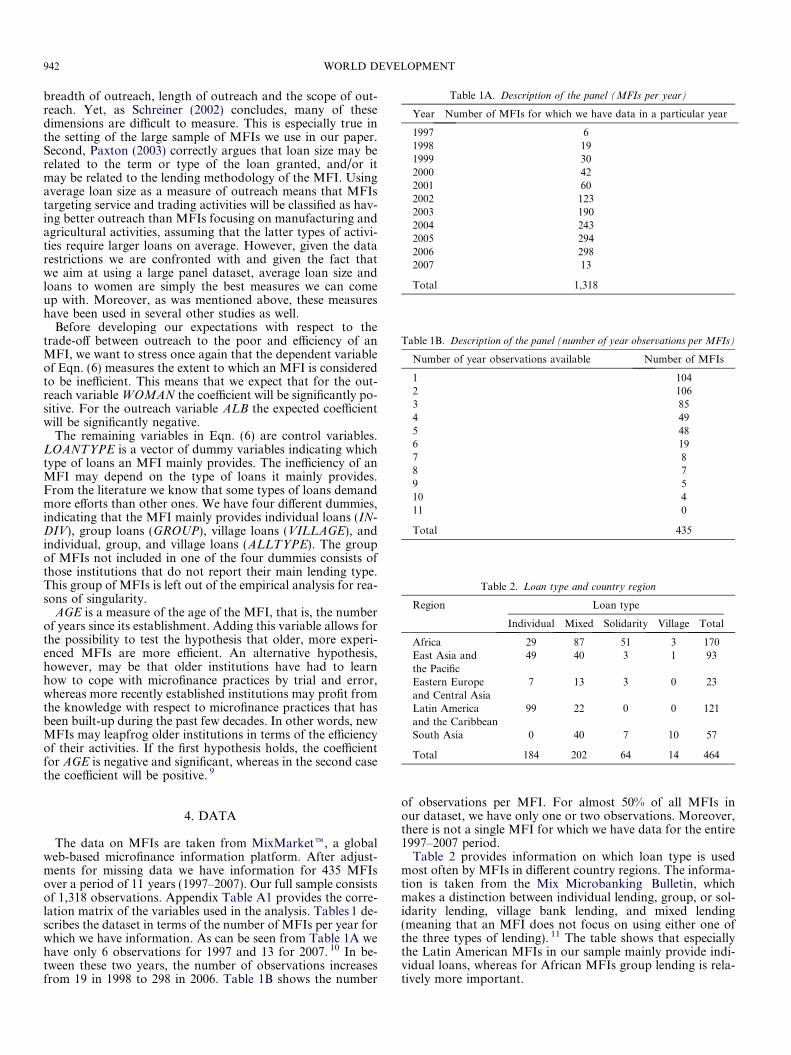
Table 1A. Description of the panel (MFIs per year)
Year Number of MFIs for which we have data in a particular year
1997 61998 191999 302000 422001 602002 1232003 1902004 2432005 2942006 2982007 13
Total 1,318
Table 1B. Description of the panel (number of year observations per MFIs)
Number of year observations available Number of MFIs
1 1042 1063 854 495 486 197 88 79 510 411 0
Total 435
Table 2. Loan type and country region
Region Loan type
Individual Mixed Solidarity Village Total
Africa 29 87 51 3 170East Asia andthe Pacific
49 40 3 1 93
Eastern Europeand Central Asia
7 13 3 0 23
Latin Americaand the Caribbean
99 22 0 0 121
South Asia 0 40 7 10 57
Total 184 202 64 14 464
942 WORLD DEVELOPMENT
breadth of outreach, length of outreach and the scope of out-reach. Yet, as Schreiner (2002) concludes, many of thesedimensions are difficult to measure. This is especially true inthe setting of the large sample of MFIs we use in our paper.Second, Paxton (2003) correctly argues that loan size may berelated to the term or type of the loan granted, and/or itmay be related to the lending methodology of the MFI. Usingaverage loan size as a measure of outreach means that MFIstargeting service and trading activities will be classified as hav-ing better outreach than MFIs focusing on manufacturing andagricultural activities, assuming that the latter types of activi-ties require larger loans on average. However, given the datarestrictions we are confronted with and given the fact thatwe aim at using a large panel dataset, average loan size andloans to women are simply the best measures we can comeup with. Moreover, as was mentioned above, these measureshave been used in several other studies as well.
Before developing our expectations with respect to thetrade-off between outreach to the poor and efficiency of anMFI, we want to stress once again that the dependent variableof Eqn. (6) measures the extent to which an MFI is consideredto be inefficient. This means that we expect that for the out-reach variable WOMAN the coefficient will be significantly po-sitive. For the outreach variable ALB the expected coefficientwill be significantly negative.
The remaining variables in Eqn. (6) are control variables.LOANTYPE is a vector of dummy variables indicating whichtype of loans an MFI mainly provides. The inefficiency of anMFI may depend on the type of loans it mainly provides.From the literature we know that some types of loans demandmore efforts than other ones. We have four different dummies,indicating that the MFI mainly provides individual loans (IN-DIV), group loans (GROUP), village loans (VILLAGE), andindividual, group, and village loans (ALLTYPE). The groupof MFIs not included in one of the four dummies consists ofthose institutions that do not report their main lending type.This group of MFIs is left out of the empirical analysis for rea-sons of singularity.
AGE is a measure of the age of the MFI, that is, the numberof years since its establishment. Adding this variable allows forthe possibility to test the hypothesis that older, more experi-enced MFIs are more efficient. An alternative hypothesis,however, may be that older institutions have had to learnhow to cope with microfinance practices by trial and error,whereas more recently established institutions may profit fromthe knowledge with respect to microfinance practices that hasbeen built-up during the past few decades. In other words, newMFIs may leapfrog older institutions in terms of the efficiencyof their activities. If the first hypothesis holds, the coefficientfor AGE is negative and significant, whereas in the second casethe coefficient will be positive. 9
4. DATA
The data on MFIs are taken from MixMarkete, a globalweb-based microfinance information platform. After adjust-ments for missing data we have information for 435 MFIsover a period of 11 years (1997–2007). Our full sample consistsof 1,318 observations. Appendix Table A1 provides the corre-lation matrix of the variables used in the analysis. Tables 1 de-scribes the dataset in terms of the number of MFIs per year forwhich we have information. As can be seen from Table 1A wehave only 6 observations for 1997 and 13 for 2007. 10 In be-tween these two years, the number of observations increasesfrom 19 in 1998 to 298 in 2006. Table 1B shows the number
of observations per MFI. For almost 50% of all MFIs inour dataset, we have only one or two observations. Moreover,there is not a single MFI for which we have data for the entire1997–2007 period.
Table 2 provides information on which loan type is usedmost often by MFIs in different country regions. The informa-tion is taken from the Mix Microbanking Bulletin, whichmakes a distinction between individual lending, group, or sol-idarity lending, village bank lending, and mixed lending(meaning that an MFI does not focus on using either one ofthe three types of lending). 11 The table shows that especiallythe Latin American MFIs in our sample mainly provide indi-vidual loans, whereas for African MFIs group lending is rela-tively more important.
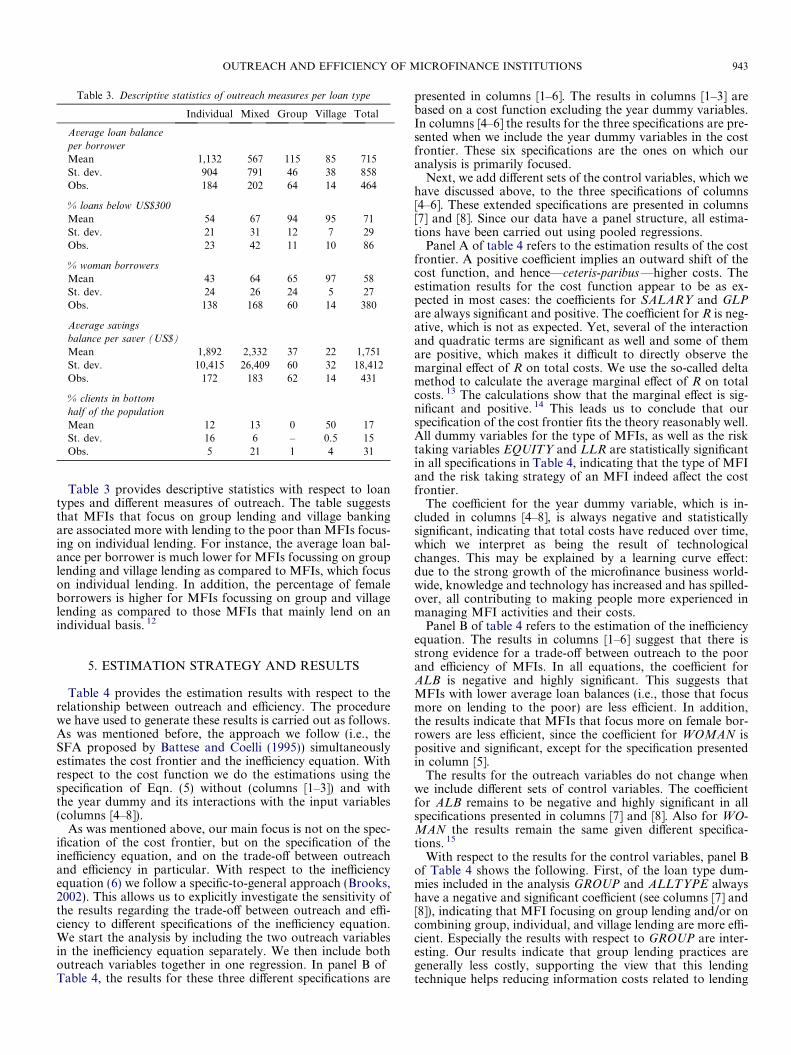
Table 3. Descriptive statistics of outreach measures per loan type
Individual Mixed Group Village Total
Average loan balance
per borrower
Mean 1,132 567 115 85 715St. dev. 904 791 46 38 858Obs. 184 202 64 14 464
% loans below US$300
Mean 54 67 94 95 71St. dev. 21 31 12 7 29Obs. 23 42 11 10 86
% woman borrowers
Mean 43 64 65 97 58St. dev. 24 26 24 5 27Obs. 138 168 60 14 380
Average savings
balance per saver (US$)
Mean 1,892 2,332 37 22 1,751St. dev. 10,415 26,409 60 32 18,412Obs. 172 183 62 14 431
% clients in bottom
half of the population
Mean 12 13 0 50 17St. dev. 16 6 – 0.5 15Obs. 5 21 1 4 31
OUTREACH AND EFFICIENCY OF MICROFINANCE INSTITUTIONS 943
Table 3 provides descriptive statistics with respect to loantypes and different measures of outreach. The table suggeststhat MFIs that focus on group lending and village bankingare associated more with lending to the poor than MFIs focus-ing on individual lending. For instance, the average loan bal-ance per borrower is much lower for MFIs focussing on grouplending and village lending as compared to MFIs, which focuson individual lending. In addition, the percentage of femaleborrowers is higher for MFIs focussing on group and villagelending as compared to those MFIs that mainly lend on anindividual basis. 12
5. ESTIMATION STRATEGY AND RESULTS
Table 4 provides the estimation results with respect to therelationship between outreach and efficiency. The procedurewe have used to generate these results is carried out as follows.As was mentioned before, the approach we follow (i.e., theSFA proposed by Battese and Coelli (1995)) simultaneouslyestimates the cost frontier and the inefficiency equation. Withrespect to the cost function we do the estimations using thespecification of Eqn. (5) without (columns [1–3]) and withthe year dummy and its interactions with the input variables(columns [4–8]).
As was mentioned above, our main focus is not on the spec-ification of the cost frontier, but on the specification of theinefficiency equation, and on the trade-off between outreachand efficiency in particular. With respect to the inefficiencyequation (6) we follow a specific-to-general approach (Brooks,2002). This allows us to explicitly investigate the sensitivity ofthe results regarding the trade-off between outreach and effi-ciency to different specifications of the inefficiency equation.We start the analysis by including the two outreach variablesin the inefficiency equation separately. We then include bothoutreach variables together in one regression. In panel B ofTable 4, the results for these three different specifications are
presented in columns [1–6]. The results in columns [1–3] arebased on a cost function excluding the year dummy variables.In columns [4–6] the results for the three specifications are pre-sented when we include the year dummy variables in the costfrontier. These six specifications are the ones on which ouranalysis is primarily focused.
Next, we add different sets of the control variables, which wehave discussed above, to the three specifications of columns[4–6]. These extended specifications are presented in columns[7] and [8]. Since our data have a panel structure, all estima-tions have been carried out using pooled regressions.
Panel A of table 4 refers to the estimation results of the costfrontier. A positive coefficient implies an outward shift of thecost function, and hence—ceteris-paribus —higher costs. Theestimation results for the cost function appear to be as ex-pected in most cases: the coefficients for SALARY and GLPare always significant and positive. The coefficient for R is neg-ative, which is not as expected. Yet, several of the interactionand quadratic terms are significant as well and some of themare positive, which makes it difficult to directly observe themarginal effect of R on total costs. We use the so-called deltamethod to calculate the average marginal effect of R on totalcosts. 13 The calculations show that the marginal effect is sig-nificant and positive. 14 This leads us to conclude that ourspecification of the cost frontier fits the theory reasonably well.All dummy variables for the type of MFIs, as well as the risktaking variables EQUITY and LLR are statistically significantin all specifications in Table 4, indicating that the type of MFIand the risk taking strategy of an MFI indeed affect the costfrontier.
The coefficient for the year dummy variable, which is in-cluded in columns [4–8], is always negative and statisticallysignificant, indicating that total costs have reduced over time,which we interpret as being the result of technologicalchanges. This may be explained by a learning curve effect:due to the strong growth of the microfinance business world-wide, knowledge and technology has increased and has spilled-over, all contributing to making people more experienced inmanaging MFI activities and their costs.
Panel B of table 4 refers to the estimation of the inefficiencyequation. The results in columns [1–6] suggest that there isstrong evidence for a trade-off between outreach to the poorand efficiency of MFIs. In all equations, the coefficient forALB is negative and highly significant. This suggests thatMFIs with lower average loan balances (i.e., those that focusmore on lending to the poor) are less efficient. In addition,the results indicate that MFIs that focus more on female bor-rowers are less efficient, since the coefficient for WOMAN ispositive and significant, except for the specification presentedin column [5].
The results for the outreach variables do not change whenwe include different sets of control variables. The coefficientfor ALB remains to be negative and highly significant in allspecifications presented in columns [7] and [8]. Also for WO-MAN the results remain the same given different specifica-tions. 15
With respect to the results for the control variables, panel Bof Table 4 shows the following. First, of the loan type dum-mies included in the analysis GROUP and ALLTYPE alwayshave a negative and significant coefficient (see columns [7] and[8]), indicating that MFI focusing on group lending and/or oncombining group, individual, and village lending are more effi-cient. Especially the results with respect to GROUP are inter-esting. Our results indicate that group lending practices aregenerally less costly, supporting the view that this lendingtechnique helps reducing information costs related to lending
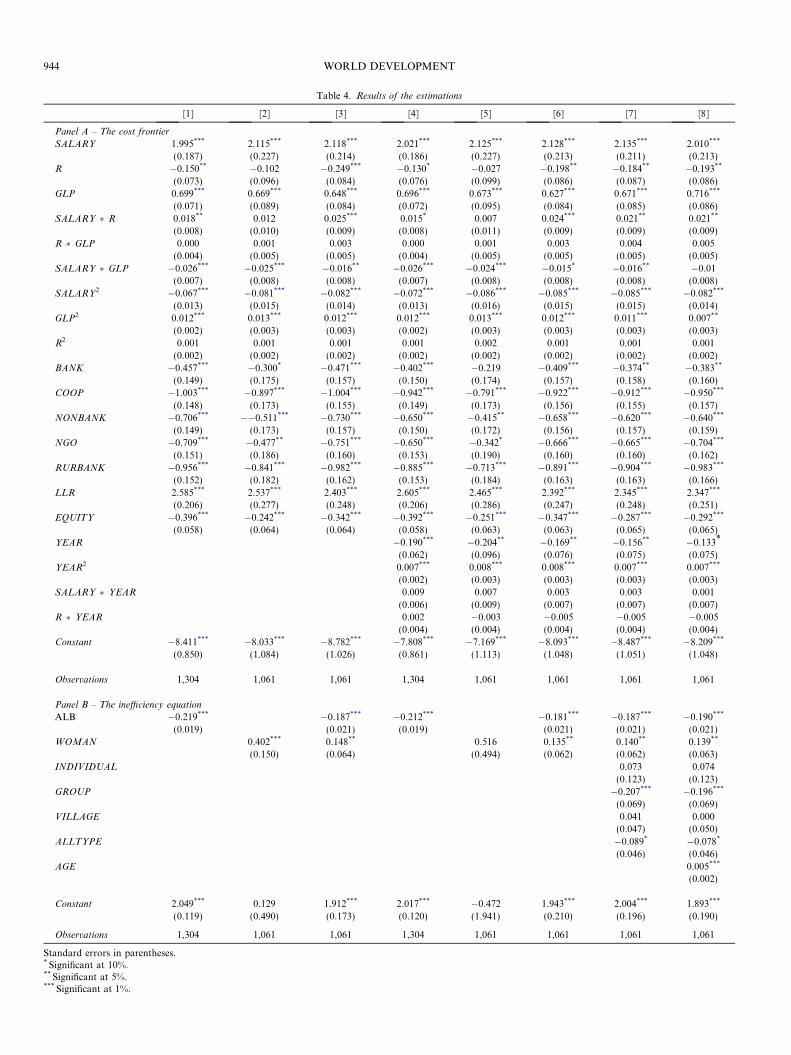
Table 4. Results of the estimations
[1] [2] [3] [4] [5] [6] [7] [8]
Panel A – The cost frontier
SALARY 1.995*** 2.115*** 2.118*** 2.021*** 2.125*** 2.128*** 2.135*** 2.010***
(0.187) (0.227) (0.214) (0.186) (0.227) (0.213) (0.211) (0.213)R �0.150** �0.102 �0.249*** �0.130* �0.027 �0.198** �0.184** �0.193**
(0.073) (0.096) (0.084) (0.076) (0.099) (0.086) (0.087) (0.086)GLP 0.699*** 0.669*** 0.648*** 0.696*** 0.673*** 0.627*** 0.671*** 0.716***
(0.071) (0.089) (0.084) (0.072) (0.095) (0.084) (0.085) (0.086)SALARY � R 0.018** 0.012 0.025*** 0.015* 0.007 0.024*** 0.021** 0.021**
(0.008) (0.010) (0.009) (0.008) (0.011) (0.009) (0.009) (0.009)R � GLP 0.000 0.001 0.003 0.000 0.001 0.003 0.004 0.005
(0.004) (0.005) (0.005) (0.004) (0.005) (0.005) (0.005) (0.005)
SALARY � GLP �0.026*** �0.025*** �0.016** �0.026*** �0.024*** �0.015* �0.016** �0.01(0.007) (0.008) (0.008) (0.007) (0.008) (0.008) (0.008) (0.008)
SALARY2 �0.067*** �0.081*** �0.082*** �0.072*** �0.086*** �0.085*** �0.085*** �0.082***
(0.013) (0.015) (0.014) (0.013) (0.016) (0.015) (0.015) (0.014)GLP2 0.012*** 0.013*** 0.012*** 0.012*** 0.013*** 0.012*** 0.011*** 0.007**
(0.002) (0.003) (0.003) (0.002) (0.003) (0.003) (0.003) (0.003)
R2 0.001 0.001 0.001 0.001 0.002 0.001 0.001 0.001(0.002) (0.002) (0.002) (0.002) (0.002) (0.002) (0.002) (0.002)
BANK �0.457*** �0.300* �0.471*** �0.402*** �0.219 �0.409*** �0.374** �0.383**
(0.149) (0.175) (0.157) (0.150) (0.174) (0.157) (0.158) (0.160)COOP �1.003*** �0.897*** �1.004*** �0.942*** �0.791*** �0.922*** �0.912*** �0.950***
(0.148) (0.173) (0.155) (0.149) (0.173) (0.156) (0.155) (0.157)NONBANK �0.706*** ��0.511*** �0.730*** �0.650*** �0.415** �0.658*** �0.620*** �0.640***
(0.149) (0.173) (0.157) (0.150) (0.172) (0.156) (0.157) (0.159)NGO �0.709*** �0.477** �0.751*** �0.650*** �0.342* �0.666*** �0.665*** �0.704***
(0.151) (0.186) (0.160) (0.153) (0.190) (0.160) (0.160) (0.162)
RURBANK �0.956*** �0.841*** �0.982*** �0.885*** �0.713*** �0.891*** �0.904*** �0.983***
(0.152) (0.182) (0.162) (0.153) (0.184) (0.163) (0.163) (0.166)LLR 2.585*** 2.537*** 2.403*** 2.605*** 2.465*** 2.392*** 2.345*** 2.347***
(0.206) (0.277) (0.248) (0.206) (0.286) (0.247) (0.248) (0.251)EQUITY �0.396*** �0.242*** �0.342*** �0.392*** �0.251*** �0.347*** �0.287*** �0.292***
(0.058) (0.064) (0.064) (0.058) (0.063) (0.063) (0.065) (0.065)
YEAR �0.190*** �0.204** �0.169** �0.156** �0.133*
(0.062) (0.096) (0.076) (0.075) (0.075)YEAR2 0.007*** 0.008*** 0.008*** 0.007*** 0.007***
(0.002) (0.003) (0.003) (0.003) (0.003)SALARY � YEAR 0.009 0.007 0.003 0.003 0.001
(0.006) (0.009) (0.007) (0.007) (0.007)R � YEAR 0.002 �0.003 �0.005 �0.005 �0.005
(0.004) (0.004) (0.004) (0.004) (0.004)Constant �8.411*** �8.033*** �8.782*** �7.808*** �7.169*** �8.093*** �8.487*** �8.209***
(0.850) (1.084) (1.026) (0.861) (1.113) (1.048) (1.051) (1.048)
Observations 1,304 1,061 1,061 1,304 1,061 1,061 1,061 1,061
Panel B – The inefficiency equation
ALB �0.219*** �0.187*** �0.212*** �0.181*** �0.187*** �0.190***
(0.019) (0.021) (0.019) (0.021) (0.021) (0.021)WOMAN 0.402*** 0.148** 0.516 0.135** 0.140** 0.139**
(0.150) (0.064) (0.494) (0.062) (0.062) (0.063)INDIVIDUAL 0.073 0.074
(0.123) (0.123)GROUP �0.207*** �0.196***
(0.069) (0.069)VILLAGE 0.041 0.000
(0.047) (0.050)
ALLTYPE �0.089* �0.078*
(0.046) (0.046)AGE 0.005***
(0.002)
Constant 2.049*** 0.129 1.912*** 2.017*** �0.472 1.943*** 2.004*** 1.893***
(0.119) (0.490) (0.173) (0.120) (1.941) (0.210) (0.196) (0.190)
Observations 1,304 1,061 1,061 1,304 1,061 1,061 1,061 1,061
Standard errors in parentheses.* Significant at 10%.** Significant at 5%.*** Significant at 1%.
944 WORLD DEVELOPMENT
OUTREACH AND EFFICIENCY OF MICROFINANCE INSTITUTIONS 945
to the poor more than other lending techniques do. This resulthas also been reported in a recent paper on the determinants ofcost efficiency of MFIs (Caudill et al., 2009).
Third, the coefficient for the variable AGE is positive andsignificant, indicating that older MFIs are less efficient (seecolumn [8]). This supports the view that more recently estab-lished institutions profit from the knowledge with respect tomicrofinance practices that has been built-up during the pastfew decades. Based on the existing knowledge base new MFIsmay leapfrog older institutions in terms of the efficiency oftheir activities. 16
In order to investigate whether our results are influenced bythe fact that for several MFIs we only have a few observations,we also estimate the models using data of MFIs for which wehave at least four, respectively, at least five year observations.The results are robust for these subsamples of our total data-set. The coefficients for ALB and WOMAN remain to behighly significant and negative and positive, respectively. 17
Summarizing the results in Table 4, we find support forthe fact that there is a trade-off between outreach and effi-ciency of MFIs in our sample. These findings remain to besignificant even after controlling for a number of controlvariables. Our results do seem to support findings of Cullet al. (2007), the only other serious empirical analysis ofthe relationship between sustainability/efficiency and out-reach, even though they look at profitability rather than effi-ciency. Cull et al. (2007) suggest that more profitable MFIsfocusing on extending individual loans have less poor andfemale borrowers. Moreover, they show that as these MFIsgrow larger they increasingly turn to wealthier clients, whichindicates “mission drift.”
We believe we have made an important contribution to thescarce academic work on the trade-off discussion. First of all,we use a substantially larger dataset than Cull et al. (2007)have in their analysis. Moreover, we use information of MFIsover a longer period of time than any of the previous studies inthis field. Secondly, we use measures of sustainability that aredifferent from these other studies. In particular, we look at thecost efficiency of microfinance institutions, applying SFA, a
method that has been used only very recently in the literatureon microfinance.
6. CONCLUSIONS
This paper has used SFA to examine whether there is atrade-off between outreach to the poor and efficiency of MFIs.Using a sample of more than 1,300 observations, we find con-vincing evidence that outreach is negatively related to effi-ciency of MFIs. More specifically, we find that MFIs thathave a lower average loan balance, which is a generally ac-cepted measure of the depth of outreach, are also less efficient.Moreover, we find evidence showing that MFIs that havemore women borrowers as clients—again a measure of thedepth of outreach—are less efficient. These results remain ro-bustly significant after having added a number of control vari-ables.
In view of the current move to commercialization of themicrofinance industry this appears to be bad news. Commer-cialization may induce a stronger emphasis on efficiency.Our study suggests that improving efficiency may only beachieved if MFIs focus less on the poor. It should be noted,however, that our results do not necessarily imply that a stron-ger focus on efficiency is bad for poverty reduction. As Zellerand Johannsen (2006) have pointed out, due to spill-over ef-fects, MFIs that strive for efficiency, and score low on out-reach to the poor, may ultimately cause a higher povertyreduction at the macro level than MFIs that score high on out-reach indicators. This assumes that these efficient MFIs areable to contribute to improving economic conditions at the lo-cal, regional, and country levels, and that these contributionsultimately are higher than the contributions to poverty allevi-ation made by MFI concentrating on outreach rather thanefficiency. To the best of our knowledge, until now no studyhas empirically investigated the existence (let alone the size)of the effects of increased efficiency of MFIs at the regionalor macro (country) level. Further research is needed to lookinto this issue more carefully.
NOTES
1. This section is partly based on Rhyne and Otero (2006).
2. Bell, Harper, and Mandivenga (2002) describe the process of down-scaling of these two banks. Isern, Ritchie, Crenn, Cook, and Brown (2003)list 227 local commercial banks that are active in the market formicrofinance. Segrado (2005) describes the involvement of commercialbanks in microfinance in Egypt.
3. In Malaysia, Nepal and Thailand, for instance, the government hasinitiated programs stimulating commercial banks to develop microfinanceactivities. In India the National Bank of Agriculture and Rural Devel-opment (NABARD) recently initiated a program to involve private banksin microfinance. Seibel and Dave (2002) provide a discussion of thecommercial aspects of the NABARD program.
4. Non-parametric techniques do not allow for measurement error andluck factors. These techniques attribute any deviation from the best-practice MFI to technical inefficiency. For a more extensive review of thenon-parametric and the parametric approach, see Matousek and Taci(2004).
5. Thus, the total costs a MFI faces are never lower than the costs of thefrontier. For a graphical representation of the frontier and its dynamics,see Berger, Hancock, and Humphrey (1993). The authors show howinefficiency is determined by both technical and allocative inefficiency.
6. Data for TC, SALARY, R and GLP are not directly available from thedataset we have used for this study (MixMarkete; see Section 4 for adescription of this source). Instead, information in terms of ratios, such astotal costs to total assets are given only. This is why we have multipliedthese ratios with total assets to obtain data for TC, SALARY, R, andGLP. Thus, TC is measured as the total expenses to total assets ratio timestotal assets in US dollars. SALARY is the operating expenses to totalassets ratio times total assets in US dollars, divided by the total number ofemployees. R is the financial expenses to total assets ratio divided by thetotal deposits to total assets. GLP is the gross loan portfolio to total assetsratio times total assets in US dollars.
7. Including an interaction term of the year dummy with the outputvariable GLP appeared to be problematic for some of the models weestimated, possibly due to problems of multicollinearity between this
946 WORLD DEVELOPMENT
interaction term and the other interaction terms that include the yeardummy.
8. By adding dummies for different types of MFIs we assume thatsubsidy levels are similar for the same type of MFIs. We admit this is onlyan approximation of the differences of levels of subsidies.
9. We also included size effects (measured as the number of activeborrowers to which the MFI provides loans) and regional effects (byincluding regional dummies for African, and East Asian and Pacificcountries) in the original empirical specification of the inefficiencyequation. Yet, in the empirical analysis these variables turned out not tobe statistically significant, which is why we have excluded them from thediscussion in the main text of the paper. The results of these regressionsare available on request from the authors.
10. We retrieved the data from the MixMarket website in early 2008. Bythat time, only few MFIs had finished their annual report, which explainswhy we have a low number of observations for the year 2007. Informationon MFIs for the 1990s and early 2000s is available only on a limited scalethrough the MixMarket website.
11. Note that for several MFIs in our dataset information on the loantype is not available, which also why the sum of the rows do not add up tothe total amount reported in the last column of Table 2.
12. Unfortunately, for two of the five measures of outreach presented inthe table, we have insufficient information in our dataset, which is why weonly carry out the analysis with the outreach variables ALB and
WOMAN. The average savings balance per saver is sometimes used as ameasure of outreach. Yet, we have not used this measure in our analysis,since not all MFIs are allowed to offer savings accounts due to legalrestrictions. Using this measure would therefore, at least potentially, resultin biased outcomes.
13. See Oehlert (1992) for a specification of this method.
14. For completeness, we also calculated the marginal effects of SAL-
ARY and GLP on total costs with the help of the delta method. The resultsshow also for these two variables the marginal effect is significant andpositive.
15. These results also hold for specifications of the model including sizeand region effects (i.e., control variables that were not significant; seeprevious Footnote 9).
16. We also included the dummies for the type of MFI in the inefficiencyequation (the estimation results are available from the authors on request).The results show that if we do this, these dummy variables are allinsignificant. We also find this result if we include the dummies in theinefficiency equation, but leave them out of the cost frontier estimations.These results clearly indicate that the type of MFI is primarily relevant forthe cost frontier, while there is no indication that it is a relevant issue forexplaining differences in inefficiency between different MFIs.
17. The estimation results of these robustness checks are available fromthe authors on request.
REFERENCES
Aigner, D., Lovell, C. A. K., & Schmidt, P. (1977). Formulation andestimation of stochastic frontier production function models. Journalof Econometrics, 6(1), 21–37.
Battese, G. E., & Coelli, T. J. (1995). A model for technical inefficiencyeffects in a stochastic frontier production function for panel data.Empirical Economics, 20(2), 325–332.
Bell, R., Harper, A., & Mandivenga, D. (2002). Can commercial banks domicrofinance: Lessons from the commercial bank of Zimbabwe and theco-operative of Kenya. Small Enterprise Development Journal, 13(4).
Berger, A. N., Hancock, D., & Humphrey, D. B. (1993). Bank efficiencyderived from the profit function. Journal of Banking and Finance, 17(2–3), 317–347.
Berger, A. N., & De Young, R. (1997). Problem loans and cost efficiencyin commercial banks. Journal of Banking and Finance, 21(6), 849–870.
Brooks, C. (2002). Introductory econometrics for finance. Cambridge:Cambridge University Press.
Caudill, S. B., Gropper, D. M., & Hartarska, V. (2009). Whichmicrofinance institutions are becoming more cost-effective with time:Evidence from a mixture model. Journal of Money, Credit and Banking,41(4), 651–672.
AP, C. G. (2007). CGAP Brief. Washington, DC: CGAP (April).Christen, R. P. (2001). Commercialization and mission drift: The
transformation of microfinance in Latin America. Occasional paperNo. 5, Washington DC: CGAP.
Conning, J. (1999). Outreach, sustainability and leverage in monitoredand peer-monitored lending. Journal of Development Economics, 60(1),51–77.
Cull, R., Demirguc�-Kunt, A., & Morduch, J. (2007). Financial perfor-mance and outreach: A global analysis of lending microbanks. TheEconomic Journal, 117(1), F107–F133.
Cull, R., Demirguc�-Kunt, A., & Morduch, J. (2009). Microfinance meetsthe market. Journal of Economic Perspectives, 23(1), 167–192.
Desrochers, M., & Lamberte, M. (2003). Efficiency and expense preferencein Philippines’ cooperative rural banks. CIRPEE working paper 03-21,Quebec: Universite Laval.
Research, Deutsche. Bank. (2007). Microfinance. An emerging investmentopportunity. Frankfurt am Main: Deutsche Bank.
Dietsch, M., & Lozano-Vivas, A. (2000). How the environment determinesbanking efficiency: A comparison between French and Spanish banks.Journal of Banking and Finance, 24(6), 985–1004.
Ferro Luzzi, G., & Weber, S. (2006). Measuring the performance ofmicrofinance institutions. Unpublished working paper, Geneva: Uni-versity of Geneva.
Fries, S., & Taci, A. (2005). Cost efficiency of banks in transition:Evidence from 289 banks in 15 post-communist countries. Journal ofBanking and Finance, 29(1), 55–81.
Grigorian, D. A., & Manole, V. (2006). Determinants of commercial bankperformance in transition: An application of Data EnvelopmentAnalysis. Comparative Economic Studies, 48(3), 497–522.
Gonzalez, A., & Rosenberg, R. (2006). The state of microfinance:Outreach, profitability and poverty. Presentation at the World Bankconference on access to finance.
Gutierrez-Nieto, B., Serrano-Cinca, C., & Mar Molinero, C. (2007).Microfinance institutions and efficiency. Omega, 35(2), 131–142.
Hartarska, V., & Nadolnyak, D. (2007). Do regulated microfinanceinstitutions achieve better sustainability and outreach: Cross-countryevidence. Applied Economics, 39(10), 1207–1222.
Hashemi, S., & Rosenberg, R. (2006). Graduating the poor into mircofi-nance: Linking safety nets and financial services. Focus note No. 34,Washington, DC: CGAP.
Hulme, D., & Mosley, P. (1006). Finance against poverty. Volumes 1 and 2.London: Routledge.
Isern, J., Ritchie, A., Crenn, T., Cook, T., & Brown, M. (2003). Review ofcommercial bank and other formal financial institution participation inmicrofinance. Washington DC: CGAP.
Isern, J., & Porteous, D. (2005). Commercial banks and microfinance:Evolving models of success. Focus Note No. 28, Washington, DC:CGAP.
Kapoor, M., Ravi, S., & Morduch, J. (2007). From microfinance to m-finance. Innovations: Technology, Governance. Globalization, 2(1–2),82–90.
Lapenu, C., & Zeller, M. (2002). Distribution, growth, and performance ofthe microfinance institutions in Africa, Asia and Latin America: Arecent inventory. Savings and Development, 26(1), 87–111.
OUTREACH AND EFFICIENCY OF MICROFINANCE INSTITUTIONS 947
Lensink, R., Meesters, A., & Naaborg, I. (2008). Bank efficiency andforeign ownership: Do good institutions matter?. Journal of Bankingand Finance, 32(5), 834–844.
Lozano-Vivas, A., Pastor, J. T., & Hasan, I. (2001). European bankperformance beyond country borders: What really matters?. EuropeanFinance Review, 5(1–2), 141–165.
Makame, A. H., & Murinde, V. (2006). Empirical findings on cognitivedissonance around microfinance outreach and sustainability. Unpub-lished paper. University of Birmingham, Birmingham.
Matousek, R., & Taci, A. (2004). Banking efficiency in transitioneconomies: Empirical evidence from the Czech Republic. Economicsof Planning, 37(3–4), 225–244.
McIntosh, C., De Janvry, A., & Sadoulet, E. (2005). How competitionamong microfinance institutions affects incumbent lenders. The Eco-nomic Journal, 115(506), 987–1004.
Meeusen, W., & van den Broeck, J. (1977). Efficiency estimation fromCobb–Douglas production functions with composed error. Interna-tional Economic Review, 18(2), 435–444.
MixMarkete. (2007). <www.mixmarket.org>. visited October.MIX Microbanking Bulletin, Trend Lines 2003–2005 MFI Benchmarks.Montgomery, H., & Weiss, J. (2005). Great expectations: Microfinance and
poverty reduction in Asia and Latin America. ADB Research Institutepaper series No. 63, Manila: ADB.
Morduch, J. (2005). Smart subsidies for sustainable microfinance. Financefor the Poor: ADB Quarterly Newsletter of the Focal Point forMicrofinance, 6, 1–7.
Navajas, S., Conning, J., & Gonzalez-Vega, C. (2003). Lending technol-ogies, competition and consolidation in the market for microfinance inBolivia. Journal of International Development, 15(6), 747–770.
Oehlert, G. W. (1992). A note on the delta method. The AmericanStatistician, 46(1), 27–29.
Olivares-Polanco, F. (2005). Commercializing microfinance and deepeningoutreach: Empirical evidence from Latin America. Journal of Micro-finance, 7(1), 47–69.
Paxton, J. (2003). A poverty outreach index and its application tomicrofinance. Economics Bulletin, 9(2), 1–10.
Paxton, J. (2007). Technical efficiency in a semi-formal financial sector:The case of Mexico. Oxford Bulletin of Economics and Statistics, 69(1),57–74.
Paxton, J., & Cuevas, C. (2002). Outreach and sustainability of member-based rural financial intermediaries. In M. Zeller, & R. L. Meyer(Eds.), The triangle of microfinance. Financial sustainability, outreach,and impact. Baltimore and London: Johns Hopkins University Press.
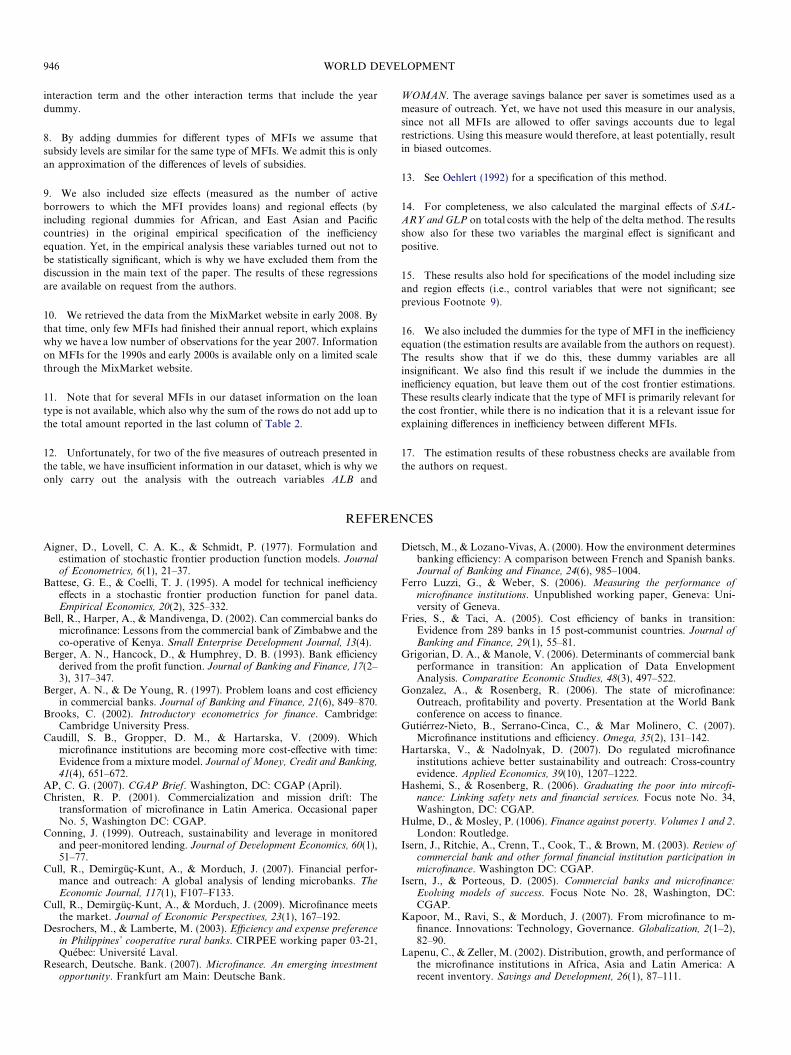
Table A1. Corre
TC SALARY R GLP BANK CO
Panel A
TC 1.000SALARY 0.610 1.000R 0.084 �0.113 1.000GLP 0.964 0.548 0.082 1.000BANK 0.530 0.351 0.013 0.500 1.000COOP �0.329 0.005 �0.310 �0.282 �0.309 1.0NONBANK 0.082 0.004 0.125 0.063 �0.268 �0NGO �0.140 �0.279 0.222 �0.172 �0.198 �0RURBANK �0.127 �0.115 0.013 �0.094 �0.158 �0LLR 0.098 0.029 �0.048 0.019 0.014 �0EQ/TA �0.191 �0.165 0.064 �0.183 �0.135 �0YEAR 0.060 0.085 0.041 0.099 �0.049 0.0INDIVIDUAL 0.204 0.192 �0.033 0.204 0.096 �0GROUP 0.177 �0.063 0.144 0.190 0.131 �0VILLAGE �0.138 �0.222 0.098 �0.117 �0.105 �0ALLTYPE �0.045 �0.089 0.132 �0.059 �0.048 �0AGE 0.314 0.067 �0.002 0.321 0.009 �0ALB 0.418 0.651 �0.154 0.459 0.373 0.1WOMAN �0.134 �0.265 0.235 �0.174 �0.114 �0
Qayyum, A., & Ahmad, M. (2006). Efficiency and sustainability ofmicrofinance institutions in South Asia. Islamabad: Pakistan Institute ofDevelopment Economics (PIDE).
Rhyne, E. (1998). The yin and yang of microfinance: Reaching the poorand financial sustainability. Microfinance Bulletin, 6–8.
Rhyne, E., & Otero, E. (2006). Microfinance through the next decade:Visioning the who, what where, when and how. Paper commissioned bythe Global Microcredit Summit 2006. Boston, MA: ACCION Interna-tional.
Schreiner, M. (2002). Aspects of outreach: A framework for discussion ofthe social benefits of microfinance. Journal of International Develop-ment, 14(5), 591–603.
Sealey, C. W., Jr., & Lindley, J. T. (1977). Inputs, outputs, and a theory ofproduction and cost at depository financial institutions. Journal ofFinance, 32(4), 1251–1266.
Segrado, C. (2005). The involvement of commercial banks in microfinance:The Egyptian experience. Unpublished paper. University of Toronto,Toronto.
Seibel, H. D., & Dave, H. R. (2002). Commercial aspects of SHG bankingin India. Paper presented at the seminar on SHG-bank lendingprogramme, New Delhi.
Wang, H. J., & Schmidt, P. (2002). One-step and two-step estimation ofthe effects of exogenous variables on technical efficiency. Journal ofProductivity Analysis, 18(2), 129–144.
Woller, G. (2002). The promise and peril of microfinance commerciali-zation. Small Enterprise Journal, 13(4), 12–21.
Zeller, M., & Johannsen, J. (2006). Is there a difference in povertyoutreach by type of microfinance institution? The case of Peru andBangladesh. Paper presented at the global conference on Access toFinance: Building Inclusive Financial Systems, organized as part of theannual conference series of The World Bank and the BrookingsInstitution in Washington, DC, May 30 and 31.
APPENDIX A
See Table A1.
lation table
OP NON�BANK NGO RUR�BANK LLR EQUITY
00.386 1.000.286 �0.248 1.000.228 �0.197 �0.146 1.000.066 0.067 �0.008 0.001 1.000.079 0.236 0.068 �0.131 �0.079 1.00051 �0.082 0.002 0.122 �0.066 �0.096
.080 0.004 �0.107 0.128 0.021 �0.139
.165 0.067 0.099 �0.118 �0.050 0.201
.152 0.344 �0.038 �0.078 �0.009 0.259
.070 0.094 0.058 �0.036 �0.055 �0.051
.074 �0.113 �0.013 0.274 0.035 �0.15849 �0.164 �0.402 0.005 �0.030 �0.299
.206 �0.059 0.465 �0.021 �0.023 0.076
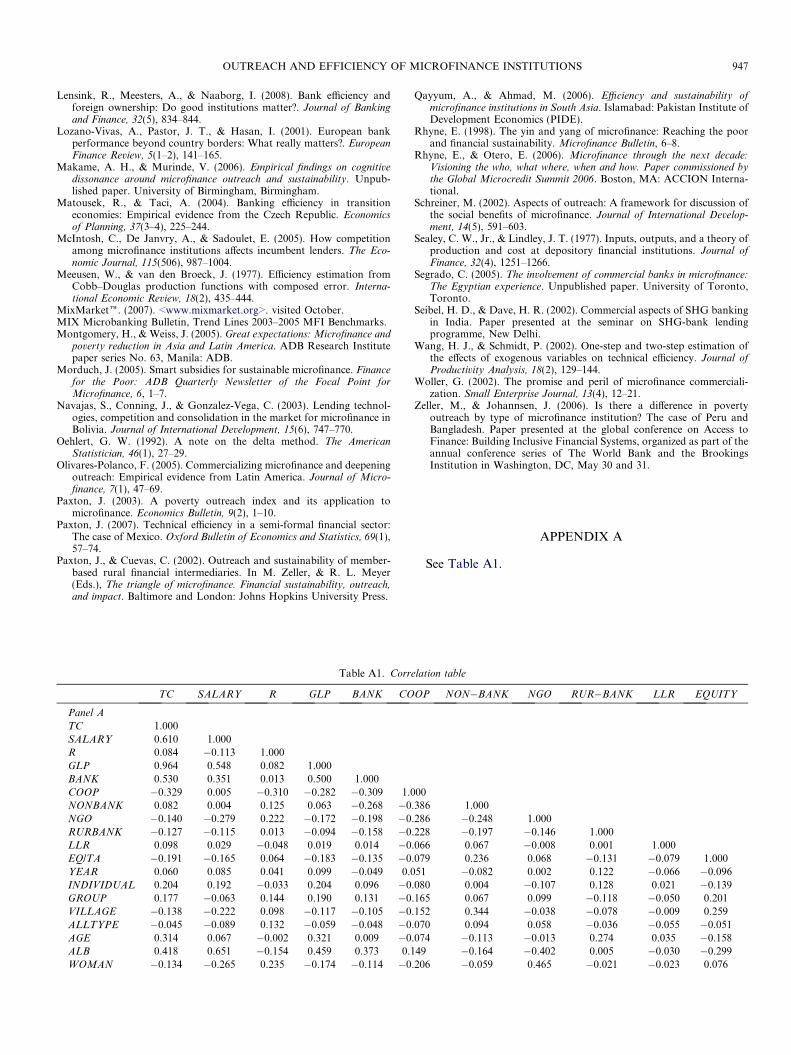
Table A1—continued
YEAR INDIVI�DUAL GROUP VILLAGE ALL-TYPE AGE ALB WOMAN
Panel B
TC
SALARY
R
GLP
BANK
COOP
NONBANK
NGO
RURBANK
LLR
EQ/TA
YEAR 1.000INDIVIDUAL �0.133 1.000GROUP �0.133 �0.173 1.000VILLAGE �0.006 �0.092 �0.097 1.000ALLTYPE �0.041 �0.042 �0.045 �0.024 1.000AGE 0.085 0.304 �0.054 �0.126 �0.043 1.000ALB 0.133 0.193 �0.150 �0.248 �0.138 0.076 1.000WOMAN �0.001 �0.205 0.091 0.059 0.166 �0.075 �0.462 1.000
948 WORLD DEVELOPMENT
Available online at www.sciencedirect.com