outbound canada · 2017-10-06 · conferenceboard.ca outbound canada travel trends & trip...
TRANSCRIPT

conferenceboard.ca
Outbound Canada Travel Trends & Trip Intentions
Jennifer Hendry Senior Research Associate
Canadian Tourism Research Institute
conferenceboard.ca
Topics
• Economic trends and the exchange rate
• Canada’s aging population
• Outbound travel performance – Historical and YTD
• Winter travel intentions
• Short-term outlook for sun destinations – Caribbean, Mexico, USA
conferenceboard.ca
Economic Outlook and the Outbound
Travel Market

conferenceboard.ca
2.6%
2.0%
1.2%
-2.7%
3.4%
3.0%
1.9% 2.0%
2.4%
1.3%
2.3% 2.2%
2006 2007 2008 2009 2010 2011 2012 2013 2014 2015f 2016f 2017f
Canada’s Real GDP Growth
Source: The Conference Board of Canada
conferenceboard.ca
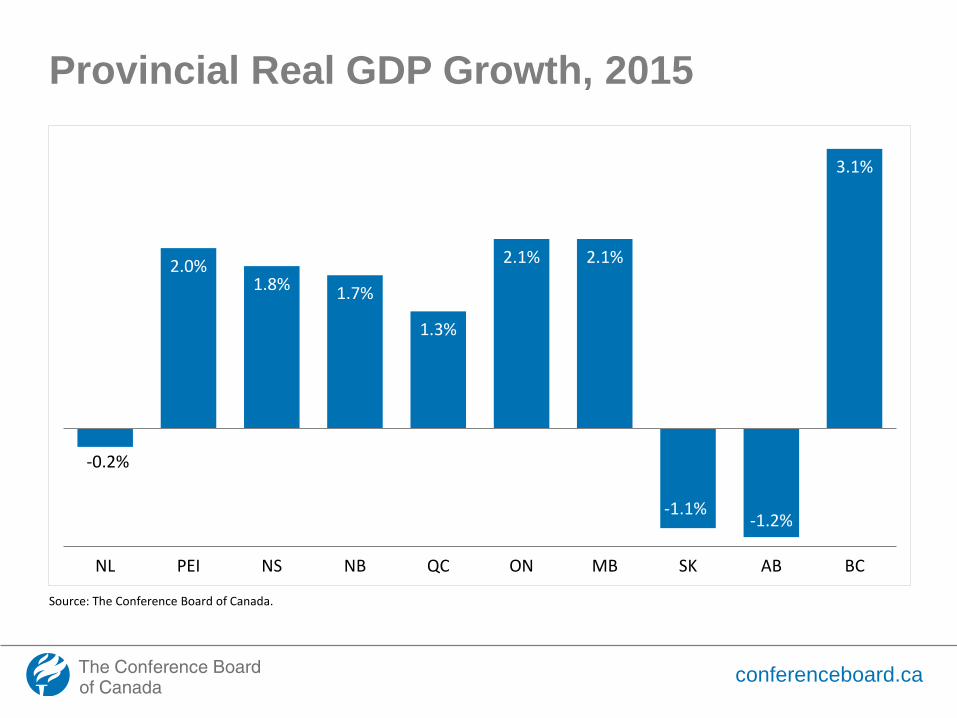
Provincial Real GDP Growth, 2015
Source: The Conference Board of Canada.
-0.2%
2.0% 1.8% 1.7%
1.3%
2.1% 2.1%
-1.1% -1.2%
3.1%
NL PEI NS NB QC ON MB SK AB BC
conferenceboard.ca
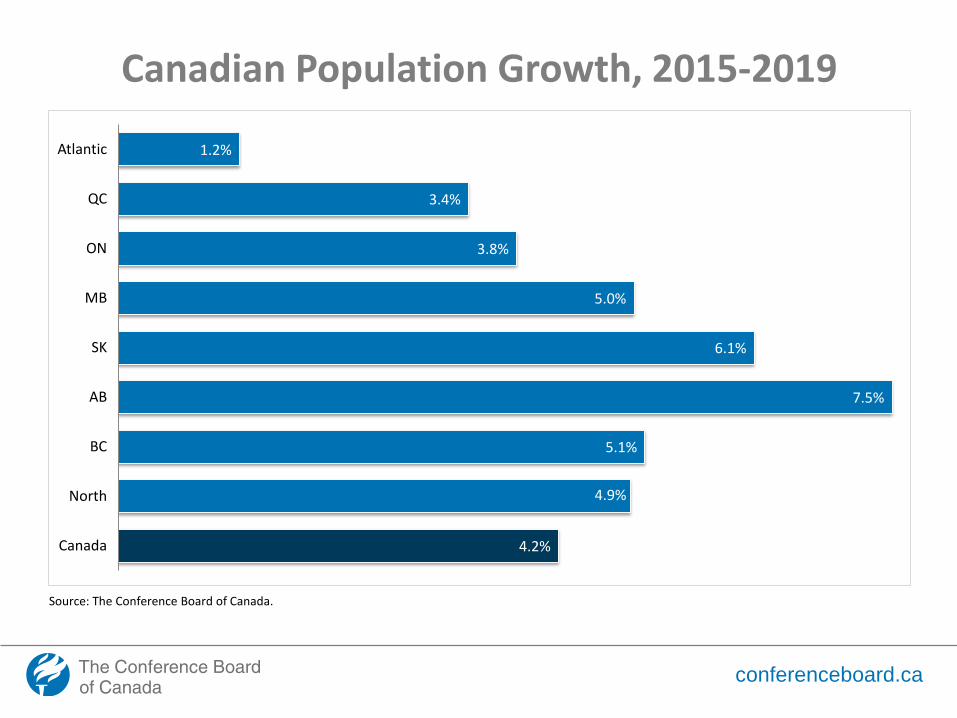
Canadian Population Growth, 2015-2019
Source: The Conference Board of Canada.
1.2%
3.4%
3.8%
5.0%
6.1%
7.5%
5.1%
4.9%
4.2%
Atlantic
QC
ON
MB
SK
AB
BC
North
Canada
conferenceboard.ca
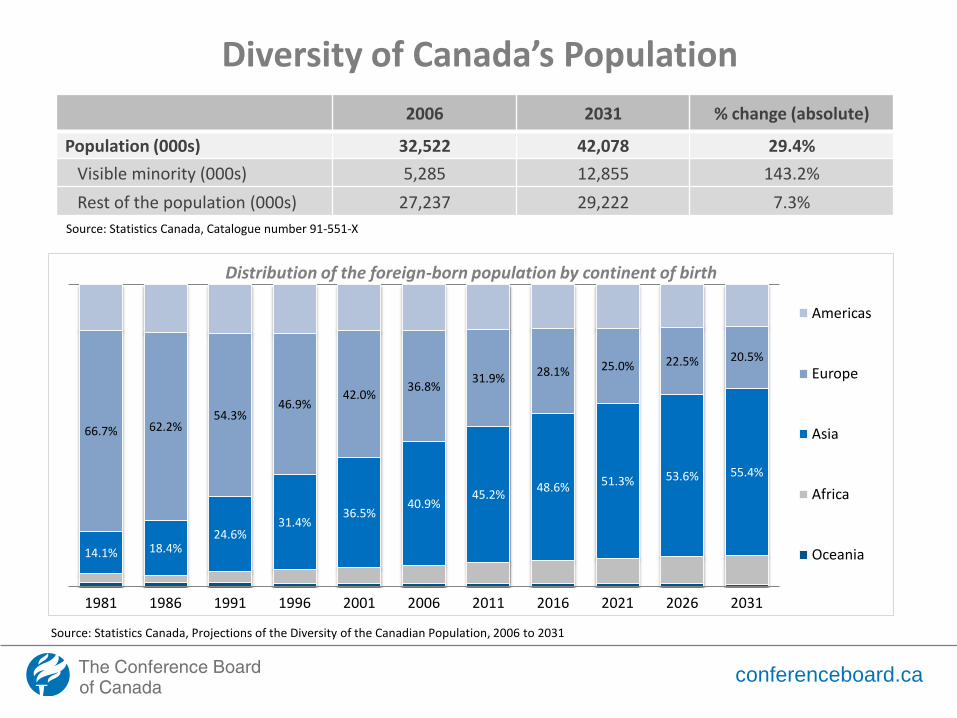
Diversity of Canada’s Population
Source: Statistics Canada, Projections of the Diversity of the Canadian Population, 2006 to 2031
14.1% 18.4% 24.6%
31.4% 36.5%
40.9% 45.2%
48.6% 51.3% 53.6% 55.4%
66.7% 62.2% 54.3%
46.9% 42.0%
36.8% 31.9%
28.1% 25.0% 22.5% 20.5%
1981 1986 1991 1996 2001 2006 2011 2016 2021 2026 2031
Americas
Europe
Asia
Africa
Oceania
Distribution of the foreign-born population by continent of birth
2006 2031 % change (absolute)
Population (000s) 32,522 42,078 29.4%
Visible minority (000s) 5,285 12,855 143.2%
Rest of the population (000s) 27,237 29,222 7.3%
Source: Statistics Canada, Catalogue number 91-551-X
conferenceboard.ca
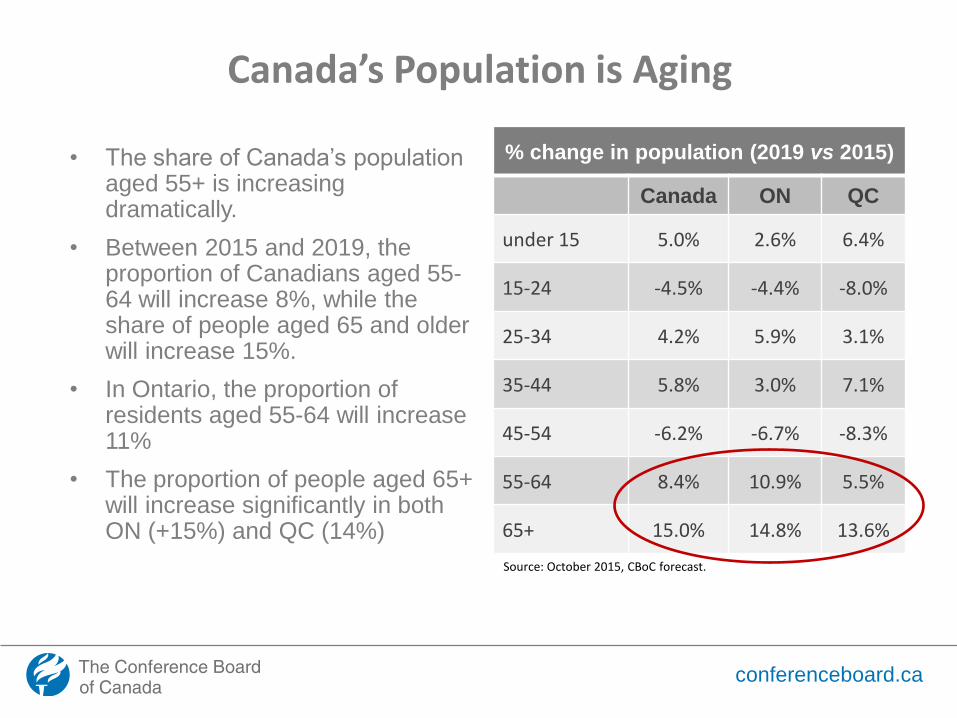
Canada’s Population is Aging
• The share of Canada’s population aged 55+ is increasing dramatically.
• Between 2015 and 2019, the proportion of Canadians aged 55-64 will increase 8%, while the share of people aged 65 and older will increase 15%.
• In Ontario, the proportion of residents aged 55-64 will increase 11%
• The proportion of people aged 65+ will increase significantly in both ON (+15%) and QC (14%)
Source: October 2015, CBoC forecast.
% change in population (2019 vs 2015)
Canada ON QC
under 15 5.0% 2.6% 6.4%
15-24 -4.5% -4.4% -8.0%
25-34 4.2% 5.9% 3.1%
35-44 5.8% 3.0% 7.1%
45-54 -6.2% -6.7% -8.3%
55-64 8.4% 10.9% 5.5%
65+ 15.0% 14.8% 13.6%
conferenceboard.ca
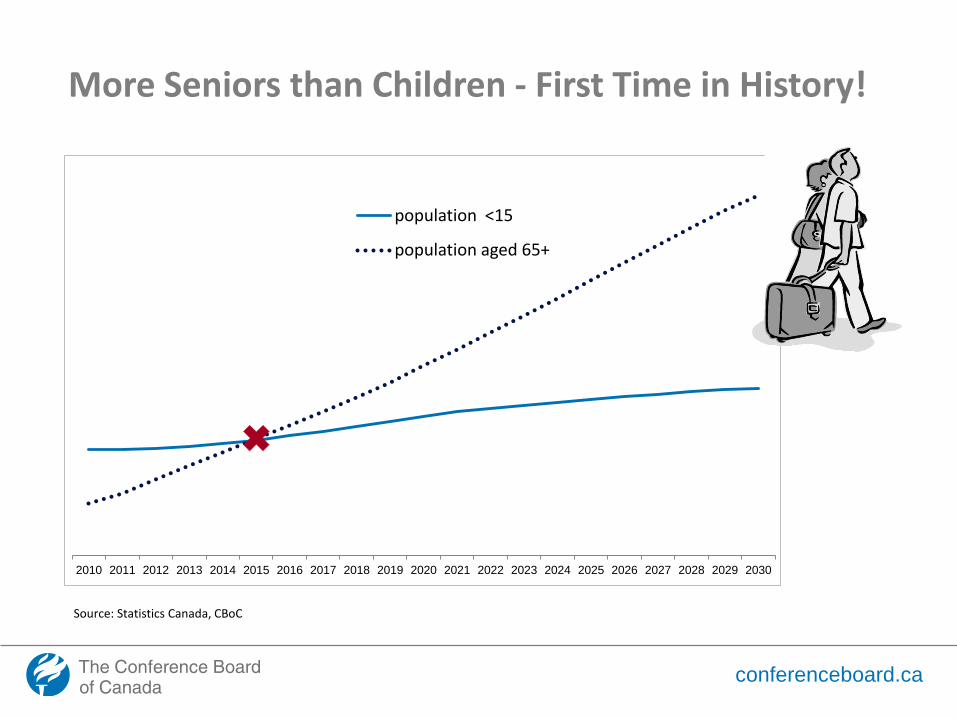
More Seniors than Children - First Time in History!
2010 2011 2012 2013 2014 2015 2016 2017 2018 2019 2020 2021 2022 2023 2024 2025 2026 2027 2028 2029 2030
population <15
population aged 65+
Source: Statistics Canada, CBoC
conferenceboard.ca
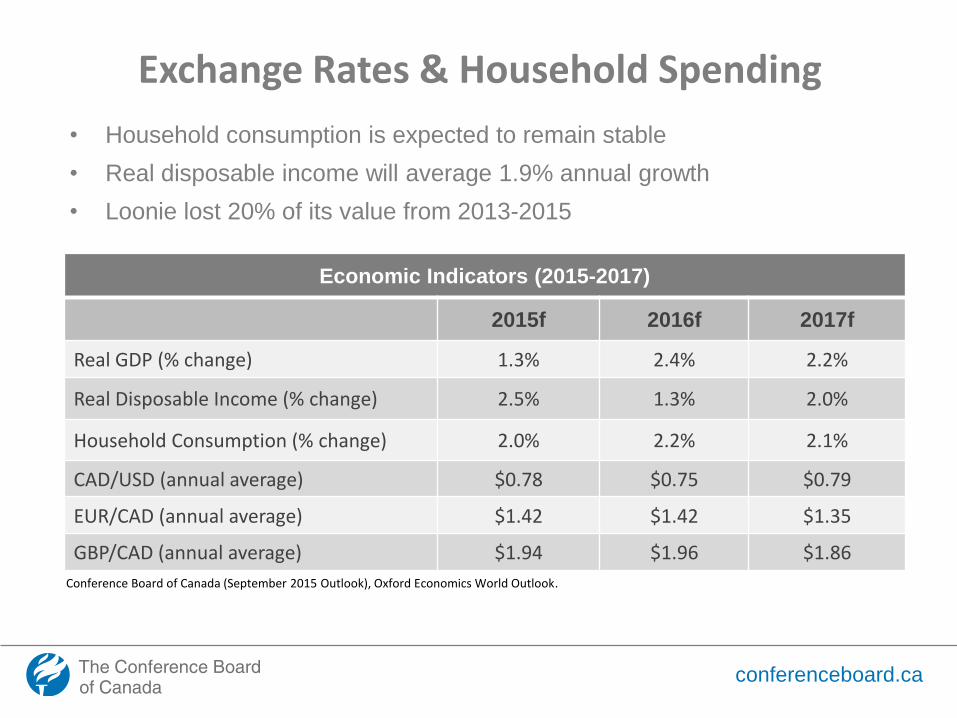
Exchange Rates & Household Spending
• Household consumption is expected to remain stable
• Real disposable income will average 1.9% annual growth
• Loonie lost 20% of its value from 2013-2015
Conference Board of Canada (September 2015 Outlook), Oxford Economics World Outlook.
Economic Indicators (2015-2017)
2015f 2016f 2017f
Real GDP (% change) 1.3% 2.4% 2.2%
Real Disposable Income (% change) 2.5% 1.3% 2.0%
Household Consumption (% change) 2.0% 2.2% 2.1%
CAD/USD (annual average) $0.78 $0.75 $0.79
EUR/CAD (annual average) $1.42 $1.42 $1.35
GBP/CAD (annual average) $1.94 $1.96 $1.86
conferenceboard.ca
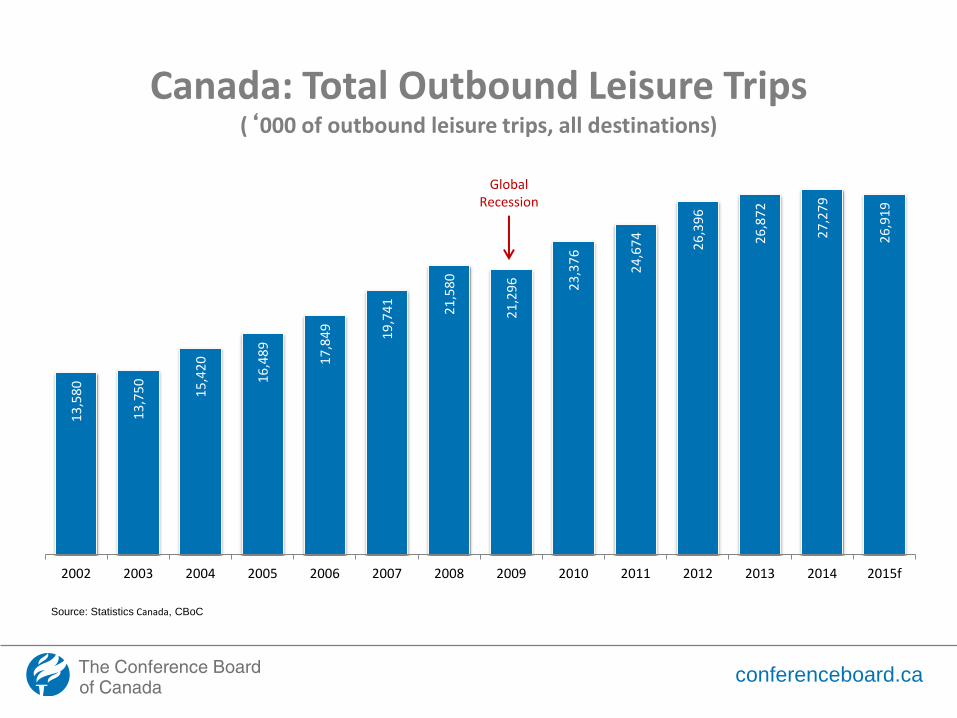
Canada: Total Outbound Leisure Trips (‘000 of outbound leisure trips, all destinations)
13
,58
0
13
,75
0
15
,42
0
16
,48
9
17
,84
9
19
,74
1
21
,58
0
21
,29
6
23
,37
6
24
,67
4
26
,39
6
26
,87
2
27
,27
9
26
,91
9
2002 2003 2004 2005 2006 2007 2008 2009 2010 2011 2012 2013 2014 2015f
Global Recession
Source: Statistics Canada, CBoC
conferenceboard.ca
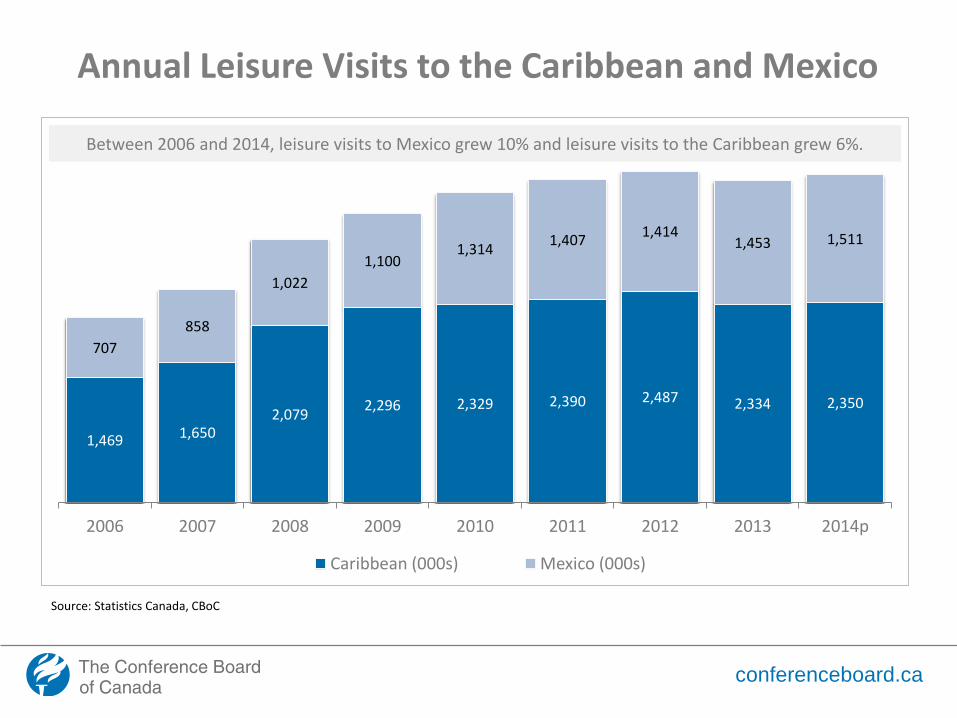
Annual Leisure Visits to the Caribbean and Mexico
Source: Statistics Canada, CBoC
1,469 1,650 2,079
2,296 2,329 2,390 2,487 2,334 2,350
707
858
1,022
1,100 1,314
1,407 1,414
1,453 1,511
2006 2007 2008 2009 2010 2011 2012 2013 2014p
Caribbean (000s) Mexico (000s)
Between 2006 and 2014, leisure visits to Mexico grew 10% and leisure visits to the Caribbean grew 6%.
conferenceboard.ca
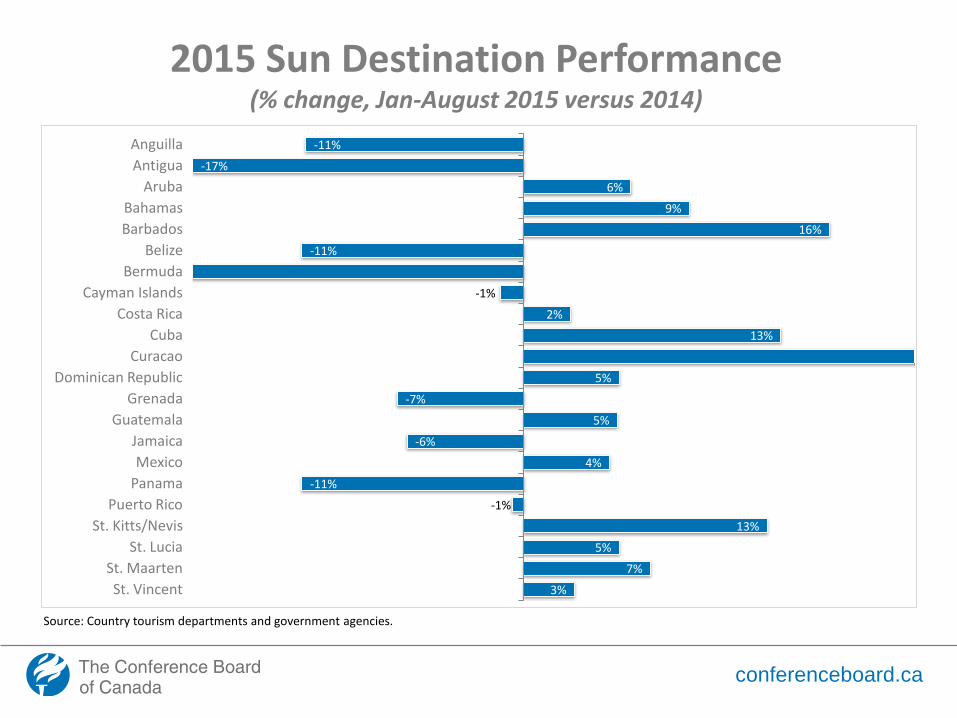
-11%
-17%
6%
9%
16%
-11%
-1%
2%
13%
5%
-7%
5%
-6%
4%
-11%
-1%
13%
5%
7%
3%
Anguilla
Antigua
Aruba
Bahamas
Barbados
Belize
Bermuda
Cayman Islands
Costa Rica
Cuba
Curacao
Dominican Republic
Grenada
Guatemala
Jamaica
Mexico
Panama
Puerto Rico
St. Kitts/Nevis
St. Lucia
St. Maarten
St. Vincent
2015 Sun Destination Performance (% change, Jan-August 2015 versus 2014)
Source: Country tourism departments and government agencies.
conferenceboard.ca
Winter Travel Intentions
conferenceboard.ca
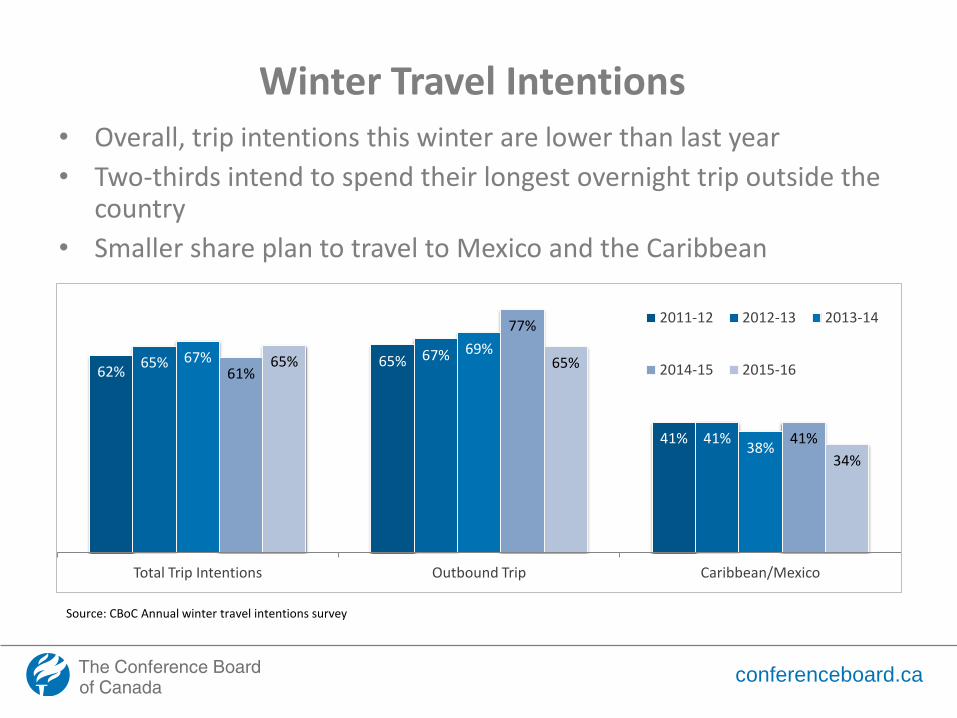
Winter Travel Intentions • Overall, trip intentions this winter are lower than last year
• Two-thirds intend to spend their longest overnight trip outside the country
• Smaller share plan to travel to Mexico and the Caribbean
62% 65%
41%
65% 67%
41%
67% 69%
38%
61%
77%
41%
65% 65%
34%
Total Trip Intentions Outbound Trip Caribbean/Mexico
2011-12 2012-13 2013-14
2014-15 2015-16
Source: CBoC Annual winter travel intentions survey
conferenceboard.ca
Winter Travel Intentions
• Still a lot of uncertainty; 8% of those planning an outbound trip this winter have not selected a destination, and 6% of those who have selected the Caribbean have not yet determined where they will go
• Demographics keeping intentions from dropping off more drastically; 36% of those planning a winter trip are 55+
• Lower intentions from largest MX/CARIB market (35-54 yrs) who account for close to half of travel to the region
• MX, Cuba, DR will see some growth
• High prices/low dollar will affect other destinations, but higher income travellers are less price sensitive – 35% of travellers planning a trip south have a household income of at least $95k
• One-third of all overseas travellers who are still in the dreaming or investigative phases of their trip planning intend to travel to MX/CARIB
conferenceboard.ca
Travel Outlook: Caribbean Destinations
conferenceboard.ca
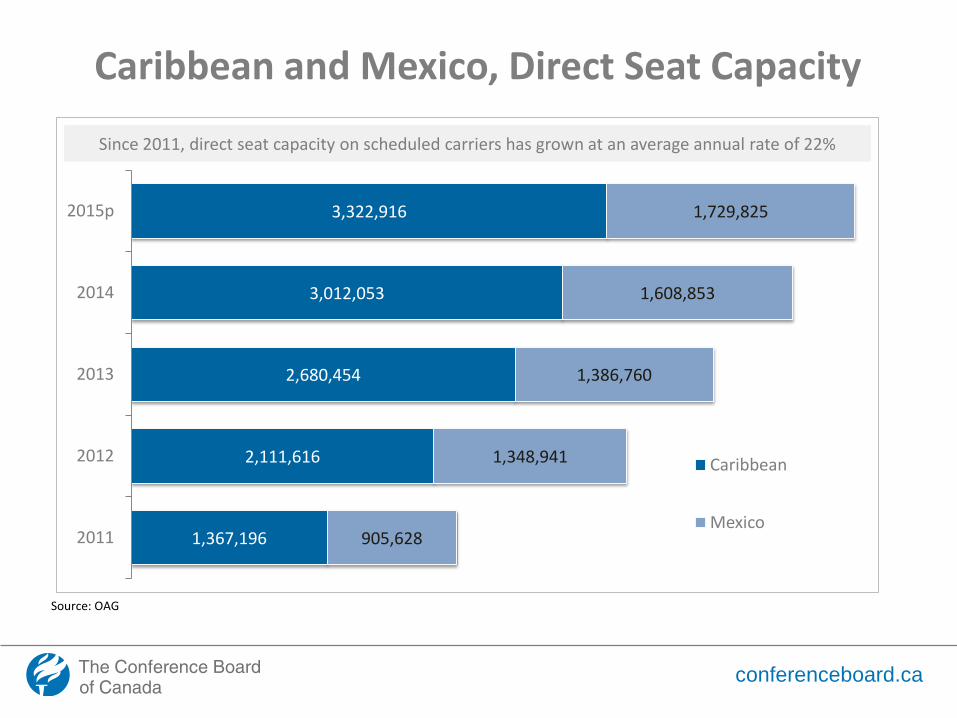
1,367,196
2,111,616
2,680,454
3,012,053
3,322,916
905,628
1,348,941
1,386,760
1,608,853
1,729,825
2011
2012
2013
2014
2015p
Caribbean
Mexico
Caribbean and Mexico, Direct Seat Capacity
Source: OAG
Since 2011, direct seat capacity on scheduled carriers has grown at an average annual rate of 22%
conferenceboard.ca
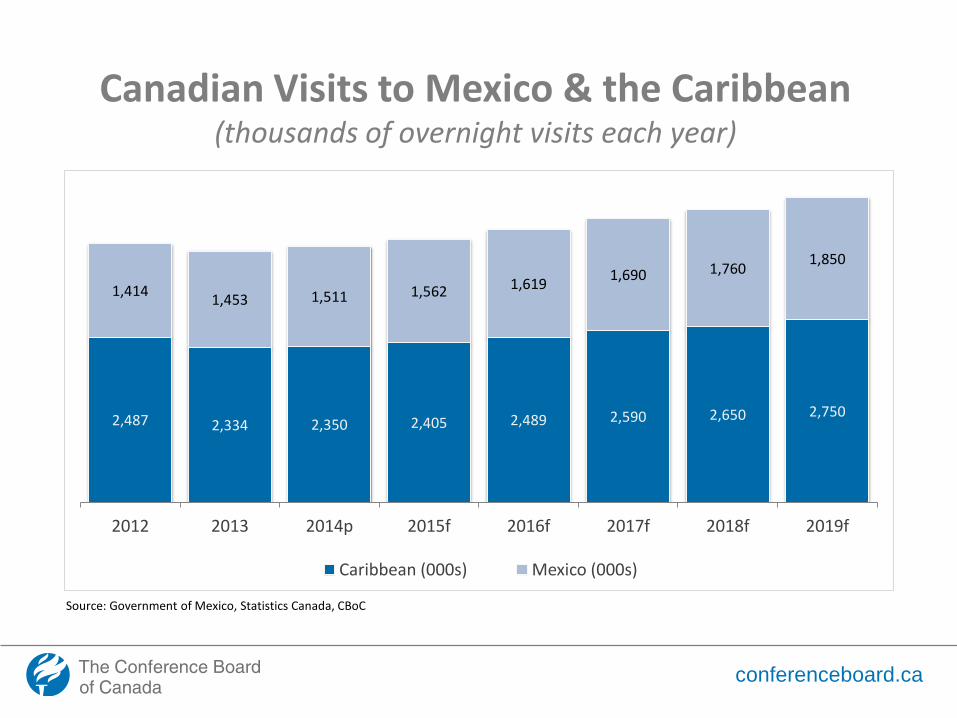
Canadian Visits to Mexico & the Caribbean (thousands of overnight visits each year)
Source: Government of Mexico, Statistics Canada, CBoC
2,487 2,334 2,350 2,405 2,489 2,590 2,650 2,750
1,414 1,453 1,511 1,562 1,619
1,690 1,760 1,850
2012 2013 2014p 2015f 2016f 2017f 2018f 2019f
Caribbean (000s) Mexico (000s)
conferenceboard.ca
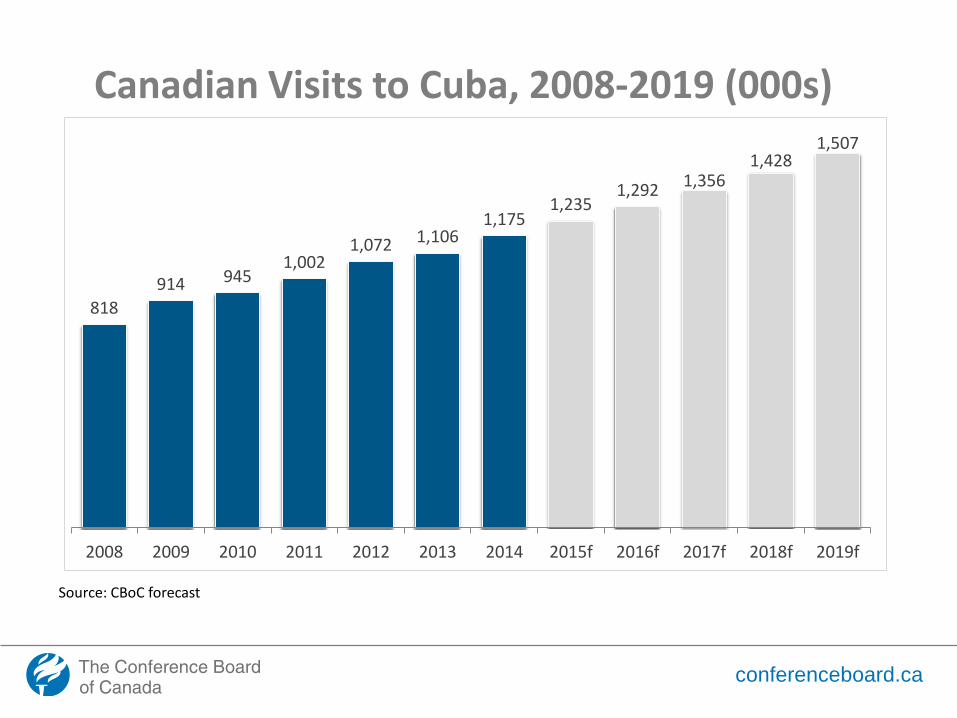
Canadian Visits to Cuba, 2008-2019 (000s)
Source: CBoC forecast
818
914 945 1,002
1,072 1,106 1,175
1,235 1,292
1,356 1,428
1,507
2008 2009 2010 2011 2012 2013 2014 2015f 2016f 2017f 2018f 2019f
conferenceboard.ca
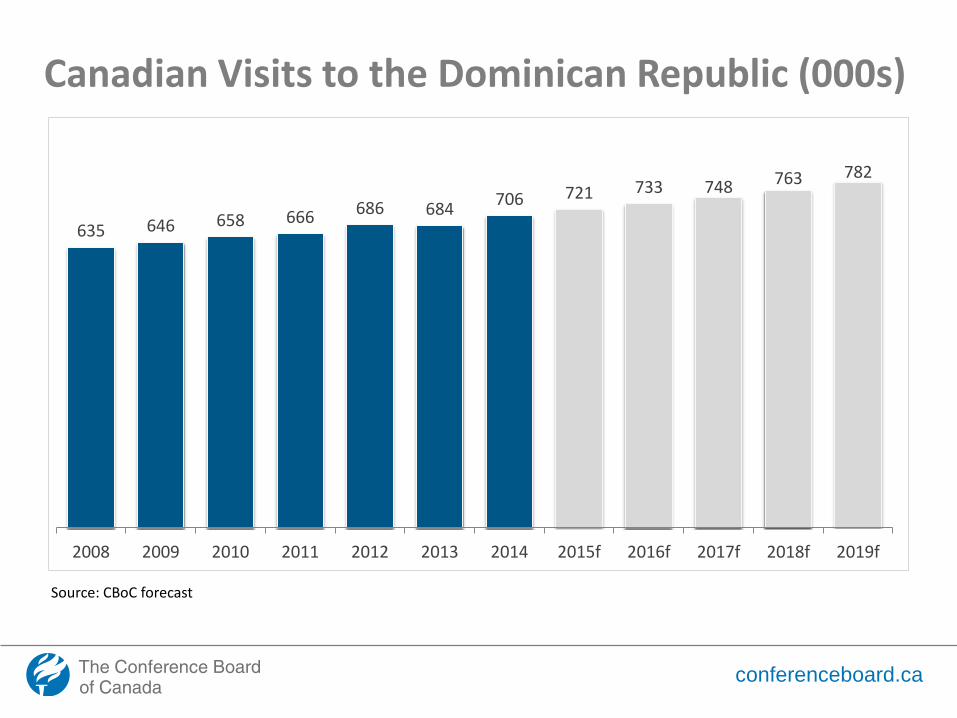
Canadian Visits to the Dominican Republic (000s)
Source: CBoC forecast
635 646 658 666 686 684 706 721 733 748 763 782
2008 2009 2010 2011 2012 2013 2014 2015f 2016f 2017f 2018f 2019f

conferenceboard.ca
Canadian Tourism Research Institute
Outbound Canada
Jennifer Hendry Senior Research Associate