our global position and future potential the challenges facing australian higher education
DESCRIPTION
Our global position and future potential The challenges facing Australian higher education. Simon Marginson Centre for the Study of Higher Education The University of Melbourne ATEM Branch Conference, South Australia Glenelg, 26 July 2006. coverage today. - PowerPoint PPT PresentationTRANSCRIPT
Our global position and future potential
The challenges facing Australian higher education
Simon MarginsonCentre for the Study of Higher Education
The University of Melbourne
ATEM Branch Conference, South AustraliaGlenelg, 26 July 2006

coverage today
• Australia’s current standing in the global setting, including research, and the market in cross-border degrees
• Factors affecting Australia’s current position and global potential: history, geography, organisational cultures, public and private investment and composition effects, system stratification, government and Labor policies
• Five possible futures, given different assumptions about public/private sector balance, public and private funding at varying levels, and the extent of mission specialisation

Positioned but also position-taking: Factors determining global potential
• Institutions, and national systems, are both ‘positioned’ and ‘position-taking’ in the global field of higher education (Bourdieu). They have some control but not total control over their potential and opportunities. Those with stronger resources and reputations have more room to move than do others
• Position affects the capacity to operate globally, which is unevenly distributed between nations and institutions on the basis of history, geography, size, resources, language of use, etc.
• Nations and universities have a greater range of position-taking options in the global setting than national/local setting. The global setting is more open, less path-bound, with more possibilities for securing position via policy moves, cultures of responsiveness, executive strategies, novel teaching and research initiatives, etc.

Elements of global effectiveness• The key is to be fully engaged globally while maintaining a
grounded, evolving national/local identity. A spirit of global engagement, grounded in national/local identity, while at the same time fostering an active, informed curiosity about other cultures. Openness plus a strong sense of own project.
• Long term solid national government support is crucial• Institutional autonomy and academic freedom to operate• Research capacity and outputs are crucial to universities• Vocational education that is cutting edged, properly resourced• Communications power: both in (1) IT and (2) languages• Executive steering capacity based on professional managers • Staff and student movement inwards and outwards• Timing: take the opportunities when they are there!

1. Australia’s current global standing

Australia in the global setting:• An upper middle ranking higher education system • Key advantages: (1) being English-speaking, (2) relatively safe
and tolerant social setting, (3) location SE of the Asian continent, (4) responsive and enterprising university cultures
• Compared to other English-speaking nations, stronger in international education, in the sale of degrees especially in Asia, than in research. Academic capacity has been de-emphasized
• 1.6% of GDP spent on tertiary education (2002) USA 2.6%
• Relatively high dependence on private income as is USA • None of the top 20 research universities, two of top 100, 14 of
top 500 (Shanghai Jiao Tong, 2005) USA has 53 of top 100, 17 of top 20
• 2% of world scientific papers (2001) USA 31% • 97 ISI ‘HighCI’ researchers 3568 in the USA, 409 in UK, 161 in Canada, 16 in NZ
• 8000 foreign doctoral students USA 102,000
• 9% of the cross-border market in degrees (2003) USA 28%

Global markets, global competitionThere are two tier global markets in tertiary education: 1. The ‘super-league’ of leading research universities in
USA/UK that dominate research and doctoral training. A status competition not a commercial market: relationships are conducted (and dominance exercised) as much via academic collaboration and exchange of public knowledge goods, as by competitive relations and private good production;
2. The market in commercial vocational training, produced by both non-profit and for-profit institutions, in both university and polytechnic/VET sectors. Australian institutions sit here
98% of students are educated at home. But in many nations global markets and the ‘super-league’ now overshadow once unchallenged leading institutions; and ‘rising star’ institutions can leverage global activity to lift themselves at home

Research papers in science and technology 2001
USA, 200,870
Japan, 57,420
UK, 47,660Germany, 43,623France, 31,317
Canada, 22,626
Italy, 22,313
China, 20,978
Russ ian Fed, 15,846
Spain, 15,570
Aus tralia, 14,788
Netherlands , 12,602
India, 11,076
Korea, 11,037
Sweden, 10,314
Thailand, 655
others , 111100

Growth in science papers 1988-2001 (ISI data)
change between 1988 and 20011988 = 100.0
Korea 1431.5
Turkey 808.3
Singapore 634.9Taiwan 571.6Portugal 499.3China 454.2Brazil 408.0Mexico 363.0Australia 149.4

Jiao Tong rankings: weightings
criterion weighting
Alumni of institution: Nobel Prizes and field medals 10%
Staff of institution: Nobel Prizes and field medals 20%
High citation (HiCi) researchers 20%
Articles in Nature and Science 20%
Articles in citation indexes in science, social science, humanities 20%
Research performance (compiled as above) per head of staff 10%
total 100%

Top 100 research universities 2005
from Shanghai Jiao Tong University Institute of Higher Education
USA 53
UK 11
Ge rmany 5
Japan 5
Canada 4
France 4
Swe de n 4
Switzerland 3
Ne therlands 2
Australia 2
others 7
Others: Israel, Finland, Denmark, Austria, Norway, Russia, Italy each 1.

Peaks of the global education market: the top 20 research universities 2005
from Shanghai Jiao Tong University data
1 HARVARD USA 11 Yale USA2 Cambridge UK 12 Cornell USA3 Stanford USA 13 UC San Diego USA4 UC Berkeley USA 14 UC Los Angeles USA5 MIT USA 15 Pennsylvania USA6 Caltech USA 16 Wisconsin-Madison USA7 Columbia USA 17 Washington (Seattle) USA8 Princeton USA 18 UC San Francisco USA9 Chicago USA 19 Johns Hopkins USA
10 Oxford UK 20 Tokyo JapanAustralia has ANU at 56, Melbourne at 82

Australians in the top 500, 2005 from Shanghai Jiao Tong University data
top 100 ANU (56), Melbourne (82)
top 150 Queensland, Sydney
top 200 NSW, WA
top 300 Monash, Adelaide, Macquarie
top 400 Newcastle
top 500 Tasmania, Flinders, La Trobe, Murdoch
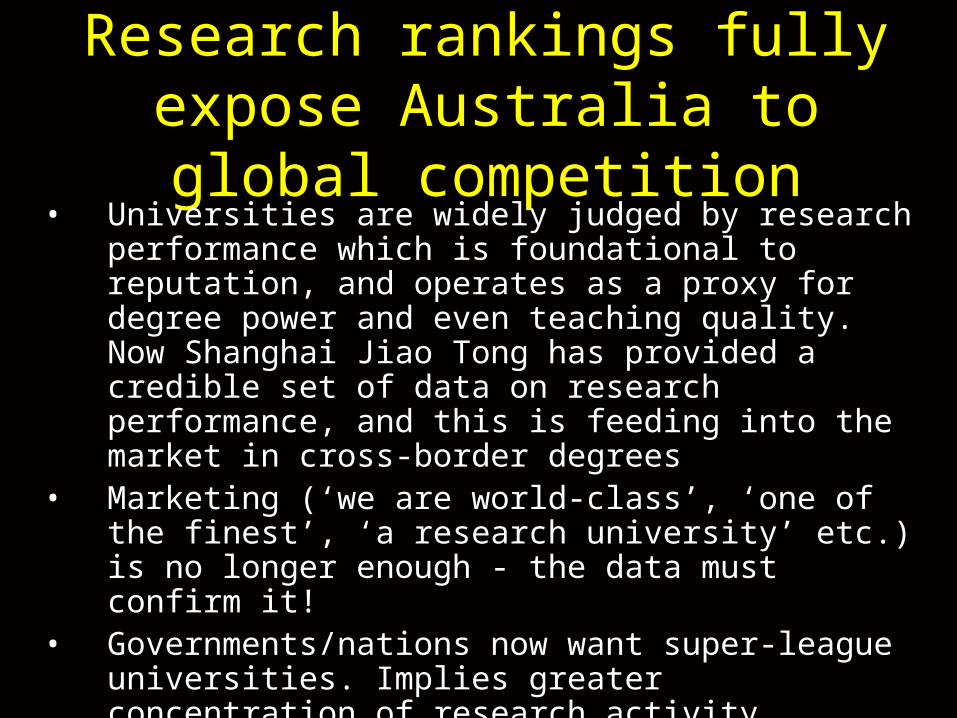
Research rankings fully expose Australia to global competition
• Universities are widely judged by research performance which is foundational to reputation, and operates as a proxy for degree power and even teaching quality. Now Shanghai Jiao Tong has provided a credible set of data on research performance, and this is feeding into the market in cross-border degrees
• Marketing (‘we are world-class’, ‘one of the finest’, ‘a research university’ etc.) is no longer enough - the data must confirm it!
• Governments/nations now want super-league universities. Implies greater concentration of research activity, greater stratification of universities, selective investment increases
• Every university (except Harvard) wants to lift its rankings, every university in the top 500 wants to hire more high citation (HiCi) researchers. This competition is generating price effects
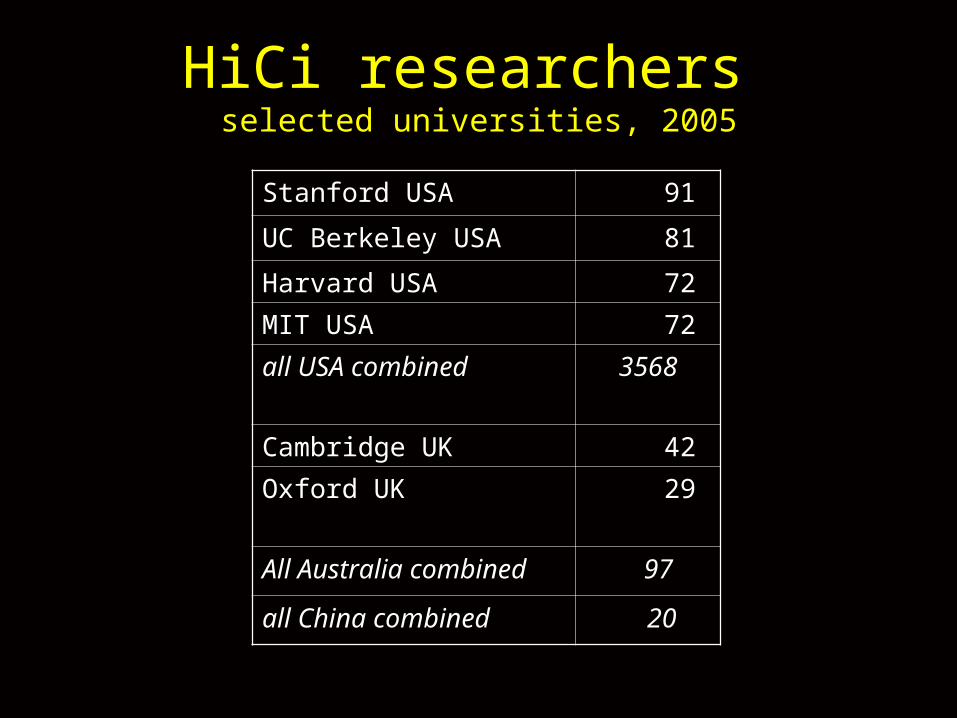
HiCi researchers selected universities, 2005
Stanford USA 91
UC Berkeley USA 81
Harvard USA 72MIT USA 72all USA combined 3568
Cambridge UK 42Oxford UK 29
All Australia combined 97
all China combined 20

HiCi researchers Australia 2005
(Stanford) (91)Australia combined 97ANU 25Melbourne 9WA 7Sydney 6UNSW 6Macquarie 3Newcastle 3Murdoch 2Southern Cross 2others include Queensland, Adelaide, Monash, Tasmania, La Trobe, Flinders, UTS, UWS each 1, CSIRO 9, personnel in industry laboratories and medical research institutes, etc.

Exporters of cross-border education
2003 OECD data
USA 28%
UK 12%
Germany 11%France 10%
Australia 9%
Japan 4%
Russian Fed. 3%
Spain 3%
others 20%

Largest Australian providers Institution* More than 50% of international students off-shore
International students 2004
International fee revenues 2004 $sm
Proportion of all revenues 2004
1 Monash U 17,077 160.3 19.5%
2 RMIT U * 15,132 122.8 25.2%
3 Curtin UT * 14,319 96.4 23.2%
4 Central Queensland U 10,460 97.1 39.5%
5 U South Australia * 10,257 51.3 16.2%
6 U Sydney 9806 124.3 12.7%
7 U NSW 9481 116.4 15.0%
8 U Melbourne 9215 154.8 14.7%
9 Macquarie U 8725 83.6 24.5%
10 Charles Sturt U * 8429 13.7 6.4%
11 U Southern Queensland * 8333 20.9 16.0%
12 U Wollongong 7940 55.2 20.6%U Southern California (2004-05) 6846

Education export: pluses & minusesPLUSES •$5 billion export industry with 230,000 students built in 15 years –
thanks to university entrepreneurship and business models (and the strength of revenue incentives)•Market share in university sector third in world•Sustains a major national engagement in Asia•Provides 15% of university revenues: fiscal savings•National quality assurance (though needs strengthening)
MINUSES •Too dependent on high volume medium quality standard cost training in business and IT – lack of diversity of product•Not enough top quality students, including PhD students•‘Franchising’ operations weaken quality and reputation•Growth over-dependent on incentives created by public funding cuts, creating downward pressures on standards•Lack of attention to international student security•Market position vulnerable to price effects, declining research reputation, import replacement in Asia, non-English languages

Enrolment shifts 2003-2004Australia 2004 DEST data
students from 2003 2004 2003 = 1.00
China 27,020 37,106 1.37
Malaysia 27,267 28,862 1.06
Singapore 29,878 28,290 0.95
Hong Kong 29,169 27,461 0.94
India 11,133 16,320 1.47
Indonesia 11,865 11,316 0.95
USA 9418 9522 1.01
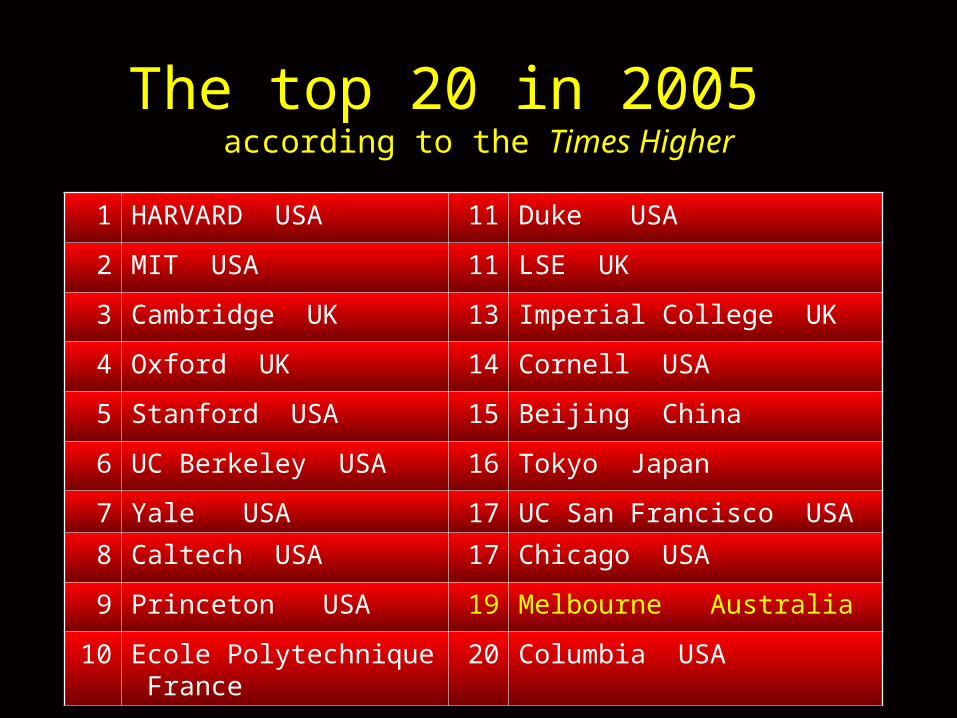
The top 20 in 2005 according to the Times Higher
1 HARVARD USA 11 Duke USA
2 MIT USA 11 LSE UK
3 Cambridge UK 13 Imperial College UK
4 Oxford UK 14 Cornell USA
5 Stanford USA 15 Beijing China
6 UC Berkeley USA 16 Tokyo Japan
7 Yale USA 17 UC San Francisco USA8 Caltech USA 17 Chicago USA
9 Princeton USA 19 Melbourne Australia
10 Ecole Polytechnique France 20 Columbia USA

Australians in the top 200, 2005 according to the Times Higher
19 Melbourne 82 RMIT
23 ANU 87 UTS
33 Monash 98 La Trobe
38 Sydney 101 Curtin
40 NSW 118 QUT
47 Queensland 127 Newcastle
67 Macquarie 154 South Australia
80 Western Australia 166 Tasmania
80 Adelaide

Times Higher rankings: weightings
criterion weighting
‘Peer review’ (survey) 40%
Global employer review (survey) 10%
Internationalization of academic staff 5%
Internationalization of student body 5%
Student-academic staff ratio (proxy for ‘teaching quality’) 20%
Research citations per head of academic staff 20%
total 100%

2. Factors affecting Australia’s global position and potential

Constituents of global position and potential: summary
Geography Isolated from the Atlantic zone which will never be home (sigh…); forever located SE of Asia; SE Asia our natural backyard; we are closer to China than is the USA or Europe (embrace this destiny!)
History English-speaking. Reputation based in strong comprehensive research universities created 1950s-1970s, second layer only partly developed
Organizational cultures
Responsive, enterprising, internationalised, capable of a range of position-taking strategies. Weaknesses: Monocultural, and neglect of academic capacity (except sandstones) amid emphasis on marketing/revenue-raising
Investment in higher education
Above OECD average overall. Below average public investment but well above average private investment. This composition of investment has implications for the patterns of activity and resource use
Public/ private balance
Negligible private sector transforming into major player via FEE-HELP, broadening diversity, centering innovation and growth in that sector
Overall system stratification
Average for an OECD nation but becoming steeper. Potential for very strong research universities as yet unrealized, ‘tail’ of weaker institutions

Languages of 100 million + voicesEnglish 1000 millionPutonghua (‘Mandarin’) 1000Hindi/ Urdu 900Spanish/ Portuguese 450/ 200Russian 320Arabic 250Bengali 250Malay-Indonesian 160Japanese 130French 125German 125[Thai] [45][Lao/Isan] [30]

Investment in tertiary education as a proportion of GDP (2002)
0
0.5
1
1.5
2
2.5
3
USA Australia Netherlands Finland Korea
public private total

• Australian investment in tertiary education is high relative to the OECD norm but the composition of investment has changed dramatically. In the last two decades the public share of funding has fallen from 85% to 40%. Incentives have been transformed. The pattern of activity has altered.
• ‘It is notable that the rises in private educational expenditure have not generally been accompanied by cuts in public expenditure on tertiary education. On the contrary, public investment has increased in most of the OECD countries for which 1995-2002 data are available, regardless of changes in private spending. In fact, many OECD countries with the highest growth in private spending have also shown the highest increase in public funding… The main exception is Australia, where the shift towards private expenditure at tertiary level has been accompanied by a fall in the level of public expenditure in real terms’.
- OECD, Education at a Glance, 2005, p. 193. The decline in public spending 1995- 2002 is 8 per cent in total (p. 187) and about 30 per cent on a per student basis (p. 175) .

• Total university revenues have not declined. Public funding per student is down, private funding per student is up, the effects seem to cancel out. But on the private income side, what matters is not total income but surplus. In many universities international student marketing provides additional cash flow but does not generate net surplus. The new revenues have been largely or wholly absorbed by the new functions needed to raise them: marketing, off-shore activity, special services, etc. The old public income, the gift of government that cost little to ‘raise’, is not replaced.
• And in some cases where international marketing does generate significant surplus, quality is suffering.
• This is why in the midst of the export bonanza, universities are impoverished, and quality and value are in question.
• In sum, with the shift to market-based incomes, universities spend more on revenue raising functions and less on the ‘core businesses’ of teaching and research. Yet it is these core businesses from which business draws value. The incentives are wrong. Universities are spending more on reproducing themselves, and less on producing valuable products.

National research performance compared to economic capacity
Nations with research capacity greater than their economic wealth suggests(in order of performance)
Israel, Sweden, Switzerland, UK, Netherlands, Canada, Finland, Denmark, Australia, USA
Nations with research capacity about on par with economic wealth
Germany, New Zealand, Hungary, Belgium, Austria, Norway, Chile, France, Hong Kong, South Africa
Nations with research capacity less than their economic wealth suggests
Ireland, Brazil, Japan, India, Portugal, Czech Republic, Russia, Italy, Korea, Spain, Poland, Greece, China, Argentina, MexicoItalics: over 20% of students in independent private sector

Australia in the global market inmobile doctoral students
Percentage (%) of all international students enrolled in research degreesOECD data for 2003 except USA is 2003-2004
0
5
10
15
20
25
30
35
US doctoraluniversities
Swizerland Sweden UK Australia

Where will public institutions raise the new money they need?
• Limited scope for HECS increases given faltering participation and fact most institutions are at maximum
• No sign of serious increase in targeted research money to support RQF, or ANU-style funds to other institutions
• Full fees a bonanza to emetging private sector institutions but choked by red-tape in public sector, e.g. uniform caps by program: no bonanza for sandstones,others not competitive
• Serious increases in industry and philanthropic money dependant on tax changes
• Limited potential for further cranking up foreign students
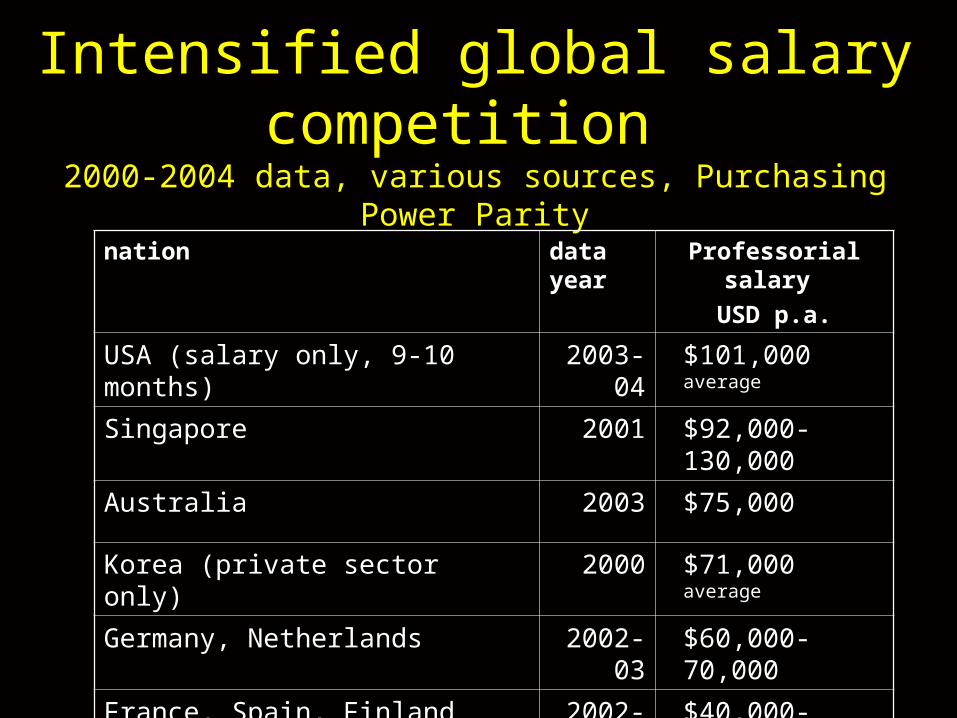
Intensified global salary competition 2000-2004 data, various sources, Purchasing Power Parity
nation data year
Professorial salary USD p.a.
USA (salary only, 9-10 months) 2003-04 $101,000 average
Singapore 2001 $92,000-130,000
Australia 2003 $75,000
Korea (private sector only) 2000 $71,000 average
Germany, Netherlands 2002-03 $60,000-70,000
France, Spain, Finland 2002-03 $40,000-70,000

Private and public sectors• The main impact of the Nelson reforms is the fostering of the
private higher education sector, now about 10% of enrolments• Here the federal government is creating a pro-coalition
constituency akin to the newer private schools; like them some are communities of faith
• The change to the national protocols permitting specialist universities (originally triggered by Carnegie Mellon in SA?) is a decisive innovation, with the potential to radically remake the map of provision in the longer term
• The private zector has become the main site of growth and innovation while the public sector has little growth potential
• However there are signs of a new trend to mission specialisation in the public sector, notably at Melbourne

Stratification
• Slow evolution into steeper market, not dramatic change• The sandstones have not taken flight - limits of
undergraduate full fees, no RQF yet, and anyway the RQF is unlikely to deliver major shifts in research funding
• Elite private sector yet to emerge (but watch this space)• Spate of new medical faculties strengthens some contenders• Middle level institutions under new pressure to merge, and
with or without this face difficulties in cost management• Volume maximisers with weaker research face declining
reputations and possibly, declining fee-based incomes• Serious money for regionals yet to appear. A hard time

3. Five possible futures

Some worrying signs• We have lived off a strong research reputation accumulated on
the basis of public investment in the 1960-1985 period, but• Jiao Tong rankings now make research reputation a function of
measured performance, not history or marketing • They also emphasise the need for top 40 universities• Downward pressures on quality of teaching (doubling of staff
student ratios) and research (funding cuts hurt basic research)• We are weak in comparisons with the UK and Canada• Our international market share and revenues are vulnerable, e.g.
import replacement and export competition in China, Singapore• We lack a national approach to standards• Fiscal policy is locked up, seems to be downward flexibility only• Global capacity? National policy is ‘leave it to the universities’
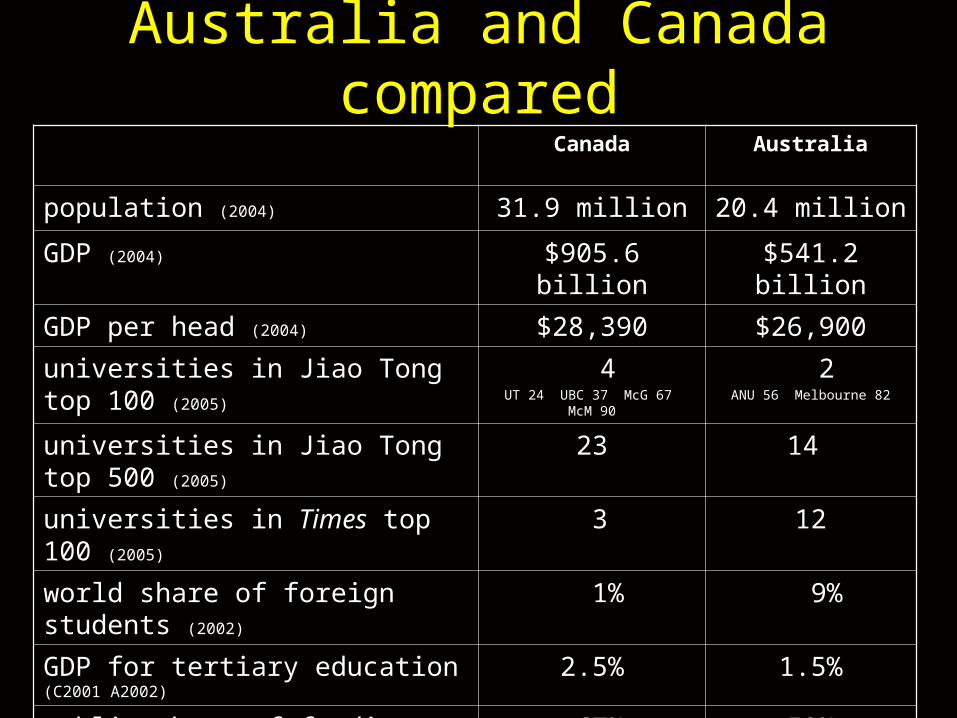
Australia and Canada comparedCanada Australia
population (2004) 31.9 million 20.4 million
GDP (2004) $905.6 billion $541.2 billionGDP per head (2004) $28,390 $26,900universities in Jiao Tong top 100 (2005) 4
UT 24 UBC 37 McG 67 McM 90
2ANU 56 Melbourne 82
universities in Jiao Tong top 500 (2005) 23 14 universities in Times top 100 (2005) 3 12
world share of foreign students (2002) 1% 9%
GDP for tertiary education (C2001 A2002) 2.5% 1.5%public share of funding (C2001 A2002) 67% 50%public funding source provinces/national national

Student flows in the global education environment
ASIA-PACIFIC (demand for foreign study
In China, India, Korea, etc.)
EUROPE
UNITED STATESUK Canada
AUSTRALIANZ
JAPAN

Export and import in Asia OECD data for 2001
0
50,000
100,000
150,000
200,000
China & Hong Kong
Korea India JapanMalaysiaIndonesiaSingaporeThailandPakistan Vietnam
Exports Imports

Five possible scenarios1 Present trends
continuePrivate sector fostered while public sector remains stagnant, private sector eventually becomes main site of quality, research withers
2 Vouchers/ full fees across whole system
High tuition high aid: USA with less money: strong private sector, privatised rich sandstones, steep resource differentials, long-term costsof FEE-HELP
3 Private sector plus elite research layer
Japanese system. Research publicly fostered in a few top universities (3-10?) while private sector is site of mass growth and teaching innovation
4 Nuanced missions
One-by-one negotiation with funded institutions over mission/ profile, divergence in content depending on whether Labor or coalition, needs buffer body
5 Reinvestment across the public system
One off or long term? Selective or general funding? Fiscal cost . Leaves unresolved global competitiveness of top research universities