osmolality/salinity-responsive enhancers (osres) …osmolality/salinity-responsive enhancers (osres)...
TRANSCRIPT
Osmolality/salinity-responsive enhancers (OSREs)control induction of osmoprotective genes ineuryhaline fishXiaodan Wanga,b and Dietmar Kültza,1
aBiochemical Evolution Laboratory, Department of Animal Science, University of California, Davis, CA, 95616; and bLaboratory of Aquaculture Nutrition andEnvironmental Health, School of Life Sciences, East China Normal University, Shanghai, 200241, China
Edited by George N. Somero, Stanford University, Pacific Grove, CA, and approved February 17, 2017 (received for review September 1, 2016)
Fish respond to salinity stress by transcriptional induction of manygenes, but the mechanism of their osmotic regulation is unknown.We developed a reporter assay using cells derived from the brain ofthe tilapia Oreochromis mossambicus (OmB cells) to identifyosmolality/salinity-responsive enhancers (OSREs) in the genes ofO. mossambicus. Genomic DNA comprising the regulatory regionsof two strongly salinity-induced genes, inositol monophosphatase 1(IMPA1.1) andmyo-inositol phosphate synthase (MIPS), was isolatedand analyzedwith dual luciferase enhancer trap reporter assays. Weidentified five sequences (two in IMPA1.1 and three in MIPS) thatshare a common consensus element (DDKGGAAWWDWWYDNRB),which we named “OSRE1.” Additional OSREs that were less effec-tive in conferring salinity-induced trans-activation and do not matchthe OSRE1 consensus also were identified in both MIPS andIMPA1.1. Although OSRE1 shares homology with the mammalianosmotic-response element/tonicity-responsive enhancer (ORE/TonE)enhancer, the latter is insufficient to confer osmotic induction infish. Like other enhancers, OSRE1 trans-activates genes indepen-dent of orientation. We conclude that OSRE1 is a cis-regulatoryelement (CRE) that enhances the hyperosmotic induction ofosmoregulated genes in fish. Our study also shows that tailoredreporter assays developed for OmB cells facilitate the identifica-tion of CREs in fish genomes. Knowledge of the OSRE1motif allowsaffinity-purification of the corresponding transcription factor andcomputational approaches for enhancer screening of fish genomes.Moreover, our study enables targeted inactivation of OSRE1 en-hancers, a method superior to gene knockout for functional char-acterization because it confines impairment of gene function to aspecific context (salinity stress) and eliminates pitfalls of consti-tutive gene knockouts (embryonic lethality, developmentalcompensation).
biochemical evolution | compatible osmolytes | osmotic stress signaling |enhancer | CRE
Amajor challenge of biology is understanding the evolutionary/adaptive significance of genetic variation and the biochemical
mechanisms that govern the phenotypic diversity of organisms. Mi-croevolutionary and functional autecology studies aim to explainhow organisms adapt to environmental change and stress, but cur-rently they rely heavily on correlations of phenotypes with particularSNPs or other sequence variations (1). Moreover, holistic systemsbiology approaches aimed at explaining physiological plasticity andacclimatory responses to environmental change and stress often relyon comprehensive correlations between specific environmentalconditions and changes in the abundance of particular mRNAs orproteins. There is great need to complement such approaches withstudies that establish causal links between sequence variation,changes in gene expression, and environmental signals to understandthe mechanistic consequences of global climate change on organis-mal form and function. Climate change accelerates the melting ofpolar icecaps, the salinization of coastal areas, and the decrease inaverage ocean salinity (2). Because salinity is a major abiotic factor
that controls the activity and distribution of aquatic animals, suchchanges significantly impact fish biodiversity and distribution.Most fish (>25,000 extant species) are teleosts and osmor-
egulators, meaning that they maintain their extracellular bodyfluids at a relatively constant osmolality of ∼300 mOsmol/kg (is-osmotic to a salinity of 9 g/kg). Only a small minority of fish (suchas marine hagfish and elasmobranchs) are osmoconformers (3).Altering habitat salinity causes stress and evokes compensatoryosmoregulatory responses in fish (3). Fish species that tolerateonly a narrow salinity range are known as “stenohaline species”;those that can tolerate a wide salinity range are referred to as“euryhaline species” (4). Euryhaline fish have evolved specialbiochemical and physiological mechanisms that allow them toperceive and compensate for changes in the salinity of theiraquatic habitat. They can sense osmotic stress, leading to the ac-tivation of osmosensory signaling mechanisms that, in turn, con-trol osmoregulatory effectors to alleviate osmotic stress (5). Alarge number of osmoregulatory effector genes and their proteinproducts are regulated when euryhaline fish experience salinitystress (3, 6, 7). The osmosensory signaling networks that controlthese effector genes are most potent and apparent in euryhalinespecies with highly dynamic osmoregulatory ability (8). One suchspecies is Oreochromis mossambicus, which has a very wide salinitytolerance range of 0–120 g/kg (9) and is a well-established modelfor studies of teleost osmoregulation (10–12).
Significance
Salinity stress is common in many environments and is predictedto intensify. Such stress increases the expression of numerousgenes in fish, but the corresponding regulatory mechanisms areunknown. Our study provides a toolkit for discovering and func-tionally validating cis-regulatory elements (CREs) that controlinducible gene expression in fish. This toolkit was used for ex-perimental identification of the first osmotic/salinity-responsiveCREs in fish (OSRE1). Our findings greatly empower novel ap-proaches for deciphering fish osmosensory signaling and generegulatory networks. Because sequence variation in inducibleCREs is critical for the evolution of stress tolerance, knowledgeof osmolality/salinity-responsive enhancers is critical for revealingthe evolution and function of regulatory networks responsiblefor euryhalinity of fish.
Author contributions: D.K. designed research; X.W. performed research; X.W. and D.K.analyzed data; and X.W. and D.K. wrote the paper.
The authors declare no conflict of interest.
This article is a PNAS Direct Submission.
Freely available online through the PNAS open access option.
Data deposition: The sequences reported in this paper have been deposited in the Gen-Bank database (accession nos. KX649230 and KX649231) and are available at PanoramaPublic, https://panoramaweb.org/labkey/XW2016-1.url.1To whom correspondence should be addressed. Email: [email protected].
This article contains supporting information online at www.pnas.org/lookup/suppl/doi:10.1073/pnas.1614712114/-/DCSupplemental.
www.pnas.org/cgi/doi/10.1073/pnas.1614712114 PNAS | Published online March 13, 2017 | E2729–E2738
EVOLU
TION
PNASPL
US
Dow
nloa
ded
by g
uest
on
Apr
il 21
, 202
0
Evolutionary differences in the environmental regulation of geneexpression are often the result of altered cis-regulatory elements(CREs) (13, 14). In fact, genetic variation in CREs and/or trans-acting factors represents an efficient and common evolutionarystrategy for changing environmentally modulated gene-expressionpatterns (15–18). Changed gene-expression patterns, in turn, leadto altered phenotypes to achieve biochemical adaptation and theevolution of populations and species (15–18). Such variationmodifies the highly dynamic nature of gene-regulatory networks,which embody the interaction of a large number of CREs and transfactors (19–22). Therefore, the identification and experimentalvalidation of environmentally regulated CREs in organisms thatare uniquely adapted to particular habitats is a critical prerequisitefor understanding biochemical evolution (23).Transcriptional enhancers are CREs that were discovered several
decades ago, but their identification and the characterization oftheir environmental, developmental, or tissue-specific activation isstill challenging (23). A popular and powerful approach for genome-wide mapping of enhancers is ChiP (24). However, this approachrequires knowledge of specific epigenetic chromatin states (e.g., aparticular histone posttranslational modification) or enhancer-specifictranscription factors and is contingent on the availability of thecorresponding antibodies. Computational approaches for de novoenhancer prediction represent an alternative to ChiP, but theyoften suffer from low-confidence results, particularly when noveltypes of enhancers or “nonmodel” species are being studied (23,25). A more powerful approach for de novo identification of en-hancers is the combination of computational prediction andexperimental validation (26, 27).Unbiased experimental identification of novel enhancers is ac-
complished by enhancer trap reporter assays, e.g., dual luciferaseassays, which are highly sensitive for quantifying gene expressionover a wide dynamic range (28). These assays rely on establishedcell lines to permit the high-throughput screening of the enhanceractivity of hundreds of different sequence fragments (29–32).Mammalian cell lines have been used to identify the first minimaltonicity-responsive enhancer (TonE), also known as an “osmotic-response element” (ORE) (33–35). Multiple copies of TonE/OREare present in many mammalian genes that control the intracellularconcentrations of compatible organic osmolytes, including betaine/γ-amino-butyric acid transporter (BGT1) (34), aldose reductase(AR) (33, 36), and sodium-myo-inositol transporter (SMIT) (37).We recently established several immortalized O. mossambicus
cell lines to render enhancer trap reporter assays feasible for euryha-line fish (38). Cultured cells are much more amenable to mechanisticand causal dissection of environmental stress responses than tissues ofcomplex and long-lived organisms analyzed in situ (39, 40). Therefore,if the cellular and biochemical phenotypes observed in the tissues ofwhole organisms are reproducible in cell culture, their mechanisticbasis can be revealed using cell lines as an alternative to animalmodels. For instance, the osmotic induction of the pathway for syn-thesis of the compatible organic osmolytemyo-inositol, which is evidentin many O. mossambicus tissues, is fully reproducible in the OmB cellline derived from the brain of the tilapia O. mossambicus (38, 41–43).Inositol monophosphatase 1 (IMPA1.1) and myo-inositol phos-
phate synthase (MIPS) are the two enzymes comprising the myo-inositol biosynthesis (MIB) pathway. This pathway plays a keyphysiological role in teleost osmoregulation, because it convertsglucose-6-phosphate to the compatible organic osmolyte myo-inositol, which protects cells from salinity-induced damage (44).IMPA1.1 and MIPS mRNA, protein, and activity are all highlyinduced by salinity stress, resulting in elevated levels of themetabolite myo-inositol (41, 45). myo-Inositol is one of only ahandful of compatible organic osmolytes that are universally usedby all cells to protect macromolecular structure and functionduring osmotic stress (44, 46–48). Because the enzymes involved incompatible organic osmolyte synthesis and degradation are criticalfor osmoregulation, they represent excellent targets for elucidating
the mechanisms by which osmosensory signaling networks controlgene expression during salinity stress. In the current study we de-veloped an enhancer trap reporter assay for the OmB cell line andused it to identify and functionally validate an osmotic/salinity-responsive CRE, OSRE1, that is present in multiple copies inthe IMPA1.1 and MIPS genes of euryhaline fish.
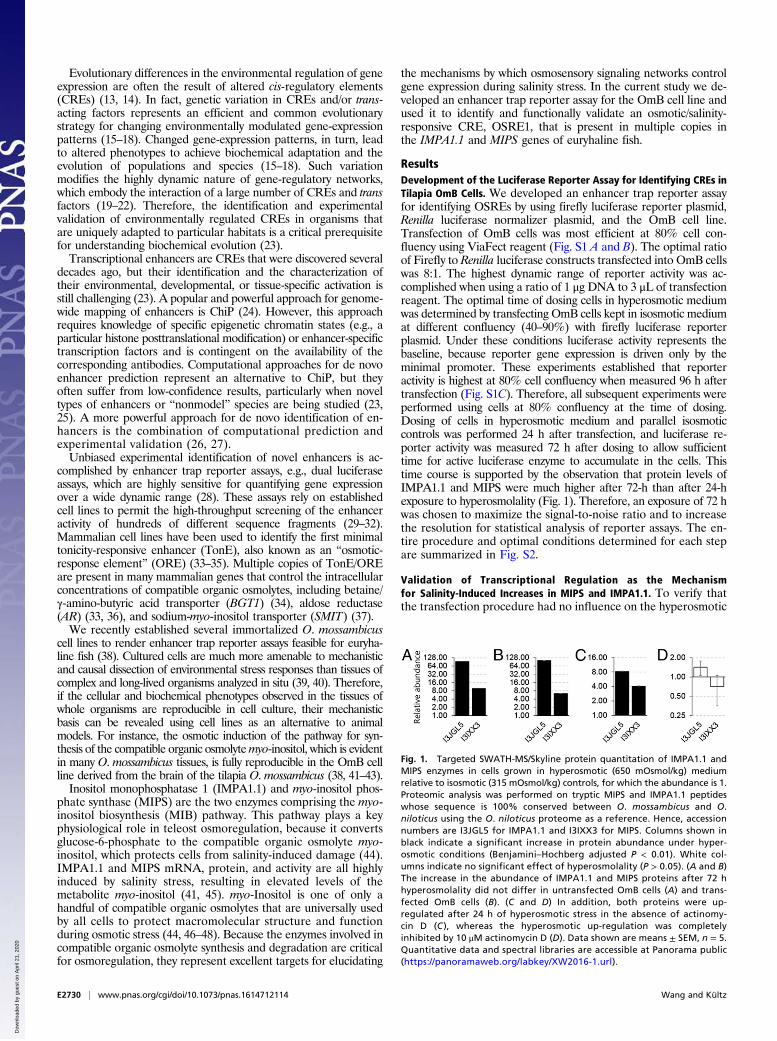
ResultsDevelopment of the Luciferase Reporter Assay for Identifying CREs inTilapia OmB Cells. We developed an enhancer trap reporter assayfor identifying OSREs by using firefly luciferase reporter plasmid,Renilla luciferase normalizer plasmid, and the OmB cell line.Transfection of OmB cells was most efficient at 80% cell con-fluency using ViaFect reagent (Fig. S1 A and B). The optimal ratioof Firefly to Renilla luciferase constructs transfected into OmB cellswas 8:1. The highest dynamic range of reporter activity was ac-complished when using a ratio of 1 μg DNA to 3 μL of transfectionreagent. The optimal time of dosing cells in hyperosmotic mediumwas determined by transfecting OmB cells kept in isosmotic mediumat different confluency (40–90%) with firefly luciferase reporterplasmid. Under these conditions luciferase activity represents thebaseline, because reporter gene expression is driven only by theminimal promoter. These experiments established that reporteractivity is highest at 80% cell confluency when measured 96 h aftertransfection (Fig. S1C). Therefore, all subsequent experiments wereperformed using cells at 80% confluency at the time of dosing.Dosing of cells in hyperosmotic medium and parallel isosmoticcontrols was performed 24 h after transfection, and luciferase re-porter activity was measured 72 h after dosing to allow sufficienttime for active luciferase enzyme to accumulate in the cells. Thistime course is supported by the observation that protein levels ofIMPA1.1 and MIPS were much higher after 72-h than after 24-hexposure to hyperosmolality (Fig. 1). Therefore, an exposure of 72 hwas chosen to maximize the signal-to-noise ratio and to increasethe resolution for statistical analysis of reporter assays. The en-tire procedure and optimal conditions determined for each stepare summarized in Fig. S2.
Validation of Transcriptional Regulation as the Mechanismfor Salinity-Induced Increases in MIPS and IMPA1.1. To verify thatthe transfection procedure had no influence on the hyperosmotic
Fig. 1. Targeted SWATH-MS/Skyline protein quantitation of IMPA1.1 andMIPS enzymes in cells grown in hyperosmotic (650 mOsmol/kg) mediumrelative to isosmotic (315 mOsmol/kg) controls, for which the abundance is 1.Proteomic analysis was performed on tryptic MIPS and IMPA1.1 peptideswhose sequence is 100% conserved between O. mossambicus and O.niloticus using the O. niloticus proteome as a reference. Hence, accessionnumbers are I3JGL5 for IMPA1.1 and I3IXX3 for MIPS. Columns shown inblack indicate a significant increase in protein abundance under hyper-osmotic conditions (Benjamini–Hochberg adjusted P < 0.01). White col-umns indicate no significant effect of hyperosmolality (P > 0.05). (A and B)The increase in the abundance of IMPA1.1 and MIPS proteins after 72 hhyperosmolality did not differ in untransfected OmB cells (A) and trans-fected OmB cells (B). (C and D) In addition, both proteins were up-regulated after 24 h of hyperosmotic stress in the absence of actinomy-cin D (C ), whereas the hyperosmotic up-regulation was completelyinhibited by 10 μM actinomycin D (D). Data shown are means ± SEM, n = 5.Quantitative data and spectral libraries are accessible at Panorama public(https://panoramaweb.org/labkey/XW2016-1.url).
E2730 | www.pnas.org/cgi/doi/10.1073/pnas.1614712114 Wang and Kültz
Dow
nloa
ded
by g
uest
on
Apr
il 21
, 202
0
up-regulation of MIPS and IMPA1.1, we compared the abun-dance of these proteins in transfected and nontransfected OmBcells grown for 72 h in isosmotic (315 mOsmol/kg) and hyper-osmotic (650 mOsmol/kg) media. Targeted protein quantita-tion by sequential window acquisition of all theoretical fragmention spectra (SWATH)-MS and Skyline analysis confirmed sig-nificant (P < 0.01) increases in IMPA1.1 and MIPS that wereindependent of the transfection procedure (Fig. 1 A and B). Themechanism of up-regulation of MIPS and IMPA1.1 was de-termined to be transcriptional using actinomycin D as a tran-scription inhibitor. For this purpose, cells were exposed tohyperosmolality (650 mOsmol/kg) for only 24 h because 48-h (andlonger) exposure in the presence of actinomycin D was lethalfor the majority of cells (Fig. S3). A significant (P < 0.01) in-crease in IMPA1.1 and MIPS protein abundance was also evi-dent after 24-h exposure to 650 mOsmol/kg hyperosmolality,albeit at lesser magnitude than after 3 d (8.2 ± 0.2-fold forIMPA1.1 and 4.1 ± 0.1-fold for MIPS) (Fig. 1C). However, whentranscription was inhibited by addition of actinomycin D, thehyperosmotic induction of both proteins was completely abolished(P > 0.05) (Fig. 1D). All data and metadata for SWATH-MS/Skyline targeted quantitation are available at Panorama Public(https://panoramaweb.org/labkey/XW2016-1.url).
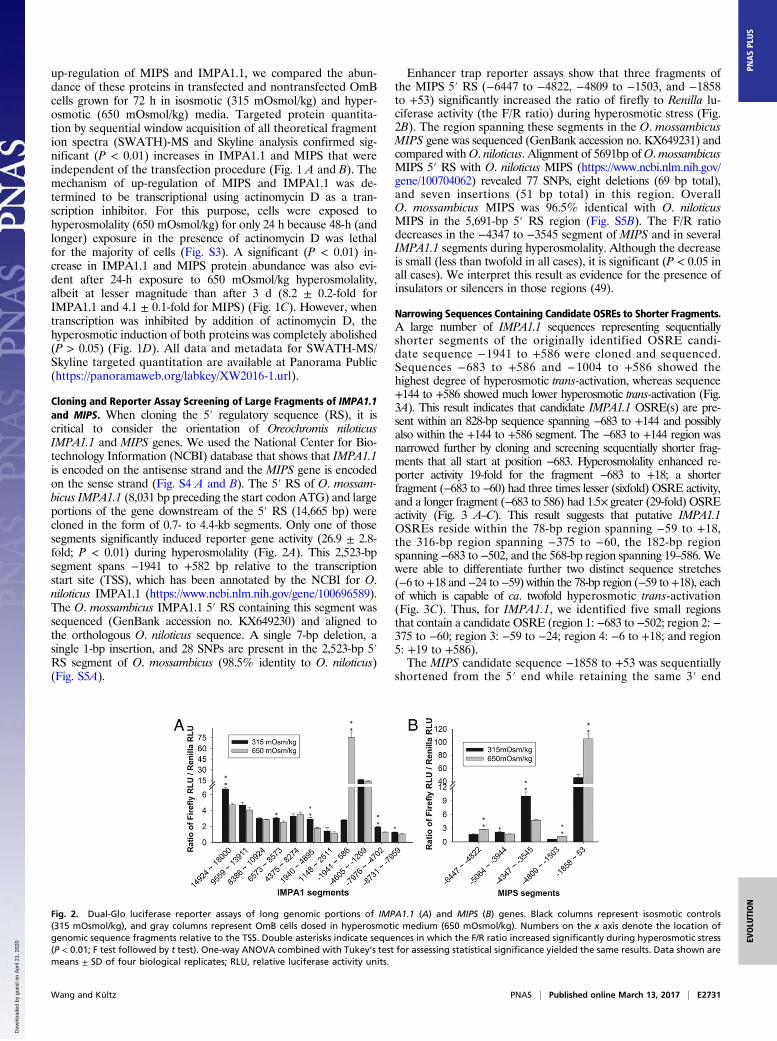
Cloning and Reporter Assay Screening of Large Fragments of IMPA1.1and MIPS. When cloning the 5′ regulatory sequence (RS), it iscritical to consider the orientation of Oreochromis niloticusIMPA1.1 and MIPS genes. We used the National Center for Bio-technology Information (NCBI) database that shows that IMPA1.1is encoded on the antisense strand and the MIPS gene is encodedon the sense strand (Fig. S4 A and B). The 5′ RS of O. mossam-bicus IMPA1.1 (8,031 bp preceding the start codon ATG) and largeportions of the gene downstream of the 5′ RS (14,665 bp) werecloned in the form of 0.7- to 4.4-kb segments. Only one of thosesegments significantly induced reporter gene activity (26.9 ± 2.8-fold; P < 0.01) during hyperosmolality (Fig. 2A). This 2,523-bpsegment spans −1941 to +582 bp relative to the transcriptionstart site (TSS), which has been annotated by the NCBI for O.niloticus IMPA1.1 (https://www.ncbi.nlm.nih.gov/gene/100696589).The O. mossambicus IMPA1.1 5′ RS containing this segment wassequenced (GenBank accession no. KX649230) and aligned tothe orthologous O. niloticus sequence. A single 7-bp deletion, asingle 1-bp insertion, and 28 SNPs are present in the 2,523-bp 5′RS segment of O. mossambicus (98.5% identity to O. niloticus)(Fig. S5A).
Enhancer trap reporter assays show that three fragments ofthe MIPS 5′ RS (−6447 to −4822, −4809 to −1503, and −1858to +53) significantly increased the ratio of firefly to Renilla lu-ciferase activity (the F/R ratio) during hyperosmotic stress (Fig.2B). The region spanning these segments in the O. mossambicusMIPS gene was sequenced (GenBank accession no. KX649231) andcompared withO. niloticus. Alignment of 5691bp ofO.mossambicusMIPS 5′ RS with O. niloticus MIPS (https://www.ncbi.nlm.nih.gov/gene/100704062) revealed 77 SNPs, eight deletions (69 bp total),and seven insertions (51 bp total) in this region. OverallO. mossambicus MIPS was 96.5% identical with O. niloticusMIPS in the 5,691-bp 5′ RS region (Fig. S5B). The F/R ratiodecreases in the −4347 to −3545 segment of MIPS and in severalIMPA1.1 segments during hyperosmolality. Although the decreaseis small (less than twofold in all cases), it is significant (P < 0.05 inall cases). We interpret this result as evidence for the presence ofinsulators or silencers in those regions (49).
Narrowing Sequences Containing Candidate OSREs to Shorter Fragments.A large number of IMPA1.1 sequences representing sequentiallyshorter segments of the originally identified OSRE candi-date sequence −1941 to +586 were cloned and sequenced.Sequences −683 to +586 and −1004 to +586 showed thehighest degree of hyperosmotic trans-activation, whereas sequence+144 to +586 showed much lower hyperosmotic trans-activation (Fig.3A). This result indicates that candidate IMPA1.1 OSRE(s) are pre-sent within an 828-bp sequence spanning −683 to +144 and possiblyalso within the +144 to +586 segment. The −683 to +144 region wasnarrowed further by cloning and screening sequentially shorter frag-ments that all start at position −683. Hyperosmolality enhanced re-porter activity 19-fold for the fragment −683 to +18; a shorterfragment (−683 to −60) had three times lesser (sixfold) OSRE activity,and a longer fragment (−683 to 586) had 1.5× greater (29-fold) OSREactivity (Fig. 3 A–C). This result suggests that putative IMPA1.1OSREs reside within the 78-bp region spanning −59 to +18,the 316-bp region spanning −375 to −60, the 182-bp regionspanning −683 to −502, and the 568-bp region spanning 19–586. Wewere able to differentiate further two distinct sequence stretches(−6 to+18 and−24 to−59) within the 78-bp region (−59 to+18), eachof which is capable of ca. twofold hyperosmotic trans-activation(Fig. 3C). Thus, for IMPA1.1, we identified five small regionsthat contain a candidate OSRE (region 1: −683 to −502; region 2: −375 to −60; region 3: −59 to −24; region 4: −6 to +18; and region5: +19 to +586).The MIPS candidate sequence −1858 to +53 was sequentially
shortened from the 5′ end while retaining the same 3′ end
Fig. 2. Dual-Glo luciferase reporter assays of long genomic portions of IMPA1.1 (A) and MIPS (B) genes. Black columns represent isosmotic controls(315 mOsmol/kg), and gray columns represent OmB cells dosed in hyperosmotic medium (650 mOsmol/kg). Numbers on the x axis denote the location ofgenomic sequence fragments relative to the TSS. Double asterisks indicate sequences in which the F/R ratio increased significantly during hyperosmotic stress(P < 0.01; F test followed by t test). One-way ANOVA combined with Tukey’s test for assessing statistical significance yielded the same results. Data shown aremeans ± SD of four biological replicates; RLU, relative luciferase activity units.
Wang and Kültz PNAS | Published online March 13, 2017 | E2731
EVOLU
TION
PNASPL
US
Dow
nloa
ded
by g
uest
on
Apr
il 21
, 202
0
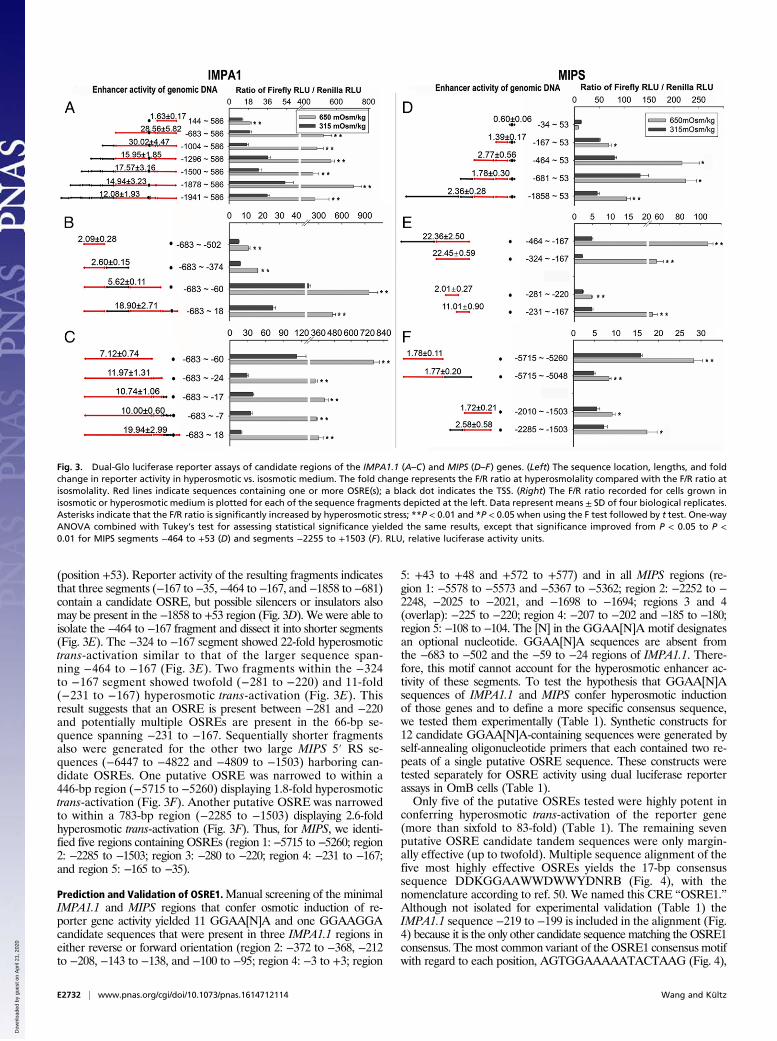
(position +53). Reporter activity of the resulting fragments indicatesthat three segments (−167 to−35, −464 to−167, and −1858 to −681)contain a candidate OSRE, but possible silencers or insulators alsomay be present in the −1858 to +53 region (Fig. 3D). We were able toisolate the −464 to −167 fragment and dissect it into shorter segments(Fig. 3E). The −324 to −167 segment showed 22-fold hyperosmotictrans-activation similar to that of the larger sequence span-ning −464 to −167 (Fig. 3E). Two fragments within the −324to −167 segment showed twofold (−281 to −220) and 11-fold(−231 to −167) hyperosmotic trans-activation (Fig. 3E). Thisresult suggests that an OSRE is present between −281 and −220and potentially multiple OSREs are present in the 66-bp se-quence spanning −231 to −167. Sequentially shorter fragmentsalso were generated for the other two large MIPS 5′ RS se-quences (−6447 to −4822 and −4809 to −1503) harboring can-didate OSREs. One putative OSRE was narrowed to within a446-bp region (−5715 to −5260) displaying 1.8-fold hyperosmotictrans-activation (Fig. 3F). Another putative OSRE was narrowedto within a 783-bp region (−2285 to −1503) displaying 2.6-foldhyperosmotic trans-activation (Fig. 3F). Thus, for MIPS, we identi-fied five regions containing OSREs (region 1: −5715 to −5260; region2: −2285 to −1503; region 3: −280 to −220; region 4: −231 to −167;and region 5: −165 to −35).
Prediction and Validation of OSRE1.Manual screening of the minimalIMPA1.1 and MIPS regions that confer osmotic induction of re-porter gene activity yielded 11 GGAA[N]A and one GGAAGGAcandidate sequences that were present in three IMPA1.1 regions ineither reverse or forward orientation (region 2: −372 to −368, −212to −208, −143 to −138, and −100 to −95; region 4: −3 to +3; region
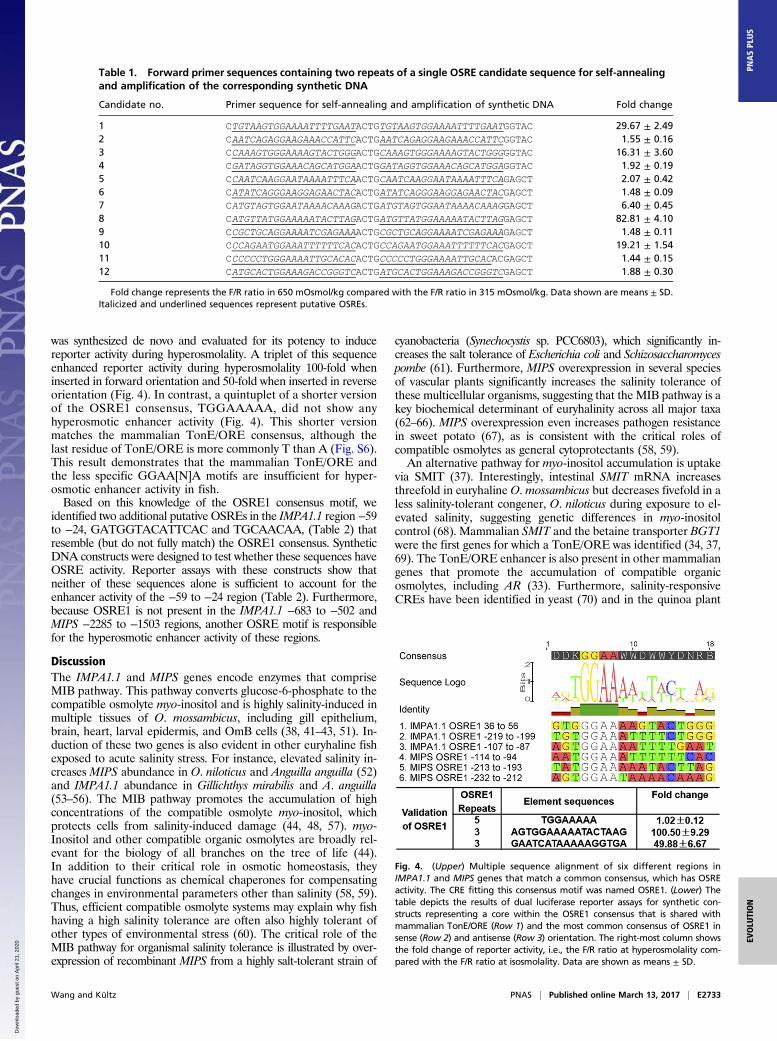
5: +43 to +48 and +572 to +577) and in all MIPS regions (re-gion 1: −5578 to −5573 and −5367 to −5362; region 2: −2252 to −2248, −2025 to −2021, and −1698 to −1694; regions 3 and 4(overlap): −225 to −220; region 4: −207 to −202 and −185 to −180;region 5: −108 to −104. The [N] in the GGAA[N]A motif designatesan optional nucleotide. GGAA[N]A sequences are absent fromthe −683 to −502 and the −59 to −24 regions of IMPA1.1. There-fore, this motif cannot account for the hyperosmotic enhancer ac-tivity of these segments. To test the hypothesis that GGAA[N]Asequences of IMPA1.1 and MIPS confer hyperosmotic inductionof those genes and to define a more specific consensus sequence,we tested them experimentally (Table 1). Synthetic constructs for12 candidate GGAA[N]A-containing sequences were generated byself-annealing oligonucleotide primers that each contained two re-peats of a single putative OSRE sequence. These constructs weretested separately for OSRE activity using dual luciferase reporterassays in OmB cells (Table 1).Only five of the putative OSREs tested were highly potent in
conferring hyperosmotic trans-activation of the reporter gene(more than sixfold to 83-fold) (Table 1). The remaining sevenputative OSRE candidate tandem sequences were only margin-ally effective (up to twofold). Multiple sequence alignment of thefive most highly effective OSREs yields the 17-bp consensussequence DDKGGAAWWDWWYDNRB (Fig. 4), with thenomenclature according to ref. 50. We named this CRE “OSRE1.”Although not isolated for experimental validation (Table 1) theIMPA1.1 sequence −219 to −199 is included in the alignment (Fig.4) because it is the only other candidate sequencematching the OSRE1consensus. The most common variant of the OSRE1 consensus motifwith regard to each position, AGTGGAAAAATACTAAG (Fig. 4),
Fig. 3. Dual-Glo luciferase reporter assays of candidate regions of the IMPA1.1 (A–C) and MIPS (D–F) genes. (Left) The sequence location, lengths, and foldchange in reporter activity in hyperosmotic vs. isosmotic medium. The fold change represents the F/R ratio at hyperosmolality compared with the F/R ratio atisosmolality. Red lines indicate sequences containing one or more OSRE(s); a black dot indicates the TSS. (Right) The F/R ratio recorded for cells grown inisosmotic or hyperosmotic medium is plotted for each of the sequence fragments depicted at the left. Data represent means ± SD of four biological replicates.Asterisks indicate that the F/R ratio is significantly increased by hyperosmotic stress; **P < 0.01 and *P < 0.05 when using the F test followed by t test. One-wayANOVA combined with Tukey’s test for assessing statistical significance yielded the same results, except that significance improved from P < 0.05 to P <0.01 for MIPS segments −464 to +53 (D) and segments −2255 to +1503 (F). RLU, relative luciferase activity units.
E2732 | www.pnas.org/cgi/doi/10.1073/pnas.1614712114 Wang and Kültz
Dow
nloa
ded
by g
uest
on
Apr
il 21
, 202
0
was synthesized de novo and evaluated for its potency to inducereporter activity during hyperosmolality. A triplet of this sequenceenhanced reporter activity during hyperosmolality 100-fold wheninserted in forward orientation and 50-fold when inserted in reverseorientation (Fig. 4). In contrast, a quintuplet of a shorter versionof the OSRE1 consensus, TGGAAAAA, did not show anyhyperosmotic enhancer activity (Fig. 4). This shorter versionmatches the mammalian TonE/ORE consensus, although thelast residue of TonE/ORE is more commonly T than A (Fig. S6).This result demonstrates that the mammalian TonE/ORE andthe less specific GGAA[N]A motifs are insufficient for hyper-osmotic enhancer activity in fish.Based on this knowledge of the OSRE1 consensus motif, we
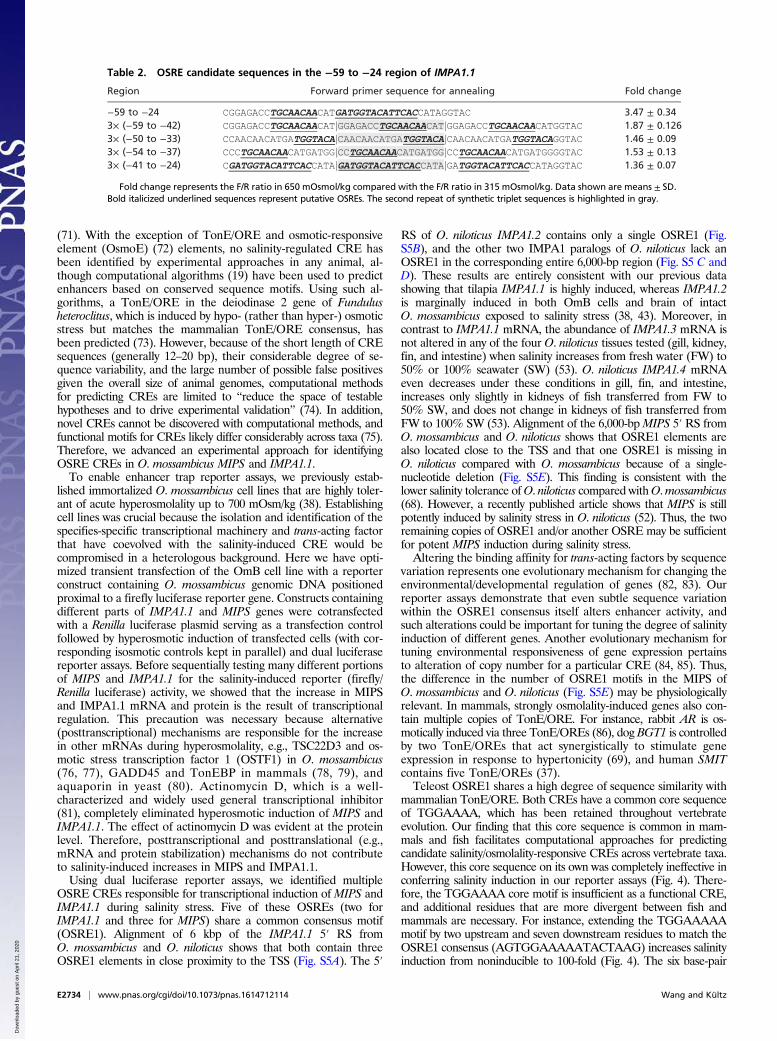
identified two additional putative OSREs in the IMPA1.1 region −59to −24, GATGGTACATTCAC and TGCAACAA, (Table 2) thatresemble (but do not fully match) the OSRE1 consensus. SyntheticDNA constructs were designed to test whether these sequences haveOSRE activity. Reporter assays with these constructs show thatneither of these sequences alone is sufficient to account for theenhancer activity of the −59 to −24 region (Table 2). Furthermore,because OSRE1 is not present in the IMPA1.1 −683 to −502 andMIPS −2285 to −1503 regions, another OSRE motif is responsiblefor the hyperosmotic enhancer activity of these regions.
DiscussionThe IMPA1.1 and MIPS genes encode enzymes that compriseMIB pathway. This pathway converts glucose-6-phosphate to thecompatible osmolyte myo-inositol and is highly salinity-induced inmultiple tissues of O. mossambicus, including gill epithelium,brain, heart, larval epidermis, and OmB cells (38, 41–43, 51). In-duction of these two genes is also evident in other euryhaline fishexposed to acute salinity stress. For instance, elevated salinity in-creases MIPS abundance in O. niloticus and Anguilla anguilla (52)and IMPA1.1 abundance in Gillichthys mirabilis and A. anguilla(53–56). The MIB pathway promotes the accumulation of highconcentrations of the compatible osmolyte myo-inositol, whichprotects cells from salinity-induced damage (44, 48, 57). myo-Inositol and other compatible organic osmolytes are broadly rel-evant for the biology of all branches on the tree of life (44).In addition to their critical role in osmotic homeostasis, theyhave crucial functions as chemical chaperones for compensatingchanges in environmental parameters other than salinity (58, 59).Thus, efficient compatible osmolyte systems may explain why fishhaving a high salinity tolerance are often also highly tolerant ofother types of environmental stress (60). The critical role of theMIB pathway for organismal salinity tolerance is illustrated by over-expression of recombinant MIPS from a highly salt-tolerant strain of
cyanobacteria (Synechocystis sp. PCC6803), which significantly in-creases the salt tolerance of Escherichia coli and Schizosaccharomycespombe (61). Furthermore, MIPS overexpression in several speciesof vascular plants significantly increases the salinity tolerance ofthese multicellular organisms, suggesting that theMIB pathway is akey biochemical determinant of euryhalinity across all major taxa(62–66). MIPS overexpression even increases pathogen resistancein sweet potato (67), as is consistent with the critical roles ofcompatible osmolytes as general cytoprotectants (58, 59).An alternative pathway for myo-inositol accumulation is uptake
via SMIT (37). Interestingly, intestinal SMIT mRNA increasesthreefold in euryhaline O. mossambicus but decreases fivefold in aless salinity-tolerant congener, O. niloticus during exposure to el-evated salinity, suggesting genetic differences in myo-inositolcontrol (68). Mammalian SMIT and the betaine transporter BGT1were the first genes for which a TonE/ORE was identified (34, 37,69). The TonE/ORE enhancer is also present in other mammaliangenes that promote the accumulation of compatible organicosmolytes, including AR (33). Furthermore, salinity-responsiveCREs have been identified in yeast (70) and in the quinoa plant
Fig. 4. (Upper) Multiple sequence alignment of six different regions inIMPA1.1 and MIPS genes that match a common consensus, which has OSREactivity. The CRE fitting this consensus motif was named OSRE1. (Lower) Thetable depicts the results of dual luciferase reporter assays for synthetic con-structs representing a core within the OSRE1 consensus that is shared withmammalian TonE/ORE (Row 1) and the most common consensus of OSRE1 insense (Row 2) and antisense (Row 3) orientation. The right-most column showsthe fold change of reporter activity, i.e., the F/R ratio at hyperosmolality com-pared with the F/R ratio at isosmolality. Data are shown as means ± SD.
Table 1. Forward primer sequences containing two repeats of a single OSRE candidate sequence for self-annealingand amplification of the corresponding synthetic DNA
Candidate no. Primer sequence for self-annealing and amplification of synthetic DNA Fold change
1 CTGTAAGTGGAAAATTTTGAATACTGTGTAAGTGGAAAATTTTGAATGGTAC 29.67 ± 2.492 CAATCAGAGGAAGAAACCATTCACTGAATCAGAGGAAGAAACCATTCGGTAC 1.55 ± 0.163 CCAAAGTGGGAAAAGTACTGGGACTGCAAAGTGGGAAAAGTACTGGGGGTAC 16.31 ± 3.604 CGATAGGTGGAAACAGCATGGAACTGGATAGGTGGAAACAGCATGGAGGTAC 1.92 ± 0.195 CCAATCAAGGAATAAAATTTCAACTGCAATCAAGGAATAAAATTTCAGAGCT 2.07 ± 0.426 CATATCAGGGAAGGAGAACTACACTGATATCAGGGAAGGAGAACTACGAGCT 1.48 ± 0.097 CATGTAGTGGAATAAAACAAAGACTGATGTAGTGGAATAAAACAAAGGAGCT 6.40 ± 0.458 CATGTTATGGAAAAATACTTAGACTGATGTTATGGAAAAATACTTAGGAGCT 82.81 ± 4.109 CCGCTGCAGGAAAATCGAGAAAACTGCGCTGCAGGAAAATCGAGAAAGAGCT 1.48 ± 0.1110 CCCAGAATGGAAATTTTTTCACACTGCCAGAATGGAAATTTTTTCACGAGCT 19.21 ± 1.5411 CCCCCCTGGGAAAATTGCACACACTGCCCCCTGGGAAAATTGCACACGAGCT 1.44 ± 0.1512 CATGCACTGGAAAGACCGGGTCACTGATGCACTGGAAAGACCGGGTCGAGCT 1.88 ± 0.30
Fold change represents the F/R ratio in 650 mOsmol/kg compared with the F/R ratio in 315 mOsmol/kg. Data shown are means ± SD.Italicized and underlined sequences represent putative OSREs.
Wang and Kültz PNAS | Published online March 13, 2017 | E2733
EVOLU
TION
PNASPL
US
Dow
nloa
ded
by g
uest
on
Apr
il 21
, 202
0
(71). With the exception of TonE/ORE and osmotic-responsiveelement (OsmoE) (72) elements, no salinity-regulated CRE hasbeen identified by experimental approaches in any animal, al-though computational algorithms (19) have been used to predictenhancers based on conserved sequence motifs. Using such al-gorithms, a TonE/ORE in the deiodinase 2 gene of Fundulusheteroclitus, which is induced by hypo- (rather than hyper-) osmoticstress but matches the mammalian TonE/ORE consensus, hasbeen predicted (73). However, because of the short length of CREsequences (generally 12–20 bp), their considerable degree of se-quence variability, and the large number of possible false positivesgiven the overall size of animal genomes, computational methodsfor predicting CREs are limited to “reduce the space of testablehypotheses and to drive experimental validation” (74). In addition,novel CREs cannot be discovered with computational methods, andfunctional motifs for CREs likely differ considerably across taxa (75).Therefore, we advanced an experimental approach for identifyingOSRE CREs in O. mossambicus MIPS and IMPA1.1.To enable enhancer trap reporter assays, we previously estab-
lished immortalized O. mossambicus cell lines that are highly toler-ant of acute hyperosmolality up to 700 mOsm/kg (38). Establishingcell lines was crucial because the isolation and identification of thespecifies-specific transcriptional machinery and trans-acting factorthat have coevolved with the salinity-induced CRE would becompromised in a heterologous background. Here we have opti-mized transient transfection of the OmB cell line with a reporterconstruct containing O. mossambicus genomic DNA positionedproximal to a firefly luciferase reporter gene. Constructs containingdifferent parts of IMPA1.1 and MIPS genes were cotransfectedwith a Renilla luciferase plasmid serving as a transfection controlfollowed by hyperosmotic induction of transfected cells (with cor-responding isosmotic controls kept in parallel) and dual luciferasereporter assays. Before sequentially testing many different portionsof MIPS and IMPA1.1 for the salinity-induced reporter (firefly/Renilla luciferase) activity, we showed that the increase in MIPSand IMPA1.1 mRNA and protein is the result of transcriptionalregulation. This precaution was necessary because alternative(posttranscriptional) mechanisms are responsible for the increasein other mRNAs during hyperosmolality, e.g., TSC22D3 and os-motic stress transcription factor 1 (OSTF1) in O. mossambicus(76, 77), GADD45 and TonEBP in mammals (78, 79), andaquaporin in yeast (80). Actinomycin D, which is a well-characterized and widely used general transcriptional inhibitor(81), completely eliminated hyperosmotic induction of MIPS andIMPA1.1. The effect of actinomycin D was evident at the proteinlevel. Therefore, posttranscriptional and posttranslational (e.g.,mRNA and protein stabilization) mechanisms do not contributeto salinity-induced increases in MIPS and IMPA1.1.Using dual luciferase reporter assays, we identified multiple
OSRE CREs responsible for transcriptional induction of MIPS andIMPA1.1 during salinity stress. Five of these OSREs (two forIMPA1.1 and three for MIPS) share a common consensus motif(OSRE1). Alignment of 6 kbp of the IMPA1.1 5′ RS fromO. mossambicus and O. niloticus shows that both contain threeOSRE1 elements in close proximity to the TSS (Fig. S5A). The 5′
RS of O. niloticus IMPA1.2 contains only a single OSRE1 (Fig.S5B), and the other two IMPA1 paralogs of O. niloticus lack anOSRE1 in the corresponding entire 6,000-bp region (Fig. S5 C andD). These results are entirely consistent with our previous datashowing that tilapia IMPA1.1 is highly induced, whereas IMPA1.2is marginally induced in both OmB cells and brain of intactO. mossambicus exposed to salinity stress (38, 43). Moreover, incontrast to IMPA1.1 mRNA, the abundance of IMPA1.3 mRNA isnot altered in any of the four O. niloticus tissues tested (gill, kidney,fin, and intestine) when salinity increases from fresh water (FW) to50% or 100% seawater (SW) (53). O. niloticus IMPA1.4 mRNAeven decreases under these conditions in gill, fin, and intestine,increases only slightly in kidneys of fish transferred from FW to50% SW, and does not change in kidneys of fish transferred fromFW to 100% SW (53). Alignment of the 6,000-bpMIPS 5′ RS fromO. mossambicus and O. niloticus shows that OSRE1 elements arealso located close to the TSS and that one OSRE1 is missing inO. niloticus compared with O. mossambicus because of a single-nucleotide deletion (Fig. S5E). This finding is consistent with thelower salinity tolerance ofO. niloticus compared withO.mossambicus(68). However, a recently published article shows that MIPS is stillpotently induced by salinity stress in O. niloticus (52). Thus, the tworemaining copies of OSRE1 and/or another OSRE may be sufficientfor potent MIPS induction during salinity stress.Altering the binding affinity for trans-acting factors by sequence
variation represents one evolutionary mechanism for changing theenvironmental/developmental regulation of genes (82, 83). Ourreporter assays demonstrate that even subtle sequence variationwithin the OSRE1 consensus itself alters enhancer activity, andsuch alterations could be important for tuning the degree of salinityinduction of different genes. Another evolutionary mechanism fortuning environmental responsiveness of gene expression pertainsto alteration of copy number for a particular CRE (84, 85). Thus,the difference in the number of OSRE1 motifs in the MIPS ofO. mossambicus and O. niloticus (Fig. S5E) may be physiologicallyrelevant. In mammals, strongly osmolality-induced genes also con-tain multiple copies of TonE/ORE. For instance, rabbit AR is os-motically induced via three TonE/OREs (86), dog BGT1 is controlledby two TonE/OREs that act synergistically to stimulate geneexpression in response to hypertonicity (69), and human SMITcontains five TonE/OREs (37).Teleost OSRE1 shares a high degree of sequence similarity with
mammalian TonE/ORE. Both CREs have a common core sequenceof TGGAAAA, which has been retained throughout vertebrateevolution. Our finding that this core sequence is common in mam-mals and fish facilitates computational approaches for predictingcandidate salinity/osmolality-responsive CREs across vertebrate taxa.However, this core sequence on its own was completely ineffective inconferring salinity induction in our reporter assays (Fig. 4). There-fore, the TGGAAAA core motif is insufficient as a functional CRE,and additional residues that are more divergent between fish andmammals are necessary. For instance, extending the TGGAAAAAmotif by two upstream and seven downstream residues to match theOSRE1 consensus (AGTGGAAAAATACTAAG) increases salinityinduction from noninducible to 100-fold (Fig. 4). The six base-pair
Table 2. OSRE candidate sequences in the −59 to −24 region of IMPA1.1
Fold change represents the F/R ratio in 650 mOsmol/kg compared with the F/R ratio in 315 mOsmol/kg. Data shown are means ± SD.Bold italicized underlined sequences represent putative OSREs. The second repeat of synthetic triplet sequences is highlighted in gray.
E2734 | www.pnas.org/cgi/doi/10.1073/pnas.1614712114 Wang and Kültz
Dow
nloa
ded
by g
uest
on
Apr
il 21
, 202
0
GGAAAA core of mammalian TonE/ORE alone also is not suffi-cient for conferring hyperosmotic responsiveness to gene expressionin mammals (86). We conclude that the less conserved regionsflanking the vertebrate GGAAWW core motif are inextricably linkedto the functionality of these CREs and that coevolution of theseflanking regions with the corresponding transcription factors mayhave occurred in vertebrates.Bioinformatics identification of motifs that match the OSRE1
consensus in the −2500 to +50 region of MIPS from other fishesreveals that species closely related to O. niloticus (Astatotilapiaburtoni, Pundamilia nyererei, and Maylandia zebra) also have twoOSRE1 motifs inMIPS, one less than O.mossambicus. The salinitytolerance of these African cichlids is uncertain, but they are all ofFW origin. If they are stenohaline, it is possible that silencer orinsulator sequences in MIPS or the responsiveness of other es-sential osmoprotective genes is altered in these species. Of interest,some euryhaline Poecilia species also have two OSRE1 motifs, andseveral other euryhaline teleosts have one OSRE1 motif in thisregion of MIPS (Table S1). Although the comparison of stenoha-line and euryhaline species in Table S1 is not comprehensive, it isintriguing that OSRE1 motifs were not found in any of the sevenstenohaline species analyzed. Moreover, a MIPS gene is absentfrom the genome of stenohaline zebrafish (Danio rerio), suggestinglack of selective forces that favor its retention. However, OSRE1motifs also are absent from MIPS of several euryhaline fishes(Table S1). Given the large phylogenetic distance between differ-ent orders of fish and the lack of strong conservation betweenmammalian TonE/ORE and tilapia OSRE1, it is likely that theseCREs have coevolved with the corresponding transcription factorduring the 500-My evolution of vertebrates.The transcription factor that binds to mammalian TonE/ORE
has been identified and named “TonE-binding protein” (TonEBP);it is identical to a protein named “nuclear factor of activated T cells5” (NFAT5) (69, 87). NFAT5 is a transcription factor of the Relfamily, which includes NF-κB. Mammalian NFAT5 is regulatedbidirectionally by osmolality: It is activated by hyperosmolality andinhibited by hypo-osmolality (88). Multiple mechanisms controlNFAT5 activity during osmotic stress, including changes in phos-phorylation (89, 90), nuclear localization (90, 91), trans-activation(92, 93), abundance (88), and sumoylation (94). In most vertebrates,including teleosts and mammals, NFAT5 is encoded by manyparalogous isoforms. At least six NFAT5 isoforms are encodedin the O. niloticus genome (NCBI accession nos. XP_005467085,XP_005467086, XP_005467087, XP_005467088, XP_005467089,XP_005467090). Whether any of those fish NFAT5 proteinscontrol transcription via OSRE1 binding remains to be investi-gated. Nevertheless, because of the GGAAWW core motifshared by OSRE1 and TonE/ORE, NFAT5 isoforms representprime candidates for trans-acting factors that bind to OSRE1 andcontrol its enhancer activity.Another candidate protein for trans-activation of OSRE1 is
OSTF1. OSTF1 was first identified as a salinity-induced protein inO. mossambicus gills and is orthologous to mammalian TSC22D3(76, 77, 95). OSTF1 abundance also increases in other euryhalineteleosts during hyperosmotic stress (96–102). In addition to changesin mRNA abundance, phosphorylation (103) and alteration oftranslational preference via microRNA miR-429 (104) have beenidentified as mechanisms for osmotic regulation of OSTF1. Al-though OSRE1 clearly accounts for most of the salinity-inducedtrans-activation ofMIPS and IMPA1.1, our results also suggest thatmore than one type of CRE is responsible for conferring hyper-osmotic induction of the IMPA1.1 and MIPS genes. Both genescontain multiple OSRE1 motifs but also contain other sequencesthat do not match or even resemble the OSRE1 consensus butdisplay robust OSRE activity (regions −59 to −24 and −683 to −502in IMPA1.1 and −2285 to −1503 in MIPS). Thus, at least one othertrans factor, in addition to the putative OSRE1-binding protein,is likely to contribute to the salinity-induced expression of MIB
pathway genes in euryhaline fish. In fact, the presence of multipledifferent enhancers with additive effects on gene regulationrepresents another evolutionary mechanism by which the en-vironmental control of gene expression can be tuned (105, 106).Such a mechanism has been demonstrated for the mammalianNa+/H+ exchanger (NHE2) gene, which is osmotically inducedvia OsmoE (GGGCCAGTTGGCGCTGGG) and TonE/ORE(GCTGGAAAACCGA) enhancers (72).Tandem repeats of OSRE1 sequences identified in MIPS and
IMPA1.1 were capable of very strong hyperosmotic reporter genetrans-activation (more than sixfold to 83-fold). In the reporter as-says, some longer sequences showed lower hyperosmotic inductionof trans-activation than the corresponding shorter sequences, al-though both contained the same number of OSRE1 elements. Forinstance, the −1004 to 586 fragment of IMPA1.1 showed 30-foldinduction of trans-activation, whereas the larger −1296 to 586 frag-ment only showed 16-fold hyperosmotic induction of trans-activation.We interpret such unexpected differences as evidence for the pres-ence of additional regulatory elements (e.g., silencers, repressors, orinsulators) in the longer fragment (23, 49, 107). The statistical like-lihood that such additional elements are present increases with thedistance of OSRE elements from the TSS. The OSRE1 elementsidentified in MIPS and IMPA1.1 are all located in relatively closeproximity to the TSS, and this location is consistent with the locationof TonE/ORE elements in mammalian BGT1 and AR genes (69,86). Of interest, one OSRE1 element of IMPA1.1 is located down-stream of the TSS. However, this OSRE1 is still in very closeproximity to the predicted TSS, and regions located 3′ of the TSShave been demonstrated to contain fully functional enhancers(108–110). The OSRE1 consensus sequence AGTGGAAAAA-TACTAAG is functional in both orientations (forward and re-verse), as is consistent with the directional independence ofother enhancers (111). However, the forward orientation is moreeffective (100-fold induction) than the reverse orientation (50-foldinduction) of this OSRE1 sequence. The reason for this differenceis currently unknown.In summary, we have identified the main CRE, OSRE1, that
enhances transcription of MIB pathway genes in euryhaline tilapiaexposed to salinity stress. The 5′ RS of both genes (MIPS andIMPA1.1) also contains at least one additional type of salinity-inducible enhancer that is distinct from OSRE1. The identificationof OSRE1 opens the way for future studies aimed at identifying thesignaling mechanisms that confer salinity responsiveness to gene-regulatory networks in fish. For instance, ChIP-sequencing usingNFAT5 and OSTF1 antibodies will allow testing of whether thesetranscription factors bind to OSRE1, and, if they do, will revealgenome-wide patterns of gene regulation via OSRE1. In addition tothis candidate approach, unbiased approaches for identifying theputative OSRE1-binding protein are now feasible, e.g., pulldownassays using bead-immobilized OSRE1 sequences and identificationof OSRE1-binding proteins by MS. Moreover, OSRE1-containingsalinity-induced genes can now be rendered unresponsive to envi-ronmental salinity by genome editing of OSRE1 enhancers in specifictarget genes via CRISPR/Cas9 (112). Such an approach will allowstudies of gene function in a specific environmental context (salinitystress) while retaining the constitutive expression of target genesunder control conditions and eliminating concerns about embryoniclethality and developmental compensation, which are commonpitfalls associated with constitutive gene knockouts in transgenicanimals (113). In combination with revealing relevant insulators,repressors, and silencers in osmoregulated genes, future studiesenabled by OSRE1 identification will propel our understanding ofosmosensory signaling networks in euryhaline fish.
Materials and MethodsCell Culture. The OmB cell line was used in this study (38). Passage 11 (P11)OmB cells were thawed and maintained in L-15 medium containing 10% (vol/vol)FBS and 100 U/mL penicillin-streptomycin at 26 °C and 2% (vol/vol) CO2. Cells were
Wang and Kültz PNAS | Published online March 13, 2017 | E2735
EVOLU
TION
PNASPL
US
Dow
nloa
ded
by g
uest
on
Apr
il 21
, 202
0
passaged every 5–7 d using a 1:6 splitting ratio (38). A large supply of OmBcell superstock (P15) was generated and used for this study. All experi-ments were conducted on cells derived from this superstock at P17–P25.Hyperosmotic mediumwas prepared by adding an appropriate amount of NaClto regular isosmotic medium, and osmolality was confirmed with a freezingpoint micro-osmometer (Advanced Instruments).
Cloning. Total DNAwas extracted fromOmB cells using the PureLink GenomicDNA mini Kit (Invitrogen). PCR primers were designed using Geneious 7.1(Biomatters) and PrimerQuest Tool (Integrated DNA Technologies) using theO. niloticus IMPA1.1 (XP_003439317) and MIPS (XP_003442861) genomic se-quences as a reference (Fig. S4). The sequence CCCCC followed by a restrictionenzyme site was added to the 5′ end of each primer. The restriction enzymesXhoI, SacI, and KpnI were chosen after screening IMPA1.1 and MIPS genes forrestriction sites. PCR Master Mix (Promega) was used to amplify fragments<2.5 kb. Platinum PCR SuperMix (Thermo Fisher Scientific) was used to amplifyfragments ranging from 2.5 to 8 kb. PCR was carried out as follows: initialdenaturation at 94 °C for 3 min followed by 27–37 cycles of 94 °C for 30 s, 60–62 °C for 30 s, 72 °C for 1–5 min, and 72 °C for 15min. Annealing and extensiontime and cycle number depended on the primers and amplicons. PCR productswere checked by agarose gel electrophoresis (Fig. S4C) and were purified usingthe PureLink PCR Purification Kit (Thermo Fisher Scientific).
Amplified fragments of the MIPS 5′ RS, IMPA1.1 5′ RS, IMPA1.1 intragenicsequence, and IMPA1.1 3′ RS were cloned into the pGL4.23 vector (NCBI ac-cession no. DQ904455.1; Promega) using XhoI, SacI, and KpnI enzymes (NewEngland Biolabs). All amplicons were double-digested with two of these threeenzymes. Restriction digests contained 35 μL purified PCR product, 4 μL buffer,and 1 μL of the first enzyme followed by 4- to 5-h incubation at 37 °C. Sub-sequently, an additional 4 μL of buffer and 1 μL of the second enzyme wereadded followed by another 4- to 5-h incubation at 37 °C. Finally, the enzymeswere inactivated by 20-min incubation at 65 °C. The pGL4.23 vector was alsodouble-digested using the same procedure except that 1 μg of vector (in MilliQwater) was used, and the final reaction volume was 20 μL for the first enzymeand 25 μL for the second enzyme. Digested inserts and vector were purified withthe PureLink PCR Purification Kit (Thermo Fisher Scientific) and were ligatedwith T4 DNA ligase (Thermo Fisher Scientific) using 1 μL of vector (5 ng/μL), 14 μLof insert (<1:20 molar ratio), 4 μL of ligase buffer, and 1 μL of T4 ligase (1 U/μL)at 14 °C for 18 h and at 65 °C for 20 min.
The high-efficiency 10-beta–competent E. coli strain (New England Biolabs)was transformed with ligated plasmids. Interestingly, JM109-competent E. coli(Promega) was incompatible with tilapia genomic DNA. Transformation con-sisted of thawing competent bacteria on ice for 5 min, adding 5 μL ligationproduct, keeping the tube on ice for 30 min, applying heat shock (42 °C) forexactly 30 s, and placing the tube on ice for another 5 min. Transformed E. colicells were propagated by the addition of 950 μL super optimal broth withcatabolite repression (SOC medium, Thermo Fisher Scientific) and incubationat 500 × g and 37 °C for 90min. Twenty microliters of this solution were spreadonto prewarmed LB-ampicillin plates, and single colonies were picked for PCRto check ligation products. For colony PCR, samples were heated at 95 °C for10 min and were quick-spun to collect any condensate. Forward and reverseprimers were designed to bind to opposite ends of the multiple cloning site inpGL4.23 using Geneious 7.1 (Biomatters). Colony PCR was performed as fol-lows: 94 °C for 3 min plus 27–37 cycles of 94 °C for 30 s, 55 °C for 30 s, 72 °C for1–5 min, and 72 °C for 15 min. Extension time and cycle number were adjustedto match amplicon size. PCR products were checked by agarose gel electro-phoresis (Fig. S4D). One or two colonies that contained correctly sized frag-ments were chosen for plasmid purification. They were inoculated into liquidLB medium and were propagated overnight, and the corresponding plasmidswere purified in sufficient quantity for transfection of OmB cells (Plasmid MiniKit; Qiagen). Endotoxin removal buffer (Qiagen) was used after the sampleneutralization step to minimize the toxicity of plasmid solutions during thetransfection of OmB cells. DNA sequences of inserts were verified for all pu-rified plasmids by Sanger sequencing at the University of California, Davis DNASequencing Facility.
Dual-Glo Luciferase Reporter Assay. We developed an enhancer trap assay forO.mossambicus genomic DNA using conspecific OmB cells. This assay consistsof a reporter vector pGL4.23 containing the genomic DNA prepared as describedabove and a control vector pGL4.73 (NCBI accession nos. DQ904455.1 andAY738229.1) (Promega). The reporter vector expresses firefly luciferase down-stream of the multiple cloning site (MCS), and the control vector constitutivelyexpresses Renilla luciferase. Both plasmids are cotransfected into OmB cellsusing conditions that were optimized using an eGFP expression plasmid(pMX229; Addgene) as an indicator of transient transfection efficiency (Fig. S1).Luciferase activity was measured in white 96-well plates with a SpectraFluor
Plus luminometer (Tecan) and a GloMax luminometer (Promega). Develop-ment of this assay for fish cells included optimization of the transfection re-agent, of the ratio of transfection reagent to reporter plasmids, of the time toassay following transfection, of the time of hyperosmolality dosing, and ofinstrument measurement time (Fig. S2). The conditions chosen represent acompromise between maximizing sustained robust induction of reporter ac-tivity during hyperosmolality and maintenance of high (>80%) OmB cell via-bility. Under these conditions technical error (noise vs. signal) is minimized,and the conditions reproduce the conditions under which IMPA1.1 and MIPSare highly induced by hyperosmolality (38). Four biological replicates (differentbatches of cells grown and treated in separate wells of a 96-well plate) wereused for controls and hyperosmotic treatments to assess the effect of eachsequence in enhancer trap reporter assays. Statistical analysis of the data wasperformed using the F test followed by a type-2 (homoscedasticity) or type-3(heteroscedasticity) t test and by one-way ANOVA followed by Tukey’s test(SPSS 19.0).
Measurement of MIPS and IMPA1.1 Protein Abundance Using SWATH-MS. Toconfirm that the osmotically responsive enhancer(s) are activated in OmB cellsunder the conditions used for reporter assays, we quantified MIPS andIMPA1.1 levels. SWATH-MS was used to quantify protein abundances of MIPSand IMPA1.1 in isosmotic and hyperosmotic media. Twenty 60-mm dishes ofOmB cells were seeded, grown to 90% confluency, and randomly divided intofour groups of five dishes each. Two of these groups were cotransfected withfirefly and Renilla luciferase plasmids, and the other two were not trans-fected (Fig. S3). One transfected and one untransfected group were exposedto hyperosmotic medium (650 mOsmol/kg) for 3 d; the other two groupswere kept in isosmotic medium (315 mOsmol/kg) for the same duration. Themedium was changed on the second day for all groups. At the end of the 3-dtreatment period, cells were washed three times with PBS having the ap-propriate osmolality, and protein was extracted from cells. Cells then weredislodged, pipetted into a 1.5-mL MCF tube, and centrifuged for 5 s at 3,540× g. Dishes were tilted, excess PBS was pipetted off, 200 μL of 10% (vol/vol)trichloroacetic acid/90% (vol/vol) acetone/0.2% DTT was added, and sampleswere incubated at −20 °C for 1 h. Protein extraction, protein assay, and in-solution trypsin digestion were performed as previously reported (114). Thespectral library used for Skyline analysis of SWATH-MS data (115) and resultsare available in Panorama public (116) at https://panoramaweb.org/labkey/XW2016-1.url.
Confirmation of Transcriptional Induction ofMIPS and IMPA1.1. Actinomycin D,which is a well-known transcriptional inhibitor (76, 77, 117), was used toconfirm that the mechanism causing an increase in abundance of MIPS andIMPA1.1 protein levels during hyperosmotic stress is transcriptional. Twenty100-mm dishes containing 100% confluent OmB cells (Fig. S3) were randomlydivided into four groups as follows: 315 mOsmol/kg without actinomycin D;315 mOsmol/kg with 10 μM actinomycin D; 650 mOsmol/kg without actino-mycin D; and 650 mOsmol/kg with 10 μM actinomycin-D. In this experimentcells were exposed to 650 mOsmol/kg hyperosmolality and isosmolality(315 mOsmol/kg, handling controls) for only 24 h. As a result, the extent ofMIPS and IMPA1.1 increase is less than with 72-h exposure. However, thiscompromise was necessary to avoid killing cells by prolonged exposure toactinomycin D while retaining a significant hyperosmotic induction of MIPSand IMPA1.1 (Fig. S3). Following dosing in hyper- or isosmotic medium, sam-ples were processed for SWATH-MS and Skyline analysis as described above.The resulting data and metadata are available at Panorama public, https://panoramaweb.org/labkey/XW2016-1.url.
Identification of OSREs for IMPA1.1 and MIPS. Large portions of genomic DNAassociated with IMPA1.1 (5′ RS, 3′ RS, and intragenic) and MIPS (5′ RS) werescreened for enhancer activity (the F/R ratio at 650 mOsmol/kg comparedwith that ratio at 315 mOsmol/kg) using the dual luciferase reporter system.The screening of genomic DNA segments started with large (kilobase-sized)pieces, the length of which was decreased sequentially. If a segment dis-played strong osmotically induced enhancer activity, it was divided intosmaller segments, which then were assayed separately. Within the resultingsmaller segments, segments with high osmotically induced enhancer activitywere selected and divided further. The resulting short sequences then wereevaluated for potential consensus motifs using Geneious 7.1 (Biomatters).Putative minimal osmotically responsive enhancer motifs predicted from thesesequences were too short for cloning and PCR. Thus, they were synthesized denovo using the oligonucleotide annealing method (Integrated DNA Technol-ogies) to assess their osmotically induced enhancer activity. Forward and re-verse PCR primers used for this purpose served as the amplicon and containedKpnI and SacI recognition sites. Two complementary primers (forward and
E2736 | www.pnas.org/cgi/doi/10.1073/pnas.1614712114 Wang and Kültz
Dow
nloa
ded
by g
uest
on
Apr
il 21
, 202
0
reverse) were dissolved in duplex buffer (Integrated DNA Technologies) andwere added to the PCR mix in equimolar amounts followed by heating at 94 °Cfor 2 min and gradual cooling. PCR was performed, and the resulting ampliconwas ligated into the reporter plasmid as described above. All synthetic se-quences containing potential OSREs were evaluated with the dual luciferasereporter system in OmB cells as described above.
ACKNOWLEDGMENTS. We thank Dr. Liqiao Chen and Dr. Erchao Li (EastChina Normal University) for their support and suggestions, and ToniN. Wiegers, Johnathon Li (University of California, Davis), and Dr. Sarah Teter(Promega) for helpful technical support. This project was supported by Na-tional Science Foundation Grant IOS-1355098 (to D.K.) and by China Scholar-ship Council Fellowship 201406140042 (to X.W.).
1. Wray NR, et al. (2013) Pitfalls of predicting complex traits from SNPs. Nat Rev Genet14(7):507–515.
2. van Wijk EM, Rintoul SR (2014) Freshening drives contraction of antarctic bottomwater in the Australian Antarctic basin. Geophys Res Lett 41(5):1657–1664.
3. Kültz D (2015) Physiological mechanisms used by fish to cope with salinity stress.J Exp Biol 218(Pt 12):1907–1914.
4. Wurts WA, Stickney RR (1989) Responses of red drum (Sciaenops ocellatus) to calciumand magnesium concentrations in fresh and salt water. Aquaculture 76(1-2):21–35.
5. Fiol DF, Kültz D (2007) Osmotic stress sensing and signaling in fishes. FEBS J 274(22):5790–5798.
6. Kültz D (2013) Osmosensing. Euryhaline Fishes. Fish Physiology, eds McCormick SD,Farrell AP, Brauner CJ (Academic Press, Oxford), Vol 32, pp 45–68.
7. Xu Z, et al. (2015) Transcriptome profiling and molecular pathway analysis of genesin association with salinity adaptation in Nile tilapia, Oreochromis niloticus. PLoSOne 10(8):e0136506.
8. Kültz D (2012) The combinatorial nature of osmosensing in fishes. Physiology(Bethesda) 27(4):259–275.
9. Stickney RR (1986) Tilapia tolerance of saline waters: A review. Prog Fish-Cult 48(3):161–167.
10. Foskett JK, Bern HA, Machen TE, Conner M (1983) Chloride cells and the hormonalcontrol of teleost fish osmoregulation. J Exp Biol 106(Sep):255–281.
11. Kültz D, Bastrop R, Jürss K, Siebers D (1992) Mitochondria-tich (MR) cells and theactivities of the Na+/K+-ATPase and carbonic anhydrase in the gill and opercularepithelium of Oreochromis mossambicus adapted to various salinities. CompBiochem Physiol B 102(2):293–301.
12. Kültz D, Jürss K, Jonas L (1995) Cellular and epithelial adjustments to altered salinityin the gill and opercular epithelium of a cichlid fish (Oreochromis mossambicus). CellTissue Res 279(1):65–73.
13. Kratochwil CF, Meyer A (2015) Closing the genotype-phenotype gap: Emergingtechnologies for evolutionary genetics in ecological model vertebrate systems.BioEssays 37(2):213–226.
14. Cotney J, et al. (2013) The evolution of lineage-specific regulatory activities in thehuman embryonic limb. Cell 154(1):185–196.
15. Cheatle Jarvela AM, Hinman VF (2015) Evolution of transcription factor function as amechanism for changing metazoan developmental gene regulatory networks.Evodevo 6(1):3.
16. Villar D, Flicek P, Odom DT (2014) Evolution of transcription factor binding inmetazoans - mechanisms and functional implications. Nat Rev Genet 15(4):221–233.
17. Dowell RD (2010) Transcription factor binding variation in the evolution of generegulation. Trends Genet 26(11):468–475.
18. Wagner GP, Lynch VJ (2008) The gene regulatory logic of transcription factor evo-lution. Trends Ecol Evol 23(7):377–385.
19. Narlikar L, Ovcharenko I (2009) Identifying regulatory elements in eukaryotic ge-nomes. Brief Funct Genomics Proteomics 8(4):215–230.
20. Balleza E, et al. (2009) Regulation by transcription factors in bacteria: Beyond de-scription. FEMS Microbiol Rev 33(1):133–151.
21. Tanay A, Regev A, Shamir R (2005) Conservation and evolvability in regulatorynetworks: The evolution of ribosomal regulation in yeast. Proc Natl Acad Sci USA102(20):7203–7208.
22. Yaragatti M, Basilico C, Dailey L (2008) Identification of active transcriptional reg-ulatory modules by the functional assay of DNA from nucleosome-free regions.Genome Res 18(6):930–938.
23. Shlyueva D, et al. (2014) Hormone-responsive enhancer-activity maps reveal pre-dictive motifs, indirect repression, and targeting of closed chromatin. Mol Cell 54(1):180–192.
24. Levitsky VG, et al. (2014) Application of experimentally verified transcriptionfactor binding sites models for computational analysis of ChIP-Seq data. BMCGenomics 15:80.
25. Pennacchio LA, Bickmore W, Dean A, Nobrega MA, Bejerano G (2013) Enhancers:Five essential questions. Nat Rev Genet 14(4):288–295.
26. Heintzman ND, et al. (2007) Distinct and predictive chromatin signatures of tran-scriptional promoters and enhancers in the human genome. Nat Genet 39(3):311–318.
27. Visel A, et al. (2009) ChIP-seq accurately predicts tissue-specific activity of enhancers.Nature 457(7231):854–858.
28. Allard STM, Kopish K (2008) Luciferase reporter assays: Powerful, adaptable tools forcell biology research. Cell Notes 21:23–26.
29. Andruska N, Mao C, Cherian M, Zhang C, Shapiro DJ (2012) Evaluation of aluciferase-based reporter assay as a screen for inhibitors of estrogen-ERα-inducedproliferation of breast cancer cells. J Biomol Screen 17(7):921–932.
30. Clément T, Salone V, Rederstorff M (2015) Dual luciferase gene reporter assays tostudy miRNA function. Methods Mol Biol 1296:187–198.
31. Rong J, et al. (2015) Cell-based high-throughput luciferase reporter gene assays foridentifying and profiling chemical modulators of endoplasmic reticulum signalingprotein IRE1. J Biomol Screen 20(10):1232–1245.
32. Zhao SS, et al. (2013) Analyzing the promoters of two CYP9A genes in the silkwormBombyx mori by dual-luciferase reporter assay. Mol Biol Rep 40(2):1701–1710.
33. Ferraris JD, et al. (1996) ORE, a eukaryotic minimal essential osmotic response ele-ment: The aldose reductase gene in hyperosmotic stress. J Biol Chem 271(31):18318–18321.
34. Takenaka M, Preston AS, Kwon HM, Handler JS (1994) The tonicity-sensitive elementthat mediates increased transcription of the betaine transporter gene in response tohypertonic stress. J Biol Chem 269(47):29379–29381.
35. Burg MB, Kwon ED, Kültz D (1997) Regulation of gene expression by hypertonicity.Annu Rev Physiol 59:437–455.
36. Ko BCB, Ruepp B, Bohren KM, Gabbay KH, Chung SSM (1997) Identification andcharacterization of multiple osmotic response sequences in the human aldose re-ductase gene. J Biol Chem 272(26):16431–16437.
37. Rim JS, et al. (1998) Transcription of the sodium/myo-inositol cotransporter gene isregulated by multiple tonicity-responsive enhancers spread over 50 kilobase pairs inthe 5′-flanking region. J Biol Chem 273(32):20615–20621.
38. Gardell AM, Qin Q, Rice RH, Li J, Kültz D (2014) Derivation and osmotolerancecharacterization of three immortalized tilapia (Oreochromis mossambicus) cell lines.PLoS One 9(5):e95919.
39. Fent K (2001) Fish cell lines as versatile tools in ecotoxicology: Assessment of cyto-toxicity, cytochrome P4501A induction potential and estrogenic activity of chemicalsand environmental samples. Toxicol In Vitro 15(4-5):477–488.
40. Mazon AdeF, Nolan DT, Lock RAC, Wendelaar Bonga SE, Fernandes MN (2007)Opercular epithelial cells: A simple approach for in vitro studies of cellular responsesin fish. Toxicology 230(1):53–63.
41. Sacchi R, Gardell AM, Chang N, Kültz D (2014) Osmotic regulation and tissue local-ization of the myo-inositol biosynthesis pathway in tilapia (Oreochromis mossam-bicus) larvae. J Exp Zool A Ecol Genet Physiol 321(8):457–466.
42. Sacchi R, Li J, Villarreal F, Gardell AM, Kültz D (2013) Salinity-induced regulation ofthemyo-inositol biosynthesis pathway in tilapia gill epithelium. J Exp Biol 216(Pt 24):4626–4638.
43. Gardell AM, et al. (2013) Tilapia (Oreochromis mossambicus) brain cells respond tohyperosmotic challenge by inducing myo-inositol biosynthesis. J Exp Biol 216(Pt 24):4615–4625.
44. Yancey PH, Clark ME, Hand SC, Bowlus RD, Somero GN (1982) Living with waterstress: Evolution of osmolyte systems. Science 217(4566):1214–1222.
45. Villarreal FD, Kültz D (2015) Direct ionic regulation of the activity of myo-inositolbiosynthesis enzymes in Mozambique tilapia. PLoS One 10(6):e0123212.
46. Arakawa T, Timasheff SN (1985) The stabilization of proteins by osmolytes. Biophys J47(3):411–414.
47. Bolen DW (2001) Protein stabilization by naturally occurring osmolytes. MethodsMol Biol 168:17–36.
48. Burg MB (1996) Coordinate regulation of organic osmolytes in renal cells. Kidney Int49(6):1684–1685.
49. Chetverina D, Aoki T, Erokhin M, Georgiev P, Schedl P (2014) Making connections:Insulators organize eukaryotic chromosomes into independent cis-regulatory net-works. BioEssays 36(2):163–172.
50. Nomenclature Committee of the International Union of Biochemistry (NC-IUB)(1985) Nomenclature for incompletely specified bases in nucleic acid sequences.Recommendations 1984. Eur J Biochem 150(1):1–5.
51. Fiol DF, Chan SY, Kültz D (2006) Identification and pathway analysis of immediatehyperosmotic stress responsive molecular mechanisms in tilapia (Oreochromis mos-sambicus) gill. Comp Biochem Physiol Part D Genomics Proteomics 1(3):344–356.
52. Kalujnaia S, Hazon N, Cramb G (2016)myo-Inositol phosphate synthase expression inthe European eel (Anguilla anguilla) and Nile tilapia (Oreochromis niloticus): Effectof seawater acclimation. Am J Physiol Regul Integr Comp Physiol 311(2):287–298.
53. Kalujnaia S, et al. (2013) Seawater acclimation and inositol monophosphatase iso-form expression in the European eel (Anguilla anguilla) and Nile tilapia (Orechromisniloticus). Am J Physiol Regul Integr Comp Physiol 305(4):R369–R384.
54. Evans TG, Somero GN (2008) A microarray-based transcriptomic time-course of hy-per- and hypo-osmotic stress signaling events in the euryhaline fish Gillichthys mir-abilis: Osmosensors to effectors. J Exp Biol 211(Pt 22):3636–3649.
55. Kalujnaia S, McVee J, Kasciukovic T, Stewart AJ, Cramb G (2010) A role for inositolmonophosphatase 1 (IMPA1) in salinity adaptation in the euryhaline eel (Anguillaanguilla). FASEB J 24(10):3981–3991.
56. Kalujnaia S, Cramb G (2009) Regulation of expression of the myo-inositol mono-phosphatase 1 gene in osmoregulatory tissues of the European eel Anguilla anguillaafter seawater acclimation. Ann N Y Acad Sci 1163:433–436.
57. Beck FX, Schmolke M, Guder WG (1992) Osmolytes. Curr Opin Nephrol Hypertens1(1):43–52.
58. Yancey PH (2005) Organic osmolytes as compatible, metabolic and counteractingcytoprotectants in high osmolarity and other stresses. J Exp Biol 208(Pt 15):2819–2830.
59. Somero GN (1986) Protons, osmolytes, and fitness of internal milieu for proteinfunction. Am J Physiol 251(2 Pt 2):R197–R213.
Wang and Kültz PNAS | Published online March 13, 2017 | E2737
EVOLU
TION
PNASPL
US
Dow
nloa
ded
by g
uest
on
Apr
il 21
, 202
0
60. Kültz D (2005) Molecular and evolutionary basis of the cellular stress response. AnnuRev Physiol 67:225–257.
61. Chatterjee A, et al. (2006) sll1981, an acetolactate synthase homologue of Syn-echocystis sp. PCC6803, functions as L-myo-inositol 1-phosphate synthase. Planta224(2):367–379.
62. Alter S, et al. (2015) DroughtDB: An expert-curated compilation of plant droughtstress genes and their homologs in nine species. Database (Oxford) 2015:bav046.
63. Kusuda H, et al. (2015) Ectopic expression of myo-inositol 3-phosphate synthaseinduces a wide range of metabolic changes and confers salt tolerance in rice. PlantSci 232:49–56.
64. Joshi R, Ramanarao MV, Baisakh N (2013) Arabidopsis plants constitutively over-expressing a myo-inositol 1-phosphate synthase gene (SaINO1) from the halophytesmooth cordgrass exhibits enhanced level of tolerance to salt stress. Plant PhysiolBiochem 65:61–66.
65. Kaur H, et al. (2013) Ectopic expression of the ABA-inducible dehydration-responsivechickpea L-myo-inositol 1-phosphate synthase 2 (CaMIPS2) in Arabidopsis enhancestolerance to salinity and dehydration stress. Planta 237(1):321–335.
66. Patra B, Ray S, Richter A, Majumder AL (2010) Enhanced salt tolerance of transgenictobacco plants by co-expression of PcINO1 and McIMT1 is accompanied by increasedlevel of myo-inositol and methylated inositol. Protoplasma 245(1-4):143–152.
67. Zhai H, et al. (2016) A myo-inositol-1-phosphate synthase gene, IbMIPS1, enhancessalt and drought tolerance and stem nematode resistance in transgenic sweet po-tato. Plant Biotechnol J 14(2):592–602.
68. Ronkin D, Seroussi E, Nitzan T, Doron-Faigenboim A, Cnaani A (2015) Intestinaltranscriptome analysis revealed differential salinity adaptation between two tila-piine species. Comp Biochem Physiol Part D Genomics Proteomics 13:35–43.
69. Miyakawa H, Rim JS, Handler JS, Kwon HM (1999) Identification of the secondtonicity-responsive enhancer for the betaine transporter (BGT1) gene. BiochimBiophys Acta 1446(3):359–364.
70. Dolz-Edo L, Rienzo A, Poveda-Huertes D, Pascual-Ahuir A, Proft M (2013) Deci-phering dynamic dose responses of natural promoters and single cis elements uponosmotic and oxidative stress in yeast. Mol Cell Biol 33(11):2228–2240.
71. Orsini F, et al. (2011) Beyond the ionic and osmotic response to salinity in Cheno-podium quinoa: Functional elements of successful halophytism. Funct Plant Biol38(10):818–831.
72. Bai L, et al. (1999) Characterization of cis-elements required for osmotic response ofrat Na(+)/H(+) exchanger-2 (NHE-2) gene. Am J Physiol 277(4 Pt 2):R1112–R1119.
73. López-Bojórquez L, Villalobos P, García-G C, Orozco A, Valverde-R C (2007) Func-tional identification of an osmotic response element (ORE) in the promoter region ofthe killifish deiodinase 2 gene (FhDio2). J Exp Biol 210(Pt 17):3126–3132.
74. Quattrone A, Dassi E (2016) Introduction to bioinformatics resources for post-transcriptional regulation of gene expression. Methods Mol Biol 1358:3–28.
75. Diao LT, et al. (2014) Conservation and divergence of transcriptional coregulationsbetween box C/D snoRNA and ribosomal protein genes in Ascomycota. RNA 20(9):1376–1385.
76. Fiol DF, Mak SK, Kültz D (2007) Specific TSC22 domain transcripts are hypertonicallyinduced and alternatively spliced to protect mouse kidney cells during osmotic stress.FEBS J 274(1):109–124.
77. Fiol DF, Chan SY, Kültz D (2006) Regulation of osmotic stress transcription factor 1(Ostf1) in tilapia (Oreochromis mossambicus) gill epithelium during salinity stress.J Exp Biol 209(Pt 16):3257–3265.
78. Chakravarty D, et al. (2002) Three GADD45 isoforms contribute to hypertonic stressphenotype of murine renal inner medullary cells. Am J Physiol Renal Physiol 283(5):F1020–F1029.
79. Cai Q, Ferraris JD, Burg MB (2005) High NaCl increases TonEBP/OREBP mRNA andprotein by stabilizing its mRNA. Am J Physiol Renal Physiol 289(4):F803–F807.
80. Leitch V, Agre P, King LS (2001) Altered ubiquitination and stability of aquaporin-1in hypertonic stress. Proc Natl Acad Sci USA 98(5):2894–2898.
81. Bensaude O (2011) Inhibiting eukaryotic transcription: Which compound to choose?How to evaluate its activity? Transcription 2(3):103–108.
82. Tümpel S, Cambronero F, Wiedemann LM, Krumlauf R (2006) Evolution of cis ele-ments in the differential expression of two Hoxa2 coparalogous genes in pufferfish(Takifugu rubripes). Proc Natl Acad Sci USA 103(14):5419–5424.
83. Mukherjee R, Evans P, Singh LN, Hannenhalli S (2013) Correlated evolution of po-sitions within mammalian cis elements. PLoS One 8(2):e55521.
84. Richards S, et al. (2005) Comparative genome sequencing of Drosophila pseu-doobscura: Chromosomal, gene, and cis-element evolution. Genome Res 15(1):1–18.
85. Mehrotra R, Sethi S, Zutshi I, Bhalothia P, Mehrotra S (2013) Patterns and evolutionof ACGT repeat cis-element landscape across four plant genomes. BMC Genomics14:203.
86. Ferraris JD, Garcia-Perez A (2001) Osmotically responsive genes: The mammalianosmotic response element (ORE). Am Zool 41(4):734–742.
87. Woo SK, Nahm O, Kwon HM (2000) How salt regulates genes: Function of a Rel-liketranscription factor TonEBP. Biochem Biophys Res Commun 278(2):269–271.
88. Woo SK, Dahl SC, Handler JS, Kwon HM (2000) Bidirectional regulation of tonicity-responsive enhancer binding protein in response to changes in tonicity. Am J PhysiolRenal Physiol 278(6):F1006–F1012.
89. Dahl SC, Handler JS, Kwon HM (2001) Hypertonicity-induced phosphorylation andnuclear localization of the transcription factor TonEBP. Am J Physiol Cell Physiol280(2):C248–C253.
90. Xu S, et al. (2008) Phosphorylation by casein kinase 1 regulates tonicity-inducedosmotic response element-binding protein/tonicity enhancer-binding protein nu-cleocytoplasmic trafficking. J Biol Chem 283(25):17624–17634.
91. Kwon MS, et al. (2008) Novel nuclear localization signal regulated by ambient to-nicity in vertebrates. J Biol Chem 283(33):22400–22409.
92. Lee SD, Colla E, Sheen MR, Na KY, Kwon HM (2003) Multiple domains of TonEBPcooperate to stimulate transcription in response to hypertonicity. J Biol Chem278(48):47571–47577.
93. Ferraris JD, et al. (2002) Activity of the TonEBP/OREBP transactivation domain variesdirectly with extracellular NaCl concentration. Proc Natl Acad Sci USA 99(2):739–744.
94. Kim JA, et al. (2014) Modulation of TonEBP activity by SUMO modification in re-sponse to hypertonicity. Front Physiol 5:200.
95. Fiol DF, Kültz D (2005) Rapid hyperosmotic coinduction of two tilapia (Oreochromismossambicus) transcription factors in gill cells. Proc Natl Acad Sci USA 102(3):927–932.
96. Wong MK, Ozaki H, Suzuki Y, Iwasaki W, Takei Y (2014) Discovery of osmotic sen-sitive transcription factors in fish intestine via a transcriptomic approach. BMCGenomics 15:1134.
97. Tse WK (2014) The role of osmotic stress transcription factor 1 in fishes. Front Zool11(1):86.
98. Tse WK, Chow SC, Wong CK (2012) Eel osmotic stress transcriptional factor 1 (Ostf1)is highly expressed in gill mitochondria-rich cells, where ERK phosphorylated. FrontZool 9(1):3.
99. Tse WK, Lai KP, Takei Y (2011) Medaka osmotic stress transcription factor 1b (Ostf1b/TSC22D3-2) triggers hyperosmotic responses of different ion transporters in medakagill and human embryonic kidney cells via the JNK signalling pathway. Int J BiochemCell Biol 43(12):1764–1775.
100. Breves JP, et al. (2010) Acute salinity challenges in Mozambique and Nile tilapia:Differential responses of plasma prolactin, growth hormone and branchial expres-sion of ion transporters. Gen Comp Endocrinol 167(1):135–142.
101. McGuire A, et al. (2010) Hyperosmotic shock adaptation by cortisol involves upre-gulation of branchial osmotic stress transcription factor 1 gene expression in Mo-zambique Tilapia. Gen Comp Endocrinol 165(2):321–329.
102. Tse WK, Chow SC, Wong CK (2008) The cloning of eel osmotic stress transcriptionfactor and the regulation of its expression in primary gill cell culture. J Exp Biol211(Pt 12):1964–1968.
103. Chow SC, Tse WK, Wong CK (2013) Dexamethasone (DEX) induces Osmotic stresstranscription factor 1 (Ostf1) through the Akt-GSK3β pathway in freshwater Japa-nese eel gill cell cultures. Biol Open 2(5):487–491.
104. Yan B, Zhao LH, Guo JT, Zhao JL (2012) miR-429 regulation of osmotic stress tran-scription factor 1 (OSTF1) in tilapia during osmotic stress. Biochem Biophys ResCommun 426(3):294–298.
105. Huang Y, Krein PM, Winston BW (2001) Characterization of IFN-gamma regulationof the complement factor B gene in macrophages. Eur J Immunol 31(12):3676–3686.
106. Ujaoney AK, Potnis AA, Kane P, Mukhopadhyaya R, Apte SK (2010) Radiation des-iccation response motif-like sequences are involved in transcriptional activation ofthe Deinococcal ssb gene by ionizing radiation but not by desiccation. J Bacteriol192(21):5637–5644.
107. Riethoven JJ (2010) Regulatory regions in DNA: Promoters, enhancers, silencers, andinsulators. Methods Mol Biol 674:33–42.
108. Thurman RE, et al. (2012) The accessible chromatin landscape of the human genome.Nature 489(7414):75–82.
109. Blattler A, et al. (2014) Global loss of DNA methylation uncovers intronic enhancersin genes showing expression changes. Genome Biol 15(9):469.
110. Ott CJ, et al. (2009) Intronic enhancers coordinate epithelial-specific looping of theactive CFTR locus. Proc Natl Acad Sci USA 106(47):19934–19939.
111. Bagchi DN, Iyer VR (2016) The determinants of directionality in transcriptional ini-tiation. Trends Genet 32(6):322–333.
112. Li M, et al. (2014) Efficient and heritable gene targeting in tilapia by CRISPR/Cas9.Genetics 197(2):591–599.
113. Maddison K, Clarke AR (2005) New approaches for modelling cancer mechanisms inthe mouse. J Pathol 205(2):181–193.
114. Kültz D, Li J, Gardell A, Sacchi R (2013) Quantitative molecular phenotyping of gillremodeling in a cichlid fish responding to salinity stress. Mol Cell Proteomics 12(12):3962–3975.
115. Schubert OT, et al. (2015) Building high-quality assay libraries for targeted analysisof SWATH MS data. Nat Protoc 10(3):426–441.
116. Sharma V, et al. (2014) Panorama: A targeted proteomics knowledge base.J Proteome Res 13(9):4205–4210.
117. Cassé C, Giannoni F, Nguyen VT, Dubois MF, Bensaude O (1999) The transcriptionalinhibitors, actinomycin D and alpha-amanitin, activate the HIV-1 promoter and favorphosphorylation of the RNA polymerase II C-terminal domain. J Biol Chem 274(23):16097–16106.
118. Daoudal S, Tournaire C, Halere A, Veyssière G, Jean C (1997) Isolation of the mousealdose reductase promoter and identification of a tonicity-responsive element. J BiolChem 272(5):2615–2619.
119. Ruepp B, Bohren KM, Gabbay KH (1996) Characterization of the osmotic responseelement of the human aldose reductase gene promoter. Proc Natl Acad Sci USA93(16):8624–8629.
120. Zhou C, Cammarata PR (1997) Cloning the bovine Na+/myo-inositol cotransportergene and characterization of an osmotic responsive promoter. Exp Eye Res 65(3):349–363.
E2738 | www.pnas.org/cgi/doi/10.1073/pnas.1614712114 Wang and Kültz
Dow
nloa
ded
by g
uest
on
Apr
il 21
, 202
0