orthodox and non-orthodox factors of foreign trade of ...€¦ · orthodox factors. in addition, we...
TRANSCRIPT
Orthodox and non-orthodox factors of foreign trade of regions. A gravity
panel data model for Poland and Spain
Tomasz Brodzicki
Institute for Development and University of Gdańsk, Poland
Laura Marquez-Ramos
Institute for International Trade, University of Adelaide, Australia
Stanislaw Umiński
Institute for Development and University of Gdańsk, Poland
Abstract
Most of the empirical studies in the gravity strand of empirical trade literature are conducted at the level
of national economies. In contrast, in the present paper we show the results of the analysis at the level of
regions of two large EU Member States of similar size, a number of regions and level of development
(cohesion states), namely Poland and Spain. The paper identifies the determinants of the intensity of
foreign trade of the Spanish and Polish NUTS-2 regions with all existing trade partners on bilateral basis
over the period 2005-2014, within the framework of an augmented panel gravity model.
In order to obtain unbiased results and escape some of the standard problems such as the
heteroscedasticity and zero trade flows adjustment, we utilise novel empirical approaches, such as the
estimation of a semi-mixed effect model with the Poisson Pseudo Maximum Likelihood method. We
estimate the model jointly for all Spanish and Polish regions and then disjointly, in a comparative
manner, in order to identify discrepancies of reaction to various factors investigated. They represent
standard determinants, such as the role of distance and size, differences in the level of development and
technological sophistication, as measured by the total factor productivity, exchange rate variability – as
well as more structural factors: metropolitan nature of some regions, cultural and institutional variation
or trade-persistence (long-term nature, historical factors such as former colonies or partitions).
Keywords: international trade; regional economics; gravity model; semi-mixed effects; PPML;
Poland; Spain
Subject classification codes: C23, F10, F14, R11
Draft version – please do not quote
The study has been supported by a grant from the National Science Centre [grant no.
2015/19/B/HS4/01704] ‘Regional Exporting Activity. Assessment of Determinants in Light of
Contemporary Foreign Trade Theory for Poland and Spain’ supervised by S. Umiński and carried out by
the Institute for Development.
Introduction
Most of the trade analyses are conducted at the country level. However, the number of studies
devoted to the foreign trade of regions is increasing. This, in particular, applies to medium and
large sized countries where the extent of regional heterogeneity is large. One could give several
reasons that could drive the attention to the regional level of analysis. They have been
exemplified by Brodzicki & Umiński (2017) as treatment of a region as a small open economy,
increasing interdependence of regional economies due to the continuation of globalization
processes as well as due to increasing role of the subsidiarity principle transferring more power
and responsibilities in governance to regional authorities. It applies in particular to regions of the
European Union (EU).
Poland and Spain are to relatively large Member States of the EU, with similar levels of
development, located in the peripheral parts of the EU with similar size and number of NUTS2
regions. Spain entered the EU in 1986 and can be considered the old Member States. Poland, in
contrast, is considered to be a new Member State, as it entered the EU only in May 2004. Spain is
a member of the euro zone, while Poland enjoys temporary derogation from the third stage of
EMU till it fulfils the Maastricht convergence criteria. Furthermore, Poland is still in the process
of economic transition initiated in 1989. The countries despite similarities thus differ significantly
from an institutional point of view. Furthermore, Spain and Poland followed different historical
paths for instance due to former colonial empire status of Spain and relatively recent partitions of
Poland that could still affect their regional trade patterns.
The paper identifies the determinants of the intensity of foreign trade of the Spanish and Polish
NUTS-2 regions with all existing trade partners on bilateral basis over the period 2005-2014,
within the framework of an augmented panel gravity model.
Our paper contributes to the body of empirical literature in several ways. We bring the analysis of
trade in the regional context beyond a single country and verify the hypotheses related to
determinants of trade for Spain and Poland in order to check their universal nature. Furthermore,
we go beyond standard determinants of trade intensity that in the common gravity approach are
distance and market size of trading partners and aim at identification of the so called non-
orthodox factors. In addition, we utilize a novel method of estimation in order to obtain unbiased
estimates that are PPML estimator in a semi-mixed effects approach.
The remainder of the paper has the following structure. Section 2 shortly reviews theoretical and
empirical literature. Section 3 covers the principal aims and hypotheses to be verified. The next
section presents the panel and the data sources. Section 5 sets our empirical strategy, describes
the structure of the empirical model and the method of estimation. Section 6 presents and
discusses the results. The last section concludes.
2. Review of theoretical and empirical literature
International Economics offers many theories that explain international trade phenomenon,
depicting the base for trade, its structure and consequences. Their usefulness for interpretations
and predictions of the real trade values is lower. It is gravity that has become the most frequently
used concept and a base for empirical models. Gravity, in fact, has absorbed many issues from
other trade theories, and over the years has become the fully-fledged and useful analytical tool.
Initially treated as “facts without theory” and very simple interpretation of the Newtonians
physics. The early references to gravity can be found in Isard (1960) “Methods of Regional
Analysis: Introduction to Regional Science”, where such issues as demographic power (or
energy) and demographic potential were used in modelling of migration within the USA. Trefler
(1995) paid attention to the fact that H-O-S model tends to predict a more intense trade than
happens in practice. The “missing trade” phenomenon has drawn researcher’s attention to the role
of distance as a barrier to trade. Recently, the thorough overview of the evolution of gravity
concept and its usage in international economics has been presented by Head and Mayer (2014)
As already mentioned, gravity’s usefulness stems from the flexibility in the selection of the
variables that are utilized in the construction of the models. Anderson (2011) showed that if
additional variables are taken into account (political barriers, common language) gravity works
very well, especially if countries are similar in size.
A comprehensive overview of different strategies of gravity models estimations and the selection
of variables has been presented by Kepaptsoglou, Karlaftis, and Tsamboulas (2010). Anderson
and van Wincoop (2003) insist on taking account of multilateral trade resistance by the inclusion
of pair-specific fixed effects enables to capture trade protection overall level. An important
problem in practical modelling is zero trade flows situation. In physics, the no-gravity situation is
not possible. Albeit very low, gravitational forces exist between physical objects. On a contrary,
between countries a situation of non-existing trade relations happens not so rarely, which makes
log-linear models of gravity less useful, the problem being the undefined logarithm of the zero.
The solution to the problem of zero trade flows can be either the standard zero adjustments or for
instance the application of PPML estimators Silva & Tenreyro (2006). It has to be stressed that
the distribution of zero-trade flows is not random. They occur predominantly in relations with
small, frequently remote trade partners.
Commonly used in international economics in modelling trade between countries, gravity has
also been more frequently utilised for regional analysis. However, the examples of the gravity-
based research are not numerous. For Spain a few papers can be identified, for Poland, the
gravity-oriented approach is in statu nascendi.
Costa-i-Font (2010) has followed gravity approach in the assessment of single currency effects on
bilateral trade of Spanish regions with the EU countries. He has used alternatively: total trade,
imports or exports as dependent variables and currency unions as treatment variables, as well as
the following geographical/regional controls: GDP, population size, distance between the capital
of a region and a capital of a destination country, dummy variable for adjacency between the
region and country, latitude of each region and a dummy for island regions.
Gil-Pareja, Llorca-Vivero, Martínez-Serrano, & Requena-Silvente (2015) have measured the
impact of Spanish regions export promotion, showing that regions’ foreign agencies activity
positively contributes to trade. The list of the independent variables is similar to the ones used by
Costa-i-Font (2010), in addition, the following variables were included: landlocked, common
language, embassies and general consulates Spain has in a country and a number of trade
agencies of a region in the country.
Gravity is also used in region’s competitiveness assessments, an example being the research for
Catalonia by Ghemawat, Llano, & Requena (2009) for both international and interregional trade.
Apart from the standard independent variables, also the surface of regions and countries was
used. The research estimates the border effect, which is often assessed for Spain. For instance,
Requena & Llano (2010) estimated the border effect for Spanish regions, also using gravity
model for industry level analysis. In the research by Groizard, Marques, & Santana (2014), the
augmented gravity estimation has been utilized to show the consequences of an island effect, for
Spanish regional trade. The Blinder-Oaxaca decomposition has been applied to separate distance
from the border effect.
Alamá-Sabater, Márquez-Ramos, Navarro-Azorín, & Suárez-Burguet (2015) have compared the
two methodology approaches in a study of interregional trade flows in Spain, with a use of spatial
gravity model. The spatial econometrics modelling of origin-destination flows has been presented
in order to assess the role of transport connectivity.
Bensassi, Marquez-Ramos, Martínez-Zarzoso, & Suarez-Burguet (2015) estimated an augmented
gravity model for Spanish regions, showing the role of transport infrastructure and geographical
factors in international competitiveness. Size, number and quality of logistics facilities has been
found to positively influence Spanish regions’ exports. Márquez-Ramos (2016) with the use of
gravity approach for Spanish regions has proved that regional spillovers are more important in
the growth of Spanish exports than port facilities themselves. Gravity equations were also used in
the assessment of the market potential in the historical context, for Spanish regions for the period
1867-1930 (Martinez-Galarraga, 2014).
For the Polish regions, international trade Brodzicki & Umiński (2017) have estimated the
gravity model. It was shown that metropolises and historical factors (path dependency) have an
influence on the contemporary international flows at the regional level.
3. The aims and hypotheses
The present paper sets as a principal aim of identification of the role of a number of orthodox and
non-orthodox determinants of region’s foreign trade. We treat distance and market size as
traditionally used variables in gravity models than can be regarded as orthodox factors
influencing trade. The direction of their influence on the dependent variables is easily predicted,
which cannot be said in the case of many of the non-orthodox variables, as for instance the
historical factors or FDI. For instance belonging to a region of Poland to the same former
partition than a country-partner in trade may have an unambiguous effect on trade intensity. The
same is with FDI, which can exert a substitutive or complementary effect on trade, depending on
the character of FDI done. For instance, the influence of metropolises on trade is also hard to
predict. Although metropolises are generally perceived as nodes of the globalized economy (also
contributing to foreign market risk reduction due to agglomeration externalities associated with
information spillovers), if entrepreneurs (corporations) preferences are strongly focused on costs
reduction (and costs in metropolises are usually higher than elsewhere), exporters may prefer
non-metropolitan localizations.
The second is to test a number of hypotheses that have been formulated as the result of the review
of the theoretical and empirical literature. There seems to be a consensus that a gravity model
“works well” in its baseline specification including distance and market size of trading partners.
However, as shown by Kepaptsoglou, Karlaftis, & Tsamboulas (2010) the selection of other, non-
orthodox independent variables varies, according to the character of the research. In most of the
empirical research, the gravity approach is used in order to estimate for instance the consequence
of monetary integration, customs unions implemented, export promotion carried on etc., and the
estimation strategy envisages the use of relatively few explanatory variables. The approach we
propose is different. We aim at identification of non-orthodox factors that influence trade with the
purpose to help regions and actors responsible for exports promotion at regional level – to
increase export (or total trade) capabilities. This kind of approach is specific because it focuses
both on region and country characteristics.
The following hypotheses are going to be tested:
H1: A gravity model is a useful tool for analysis of international trade assessed at a regional level
H2: Similarity in trading partners’ development level positively contributes to the intensity of
trade relations
H3: Direct geographical neighbourhood (adjacency) positively influences trade
H4: Similarity in TFP levels shall exert positive influence on trade
H5: Metropolitan character of a region shall positively contribute to exports intensity
H6: Quality of institutions matters: similarity in institutional quality shall intensify trade links
through reduction of risk associated with trading and making business contracts
H7: Historical factors of path-dependency type, impact the existing the trade relations in the
region-country framework in line with the concept of trade persistence, however the direction in
which it influences trade shall be tested
H8: FDI inflows shall positively influence trade, as we believe there is complementarity between
FDI and trade (rather than substitution)
H9: Economic integration tools, such as monetary integration (euro zone), customs union or
European Economic Area (EEA) facilitate trade also in region-country framework
4. The data set and data sources
The data panel has been constructed for the trade of 16 NUTS-2 level regions of Poland
(voivodships) and 19 NUTS-2 level regions of Spain with all possible trade partners. The panel
covers the period from 2005 to 2014 and is unbalanced due to missing observations. The dataset
has been acquired from a number of sources. The trade data for Polish and Spanish regions have
been obtained from the Polish Customs Chamber (Izba Celna) and retrieved from DataComex
Español database (http://datacomex.comercio.es)1.
The main source of auxiliary data for countries is the Penn World Tables PWT 9.0. (Feenstra,.,
Inklaar & Timmer, 2015). The main source of auxiliary data for regions is the Quality of
Government EU Regional Dataset (Charron, Dahlberg, Holmberg, Rothstein, Khomenko &
Svensson, 2016). The information on the institutional quality of countries has been obtained from
the 2016 version of the Worldwide Governance Indicators of the World Bank (Kaufmann, Kraay
& Mastruzzi, 2010). The data on FDI inflows by trade partner into regions have been obtained
from PAIiIZ for Poland and from http://datainvex.comercio.es as well as from the Spanish
Ministry of Economy and Competitiveness for Spain. The distance between trade partners has
been calculated in kilometres between the capital cities of the regions and the partner countries,
with the use of “as the crow flies” method using information on their longitude and latitude.
Additional information has been acquired from CEPII2.
1We would like to thank Marcin Skurczyński and Anna Fornalska-Skurczyńska for their work with trade data for
Spain and data retrieval from Spanish statistical sources. 2 Mayer, T. & Zignago, S. (2011) Notes on CEPII’s distances measures: the GeoDist Database CEPII Working Paper
2011-25; Head, K. and T. Mayer, (2013), "Gravity Equations: Toolkit, Cookbook, Workhorse." Handbook of
International Economics, Vol. 4, eds. Gopinath, Helpman, and Rogoff, Elsevier; Jacques Melitz and Farid Toubal,
2012. Native language, spoken language, translation and trade. CEPII, Working Papers 2012-17; Daniel Kaufmann,
Aart Kraay and Massimo Mastruzzi (2010). "The Worldwide Governance Indicators: A Summary of Methodology,
Data and Analytical Issues". World Bank Policy Research Working Paper No. 5430
5. Empirical strategy, structure of the empirical model and methods of estimation
Our empirical strategy is the following. We construct a basic specification of an augmented
gravity model and in steps add additional orthodox and non-orthodox variables in order to test a
number of hypotheses. The analysis is conducted separately for total trade and exports of regions.
Furthermore, we estimate the model jointly for all Spanish and Polish regions and then disjointly,
in a comparative manner in order to identify discrepancies of reaction to various orthodox and
non-orthodox factors investigated.
They represent standard or orthodox determinants, such as the role of distance and size,
differences in the level of development and technological sophistication, as measured by the total
factor productivity, exchange rate variability as well as factors of structural character:
metropolitan nature of some regions, cultural and institutional variation or trade-persistence
(long-term nature historical factors, such as former colonies or partitions), quality of institutions
or the impact of foreign direct investments (FDI).
In order to obtain unbiased results and escape some of the standard problems such as the
heteroscedasticity and zero trade flows adjustment, we utilize novel empirical approaches, such
as the estimation of a semi-mixed effect model with the Poisson Pseudo Maximum Likelihood
estimator. The estimator can be applied to a nonlinear multiplicative model (Westerlund &
Wilhelmson, 2008; Silva & Teneyro, 2006). Silva & Teneyro (2006) argued that the standard
logarithmic transformation in the gravity model might not be an appropriate approach to estimate
elasticities. It is due to the fact that trade models containing multiplicative errors do not satisfy
the assumption of the homoscedasticity of the error term due to the dependency between the error
term of the transformed log-linear model and the regressors.
The functional form of the gravity model using the PPML approach (Silva & Teneyro 2006), is
the following:
ijtijtijijtijjtitijt vDXZYYT ]lnlnlnlnexp[ln 210 [1]
where time effects, and region-partner specific effects ij are estimated as fixed effects.
The approach was further extended by Savasci (2011) who suggested the use of PPML, where the
pair effects are random, in order to control for unobserved cross-sectional heterogeneity. The
problem in the estimation of the proposed version of the model is an obvious potential

misspecification, due to the assumption of independence with the random effects. As a solution to
the problem, Proenca et al. (2015) proposed a method which relaxed the strict assumption of the
random effects model, but entailed more restrictions than the standard fixed effects model, by the
introduction of a fixed clustering variable (a semi-mixed effects model, Lombardia & Sperlich,
2011). The approach has been recently applied by Brodzicki & Uminski (2017) to the regional
trade of Poland in an article published in Regional Studies.
The dependent variables in our empirical model are a total trade (ttrade) in thousands of EUR
between a given region r and a given trade partner p in a year t and exports (exports) in
thousands of EUR from a given region r to a given trade partner p in a year t.
In the base specification, in line with the gravity approach we control for the physical distance
between trade partners as measured by the log of distance in kilometers (ln_distance) and their
sizes as measured either by the log of real GDP (ln_rGDP_r; ln_rGDP_c) in million USD or the
log of their population (ln_pop _r; ln_pop_c). We control as well for the similarity in the levels
of economic development as measured by the log of absolute difference in real GDP per capita
between a given region and a given trade partner (rel_l_devel). We assume the partners in
accordance with the Linder hypothesis (Linder 1961) to trade more intensively the more similar
is their level of development; thus, the coefficient on the variable should be negative.
The data for regional institutional quality from the University of Gothenburg are available for
two years only. In order to obtain a panel, we acknowledge their regional variation within Poland
and Spain and took into account their evolution for both countries from Global Governance
Indicators database. Furthermore, we performed Principal Component Analysis (PCA) over the
spectrum of institutional quality variables, provided in GGI dataset in order to obtain a single
institutional proxy for countries.
In the calculation of TFP estimates for regions, we utilized the following approach. We took the
data for TFP for Poland and Spain from the PWT 9.0. Acknowledging that TFP is a prime source
of variation in real GDP per capita, we took information on the value of real GDP per capita in a
region, relative to country mean as a rough approximation of region’s TFP. We envisage to
control the result in the future studies due to a potential bias. Using the information on regions
TFP and trade partners TFP we calculated the difference in TFP measure (diff_tfp) as a log of the
absolute difference between the two values.
In order to account for metropolitan status of a region we consulted the ESPON (Duhr 2005)
study on metropolitan areas in the European Union constructing a dummy variable for
metropolitan areas (metro) and in addition we took into account the MEGA classification thus
creating dummy variables for MEGA 1, 2, 3 & 4 regions (mega1, mega2, mega3, mega4
respectively).
6. The results and discussion
Our empirical results for Polish and Spanish regions, taken jointly, are presented in Tables 1 & 2.
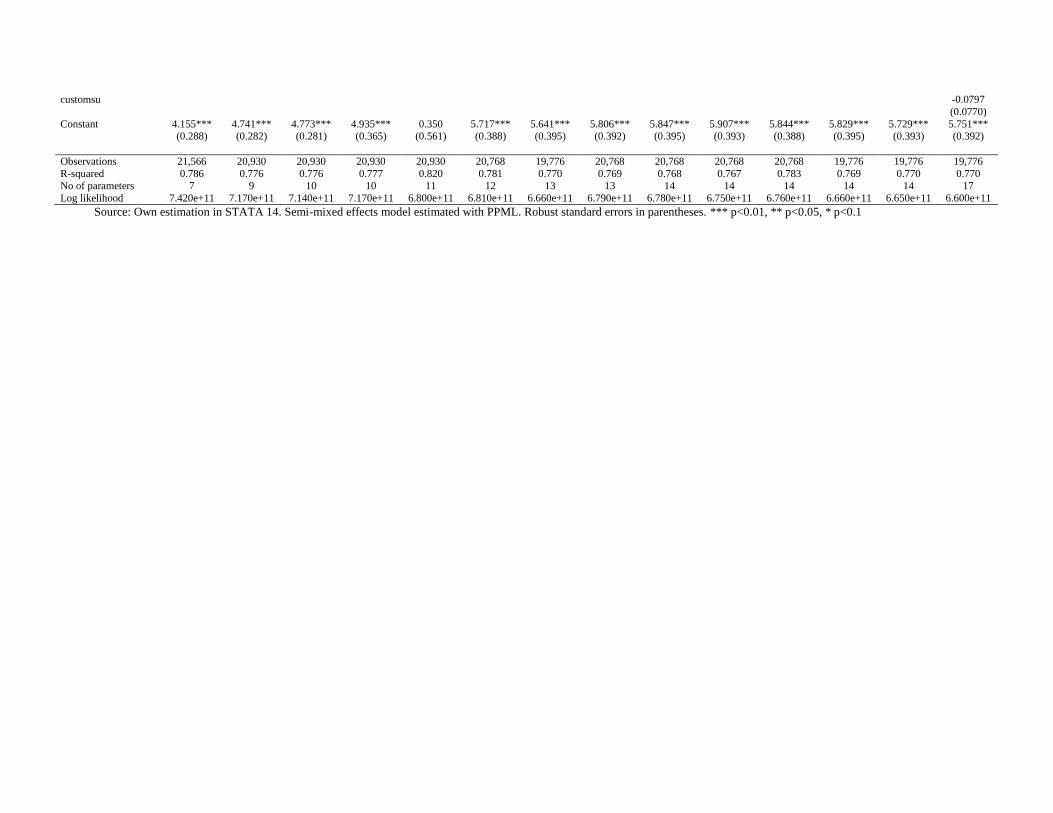
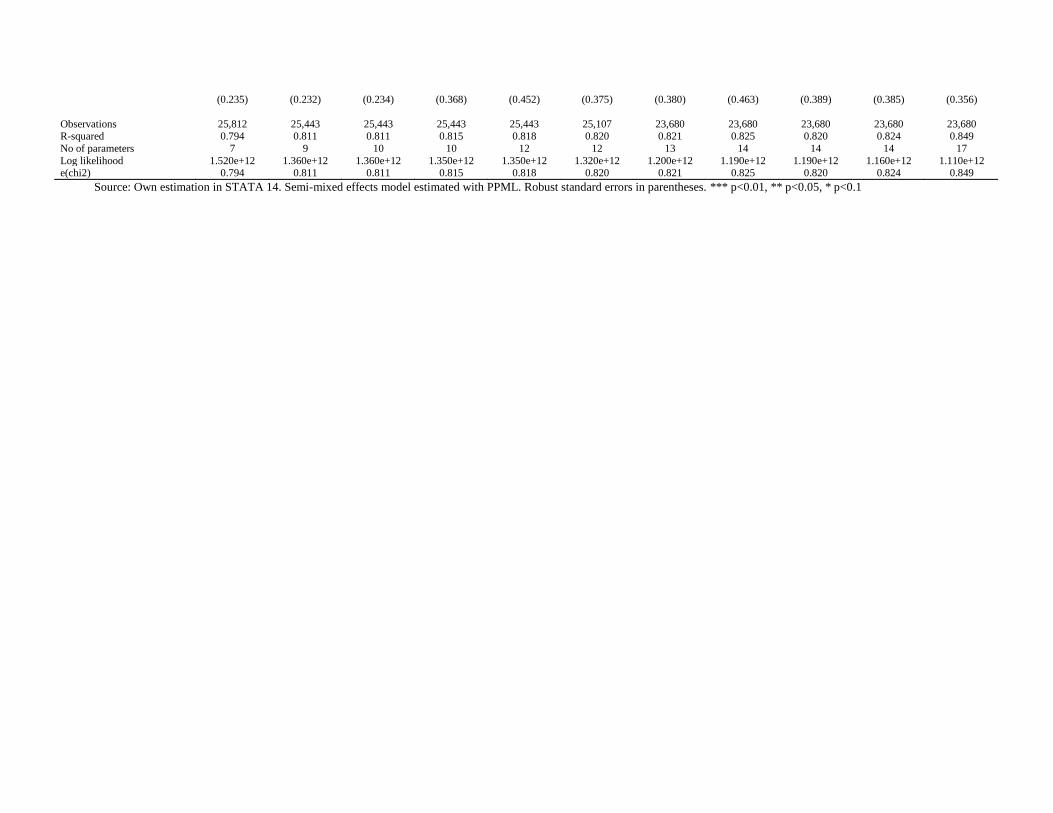
Tables 3 and 4 provide separate estimates for Polish and Spanish regions’ exports.
We have to stress that the general fit of the augmented gravity model is high. The model explains
approx. 75 to 80 per cent of the variation in the observed variables. The dummy for EU28 is the
clustering variable in the semi-mixed effect utilized. The coefficient on it is positive, apart from
specifications in which account for the euro zone and other forms of preferential trade
agreements.
The impact of the standard gravity variables is in accordance with theoretical postulates. The
impact of distance is negative and above of one and the impact of the size of the region and the
size of trade partners is statistically significant and positive. The magnitude of the impact is
generally higher for the size of the region than the size of the trade partner. The negative impact
of distance is more pronounced for exports than for total trade (please compare Table 2 to 1) and
simultaneously is magnitude for exports is higher for more peripheral Polish regions than more
central Spanish regions (please compare Table 3 and 4). The adjacency, as expected, has a
positive impact on bilateral trade flows. Its impact is visibly more important for Spanish regions,
though.
In all four estimated models, the impact of dissimilarity in the levels of economic development is
statistically significant and negative (with exception of several specifications for Polish regions
not accounting for the difference in institutional quality). Thus partners of a similar level of
development, in accordance with the Linder hypotheses, seem to trade more.
In the joined sample of Polish and Spanish regions, the impact of access to a sea by a region is
clearly positive. It holds also for Spanish regions taken separately. The impact on Poland’s region
exports is positive, however, not statistically significant. The impact of landlockedness of the
trade partner is however negative in all specifications considered.
The impact of the difference in TFP levels between the region and its trade partner is statistically
significant and negative. Thus it verifies positively our hypothesis H4. It is worth to note that the
magnitude of the impact is several times higher for Polish than Spanish region’s exports,
depicting significantly higher elasticity of reaction.
The metropolitan status of a region in accordance with the ESPON classification boosts its total
trade and exports in the joined sample of Polish and Spanish regions (please refer to Tables 1 &
2). If we allow for the significance of metropolitan areas (a division of MEGA 1 to 4), the
elasticities differ. They are clearly positive for total trade (the highest magnitude for MEGA3),
and positive and robust for exports of MEGA3 and MEGA4 regions. If the analysis is conducted
on restricted samples for Polish and Spanish exports disjointly, the results are to some extent
surprising. The coefficient on a metro variable is insignificant for Poland and negative for Spain,
and the impact of MEGA is generally negative, ceteris paribus.
In each model, from the sixth specification onwards, we control for regional governance quality
and partners institutional quality. The results are robust with the positive impact of the quality of
an institution of the trade partner only.
In the next specifications, we test for the impact of historical ties, ceteris paribus. This includes
former colonies of Spain and relatively recent impact of partitions of Poland. The impact of
history is generally positive in the joined sample supporting the notion of trade persistence. It is
further analysed in separate models for Poland and Spain that show a clear difference. Spanish
regions, in general, export more to former Spanish colonies (please refer to Table 4). However,
we cannot observe regional variation in this case (due to data character that we use). In the case
of Poland, the impact varies between regions and the former empire that a given region had
belonged to, prior to 1918. The impact differs between former Prussian, Russian and Austro-
Hungarian regions (please refer to Table 3).
In the next set of specifications, we control for the impact of FDI. We introduce the information
on a cumulated number of FDI (zero adjusted) and relative number of FDI per square kilometre,
for a given trade partner in a given region. The impact of both on total trade in the joined sample
is negative, however statistically significant only in the first case. The impact on exports is
positive, however not statistically significant for the first variable, and negative, for the second
variable.
The impact for exports of Polish regions (please refer to Table 3) of both variables is positive
however not statistically significant. In the case of exports of Spanish regions (please refer to
Table 3), it is positive for a cumulated number of investors and negative for area adjusted
variable. In the case of Spain, due to data availability, we can in addition account for the value of
Spanish FDI by regions abroad with a clearly positive impact.
In the last specification, we account for all previous factors taking into account the impact of euro
zone, EEA and customs union of the EU. The impact is positive for both total trade and exports
of Polish and Spanish regions taken together; however, the impact differs between the two
countries. The impact is statistically significant for Poland only for EEA partners. The impact on
Spanish regions is negative for EEA and clearly positive for euro zone member states. The
inclusion of the clustering variable could be partially responsible for the obtained result.
7. Conclusions
Although the gravity approach has been intensively used in international economics, the
determinants of regional exporting activity still require thorough investigation. Both international
and regional aspects are involved.
The studies of a similar kind have been conducted in some countries and their regions, however,
our intention was to verify the determinants by comparative analysis conducted for two EU
Members States in order to draw universal and solid conclusions.
Furthermore, our intention is to broaden the sample of regions to other countries as well.
However, the choice of the countries in question could seem controversial; they have many
similarities despite some deep nature differences. Nonetheless, the empirical results have proven
most of the theoretical postulates related to factors potentially determining trade relations in the
region-country framework. In particular, the paper has identified the determinants of the intensity
of foreign trade of the Spanish and Polish NUTS-2 regions with all existing trade partners on
bilateral basis over the period 2005-2014, within the framework of an augmented panel gravity
model. The model has been estimated with the use of a novel and superior method of estimation,

namely the semi-mixed effects with PPML, which produces more robust and unbiased results.
The model has been jointly estimated for all Spanish and Polish regions and then in the second
step disjointly, in a comparative manner, in order to identify discrepancies of reaction to various
factors investigated. Apart from the above, we seriously contribute to the body of the literature by
analysing a number of orthodox and non-orthodox factors. At the same time, we would like to
stress that many sources of data have been merged into one comprehensive data set allowing for
profound analysis.
First of all, the orthodox or standard determinants of trade flows such as distance and market size,
prove the robustness of the application of the gravity approach to region-country trade
framework. The impact of other standard variables such as adjacency, preferential trade
agreements or currency unions is in line with theoretical postulates. Polish and Spanish regions
trade more with partners at a similar level of development in line with the Linder hypothesis. As
regards non-orthodox factors, the similarity in productivity levels as measured by TFP, the
institutional quality of trading partner, the metropolitan status of the region as well as historical
linkages influence the bilateral trade flows. Nonetheless, some regional heterogeneity has been
detected.
As to the limitations of our research, we acknowledge the unbalanced nature of the panel due to
missing observations as well as the conduct of analysis at an aggregated level without sectoral
disaggregation of trade flows.
As to the further extension of our research, we envisage to utilize a new dataset on the value of
FDI inflows into Polish NUTS-2 regions from particular countries of the world. We intend to
supplement in the forthcoming stages of the research project.
References
Anderson, J. E. (2011). The Gravity Model. Annual Review of Economics, 3(1), 133–160.
Anderson, J. E., & van Wincoop, E. (2003). Gravity with Gravitas: A Solution to the Border Puzzle.
American Economic Review, 93(1), 170–192.
Alamá-Sabater, L., Márquez-Ramos, L., Navarro-Azorín, J. M., & Suárez-Burguet, C. (2015). A two-
methodology comparison study of a spatial gravity model in the context of interregional trade flows.
Applied Economics, 47(14), 1481–1493.
Armington, P. S. (1969). A Theory of Demand for Products Distinguished by Place of Production (Une
theorie de la demande de produits differencies d'apres leur origine) (Una teoria de la demanda de
productos distinguiendolos segun el lugar de produccion). Staff Papers - International Monetary Fund,
16(1), 159.
Bensassi, S., Marquez-Ramos, L., Martínez-Zarzoso, I., & Suarez-Burguet, C. (2015). Relationship
between logistics infrastructure and trade: Evidence from Spanish regional exports. Transportation
Research Part A: Policy and Practice, 72, 47–61. https://doi.org/10.1016/j.tra.2014.11.007
Brodzicki, T., & Umiński, S. (2017). A gravity panel data analysis of foreign trade by regions: The role of
metropolises and history. Regional Studies, 11(1), 1–13.
Charron, N., Dahlberg, S., Holmberg, S., Rothstein, B., Khomenko, A. & Svensson, R. (2016). The
Quality of Government EU Regional Dataset, version Sep16. University of Gothenburg: The Quality of
Government Institute, http://www.qog.pol.gu.se
Costa-i-Font, J. (2010). Regional Single Currency Effects on Bilateral Trade with the European Union.
LSE ‘Europe in Question’ Discussion Paper Series. (26, October), 1–29. Retrieved from
http://www.lse.ac.uk/europeanInstitute/LEQS/LEQSPaper26.pdf
Duhr, S. (2005) Potentials for polycentric development in Europe: The ESPON 1.1. 1 project report,
Planning, Practice & Research 20(2), 235-239.
Feenstra, Robert C., Robert Inklaar and Marcel P. Timmer (2015). The Next Generation of the Penn
World Table" American Economic Review, 105(10), 3150-3182, available for download at
www.ggdc.net/pwt
Ghemawat, P., Llano, C., & Requena, F. (2009). Rethinking regional competitiveness: Catalonia's
international trade and interregional trade, 1995-2006. University of Navarra Business School, Working
Paper. (WP-802).
Gil-Pareja, S., Llorca-Vivero, R., Martínez-Serrano, J. A., & Requena-Silvente, F. (2015). Regional export
promotion offices and trade margins. Review of World Economics, 151(1), 145–167.
https://doi.org/10.1007/s10290-014-0199-0
Groizard, J. L., Marques, H., & Santana, M. (2014). Islands in Trade: Disentangling Distance from Border
Effects. Economics: The Open-Access, Open-Assessment E-Journal, 8(2014-40), 1.
https://doi.org/10.5018/economics-ejournal.ja.2014-40
Head, K., & T. Mayer, (2013). Gravity Equations: Toolkit, Cookbook, Workhorse. Handbook of
International Economics, Vol. 4, Eds. Gopinath, Helpman, and Rogoff, Elsevier.
Head, K., & Mayer, T. (2014). Gravity Equations: Workhorse, Toolkit, and Cookbook. In G. Gopinath, E.
Helpman, & K. Rogoff (Eds.), Handbooks in economics: Vol. 4. Handbook of international economics
(pp. 131–195). Amsterdam: North-Holland.
Isard, W. (Ed.). (1960). Methods of Regional Analysis: An Introduction to Regional Science. Cambridge:
MIT Press.
Kaufmann, D., Kraay A. & Mastruzzi, M. (2010). The Worldwide Governance Indicators: A Summary of
Methodology, Data and Analytical Issues. World Bank Policy Research Working Paper No. 5430.
Kepaptsoglou, K., Karlaftis, M. G., & Tsamboulas, D. (2010). The Gravity Model Specification for
Modeling International Trade Flows and Free Trade Agreement Effects: A 10-Year Review of Empirical
Studies, The Open Economics Journal, 3(1), 1–13.
Krugman, P. R. (1999). The age of diminished expectations: US economic policy in the 1990s (3. ed., 4.
print). Cambridge, Mass. [u.a.]: MIT Press
Linder, S., & Burenstam. (1961). An Essay on Trade and Transformation. New York: John Wiley.
Lombardía, M. J., & Sperlich, S. (2012). A new class of semi-mixed effects models and its application in
small area estimation. Computational Statistics & Data Analysis, 56(10), 2903-2917.
Márquez-Ramos, L. (2016). Port facilities, regional spillovers and exports: Empirical evidence from
Spain. Papers in Regional Science, 95(2), 329–351.
Martinez-Galarraga Julio. (2014). Market potential estimates in history: a survey of methods and an
application to Spain, 1867-1930. EHES Working Papers in Economic History. (51), 1–53.
Mayer, T. & Zignago, S. (2011) Notes on CEPII’s distances measures: the GeoDist Database CEPII
Working Paper 2011-25.
Melitz J. and Farid Toubal, 2012. Native language, spoken language, translation and trade. CEPII,
Working Papers 2012-17.
Melitz, M. J., & Redding, S. J. (2014). Heterogeneous Firms and Trade. In G. Gopinath, E. Helpman, &
Rogoff Kenneth (Eds.), Handbook of International Economics. Handbook of International Economics
(Vol. 4, pp. 1–54). Amsterdam: Elsevier.
Proenca, I., Sperlich, S., & Savasci, D. (2015) Semi-mixed Effects Gravity Models for Bilateral Trade,
Empirical Economics 48(1), 361-387
Requena, F., & Llano, C. (2010). The border effects in Spain: An industry-level analysis. Empirica, 37(4),
455–476.
Santos Silva, J. & Teneyro, S. (2006) The Log of Gravity, Review of Economic Statistics 88(4), 641-58.
Savasci, D. (2011) Three Studies on Semi-mixed Effects Models, Dissertation presented for the degree of
Doctor of Philosophy at the Faculty of Economic Sciences of the Georg-August-Universität Göttingen.
Trefler, D. (1995). The case of the missing trade and other mysteries. American Economic Review, 85(5),
1029–1046.
Westerlund, J., & Wilhelmsson, F. (2006). Estimating the Gravity Model without Gravity Using Panel
Data, Department of Economics, Lund University, Lund.

Table 1. Estimates of the for total trade of Polish and Spanish regions
(1) (2) (3) (4) (5) (6) (7) (8) (9) (10)
VARIABLES tt_v_usd tt_v_usd tt_v_usd tt_v_usd tt_v_usd tt_v_usd tt_v_usd tt_v_usd tt_v_usd tt_v_usd
ln_distance -1.085*** -1.094*** -1.102*** -1.069*** -1.065*** -1.052*** -1.010*** -1.025*** -1.011*** -0.951***
(0.0132) (0.0139) (0.0137) (0.0144) (0.0146) (0.0142) (0.0133) (0.0149) (0.0133) (0.0133)
ln_rgdp_c 0.856*** 0.834*** 0.834*** 0.830*** 0.830*** 0.820*** 0.816*** 0.831*** 0.819*** 0.811***
(0.00725) (0.00769) (0.00765) (0.00766) (0.00751) (0.00819) (0.00816) (0.0104) (0.00862) (0.00857)
ln_rgdp_r 1.091*** 1.075*** 1.071*** 1.011*** 0.979*** 1.021*** 1.039*** 1.083*** 1.047*** 1.040***
(0.0105) (0.0110) (0.0109) (0.0151) (0.0241) (0.0153) (0.0159) (0.0216) (0.0180) (0.0174)
diff_y -0.142*** -0.142*** -0.0870*** -0.162*** -0.156*** -0.153*** -0.172*** -0.183*** -0.177*** -0.192***
(0.0204) (0.0209) (0.0229) (0.0208) (0.0200) (0.0220) (0.0229) (0.0237) (0.0234) (0.0239)
adj 0.241*** 0.207*** 0.174*** 0.208*** 0.233*** 0.214*** 0.176*** 0.193*** 0.182*** 0.154***
(0.0455) (0.0466) (0.0479) (0.0467) (0.0470) (0.0470) (0.0477) (0.0479) (0.0476) (0.0475)
access_2_sea 0.0706*** 0.0719*** 0.0582** 0.0689*** 0.0658*** 0.0721*** 0.0774*** 0.0604** 0.0683***
(0.0236) (0.0234) (0.0239) (0.0248) (0.0243) (0.0253) (0.0252) (0.0266) (0.0258)
geo_landlocked -0.266*** -0.281*** -0.283*** -0.282*** -0.305*** -0.242*** -0.258*** -0.246*** -0.135***
(0.0255) (0.0253) (0.0253) (0.0250) (0.0257) (0.0272) (0.0274) (0.0271) (0.0286)
mega1 0.263***
(0.0649)
mega3 0.347***
(0.0497)
mega4 0.170***
(0.0355)
eu28 0.262*** 0.266*** 0.261*** 0.301*** 0.308*** 0.255*** 0.321*** 0.331*** 0.325*** -0.378***
(0.0262) (0.0272) (0.0271) (0.0260) (0.0253) (0.0259) (0.0260) (0.0261) (0.0263) (0.110)
diff_tfp -0.0513***
(0.0106)
metro 0.199*** 0.177*** 0.158*** 0.143*** 0.159*** 0.164***
(0.0342) (0.0351) (0.0364) (0.0368) (0.0361) (0.0352)
r_inst_qual -0.114** -0.121** -0.119** -0.115** -0.0963**
(0.0501) (0.0507) (0.0500) (0.0504) (0.0483)
c_governance_pc1 0.0332*** 0.0307*** 0.0368*** 0.0315*** 0.0113*
(0.00641) (0.00633) (0.00587) (0.00626) (0.00644)
history 0.387*** 0.382*** 0.384*** 0.362***
(0.0427) (0.0418) (0.0425) (0.0435)
ln_no_fdi_cum_za -0.0248***
(0.00844)
ln_no_fdi_area_za -4.066 -3.486
(3.101) (2.752)
euroz 0.348***
(0.0249)
eea 0.544***
(0.106)
customsu 0.0613
(0.0374)
Constant 4.498*** 5.056*** 5.036*** 5.507*** 5.803*** 5.366*** 4.863*** 4.321*** 4.758*** 4.410***
(0.174) (0.192) (0.194) (0.204) (0.261) (0.213) (0.217) (0.277) (0.241) (0.237)
Observations 39,118 38,377 38,377 38,377 38,377 38,098 36,321 36,321 36,321 36,321
R-squared 0.781 0.777 0.779 0.777 0.780 0.778 0.780 0.782 0.780 0.804
No of parameters 7 9 10 10 12 12 13 14 14 17
Log likelihood 5.260e+12 5.160e+12 5.140e+12 5.130e+12 5.110e+12 5.050e+12 4.830e+12 4.820e+12 4.830e+12 4.690e+12
Source: Own estimation in STATA 14. Semi-mixed effects model estimated with PPML. Robust standard errors in parentheses.
*** p<0.01, ** p<0.05, * p<0.1
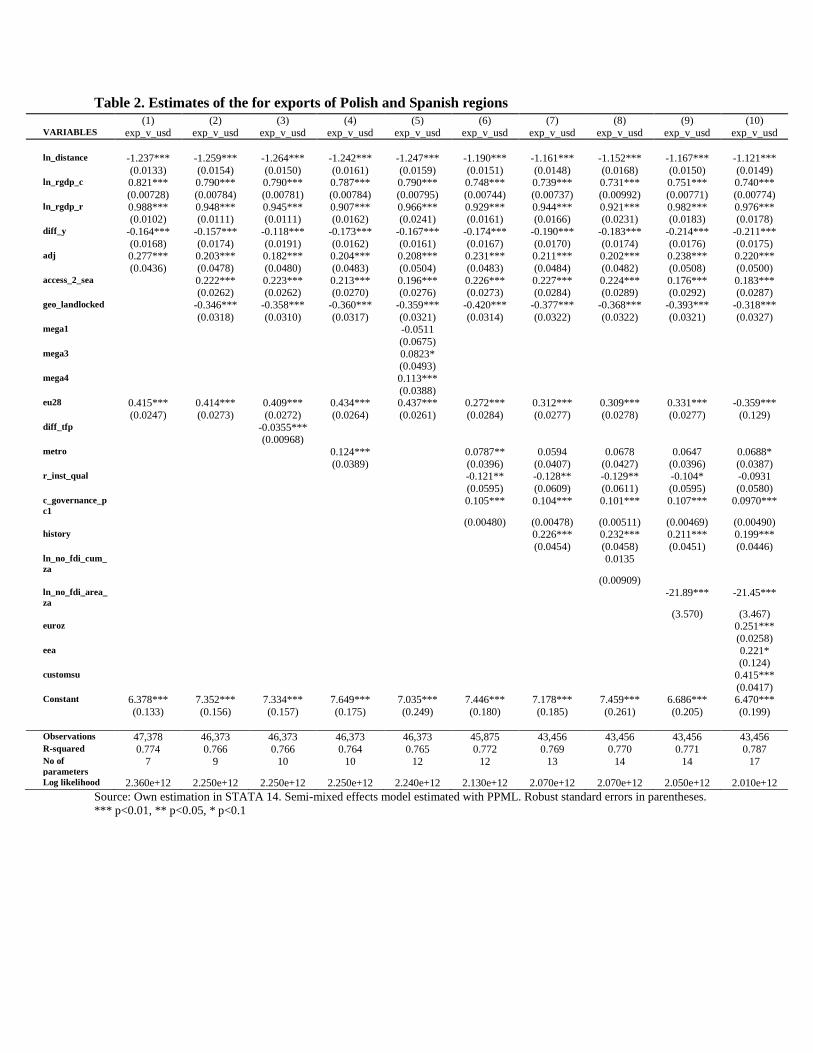
Table 2. Estimates of the for exports of Polish and Spanish regions (1) (2) (3) (4) (5) (6) (7) (8) (9) (10) VARIABLES exp_v_usd exp_v_usd exp_v_usd exp_v_usd exp_v_usd exp_v_usd exp_v_usd exp_v_usd exp_v_usd exp_v_usd ln_distance -1.237*** -1.259*** -1.264*** -1.242*** -1.247*** -1.190*** -1.161*** -1.152*** -1.167*** -1.121*** (0.0133) (0.0154) (0.0150) (0.0161) (0.0159) (0.0151) (0.0148) (0.0168) (0.0150) (0.0149) ln_rgdp_c 0.821*** 0.790*** 0.790*** 0.787*** 0.790*** 0.748*** 0.739*** 0.731*** 0.751*** 0.740*** (0.00728) (0.00784) (0.00781) (0.00784) (0.00795) (0.00744) (0.00737) (0.00992) (0.00771) (0.00774) ln_rgdp_r 0.988*** 0.948*** 0.945*** 0.907*** 0.966*** 0.929*** 0.944*** 0.921*** 0.982*** 0.976*** (0.0102) (0.0111) (0.0111) (0.0162) (0.0241) (0.0161) (0.0166) (0.0231) (0.0183) (0.0178) diff_y -0.164*** -0.157*** -0.118*** -0.173*** -0.167*** -0.174*** -0.190*** -0.183*** -0.214*** -0.211*** (0.0168) (0.0174) (0.0191) (0.0162) (0.0161) (0.0167) (0.0170) (0.0174) (0.0176) (0.0175) adj 0.277*** 0.203*** 0.182*** 0.204*** 0.208*** 0.231*** 0.211*** 0.202*** 0.238*** 0.220*** (0.0436) (0.0478) (0.0480) (0.0483) (0.0504) (0.0483) (0.0484) (0.0482) (0.0508) (0.0500) access_2_sea 0.222*** 0.223*** 0.213*** 0.196*** 0.226*** 0.227*** 0.224*** 0.176*** 0.183*** (0.0262) (0.0262) (0.0270) (0.0276) (0.0273) (0.0284) (0.0289) (0.0292) (0.0287) geo_landlocked -0.346*** -0.358*** -0.360*** -0.359*** -0.420*** -0.377*** -0.368*** -0.393*** -0.318*** (0.0318) (0.0310) (0.0317) (0.0321) (0.0314) (0.0322) (0.0322) (0.0321) (0.0327) mega1 -0.0511 (0.0675) mega3 0.0823* (0.0493) mega4 0.113*** (0.0388) eu28 0.415*** 0.414*** 0.409*** 0.434*** 0.437*** 0.272*** 0.312*** 0.309*** 0.331*** -0.359*** (0.0247) (0.0273) (0.0272) (0.0264) (0.0261) (0.0284) (0.0277) (0.0278) (0.0277) (0.129) diff_tfp -0.0355*** (0.00968) metro 0.124*** 0.0787** 0.0594 0.0678 0.0647 0.0688* (0.0389) (0.0396) (0.0407) (0.0427) (0.0396) (0.0387) r_inst_qual -0.121** -0.128** -0.129** -0.104* -0.0931 (0.0595) (0.0609) (0.0611) (0.0595) (0.0580) c_governance_p
c1 0.105*** 0.104*** 0.101*** 0.107*** 0.0970***
(0.00480) (0.00478) (0.00511) (0.00469) (0.00490) history 0.226*** 0.232*** 0.211*** 0.199*** (0.0454) (0.0458) (0.0451) (0.0446) ln_no_fdi_cum_
za 0.0135
(0.00909) ln_no_fdi_area_
za -21.89*** -21.45***
(3.570) (3.467) euroz 0.251*** (0.0258) eea 0.221* (0.124) customsu 0.415*** (0.0417) Constant 6.378*** 7.352*** 7.334*** 7.649*** 7.035*** 7.446*** 7.178*** 7.459*** 6.686*** 6.470*** (0.133) (0.156) (0.157) (0.175) (0.249) (0.180) (0.185) (0.261) (0.205) (0.199) Observations 47,378 46,373 46,373 46,373 46,373 45,875 43,456 43,456 43,456 43,456 R-squared 0.774 0.766 0.766 0.764 0.765 0.772 0.769 0.770 0.771 0.787 No of
parameters 7 9 10 10 12 12 13 14 14 17
Log likelihood 2.360e+12 2.250e+12 2.250e+12 2.250e+12 2.240e+12 2.130e+12 2.070e+12 2.070e+12 2.050e+12 2.010e+12
Source: Own estimation in STATA 14. Semi-mixed effects model estimated with PPML. Robust standard errors in parentheses.
*** p<0.01, ** p<0.05, * p<0.1
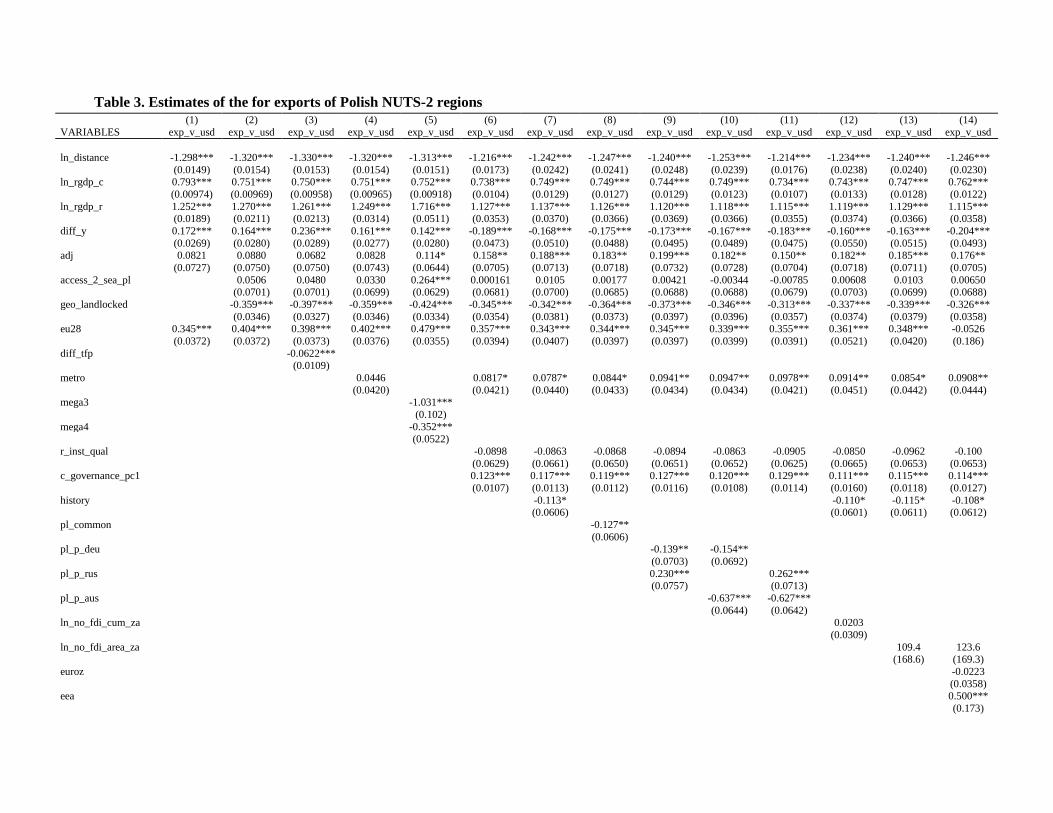
Table 3. Estimates of the for exports of Polish NUTS-2 regions
(1) (2) (3) (4) (5) (6) (7) (8) (9) (10) (11) (12) (13) (14)
VARIABLES exp_v_usd exp_v_usd exp_v_usd exp_v_usd exp_v_usd exp_v_usd exp_v_usd exp_v_usd exp_v_usd exp_v_usd exp_v_usd exp_v_usd exp_v_usd exp_v_usd
ln_distance -1.298*** -1.320*** -1.330*** -1.320*** -1.313*** -1.216*** -1.242*** -1.247*** -1.240*** -1.253*** -1.214*** -1.234*** -1.240*** -1.246***
(0.0149) (0.0154) (0.0153) (0.0154) (0.0151) (0.0173) (0.0242) (0.0241) (0.0248) (0.0239) (0.0176) (0.0238) (0.0240) (0.0230) ln_rgdp_c 0.793*** 0.751*** 0.750*** 0.751*** 0.752*** 0.738*** 0.749*** 0.749*** 0.744*** 0.749*** 0.734*** 0.743*** 0.747*** 0.762***
(0.00974) (0.00969) (0.00958) (0.00965) (0.00918) (0.0104) (0.0129) (0.0127) (0.0129) (0.0123) (0.0107) (0.0133) (0.0128) (0.0122)
ln_rgdp_r 1.252*** 1.270*** 1.261*** 1.249*** 1.716*** 1.127*** 1.137*** 1.126*** 1.120*** 1.118*** 1.115*** 1.119*** 1.129*** 1.115*** (0.0189) (0.0211) (0.0213) (0.0314) (0.0511) (0.0353) (0.0370) (0.0366) (0.0369) (0.0366) (0.0355) (0.0374) (0.0366) (0.0358)
diff_y 0.172*** 0.164*** 0.236*** 0.161*** 0.142*** -0.189*** -0.168*** -0.175*** -0.173*** -0.167*** -0.183*** -0.160*** -0.163*** -0.204***
(0.0269) (0.0280) (0.0289) (0.0277) (0.0280) (0.0473) (0.0510) (0.0488) (0.0495) (0.0489) (0.0475) (0.0550) (0.0515) (0.0493) adj 0.0821 0.0880 0.0682 0.0828 0.114* 0.158** 0.188*** 0.183** 0.199*** 0.182** 0.150** 0.182** 0.185*** 0.176**
(0.0727) (0.0750) (0.0750) (0.0743) (0.0644) (0.0705) (0.0713) (0.0718) (0.0732) (0.0728) (0.0704) (0.0718) (0.0711) (0.0705)
access_2_sea_pl 0.0506 0.0480 0.0330 0.264*** 0.000161 0.0105 0.00177 0.00421 -0.00344 -0.00785 0.00608 0.0103 0.00650 (0.0701) (0.0701) (0.0699) (0.0629) (0.0681) (0.0700) (0.0685) (0.0688) (0.0688) (0.0679) (0.0703) (0.0699) (0.0688)
geo_landlocked -0.359*** -0.397*** -0.359*** -0.424*** -0.345*** -0.342*** -0.364*** -0.373*** -0.346*** -0.313*** -0.337*** -0.339*** -0.326***
(0.0346) (0.0327) (0.0346) (0.0334) (0.0354) (0.0381) (0.0373) (0.0397) (0.0396) (0.0357) (0.0374) (0.0379) (0.0358) eu28 0.345*** 0.404*** 0.398*** 0.402*** 0.479*** 0.357*** 0.343*** 0.344*** 0.345*** 0.339*** 0.355*** 0.361*** 0.348*** -0.0526
(0.0372) (0.0372) (0.0373) (0.0376) (0.0355) (0.0394) (0.0407) (0.0397) (0.0397) (0.0399) (0.0391) (0.0521) (0.0420) (0.186)
diff_tfp -0.0622*** (0.0109)
metro 0.0446 0.0817* 0.0787* 0.0844* 0.0941** 0.0947** 0.0978** 0.0914** 0.0854* 0.0908**
(0.0420) (0.0421) (0.0440) (0.0433) (0.0434) (0.0434) (0.0421) (0.0451) (0.0442) (0.0444) mega3 -1.031***
(0.102)
mega4 -0.352***
(0.0522)
r_inst_qual -0.0898 -0.0863 -0.0868 -0.0894 -0.0863 -0.0905 -0.0850 -0.0962 -0.100
(0.0629) (0.0661) (0.0650) (0.0651) (0.0652) (0.0625) (0.0665) (0.0653) (0.0653) c_governance_pc1 0.123*** 0.117*** 0.119*** 0.127*** 0.120*** 0.129*** 0.111*** 0.115*** 0.114***
(0.0107) (0.0113) (0.0112) (0.0116) (0.0108) (0.0114) (0.0160) (0.0118) (0.0127)
history -0.113* -0.110* -0.115* -0.108* (0.0606) (0.0601) (0.0611) (0.0612)
pl_common -0.127**
(0.0606) pl_p_deu -0.139** -0.154**
(0.0703) (0.0692)
pl_p_rus 0.230*** 0.262*** (0.0757) (0.0713)
pl_p_aus -0.637*** -0.627***
(0.0644) (0.0642)
ln_no_fdi_cum_za 0.0203
(0.0309)
ln_no_fdi_area_za 109.4 123.6 (168.6) (169.3)
euroz -0.0223
(0.0358) eea 0.500***
(0.173)
customsu -0.0797
(0.0770)
Constant 4.155*** 4.741*** 4.773*** 4.935*** 0.350 5.717*** 5.641*** 5.806*** 5.847*** 5.907*** 5.844*** 5.829*** 5.729*** 5.751*** (0.288) (0.282) (0.281) (0.365) (0.561) (0.388) (0.395) (0.392) (0.395) (0.393) (0.388) (0.395) (0.393) (0.392)
Observations 21,566 20,930 20,930 20,930 20,930 20,768 19,776 20,768 20,768 20,768 20,768 19,776 19,776 19,776
R-squared 0.786 0.776 0.776 0.777 0.820 0.781 0.770 0.769 0.768 0.767 0.783 0.769 0.770 0.770 No of parameters 7 9 10 10 11 12 13 13 14 14 14 14 14 17
Log likelihood 7.420e+11 7.170e+11 7.140e+11 7.170e+11 6.800e+11 6.810e+11 6.660e+11 6.790e+11 6.780e+11 6.750e+11 6.760e+11 6.660e+11 6.650e+11 6.600e+11
Source: Own estimation in STATA 14. Semi-mixed effects model estimated with PPML. Robust standard errors in parentheses. *** p<0.01, ** p<0.05, * p<0.1
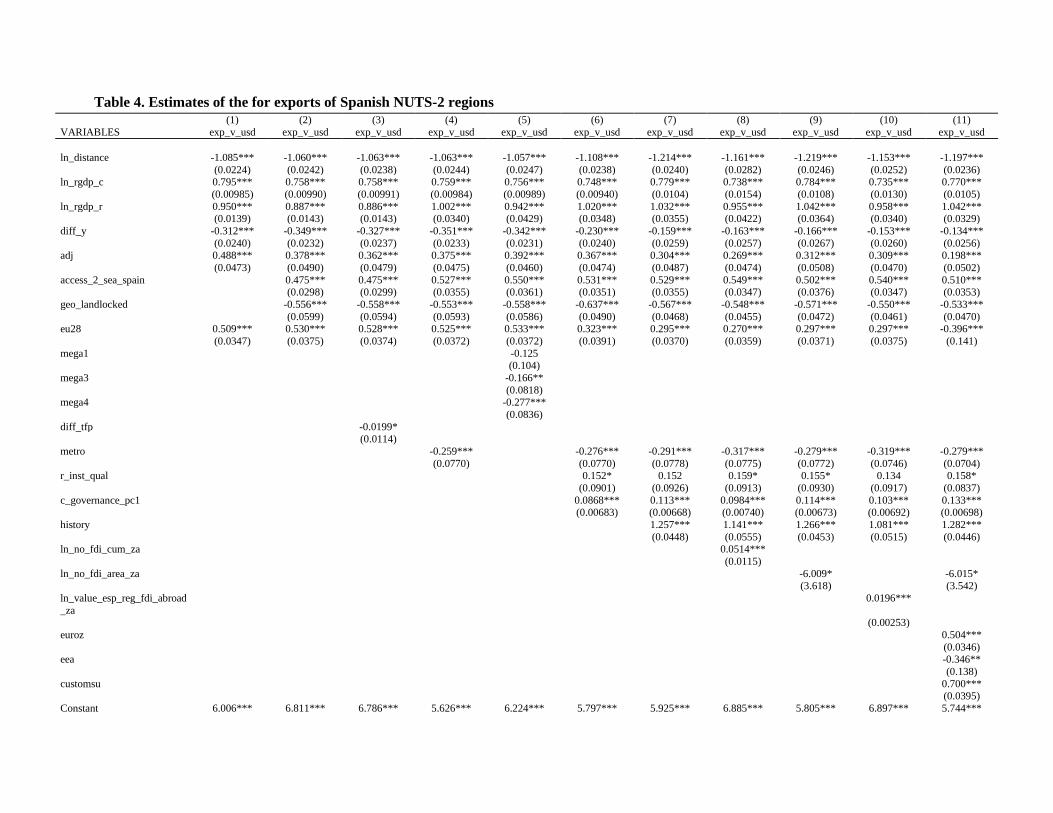
Table 4. Estimates of the for exports of Spanish NUTS-2 regions
(1) (2) (3) (4) (5) (6) (7) (8) (9) (10) (11)
VARIABLES exp_v_usd exp_v_usd exp_v_usd exp_v_usd exp_v_usd exp_v_usd exp_v_usd exp_v_usd exp_v_usd exp_v_usd exp_v_usd
ln_distance -1.085*** -1.060*** -1.063*** -1.063*** -1.057*** -1.108*** -1.214*** -1.161*** -1.219*** -1.153*** -1.197***
(0.0224) (0.0242) (0.0238) (0.0244) (0.0247) (0.0238) (0.0240) (0.0282) (0.0246) (0.0252) (0.0236) ln_rgdp_c 0.795*** 0.758*** 0.758*** 0.759*** 0.756*** 0.748*** 0.779*** 0.738*** 0.784*** 0.735*** 0.770***
(0.00985) (0.00990) (0.00991) (0.00984) (0.00989) (0.00940) (0.0104) (0.0154) (0.0108) (0.0130) (0.0105)
ln_rgdp_r 0.950*** 0.887*** 0.886*** 1.002*** 0.942*** 1.020*** 1.032*** 0.955*** 1.042*** 0.958*** 1.042*** (0.0139) (0.0143) (0.0143) (0.0340) (0.0429) (0.0348) (0.0355) (0.0422) (0.0364) (0.0340) (0.0329)
diff_y -0.312*** -0.349*** -0.327*** -0.351*** -0.342*** -0.230*** -0.159*** -0.163*** -0.166*** -0.153*** -0.134***
(0.0240) (0.0232) (0.0237) (0.0233) (0.0231) (0.0240) (0.0259) (0.0257) (0.0267) (0.0260) (0.0256) adj 0.488*** 0.378*** 0.362*** 0.375*** 0.392*** 0.367*** 0.304*** 0.269*** 0.312*** 0.309*** 0.198***
(0.0473) (0.0490) (0.0479) (0.0475) (0.0460) (0.0474) (0.0487) (0.0474) (0.0508) (0.0470) (0.0502)
access_2_sea_spain 0.475*** 0.475*** 0.527*** 0.550*** 0.531*** 0.529*** 0.549*** 0.502*** 0.540*** 0.510*** (0.0298) (0.0299) (0.0355) (0.0361) (0.0351) (0.0355) (0.0347) (0.0376) (0.0347) (0.0353)
geo_landlocked -0.556*** -0.558*** -0.553*** -0.558*** -0.637*** -0.567*** -0.548*** -0.571*** -0.550*** -0.533***
(0.0599) (0.0594) (0.0593) (0.0586) (0.0490) (0.0468) (0.0455) (0.0472) (0.0461) (0.0470) eu28 0.509*** 0.530*** 0.528*** 0.525*** 0.533*** 0.323*** 0.295*** 0.270*** 0.297*** 0.297*** -0.396***
(0.0347) (0.0375) (0.0374) (0.0372) (0.0372) (0.0391) (0.0370) (0.0359) (0.0371) (0.0375) (0.141)
mega1 -0.125 (0.104)
mega3 -0.166**
(0.0818) mega4 -0.277***
(0.0836)
diff_tfp -0.0199*
(0.0114)
metro -0.259*** -0.276*** -0.291*** -0.317*** -0.279*** -0.319*** -0.279***
(0.0770) (0.0770) (0.0778) (0.0775) (0.0772) (0.0746) (0.0704) r_inst_qual 0.152* 0.152 0.159* 0.155* 0.134 0.158*
(0.0901) (0.0926) (0.0913) (0.0930) (0.0917) (0.0837)
c_governance_pc1 0.0868*** 0.113*** 0.0984*** 0.114*** 0.103*** 0.133*** (0.00683) (0.00668) (0.00740) (0.00673) (0.00692) (0.00698)
history 1.257*** 1.141*** 1.266*** 1.081*** 1.282***
(0.0448) (0.0555) (0.0453) (0.0515) (0.0446) ln_no_fdi_cum_za 0.0514***
(0.0115)
ln_no_fdi_area_za -6.009* -6.015* (3.618) (3.542)
ln_value_esp_reg_fdi_abroad
_za
0.0196***
(0.00253)
euroz 0.504***
(0.0346) eea -0.346**
(0.138)
customsu 0.700*** (0.0395)
Constant 6.006*** 6.811*** 6.786*** 5.626*** 6.224*** 5.797*** 5.925*** 6.885*** 5.805*** 6.897*** 5.744***
(0.235) (0.232) (0.234) (0.368) (0.452) (0.375) (0.380) (0.463) (0.389) (0.385) (0.356)
Observations 25,812 25,443 25,443 25,443 25,443 25,107 23,680 23,680 23,680 23,680 23,680 R-squared 0.794 0.811 0.811 0.815 0.818 0.820 0.821 0.825 0.820 0.824 0.849
No of parameters 7 9 10 10 12 12 13 14 14 14 17
Log likelihood 1.520e+12 1.360e+12 1.360e+12 1.350e+12 1.350e+12 1.320e+12 1.200e+12 1.190e+12 1.190e+12 1.160e+12 1.110e+12 e(chi2) 0.794 0.811 0.811 0.815 0.818 0.820 0.821 0.825 0.820 0.824 0.849
Source: Own estimation in STATA 14. Semi-mixed effects model estimated with PPML. Robust standard errors in parentheses. *** p<0.01, ** p<0.05, * p<0.1