original research clinical user experiences of and...
TRANSCRIPT

Clinical user experiences ofobservation and response charts:focus group findings of using a newformat chart incorporating a trackand trigger system
Doug Elliott,1 Emily Allen,1 Lin Perry,1,2 Margaret Fry,1,3 Christine Duffield,1
Robyn Gallagher,4 Rick Iedema,5 Sharon McKinley,6 Michael Roche1
1Faculty of Health, University ofTechnology, Sydney, New SouthWales, Australia2South East Sydney Local HealthDistrict, Sydney, New SouthWales, Australia3Northern Sydney Local HealthDistrict, Sydney, New SouthWales, Australia4Charles Perkins Centre &Sydney Nursing School,University of Sydney, Sydney,New South Wales, Australia5Agency for Clinical Innovation,NSW Health, Sydney, New SouthWales, Australia6Intensive Care, Royal NorthShore Hospital, Sydney, NewSouth Wales, Australia
Correspondence toProfessor Doug Elliott, Faculty ofHealth, University of Technology,Sydney, New South Wales 2007,Australia;[email protected]
Received 19 December 2013Revised 9 September 2014Accepted 2 November 2014Published Online First19 November 2014
To cite: Elliott D, Allen E,Perry L, et al. BMJ Qual Saf2015;24:65–75.
ABSTRACTBackground Optimising clinical responses todeteriorating patients is an international indicatorof acute healthcare quality. Observation chartsincorporating track and trigger systems are aninitiative to improve early identification andresponse to clinical deterioration. A suite of trackand trigger ‘Observation and Response Charts’were designed in Australia and initially tested insimulated environments. This paper reports initialclinical user experiences and views followingimplementation of these charts in adult generalmedical-surgical wards.Methods Across eight trial sites, 44 focusgroups were conducted with 218 clinical wardstaff, mostly nurses, who received training andhad used the charts in routine clinical practice forthe preceding 2–6 weeks. Transcripts of audiorecordings were analysed for emergent themesusing an inductive approach.Findings In this exploration of initial userexperiences, key emergent themes were:tensions between vital sign ‘ranges versusprecision’ to support decision making; using astandardised ‘generalist chart in a range ofspecialist practice’ areas; issues of ‘clinicalcredibility’, ‘professional autonomy’ and‘influences of doctors’ when communicatingabnormal signs; and ‘permission and autonomy’when escalating care according to the protocol.Across themes, participants presented a range ofpositive, negative or mixed views. Benefits wereidentified despite charts not always being usedup to their optimal design function. Participantsreported tensions between chart objectives andclinical practices, revealing mismatches betweendesign characteristics and human staffexperiences. Overall, an initial view of ‘increasedactivity/uncertain benefit’ was uncovered.
Conclusions Findings particularly reinforced thesignificant influences of organisational work-based cultures, disciplinary boundaries andinterdisciplinary communication onimplementation of this new practice chart.Optimal use of all chart design characteristics willbe possible when these broader cultural issuesare addressed.
INTRODUCTIONTimely recognition and appropriatemanagement of patients showing signs ofclinical deterioration is essential inensuring optimal patient safety in acutehealthcare facilities worldwide.1–3 Earlysigns of clinical deterioration can bedetected in 60%–80% of patients at risk4
up to 48 h prior to occurrence of a poten-tially adverse event,5 with regular monitor-ing of six core physiological vital signs(respiratory rate, oxygen saturation, bloodpressure, heart rate, temperature and levelof consciousness).6 While various levels ofautomated vital sign monitoring are beingintegrated into some healthcare systems,7 8
traditional paper-based observation chartsare currently the common format forrecording and reporting physiologicalparameters of acute medical-surgical wardpatients in Australia.9–11
The design and performance of paper-based observation charts in clinical practicehas, however, received little systematic ortheory-based attention until recently.10–12
While an observation chart should promptand facilitate recording of patient monitor-ing and detection of abnormal findings,audits have consistently found both under-reporting and delays in initiation of action
ORIGINAL RESEARCH
Elliott D, et al. BMJ Qual Saf 2015;24:65–75. doi:10.1136/bmjqs-2013-002777 65
on 28 June 2018 by guest. Protected by copyright.
http://qualitysafety.bmj.com
/B
MJ Q
ual Saf: first published as 10.1136/bm
jqs-2013-002777 on 19 Novem
ber 2014. Dow
nloaded from

on the basis of abnormal observations.10 13 14 Despitepractice initiatives to facilitate detection of deteriorationand early intervention,15–17 early signs of patient deteri-oration continue to go unrecognised or there is a failureto respond.18–20
Observation charts redesigned to include track andtrigger systems (TTS) have previously demonstratedimproved recognition of deterioration.21–23 A TTSenables users to graph and track trends of a patient’svital signs over time24; when measurements reach pre-determined abnormal thresholds, actions are recom-mended to trigger an appropriate clinical teamresponse. Some TTS charts use coloured zones in thegraphing section to indicate abnormal vital signs.11
Other charts include an early warning scoring system(EWSS) with points assigned to each abnormal vitalsign.25 26 The sum of points provides an Early WarningScore designed to increase the likelihood of recognisingdeterioration.27 Current evidence, however, is inconclu-sive due to disparate variations in EWSS and poor orinadequate methodologies.28
An optimal TTS incorporates specific design fea-tures based on human factors’ principles to minimiseany risk of error29; these characteristics include: separ-ate graphing areas for core vital signs; indication ofabnormal thresholds, with colours and a visual layoutto minimise risk of error during documentation andalert and prompt staff to escalate care; and recom-mendations for appropriate actions according to apatient’s deteriorating condition.6
To improve identification and response to clinicaldeterioration in acute care hospitals at a nationallevel,6 the Australian Commission on Safety andQuality in Healthcare (ACSQHC) commissioned thedevelopment of a suite of Observation and ResponseCharts (ORC), incorporating the design principleslisted above and TTS responses. Two initial chart ver-sions (the Adult Deterioration Detection System;ADDS) were evaluated during simulation testing, anddemonstrated lower error rates in comparison with arange of other charts that were in routine clinicaluse.24 Following this evaluation, three additional ver-sions were developed for different levels of clinicalresponse that aligned with local hospital escalation/rapid response team (RRT) protocols.The ORC was developed as a double-sided A3-sized
form with a left binding margin and a fold out to theright. When the chart is opened and folded out to theright, the inside left page contains the ‘vital signscharting area’ for documentation of nine parameters(respiratory rate, oxygen saturation, oxygen flow rate,blood pressure, heart rate, temperature, consciouslevel, urine output and pain score).Each vital sign section has a range of normal values
(with no shading) and a series of abnormal rangeswith different coloured shading, to prompt an actionaccording to local RRT protocols.30 For example, asystolic blood pressure in the ‘100s’ range (100–
109 mm Hg) is shaded yellow and requires a seniornurse review as a response; a systolic blood pressurein the ‘80s’ range (80–89 mm Hg) is shaded purpleand requires a Medical Emergency Team (‘MET’) call.The response criteria and actions required when adeterioration is identified are listed on the inside rightchart page for user information (figure 1 illustratesthe two inside pages of a sample four-level responseORC).Calling criteria (parameters defining abnormal
values) can be modified by a medical officer in asection on the cover page for individual patients. Anymodifications to these criteria are reviewed accordingto local policy. Interventions in response to abnormalobservations are also recorded in a designated sectionof the chart. Further details about the chart formatand design characteristics are available.31 32
Following development of these new charts, theACSQHC sought evaluation of the charts in clinicalpractice via a competitive tender process. The studyreported here formed part of a larger two-phase mul-tisite before–after mixed-methods study32 examiningthe clinical use and application of the ORCs in adultgeneral acute medical-surgical wards.
METHODSOne of the required objectives from the ACSQHCtender was to investigate the preferences and com-ments of clinical staff. This substudy reports on thisobjective using the study question, ‘What are theexperiences and views of staff using the ORCs in clin-ical practice?’ Focus groups of clinical staff partici-pants were conducted to explore their preferences andcomments following introduction and use of the newcharts in routine practice.
SampleParticipating sites were selected from 52 submittedexpressions of interest to the ACSQHC. A purposivesample was sought to reflect the range and variety ofacute healthcare facilities in Australia based on location,hospital size, public/private sector and level of serviceprovided. Eight of nine health service sites recruited tothis phase of the main study provided data for thisreport from four jurisdictions across Australia.
Implementation of charts in routine clinical practiceA project manager coordinated chart and study imple-mentation, and site-based project officers with localknowledge of policy and practices were seconded toimplement the charts into clinical practice and collectdata at each site. Site executives were engaged as aproject ‘champion’, providing executive support, com-mitment of key stakeholders and assistance for theproject officers in profiling chart implementation andevaluation with all relevant clinical staff.Before implementation, project officers attended a
one-day training workshop on the chart design
Original research
66 Elliott D, et al. BMJ Qual Saf 2015;24:65–75. doi:10.1136/bmjqs-2013-002777
on 28 June 2018 by guest. Protected by copyright.
http://qualitysafety.bmj.com
/B
MJ Q
ual Saf: first published as 10.1136/bm
jqs-2013-002777 on 19 Novem
ber 2014. Dow
nloaded from

characteristics and rationale, use in practice and collec-tion techniques of study data. Each project officer thenprovided extensive in-service education sessions andongoing one-to-one staff support for chart use in clin-ical areas. Attendance at site education sessions waspredominantly by nursing staff, as medical educationtime was seldom available. Medical officers, therefore,received ad hoc education primarily at the patient’sbedside, during ward rounds or informal discussions.Site staff selected a version of the ORC that aligned
with their local escalation protocol and staff resources(see example in figure 1). Abnormal ranges (inside leftchart page) and criteria listed (inside right chart page)were then adjusted to reflect each site’s local callingcriteria and RRT practices. Charts were incorporatedinto routine practice for between 2 and 6 weeks priorto participant evaluation. Chart implementations wereservice/district-wide for two clinical sites, hospital-wide for four sites and in three/four wards for theremaining three sites.
Data collectionThe experiences and views of clinical staff using thecharts were explored during brief semistructuredfocus groups conducted by the site project officersfrom February to March 2012. Focus groups were
scheduled during shift overlap, staff development ses-sions and education forums to enable as many staff aspossible to attend. An interview schedule guided dis-cussion with items based on a review of the literatureand from evaluations of early chart versions22 24 29 33 34
(see box 1).
Data management and analysisFocus group discussions were audio-recorded and theaudio files sent to the research team for deidentificationand verbatim transcription. Two members of theresearch team experienced in qualitative analysis con-ducted thematic analyses independently, using inductivereasoning guided by Gibbs’ framework of: (1) transcrip-tion, familiarisation and immersion into data; (2) codebuilding; (3) dis/confirmatory theme development and(4) data consolidation and interpretation.35
Audio files were listened to repeatedly until research-ers were familiar with the material. Using NVivo V.9software (QSR International, Doncaster, Victoria,Australia), a process of open coding was initially appliedas topics, issues, experiences and perspectives were iden-tified; these were iteratively organised, structured andmerged as overarching themes emerged. These investi-gators then discussed and reviewed the organisation ofthemes until consensus was achieved, providing a
Figure 1 Example Observation and Response Chart (ORC)—two inside pages of a four-level response chart (used with permission,ACSQHC (Australian Commission on Safety and Quality in Healthcare)).
Original research
Elliott D, et al. BMJ Qual Saf 2015;24:65–75. doi:10.1136/bmjqs-2013-002777 67
on 28 June 2018 by guest. Protected by copyright.
http://qualitysafety.bmj.com
/B
MJ Q
ual Saf: first published as 10.1136/bm
jqs-2013-002777 on 19 Novem
ber 2014. Dow
nloaded from

systematic approach for interpretation.36 37 These inter-pretations were then confirmed with other researchteam members.
Ethical considerationsThe Human Research and Ethics Committees at eachsite approved the study. Participants provided informedconsent prior to data collection. Confidentiality of par-ticipant identity was assured with focus groups (FG)only identified by codes in reports and publications.38
FINDINGSEight of the nine project sites submitted focus groupdata (one site was unable to submit data withinthe study timeline because of competing workloads).A total of 218 staff participated across 44 focusgroups (median participants per group was 5; range2–8). Most participants were nurses; doctors wereinvited, but many did not participate inter aliabecause of stated workload priorities (see theDiscussion section for elaboration).The deteriorating patient observation continuum
provided a framework for analysis; recordingvital signs, detecting deterioration and escalating care.A number of inter-related themes emerged from thesethree temporal processes, as well as specific contextualinfluences on staff experiences of the chart in clinical
practice (see figure 2 for the range of issues andthemes identified). Key emergent themes are describedbelow, with direct quotes used to elaborate or illus-trate emergent issues.
Recording vital signsA number of related themes reflected changes for par-ticipants from previous practices when recording vitalsign parameters, particularly using preset ranges onthe chart rather than writing numerical values. Issueswere also raised for recording specific specialist obser-vations, as well as benefits and concerns with themodifications section of the chart.
Range versus precisionEstablished observation documentation practices werechallenged by the chart format, requiring staff to graphobservations within a range rather than writing a numer-ical value (see figure 1). This was the single mostcommon issue raised by participants, with descriptorssuch as ‘precise’, ‘specific’ and ‘accurate’ used to high-light participant concerns in most focus groups. Formany nurses trained to value accuracy in measurement,this practice change created discomfort; as highlightedby, ‘we’ve always been taught accuracy is better’ (FG I3).This graphical documentation of observations in
ranges created particular discordance with medicalstaff requirements for precise values. As a result, docu-mented observations were sometimes regarded as ‘notaccurate’, and to avoid this perception, nurses wouldfrequently write actual figures, double-document,repeat vital sign measurements or ‘guess the numbers’(FG B6) when communicating with doctors. This fun-damental mismatch between the chart format and theneed for specific values in clinical practice hinderedinitial acceptance by clinicians.
Specialist practice, generalist chartThe ORC was developed to document observations forthe majority of adult acute care medical-surgicalpatients. Some clinical areas across sites, however, con-tinued to need and use separate specialty observationcharts, such as neurovascular observations or theGlasgow Coma Scale. Surgical wards also requiredoutput measures from drains, wounds and packs thatwere not included in the ORC (even though these couldbe documented on a separate fluid balance chart). Thismeant different observation charts remained in use,with repetition of information across charts causinguncertainty about what to document and where.Aside from potential duplication and more work for
nurses, this increased the risk of observations notbeing documented at all, ‘if a doctor wants to see …
it’s not always in the one spot.’ (FG A4); or notlocated correctly, ‘instead of writing … blood glucoseon the back [page of the ORC], people were getting ablood glucose chart … Then you look at the chartsand think when was the last time the sugar was done’(FG I2). This caused considerable frustration for staff,
Box 1 Trigger questions for semistructured focusgroups
▸ How did you find using the new charts? (What did/didn’t you like about them?).
▸ Are there any particular sections of the Observationand Response Chart (ORC) that you particularly likedor disliked? (Please explain answer).
▸ Did you encounter any difficulties while using theORC? If so, what were they? Can you suggest anyways to resolve this?
▸ How do you find graphing using ranges rather thanwriting the actual number?
▸ How do you find the ORC compared with the chartsyou usually use? (Easier/harder to fill in or read?If so, in what way? What makes them easier/harderto use?).
▸ Does the chart make any difference to your ability todetect/pick up changes in a patient’s condition?(If yes, what is it about the chart that makes thedifference?).
▸ Does the chart make any difference to your ability tomake decisions about patient care? (If so, in whatway?).
▸ Do you think the chart influences your ability to com-municate clinical deterioration to the patient’s team?(If so, in what way?).
▸ Is there anything else about these charts that youwould like to tell me about?
Original research
68 Elliott D, et al. BMJ Qual Saf 2015;24:65–75. doi:10.1136/bmjqs-2013-002777
on 28 June 2018 by guest. Protected by copyright.
http://qualitysafety.bmj.com
/B
MJ Q
ual Saf: first published as 10.1136/bm
jqs-2013-002777 on 19 Novem
ber 2014. Dow
nloaded from

with participants frequently requesting for all neces-sary observations to be combined on one chart.
Modifications to calling criteriaMany participants considered the modification sectionof the chart, allowing tailoring of parameters for indi-vidual patients so that otherwise abnormal limits wereclinically acceptable and beneficial to practice. Chartguidelines stated that doctors were responsible fordocumenting modifications to individual patient vitalsigns. In practice, however, participants reported thatdoctors often omitted completion of the modificationsection, failed to review previously recorded modifica-tions or delayed documenting changes. This lack ofengagement by medical staff meant that potentiallyinappropriate RRT actions were still recommendedaccording to the documented chart.As recording on observation charts was not trad-
itionally a medical role, this meant that implementa-tion of these new charts required multidisciplinaryownership and a shift in role boundaries. Nurses,however, felt they had become the custodian of thecharts by default, with responsibility to ensure itscompletion, despite considerable practice challenges;as noted, ‘getting the doctors to fill in the modifica-tion … a nightmare’ (FG I3).
Detecting deteriorationExperiences of the charts as a decision aid in the pres-ence of clinical deterioration varied for participants,with the emerging common themes: recognisingtrends while graphing within ranges; perceived chal-lenges to clinical expertise, and level of autonomy tomake clinical decisions.
Recognising a trendParticipants acknowledged that the specific chartdesign features facilitated recognition of patientdeterioration. A general understanding of the rationale
and benefits was also noted, including graphing valuesand observing trends or patterns in changes of apatient’s clinical condition; as stated: ‘a dot … [to]graph so we can actually look at it at a glance … it iseasier to see a trend’ (FG A1).Graphing values for detecting trends was therefore
supported, as many participants indicated this wassimilar to their previous charts. The colour-coded trackand trigger sections were mostly regarded as positivelysupporting recognition of deterioration (especially fornew staff) or making no difference (for experiencedstaff). Colours were seen as easy to differentiate, evenwith different lighting levels (ie, at night). Some,however, found the charts unnecessarily busy and thishampered their perception of pattern recognition.As noted earlier, however, vital sign ranges with pre-
determined parameters and colour-coded sections fortriggering a response were often perceived as toobroad. This issue was noted where ‘dramatic changesin observations that still fall within the normal para-meters’ (FG B5) did not trigger an alert. Importantly,staff identified this issue as a deterrent to early detec-tion of deterioration, as a patient with baseline obser-vations within the upper normal range (colouredwhite) would not register in the (yellow) alert rangeuntil they had already experienced a clinically signifi-cant fall, for example, 9 mm Hg blood pressure.Participants, therefore, wanted to see changes intrends both within and between ranges, especially forblood pressure, temperature and oxygen saturation;for example, ‘they’re on oxygen for a reason and wewouldn’t know when to take them off ’ (FG H8).Other important practice issues became evident when
accurate measurements of vital signs were required toinitiate important interventions; for example, the tem-perature at which blood cultures were taken and intra-venous antibiotics commenced. Measurements of vitalsigns were also used as markers of response to
Figure 2 Temporal mapping of emergent themes from staff focus groups. ORC, Observation and Response Chart.
Original research
Elliott D, et al. BMJ Qual Saf 2015;24:65–75. doi:10.1136/bmjqs-2013-002777 69
on 28 June 2018 by guest. Protected by copyright.
http://qualitysafety.bmj.com
/B
MJ Q
ual Saf: first published as 10.1136/bm
jqs-2013-002777 on 19 Novem
ber 2014. Dow
nloaded from

treatment, such as antihypertensive and analgesic drugs.For example, ‘if somebody was in severe pain and theirblood pressure went up but then you gave them someanalgesia and then it came back down’ (FG H2).
Clinical credibilityA spectrum of views was therefore expressed on theuse of the charts as a visual aid to detect deterioration.Less experienced nursing staff liked the ORC chartdesign and found them easy to use: ‘… from a glanceyou can see if it’s in a different colour, that there’ssomething that you should be taking a closer look at’(FG G3). While more experienced participants con-ceded the charts were helpful for less experiencedstaff, some considered them deskilling, creating adependency and replacing clinical judgement; forexample, ‘we should be educating junior staff to lookfor more than just teaching them to use colours’ (FGA6). Some participants were also defensive of theirability to recognise deterioration without needing acolour-coded track and trigger chart: ‘I’d like to thinkthat it hasn’t made any difference to me being able todetect my patient deteriorating’ (FG I1) and ‘I went tonursing school for three years—I know when it’s timeto ring the doctor’ (FG A4).
Professional autonomyRecommended actions in response to a patient’sdeteriorating vital signs that met specific criteria onthe charts were not always in line with nurses’ clinicaljudgements. In particular, senior staff resented thatthey were not allowed either to amend calling criteriathemselves or go straight to a medical review whenthe chart criteria recommended a senior nurse review,but they perceived greater urgency; for example, ‘… ifthis patient is actually sick, you’ve wasted time waitingfor the nurse in charge to review that patient, then inturn, they’ve got to go and get an intern to come andview that patient anyway’ (FG H7).Shift team leaders were split over their responsibility
for these clinical reviews. Some participants appre-ciated having greater confidence that junior staffwould come to them if their patient’s vital signs dete-riorated; ‘they look at the colours as well as thenumbers, most likely they’ll tell somebody’ (FG F2).However, this also represented high demand on theirtime: ‘whoever is in charge is going to be so busy …
checking their patients’ (FG H3).Of note, some participants developed ‘work-around’
strategies for the recommended chart actions (despitethis reflecting local escalation protocols). On occasionsnon-compliance was described, where abnormal vitalsigns were measured but considered acceptable for theindividual patient; for example, staff ‘fudge it becauseit’s easier to fudge it than do all that rigmarole’ (FGA3). This implied that it was acceptable to falsify anabnormal vital sign, rather than record observationsaccurately and follow recommendations or justifyomissions. To retain a level of control over care of their
patient, one participant explained, ‘If I’ve got...a scorethat tells me to do something, and I don’t think I needto, I’m either going to be confident in my skills andwrite I’ve chosen to do nothing or I’m going to writemy [made-up values] results in the white [graphingarea]’ (FG A3).
Escalating careCommunicating actions recommended by the chart toescalate patient care was also sometimes challengingfor participants, especially when attempting to obtaina response from medical officers. Importantly, medicalstaff attitudes impacted on acceptance of the charts inclinical practice.
Influences of doctorsFor some participants, implementation of the chartwas seen positively as pushing the organisation tochallenge traditional professional boundaries andreporting practices, where ward/junior doctors wereusually the first contact and initial decision makerswhen patient deterioration was identified. While deci-sions to review were protocol-driven, use of rangesrather than exact numbers did obstruct communica-tion, particularly when nurses attempted to obtain aclinical review: ‘trying to tell them what the bloodpressure is, and you can’t give them accurate informa-tion, and that’s what they’re wanting’ (FG I1).On most occasions, doctors insisted exact values be
provided, so the nurse was required to repeat thepatient’s vital sign measurements, which caused frus-tration and increased workload. As a result, ‘a lot ofpeople [are] still writing the numbers (FG D2)’ eventhough participants understood that ‘it defeats thepurpose of what the chart is there for in the firstplace’ (FG I1).
Protocols: permission and autonomyThe incorporation of local site escalation protocolsinto the charts was perceived as empowering for lessexperienced nurses, enabling permission to call forclinical assistance; for example, it ‘certainly gives youa bit more bravery to pick up the phone’ (FG G6). Ofnote, where deterioration was identified, use of thechart reduced the ‘wait and see’ culture reported bysome participants: ‘In the past we might have sat oncertain things to see how it goes, whereas this [chart]says, right do something about it’ (FG A4).Interestingly, given the chart reflected existing local
escalation policies, participants still demonstratedvaried understanding of applying the chart escalationrecommendations in clinical practice. Some thoughtthe requirement to act or not was unclear; others feltthat response to chart recommendations was compul-sory, even when they were confident in making a dif-ferent judgement based on their clinical expertise andknowledge. Some experienced participants, therefore,viewed the charts as curtailing autonomy in decisionmaking, predominantly for nurses but also for doctors.
Original research
70 Elliott D, et al. BMJ Qual Saf 2015;24:65–75. doi:10.1136/bmjqs-2013-002777
on 28 June 2018 by guest. Protected by copyright.
http://qualitysafety.bmj.com
/B
MJ Q
ual Saf: first published as 10.1136/bm
jqs-2013-002777 on 19 Novem
ber 2014. Dow
nloaded from
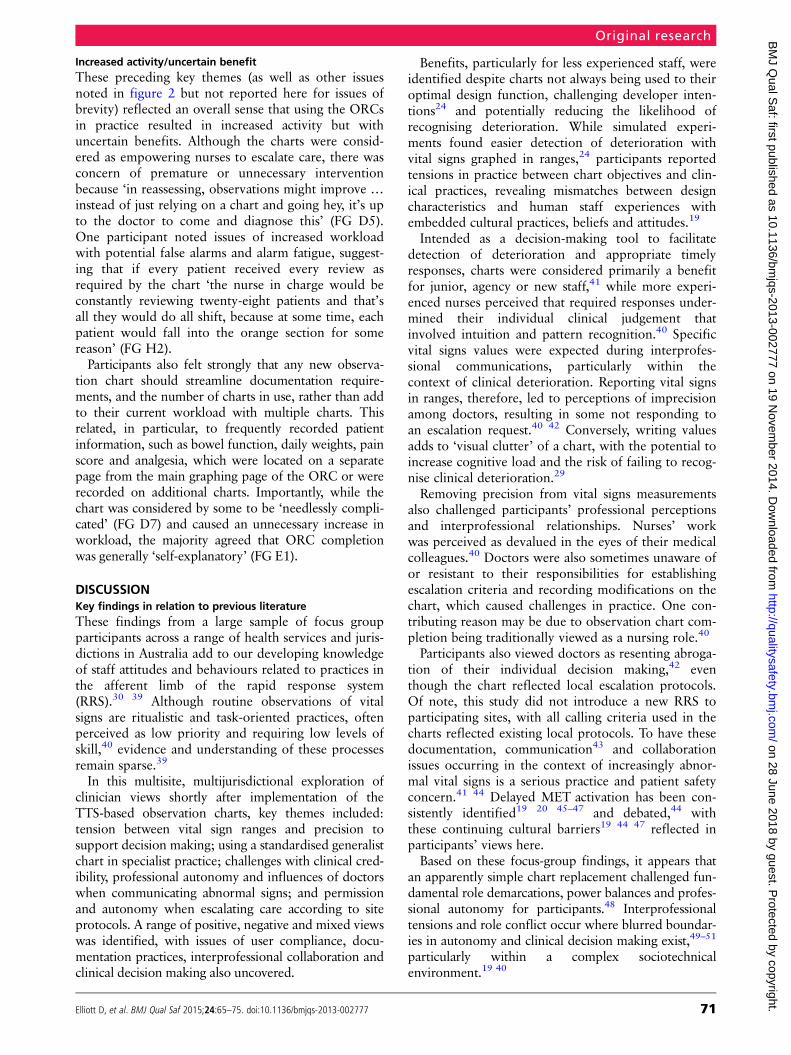
Increased activity/uncertain benefitThese preceding key themes (as well as other issuesnoted in figure 2 but not reported here for issues ofbrevity) reflected an overall sense that using the ORCsin practice resulted in increased activity but withuncertain benefits. Although the charts were consid-ered as empowering nurses to escalate care, there wasconcern of premature or unnecessary interventionbecause ‘in reassessing, observations might improve …
instead of just relying on a chart and going hey, it’s upto the doctor to come and diagnose this’ (FG D5).One participant noted issues of increased workloadwith potential false alarms and alarm fatigue, suggest-ing that if every patient received every review asrequired by the chart ‘the nurse in charge would beconstantly reviewing twenty-eight patients and that’sall they would do all shift, because at some time, eachpatient would fall into the orange section for somereason’ (FG H2).Participants also felt strongly that any new observa-
tion chart should streamline documentation require-ments, and the number of charts in use, rather than addto their current workload with multiple charts. Thisrelated, in particular, to frequently recorded patientinformation, such as bowel function, daily weights, painscore and analgesia, which were located on a separatepage from the main graphing page of the ORC or wererecorded on additional charts. Importantly, while thechart was considered by some to be ‘needlessly compli-cated’ (FG D7) and caused an unnecessary increase inworkload, the majority agreed that ORC completionwas generally ‘self-explanatory’ (FG E1).
DISCUSSIONKey findings in relation to previous literatureThese findings from a large sample of focus groupparticipants across a range of health services and juris-dictions in Australia add to our developing knowledgeof staff attitudes and behaviours related to practices inthe afferent limb of the rapid response system(RRS).30 39 Although routine observations of vitalsigns are ritualistic and task-oriented practices, oftenperceived as low priority and requiring low levels ofskill,40 evidence and understanding of these processesremain sparse.39
In this multisite, multijurisdictional exploration ofclinician views shortly after implementation of theTTS-based observation charts, key themes included:tension between vital sign ranges and precision tosupport decision making; using a standardised generalistchart in specialist practice; challenges with clinical cred-ibility, professional autonomy and influences of doctorswhen communicating abnormal signs; and permissionand autonomy when escalating care according to siteprotocols. A range of positive, negative and mixed viewswas identified, with issues of user compliance, docu-mentation practices, interprofessional collaboration andclinical decision making also uncovered.
Benefits, particularly for less experienced staff, wereidentified despite charts not always being used to theiroptimal design function, challenging developer inten-tions24 and potentially reducing the likelihood ofrecognising deterioration. While simulated experi-ments found easier detection of deterioration withvital signs graphed in ranges,24 participants reportedtensions in practice between chart objectives and clin-ical practices, revealing mismatches between designcharacteristics and human staff experiences withembedded cultural practices, beliefs and attitudes.19
Intended as a decision-making tool to facilitatedetection of deterioration and appropriate timelyresponses, charts were considered primarily a benefitfor junior, agency or new staff,41 while more experi-enced nurses perceived that required responses under-mined their individual clinical judgement thatinvolved intuition and pattern recognition.40 Specificvital signs values were expected during interprofes-sional communications, particularly within thecontext of clinical deterioration. Reporting vital signsin ranges, therefore, led to perceptions of imprecisionamong doctors, resulting in some not responding toan escalation request.40 42 Conversely, writing valuesadds to ‘visual clutter’ of a chart, with the potential toincrease cognitive load and the risk of failing to recog-nise clinical deterioration.29
Removing precision from vital signs measurementsalso challenged participants’ professional perceptionsand interprofessional relationships. Nurses’ workwas perceived as devalued in the eyes of their medicalcolleagues.40 Doctors were also sometimes unaware ofor resistant to their responsibilities for establishingescalation criteria and recording modifications on thechart, which caused challenges in practice. One con-tributing reason may be due to observation chart com-pletion being traditionally viewed as a nursing role.40
Participants also viewed doctors as resenting abroga-tion of their individual decision making,42 eventhough the chart reflected local escalation protocols.Of note, this study did not introduce a new RRS toparticipating sites, with all calling criteria used in thecharts reflected existing local protocols. To have thesedocumentation, communication43 and collaborationissues occurring in the context of increasingly abnor-mal vital signs is a serious practice and patient safetyconcern.41 44 Delayed MET activation has been con-sistently identified19 20 45–47 and debated,44 withthese continuing cultural barriers19 44 47 reflected inparticipants’ views here.Based on these focus-group findings, it appears that
an apparently simple chart replacement challenged fun-damental role demarcations, power balances and profes-sional autonomy for participants.48 Interprofessionaltensions and role conflict occur where blurred boundar-ies in autonomy and clinical decision making exist,49–51
particularly within a complex sociotechnicalenvironment.19 40
Original research
Elliott D, et al. BMJ Qual Saf 2015;24:65–75. doi:10.1136/bmjqs-2013-002777 71
on 28 June 2018 by guest. Protected by copyright.
http://qualitysafety.bmj.com
/B
MJ Q
ual Saf: first published as 10.1136/bm
jqs-2013-002777 on 19 Novem
ber 2014. Dow
nloaded from
These findings, therefore, highlighted factors influ-encing implementation of practice changes in acuteclinical settings.52–54 While practice cultures arestrongly influenced by shared values and beliefs ofprofessional groups such as nurses, doctors and policymakers, there are, nonetheless, differing levels of own-ership and influence on the acceptance of clinicalinitiatives.51 55 56 Findings also demonstrated theimportance of mutual understanding of others’ profes-sional roles, so as to enable effective interdisciplinaryteamwork and communication,57 and the time it maytake to embed these changes into practice.19 58–60
Facilitating an interprofessional collaborative approachfor adopting new policies or procedures requires pro-active engagement of all disciplines at the outset ofthe practice change.40 61
Methodological strengths and limitationsWide implementation of the charts across a number ofsites and considerable participation from staff in focusgroups are study strengths. With the range of hospitaltypes and settings, the common themes identifiedhere may have resonance more widely across acutehealth organisations considering implementation of aTTS-based observation chart.Despite a structured implementation strategy includ-
ing use of site executives as project champions, second-ment of a local site-based project officer and timingchart implementation to coincide with the commence-ment of a new clinical year and term for residentmedical officers, there were difficulties engagingmedical staff, given existing medical education pro-grammes and workload. Even with an extensive educa-tion programme at all sites, health professionals’limited understanding of chart design characteristicsalso hindered acceptance in practice.While this study was conducted in a short timeframe,
implementation of new initiatives to change andimprove practice behaviours may take many years toembed into an organisation’s culture.19 51 62 Similar toother recent smaller, single-site qualitative studies ofthe rapid response system afferent limb,20 63 focusgroup participants were mainly nurses, and findingsmay, therefore, not encapsulate views of all intendeduser groups. Site project officers conducted the focusgroups, which had the potential to influence partici-pant responses.
Implications for practiceWhile charts were designed to specifically improvedetection of deterioration and minimise risk of errorwhen recording vital signs, they also serve other pur-poses in clinical practice; for example, monitoringresponse to treatment, or informing and tailoringtreatment plans. Instances were highlighted where thecharts provided less usage, particularly when precisevalues were essential.
Implementation issues are also highlighted, espe-cially with some experienced nurses and medical staffresisting engagement with this type of practice change.Interdisciplinary conflicts, where role boundaries andresponsibilities between medical and nursing staff con-tinue to exist,64 create barriers to adoption of practicechanges aimed at improving patient safety.19 57 Howdifferent disciplinary cultures respond to documenta-tion such as these charts is important to consider. Asnoted earlier, implementing this type of complexsociocultural intervention may take considerable timeto be culturally accepted. Implementing interprofes-sional training on key design and process characteristics(attempted here, but not successful) would be a pro-gressive step towards improving collaborative practicechanges.65 66 40
The ACSQHC does not recommend local changesto their chart design; specific guidelines are, however,available if alterations are necessary to accommodatelocal protocols and practices.31 Maintaining integrityof these design characteristics is important to augmentrecognition of clinical deterioration. Stakeholders andclinicians should note that chart alterations made con-trary to these guidelines may increase the risk oferrors when recording vital signs, or delaying recogni-tion of clinical deterioration.
Recommendations for further researchOrganisational cultures have significant influence onthe success of rapid response systems.19 57 67
Follow-up evaluations are required to confirm whetherthese initial views of users continue or change withfurther use of the charts. Additional research is alsoessential to develop deeper understandings of howday-to-day clinical environments influence practice cul-tures39 so as to enable a more integrated patient safetyapproach that engages and facilitates interprofessionalcollaboration.
CONCLUSIONThere are two key messages from this study. First, usersreported mixed views on the benefits of these new trackand trigger-based observation charts in practice.Importantly, less experienced nursing staff believed thatthe chart facilitated their decision-making processesduring events of patient deterioration. In these circum-stances, the chart achieved its intended purpose. Withcontinued use in practice, use and acceptance of thecharts with accompanying changes to established prac-tices may result in improved identification and responsesto clinical deterioration in these organisations.Second, these qualitative findings also confirm that
significant barriers continue to exist with practice andcommunication processes around the interfacebetween the afferent and efferent limbs of rapidresponse systems across a range of different organisa-tions. The significant influence of organisational work-based cultures, disciplinary boundaries and
Original research
72 Elliott D, et al. BMJ Qual Saf 2015;24:65–75. doi:10.1136/bmjqs-2013-002777
on 28 June 2018 by guest. Protected by copyright.
http://qualitysafety.bmj.com
/B
MJ Q
ual Saf: first published as 10.1136/bm
jqs-2013-002777 on 19 Novem
ber 2014. Dow
nloaded from

interdisciplinary communication during chart adoptionwas uncovered, with mismatches between designcharacteristics and human staff experiences revealed.Optimal use of all chart design characteristics will bepossible when these broader cultural issues areaddressed. These findings may, therefore, informfuture implementation strategies, enabling optimal useof track and trigger observation chart designs andother rapid response system initiatives within thesecomplex sociotechnical environments.
Acknowledgements We thank the hospital executives of theparticipating sites for supporting the study, and alsoacknowledge the important work of our site-based projectofficers: Ballarat Health Services, Victoria (Ms Angie Spencer,Mr Jason Wiseman); Calvary Wakefield and Calvary NorthHospitals, South Australia (Ms Jane Cleveland, Ms ShelleyRoberts); Eastern Health, Victoria (Dr David Charlesworth,Ms Sam Brean); Lyell McEwin Hospital, South Australia(Ms Cindy Halliwell, Ms Tovah Green); North Shore PrivateHospital, New South Wales (Ms Sue Engle, Ms Dena-LouiseHogben; Ms Sarah Lichenstein); Northern Area Health Service,Tasmania (Ms Sophie Legge); Southern Health, Victoria(Ms Monica Finnigan, Ms Kate Flynn); St Vincent’s Hospital,Melbourne, Victoria (Mr Vince Gaglioti, Ms Caroline Scott);St Vincent’s Hospital, Toowoomba, Queensland (Mr Jeff Potter,Ms SamWard).
Contributors DE led development of the overall study inresponse to the request for tender. SMcK, LP, CD, RI, RG, MF,MR, EA contributed to development of the study methods. DEdirected and EA managed implementation of the study. EAprovided data management. LP and MF led analysis andinterpretation of the findings reported here. All other authorscontributed to this interpretation. DE and EAwrote themanuscript, with contributions from LP, MF, CD, RG, RI,SMcK, MR. All authors approved the final submission.
Funding Australian Commission on Safety and Quality inHealth Care RFT 424/910.
Competing interests None.
Ethics approval Eastern Health Area Health Service HREC,Adelaide Calvary HREC, Lyell McEwin HREC, TasmaniaNorthern Area Health Service HREC, North Shore PrivateHREC, Monash Medical Centre HREC, St Vincents PrivateMelbourne HREC, St Vincents Public Toowoomba HREC,Ballarat Health Services HREC.
Provenance and peer review Not commissioned; internally peerreviewed.
Data sharing statement Unpublished data from the overallproject is accessible to the Australian Commission on Safety andQuality in Health Care and participating sites have access todata collected at the sites through the first and second author,or UTS Health Faculty.
REFERENCES1 Australian Commission on Safety and Quality in Health Care.
National safety and quality health service standards. Sydney:ACSQHC, 2012.
2 National Institute for Health and Clinical Excellence. Acutelyill patients in hospital: recognition of and response to acuteillness in adults in hospital. London: NICE, 2007.
3 Berwick DM, Calkins DR, McCannon CJ, et al. The 100,000lives campaign: setting a goal and a deadline for improvinghealth care quality. JAMA 2006;295:324–7.
4 Kause J, Smith G, Prytherch D, et al. A comparison ofAntecedents to Cardiac Arrests, Deaths and EmergencyIntensive care Admissions in Australia and New Zealand, and
the United Kingdom—the ACADEMIA study. Resuscitation2004;62:275–82.
5 Hillman KM, Bristow PJ, Chey T, et al. Antecedents to hospitaldeaths. Intern Med J 2001;31:343–8.
6 Australian Commission on Safety and Quality in Health Care.National consensus statement: essential elements forrecognising and responding to clinical deterioration. Sydney:ACSQHC, 2010.
7 Jones S, Mullally M, Ingleby S, et al. Bedside electroniccapture of clinical observations and automated clinical alerts toimprove compliance with an Early Warning Score protocol.Crit Care Resusc 2011;13:83–8.
8 Bellomo R, Ackerman M, Bailey M, et al. A controlled trial ofelectronic automated advisory vital signs monitoring in generalhospital wards. Crit Care Med 2012;40:2349–61.
9 Australian Commission on Safety and Quality in Health Care[ACSQHC]. A guide to support implementation of the nationalconsensus statement: essential elements for recognising andresponding to clinical deterioration. Sydney: ACSQHC, 2011.
10 Cahill H, Jones A, Herkes R, et al. Introduction of a newobservation chart and education programme is associated withhigher rates of vital-sign ascertainment in hospital wards. BMJQual Saf 2011;20:791–6.
11 Mitchell IA, McKay H, Van Leuvan C, et al. A prospectivecontrolled trial of the effect of a multi-faceted intervention onearly recognition and intervention in deteriorating hospitalpatients. Resuscitation 2010;81:658–66.
12 Hughes C, Pain C, Braithwaite J, et al. ‘Between the flags’:implementing a rapid response system at scale. BMJ Qual Saf2014;23:714–17.
13 Van Leuvan C, Mitchell IA. Missed opportunities? Anobservational study of vital sign measurements. Crit CareResusc 2008;10:111–15.
14 Crispin C, Daffurn K. Nurses’ responses to acute severe illness.Aust Crit Care 1998;11:131–3.
15 Ludikhuize J, Smorenburg SM, de Rooij SE, et al.Identification of deteriorating patients on general wards;measurement of vital parameters and potential effectiveness ofthe Modified Early Warning Score. J Crit Care 2012;27:424.e7–13.
16 Hands C, Reid E, Meredith P, et al. Patterns in the recording ofvital signs and early warning scores: compliance with a clinicalescalation protocol. BMJ Qual Saf 2013;22:719–26.
17 Smith GB, Osgood VM, Crane S. ALERT™—amultiprofessional training course in the care of the acutely illadult patient. Resuscitation 2002;52:281–6.
18 Bucknall TK, Jones D, Bellomo R, et al. Responding tomedical emergencies: System characteristics under examination(RESCUE). A prospective multi-site point prevalence study.Resuscitation 2013;84:179–83.
19 Shearer B, Marshall S, Buist MD, et al. What stops hospitalclinical staff from following protocols? An analysis of theincidence and factors behind the failure of bedside clinical staffto activate the rapid response system in a multi-campusAustralian metropolitan healthcare service. BMJ Qual Saf2012;21:569–75.
20 Massey D, Chaboyer W, Aitken L. Nurses’ perceptions ofaccessing a Medical Emergency Team: a qualitative study. AustCrit Care 2014;27:133–8.
21 Chatterjee MT, Moon JC, Murphy R, et al. The “OBS” chart:an evidence based approach to re-design of the patientobservation chart in a district general hospital setting. Post MedJ 2005;81:663–6.
Original research
Elliott D, et al. BMJ Qual Saf 2015;24:65–75. doi:10.1136/bmjqs-2013-002777 73
on 28 June 2018 by guest. Protected by copyright.
http://qualitysafety.bmj.com
/B
MJ Q
ual Saf: first published as 10.1136/bm
jqs-2013-002777 on 19 Novem
ber 2014. Dow
nloaded from

22 Christofidis MJ, Hill A, Horswill MS, et al. Observation chartswith overlapping blood pressure and heart rate graphs do notyield the performance advantage that health professionalsassume: an experimental study. J Adv Nurs 2014;70:610–24.
23 McDonnell A, Tod A, Bray K, et al. A before and after studyassessing the impact of a new model for recognizing andresponding to early signs of deterioration in an acute hospital.J Adv Nurs 2013;69:41–52.
24 Preece MH, Hill A, Horswill MS, et al. Supporting thedetection of patient deterioration: Observation chart designaffects the recognition of abnormal vital signs. Resuscitation2012;83:111.
25 Kyriacos U, Elsma J, Jordan S. Monitoring vital signs usingearly warning scoring systems: a review of the literature. J NursManag 2011;19:311–30.
26 Bunkenborg G, Samuelson K, Poulsen I, et al. Lower incidenceof unexpected in-hospital death after interprofessionalimplementation of a bedside track-and-trigger system.Resuscitation 2014;85:424–30.
27 Fullerton JN, Price CL, Silvey NE, et al. Is the Modified EarlyWarning Score (MEWS) superior to clinician judgement indetecting critical illness in the pre-hospital environment?Resuscitation 2012;83:557–62.
28 Alam N, Hobbelink EL, van Tienhoven AJ, et al. The impactof the use of the Early Warning Score (EWS) on patientoutcomes: a systematic review. Resuscitation 2014;85:587–94.
29 Christofidis MJ, Hill A, Horswill MS, et al. A human factorsapproach to observation chart design can trump healthprofessionals’ prior chart experience. Resuscitation2013;84:657–65.
30 DeVita MA, Smith GB, Adam SK, et al. "Identifying thehospitalised patient in crisis"–a consensus conference on theafferent limb of rapid response systems. Resuscitation2010;81:375–82.
31 Australian Commission on Safety and Quality in Health Care.Observation and response charts. Sydney: AustralianCommission on Safety and Quality in Health Care, 2013.
32 Elliott D, McKinley S, Perry L, et al. Clinical utility of anobservation and response chart with human factors designcharacteristics and a track and trigger system: study protocolfor a two-phase multisite multiple-methods design. JMIR ResProtoc 2014;3:e40.
33 Preece MH, Hill A, Horswill MS, et al. Applying heuristicevaluation to observation chart design to improve thedetection of patient deterioration. Appl Ergon 2013;44:544–56.
34 Preece MHW, Hill A, Horswill MS, et al. Designingobservation charts to optimize the detection of patientdeterioration: Reliance on the subjective preferences ofhealthcare professionals is not enough. Aust Crit Care2012;25:238–52.
35 Gibbs G. Analyziing qualitative data. London: Sage, 2007.36 Lichtman M. Qualitative research in education: a user’s guide.
Thousand Oaks, California: Sage, 2010.37 Brodie P, Irving K. Assessment in work-based learning:
investigating a pedagogical approach to enhance studentlearning. Assess Eval Higher Educ 2007;32:11–19.
38 National Health and Medical Research Council, AustralianResearch Council, Australian Vice-Chancellor’s Committee.National statement on ethical conduct in human research.NHMRC, 2007.
39 Odell M. Detection and management of the deteriorating wardpatient: an evaluation of nursing practice. J Clin Nurs 2014;in press.
40 Odell M, Victor C, Oliver D. Nurses’ role in detectingdeterioration in ward patients: systematic literature review.J Adv Nurs 2009;65:1992–2006.
41 Astroth KS, Woith WM, Stapleton SJ, et al. Qualitativeexploration of nurses’ decisions to activate rapid responseteams. J Clin Nurs 2013;22:2876–82.
42 Andrews T, Waterman H. Packaging: a grounded theory of howto report physiological deterioration effectively. J Adv Nurs2005;52:473–81.
43 Endacott R, Kidd T, Chaboyer W, et al. Recognition andcommunication of patient deterioration in a regional hospital:a multi-methods study. Aust Crit Care 2007;20:100–5.
44 Buist M. The rapid response team paradox: why doesn’tanyone call for help? Crit Care Med 2008;36:634–6.
45 Guinane JL, Bucknall TK, Currey J, et al. Missed medicalemergency team activations: tracking decisions and outcomesin practice. Crit Care Resusc 2013;15:266–72.
46 Cretikos M, Chen J, Hillman K, et al. The objective medicalemergency team activation criteria: a case–control study.Resuscitation 2007;73:62–72.
47 Jones D, Baldwin I, McIntyre T, et al. Nurses’ attitudes to amedical emergency team service in a teaching hospital. QualSaf Health Care 2006;15:427–32.
48 Williams DJ, Newman A, Jones C, et al. Nurses’ perceptions ofhow rapid response teams affect the nurse, team and system.J Nurs Care Qual 2011;26:265–72.
49 Muller-Juge V, Cullati S, Blondon KS, et al. Interprofessionalcollaboration on an internal medicine ward: role perceptionsand expectations among nurses and residents. PLoS ONE2013;8:e57570.
50 Snelgrove S, Hughes D. Interprofessional relations betweendoctors and nurses: perspectives from South Wales. J Adv Nurs2000;31:661–67.
51 Braithwaite J, Hyde P, Pope C, eds. Culture and climate inhealth care organisations. Basingstoke, UK: PalgraveMacMillan, 2010.
52 Bergstrom J, Dekker S, Nyce JM, et al. The social process ofescalation: a promising focus for crisis management research.BMC Health Serv Res 2012;12:1–7.
53 Gregory DM, Way CY, Barrett BJ, et al. Predictors of perceivedhealth care quality for registered nurses during and after healthcare reform. Health Care Manage Rev 2010;35:301–1.
54 Leach LS, Kagawa F, Mayo A, et al. Improving patient safety toreduce preventable deaths: the case of a California safety nethospital. J Healthc Qual 2012;34:64–76.
55 Hills D. Assessing and changing a practice culture. J Med PractManage 2011;27:21–5.
56 Cioffi J. Nurses’ experiences of making decisions to call emergencyassistance to their patients. J Adv Nurs 2000;32:108–14.
57 Mackintosh N, Rainey H, Sandall J. Understanding howrapid response systems may improve safety for the acutely illpatient: learning from the frontline. BMJ Qual Saf 2012;21:135–44.
58 Nancarrow SA, Booth A, Ariss S, et al. Ten principles ofgood interdisciplinary team work.Hum Resour Health2013;11:1–11.
59 Derbyshire JA, Machin AI. Learning to work collaboratively:Nurses’ views of their pre-registration interprofessionaleducation and its impact on practice. Nurse Educ Pract2011;11:239–44.
60 Firth-Couzens J. Cultures for improving patient safety throughlearning: the role of teamwork. Qual Health Care 2001;10(Suppl II):ii26–31.
Original research
74 Elliott D, et al. BMJ Qual Saf 2015;24:65–75. doi:10.1136/bmjqs-2013-002777
on 28 June 2018 by guest. Protected by copyright.
http://qualitysafety.bmj.com
/B
MJ Q
ual Saf: first published as 10.1136/bm
jqs-2013-002777 on 19 Novem
ber 2014. Dow
nloaded from

61 Interprofessional Education Collaborative. Core competenciesfor interprofessional collaborative practice. Association ofAmerican Medical Colleges, 2011.
62 Winters BD, Pronovost PJ. Rapid response systems: shouldwe still question their implementation? J Hosp Med2013;8:278–1.
63 Chua WL, Mackey S, Ng EK, et al. Front line nurses’experiences with deteriorating ward patients: a qualitativestudy. Int Nurs Rev 2013;60:501–9.
64 Ryan A, McKenna HP. A comparative study of the attitudes ofnursing and medical students to aspects of patient care and thenurse’s role in organising that care. J Adv Nurs 1994;19:114–23.
65 Hawala-Druy S, Hill MH. Interdisciplinary: Culturalcompetency and culturally congruent education formillennials in health professions. Nurse Educ Today2012;32:772–78.
66 Sehgal NL, Fox M, Vidyarthi AR, et al. A multidisciplinaryteamwork training program: The Triad for OptimalPatient Safety (TOPS) experience. J Gen Intern Med2008;23.
67 Benin AL, Borgstrom CP, Jenq GY, et al. Defining the impactof a rapid response team: qualitative study with nurses,physicians and hospital administrators. BMJ Qual Saf2012;21:391–98.
Original research
Elliott D, et al. BMJ Qual Saf 2015;24:65–75. doi:10.1136/bmjqs-2013-002777 75
on 28 June 2018 by guest. Protected by copyright.
http://qualitysafety.bmj.com
/B
MJ Q
ual Saf: first published as 10.1136/bm
jqs-2013-002777 on 19 Novem
ber 2014. Dow
nloaded from