origin of modern syphilis and emergence of a pandemic ... · origin of modern syphilis and...
TRANSCRIPT
In the format provided by the authors and unedited.
1
Origin of modern syphilis and emergence of a pandemic Treponema pallidum cluster
Natasha Arora, Verena J. Schuenemann, Günter Jäger, Alexander Peltzer, Alexander Seitz, Alexander Herbig, Michal Strouhal, Linda Grillová, Leonor Sánchez-Busó, Denise Kühnert, Kirsten I. Bos, Leyla
Rivero Davis, Lenka Mikalová, Sylvia Bruisten, Peter Komericki, Patrick French, Paul R. Grant, María A. Pando, Lucía Gallo Vaulet, Marcelo Rodríguez Fermepin, Antonio Martinez, Arturo Centurion Lara,
Lorenzo Giacani, Steven J. Norris David Šmajs, Philipp P. Bosshard, Fernando González-Candelas, Kay Nieselt, Johannes Krause and Homayoun C. Bagheri
Supplementary Information
Table of Contents Supplementary Methods ................................................................................................................ 2 1: Sample collection ........................................................................................................................ 2 2: Library preparation ..................................................................................................................... 2 3: Genome-wide enrichment and sequencing ............................................................................... 3 4: Sequencing analyses and genome reconstruction ..................................................................... 3 5: Recombination detection ........................................................................................................... 6 6: Genome-wide variation and phylogenetic analyses ................................................................... 7 7: Clade classification ...................................................................................................................... 8 8: Antibiotic resistance ................................................................................................................. 10 Supplementary Tables .................................................................................................................. 11 Supplementary Figures ................................................................................................................. 17
© 2016 Macmillan Publishers Limited, part of Springer Nature. All rights reserved.
SUPPLEMENTARY INFORMATIONARTICLE NUMBER: 16245 | DOI: 10.1038/NMICROBIOL.2016.245
NATURE MICROBIOLOGY | www.nature.com/naturemicrobiology 1
Supplementary Methods
1: Sample collection Natasha Arora, Michal Strouhal, Linda Grillova, Lenka Mikalová, Sylvia Bruisten, Peter Komericki, Patrick French,
Paul R. Grant, María A. Pando, Lucía Gallo Vaulet, Marcelo Rodríguez Fermepin, Antonio Martinez, Arturo
Centurion Lara, Lorenzo Giacani, Steven J. Norris, David Šmajs, Fernando González-Candelas and Philipp P.
Bosshard
Samples from 64 syphilis infections, 5 yaws infections and 1 bejel infection were collected from
numerous countries across the globe (Supplementary Table 1). Syphilis infection samples were
classified as either clinical, if obtained from patients directly, or as laboratory strains, if passaged
in rabbits after isolation from patients. Clinical samples were obtained after swabbing lesions
from patients at sexual health clinics, dermatological clinics or hospitals. Flocked swabs (from
Copan Diagnostics, Brescia, Italy) or Nylon swabs were used according to local laboratory
instructions. Laboratory strains were obtained as DNA extracts from Masaryk University (Brno,
Czech Republic) and the University of Washington (Seattle, USA). Two DNA extracts (NIC-1
and NIC-2) correspond to syphilis specimens obtained from the cerebrospinal fluid of a patient in
1912 1,2
, but were propagated for different time periods in rabbits in Houston (NIC-1) and Seattle
(NIC-2).
2: Library preparation Natasha Arora and Verena Schuenemann
DNA extractions were carried out in the participating laboratories using in-house protocols. At
the University of Zurich the QIAmp DNA mini kit and QIAmp DNA blood min kit (Qiagen)
were used following the manufacturer’s protocols.
All library preparations were conducted at the University of Tübingen. The DNA from the
extracts was sheared to produce fragments with a mean of 350 bp (between 300 - 400 bp with a
Gaussian distribution) using the Covaris S220 instrument, specifying the following conditions: 5
intensity 200 cycles per burst, 45s. After shearing, the samples were concentrated to 30 μl each
with the Amicon ultra centrifugal filters (Millipore), following the manufacturer’s instructions.
For each sheared DNA sample, as well as for two negative controls, double-indexed libraries
were prepared following a modified Illumina protocol for ancient DNA 3,4
Adaptor ligation to the
fragments was assessed through a quantification assay with the primers IS7 and IS84, using the
reagents the DyNAmo Flash SYBR Green qPCR Kit (Biozym) and the Lightcycler 480 (Roche).
Following library preparation, amplification reactions with unique combination of P5 and P7
primers were used to double index each sample with established protocols 3. Extraction and
library blanks were treated accordingly. In a second set of amplification reactions the primers
IS5 and IS6 were used because of their priming activity on the library indices 4. This
amplification was performed for all indexed libraries in 100µl reactions containing 5 µl library
template, 4 units AccuPrime Taq DNA Polymerase High Fidelity (Invitrogen), 1 unit 10X
AccuPrime buffer (containing dNTPs) and 0.3 µM IS5 and IS6 primers 4. The following thermal
profile was used: 2-min initial denaturation at 94°C, followed by 4 to 17 cycles consisting of 30-
sec denaturation at 94°C, a 30-sec annealing at 60°C and a 2-min elongation at 68°C and a 5-min
final elongation at 68°C.
3: Genome-wide enrichment and sequencing Natasha Arora, Kirsten I. Bos, Verena Schuenemann
Array design and capture hybridization
Genome-wide enrichment for Treponema pallidum subsp. pallidum was carried out through
capture hybridization on arrays. Probes with 60 bp length and 24 bp tiling density were designed
using modified in-house software 5. The probes were based on two reference genomes (Nichols,
GenBank CP004010.2/ RefSeq NC_021490.2, and SS14, GenBank CP000805.1/ RefSeq
NC_010741.1). Only unique probes were kept, with a total 830,566 probes. Two rounds of
capture hybridization with the designed probes were performed on a 1 million Agilent SureSelect
arrays following the protocol detailed by Hodges et al.6. Equimolar pools of the amplified
libraries were enriched on 6 arrays. After the first round of hybridization, captured products were
eluted in 490 µl H2O, quantified via qPCR as previously described and amplified in 100 µl
reactions using 24 µl template, 4 units of AccuPrime Pfx DNA polymerase (Invitrogen), 1 unit of
10 AccuPrime buffer (containing dNTPs) and 0.3 µM of the primer IS5 and IS6 4 and the
following thermal profile: a 2-min initial denaturation at 95°C, 7 to 17 cycles consisting of 15
sec denaturation at 95°C, a 30-sec annealing at 60°C and a 2-min elongation at 68°C, followed
by a 5-min final elongation at 68°C. The amplified library pools were purified using MinElute
columns (Quiagen) and the concentrations were determined using an Agilent 2100 Bioanalyzer
DNA 1000 chip. For the second round of enrichment, two pools were combined and the second
round was performed on 3 arrays total. After the second hybridization the captured products
were eluted in 490 µl H2O and processed as previously described with following modification:
48 µl template was used in the amplification. After the final quantification the pools were diluted
to 10nM for high-throughput sequencing.
High-throughput sequencing
Following capture hybridization, paired-end dual index sequencing was conducted on an
Illumina Hiseq 2500 platform by 2*100+7+7 cycles using the manufacturer’s protocols for
multiplex sequencing (TruSeq PE Cluster Kit v3-cBot-HS).
4: Sequencing analyses and genome reconstruction Günter Jäger, Alexander Peltzer, Alexander Seitz, Alexander Herbig and Kay Nieselt
We applied EAGER 7, our own developed pipeline for read pre-processing, mapping, variant
identification and genome reconstruction, to all sequenced samples. In the following we describe
each of the steps performed using EAGER in detail.
Read preprocessing of sequenced genome samples
The sequenced products for all samples were paired-end reads with a varying number of
overlapping nucleotides between corresponding forward and reverse reads. Several pre-
processing steps were necessary such as adapter clipping, merging of corresponding paired-end
reads in the overlapping regions and finally quality trimming of the resulting reads.
To remove sequencing adapters from the paired-end reads an overlap alignment of the respective
adapter with the 3’ end of each forward and reverse read was produced. Regions at the 3’ end of
each read that were contained in the alignment were clipped. Reads that contained only adapters
or that were shorter than 30 nucleotides after adapter clipping were removed. This procedure
resulted in three kinds of remaining reads: forward reads that did not have a corresponding
reverse read, reverse reads that did not have a corresponding forward read, and matching forward
and reverse reads that could be used in the merging process.
Merging was performed for all paired-end reads with a minimum overlap of 10 nucleotides and
at most 5% mismatches in the overlap region with our Clip&Merge tool implemented in
EAGER. In detail, the maximal overlap fulfilling these criteria was selected and nucleotides in
the overlap regions were chosen from the read with the best PHRED quality score to build the
consensus sequence. With this strategy the quality of the nucleotides in the overlap regions is
maximized. For all properly merged reads, only the merged consensus sequence was used for the
subsequent mapping steps. On average about 60% of all paired-end reads were merged in each
sample (see Supplementary Table 2 for detailed results of all samples).
For those read pairs that could not be merged because the overlap region was shorter than 10
nucleotides or for which the corresponding read was removed during the adapter clipping step,
the respective single-end reads were first trimmed at the 3’end such that all bases have a phred
quality score of at least 20 and then mapped individually.
Mapping
After adapter clipping, merging and quality trimming, the resulting reads for all samples were
mapped using the Nichols genome (RefSeq NC_021490.2) as a reference. All reads (merged and
unmerged) were treated as single-end reads and mapping was performed using the BWA-MEM
algorithm 8 with default parameters.
Mapping assembly
After mapping the reads of each strain to the reference Nichols genome, the Genome Analysis
Toolkit (GATK) 9 was used to generate a mapping assembly for each strain that had at least 80%
genome coverage and a minimum of 3 reads per base. For this procedure, the UnifiedGenotyper
module of GATK was applied to call reference bases and variants from the mapping. The
reference base was called if the genotype quality of the call was at least 30, the position was
covered by at least 3 reads and at least 90% of the bases at this position agreed with the
reference. A variant position (SNP) was called if the following criteria were met: i) the position
was covered by at least 3 reads; ii) the genotype quality of the call was at least 30 and iii) the
minimum SNP allele frequency was 90%. If neither of the requirements for a reference base call
nor the requirements for a variant call were met, the character ’N’ was inserted at the respective
position. To keep the potential introduction of too many 'N' characters as low as possible in the
case of low coverage genomes, in cases where a position had a coverage between 3-9 reads, the
major allele was called if it was found in all but 1 read.
For the generation of draft genome sequences we used an in-house tool (VCF2Genome), which
reads a VCF file such as produced by the GATK UnifiedGenotyper and incorporates for each
row, and thus for each call, one nucleotide into the new draft sequence.
Processing of published genomes
In order to apply our analysis pipeline also to those samples for which complete genomic
sequences are available in GenBank (Supplementary Table 3), we produced artificial reads in
these cases using an in-house tool (Genome2Reads).
In a tiling approach, we produced full genome reads of length 100 nucleotides with a tiling offset
of 1, resulting in an average coverage of 100X. For the resulting samples we applied the same
mapping, SNP calling and genome reconstruction procedure as for the sequenced samples in
order to obtain consistent and comparable results. Furthermore, using this approach, we had
comparable genome sequences without the need to first multiple-align them before the
phylogenetic reconstruction.
SNP effect analysis
The genetic effect of each of the SNPs occurring in at least one strain was analysed using snpEff 10
. We used an annotation database of T. p. pallidum (Nichols) built from the genomic annotation
(the respective gff file was retrieved from NCBI). These annotations include protein-coding
genes as well as non-coding RNAs and pseudogenes. The up-/downstream region size parameter
for reporting SNPs that are located upstream or downstream of protein-coding genes was set to
100 nt. For all other parameters default values were used. The results were used to compile a
table providing information on the genetic effect for each in the strains in which the SNP occurs.
De novo Assembly
We implemented a de novo assembly pipeline in order to investigate whether the genomes of the
sequenced samples had undergone substantial genomic rearrangements and to show any large
deletions or insertions in comparison with the two reference genomes Nichols and SS14.
We started with the merged reads and in the first step used the short read assembler software
SOAPdenovo2 using ten different k-mer sizes (k = 37 + i10, i=0,…,9). The reason for using
different k-mer sizes is that merging the read pairs into one single read results in very different
lengths (between 30 and 190 bases). Next, all input reads were mapped back against the resulting
contigs using BWA-MEM 8. Contigs that were not supported by any reads (no read mapped
against these contigs) were removed. In order to assemble the contigs resulting from the different
k-mers, the remaining contigs were subject to the overlap-based String Graph Assembler (SGA) 11
. Finally, contigs smaller than 1,000 bp were removed before these contigs were mapped
against the Nichols reference genome for comparison of genome architectures.
Results: All clinical samples were enriched through an array-based approach. High-throughput
sequencing revealed between 0.48 and 100.4 million reads per sample (Supplementary Table 2).
Between 1,552 and 27,705,454 chromosomal reads mapped to the Nichols reference genome
resulting in mean coverage estimates of 0.13 to more than 2000-fold average. We also included
two negative controls into the genome-wide sequencing process to study. Only 0.15% and 0.2%
of the Nichols reference genome was covered by 2,734 reads and 3,612 of the two negative
samples, respectively.
SNP positions were identified for the set of 28 sequenced samples with a minimum of 80%
genomic coverage with a read depth of at least 3 (highlighted in Supplementary Table 2). To
further study genomic diversity in TPA, we included, additionally to the Nichols reference
sample, 10 published full genomes of Treponema pallidum (Supplementary Table ). The
sequences of the 28 reconstructed genomes of the sequenced samples, the 10 published genomes
and the Nichols reference genome were then subjected to phylogenetic analyses (see section 6).
To investigate conservation of structure and gene order in the genomes, in addition to the
mapping assembly, we also performed a de novo assembly for the 5 samples with highest
coverage (see Supplementary Table 5): 4 clinical samples from syphilis infections (CZ27, NE17,
NE20 and AU15) and one laboratory strain from a yaws infection (IND1) (see Fig. 1a). To
extrapolate the genome architecture of each sample, we compared the contigs of each assembled
genome with the Nichols reference genome. For all five samples we achieved a genome
coverage of more than 93%. Many of the gaps between contigs in the clinical genome sequences
are linked to repetitive regions, including notoriously difficult to assemble tpr genes and rRNA
operons in the reference Nichols genome (Fig. 1a), comprising approximately 8% of the genome.
Our analyses showed that the genomes of CZ27, NE17, NE20 and AU15 display no major
rearrangements, while there are a few very small inversions in the genome of IND1. Interestingly
IND1 also shows a deletion of the TP1030 gene, a tpr family gene that potentially encodes a
virulence factor 12
. We confirmed this deletion by the mapping assembly of the individual reads
against Nichols reference genome. Additionally, we also identified this deletion in the other
samples obtained from yaws infections (data not shown).
Analyses to detect recombinants and reconstruct evolutionary relationships using genome-wide
variation were conducted for the 28 sequenced samples meeting our genome-wide coverage
criteria (highlighted in Supplementary Table 2) as well as the 11 published genomes
(Supplementary Table 3). Across the 39 whole genomes and draft genomes, 31 were TPA, 8 TPE
and 1 TEN.
5: Recombination detection Leonor Sánchez-Busó, Natasha Arora, and Fernando González-Candelas
The bacterium Treponema pallidum is considered a clonal species 2,13
and so far recombination
has not been explored in detail in this pathogen. Nonetheless, a few studies show evidence for
potential recombination 14,15
. We used the phylogenetic method described by Sánchez-Busó et al. 16
, to identify putative recombinant genes in the TPA, TPE and TEN genomes (n= 39). This
method was preferred over others because it offers a conservative approach and is expected to
result in a lower number of false positives. Genes are selected as putative recombinants if they
satisfy three criteria. The first criterion is an elevated level of genetic diversity compared to
background levels. This criterion is the basis for some methods including Gubbins and
ClonalFrameML 17,18
. However, elevated diversity levels could result from recombination or
represent “assembly or alignment errors, mutational hotspots or regions of the genome with
relaxed selection” (Gubbins user manual). To mitigate the effect of such false positives, the
Sánchez-Busó et al. method requires the fulfilment of two additional criteria: i) that these regions
contain enough phylogenetic signal so as to provide a reliable phylogenetic reconstruction, as
this reconstruction is used in the next step; ii) evidence for a non-vertical pattern of genetic
transmission by reciprocal lack of congruence between the reference phylogeny and the putative
recombinant gene (the complete alignment rejects the single gene tree and the gene alignment rejects the
reference phylogeny). For stringency purposes, we incorporated a fourth criterion, marking as
putative recombinants only those genes for which the pattern of mutations made it less likely that
the first two criteria could be due to higher mutation rates. We selected genes displaying
identical mutational patterns in consecutive polymorphic sites in divergent branches of the tree
(homoplasies). Tests for homoplasy are the basis for other recombination detection methods 17,19
.
To select genes satisfying the first criterion of elevated diversity levels, we initially computed an
expected substitution rate by dividing the total number of observed SNPs in the 978 annotated
genes (n=2,098) by the total length of the concatenate of these genes (1,046,421 bp). This rate
was then used to calculate the expected number of polymorphisms per gene according to its
length. These calculations were performed in R by first extracting the number of SNPs using the
seg.sites function in the ape. A total of 87 genes displayed at least twice the expected number of
polymorphisms. Next, to select genes satisfying the second criterion, for each of these 87 genes,
and for the draft genome alignment, we used RAxML (GTR model) to generate maximum-
likelihood trees. Each of the gene tree topologies were tested against the maximum likelihood
tree topology of the draft genome in TREE-PUZZLE v5.2 20,21
. Genes for which both the
Expected Likelihood Weight 22
and the Shimodaira-Hasegawa 23
test rejected the genome tree
topology (p < 0.05) and the complete genome alignment rejected the single gene topology
(reciprocal incongruence) were examined more closely to select those satisfying the third
criterion. We inspected the resulting genes for the presence of identical mutations in samples
which do not share a direct common ancestor (homoplasies), as these can be indicative of
recombination. Homoplastic sites were detected by mapping the observed SNPs onto the genome
tree topology using Mesquite v3.04 and performing ancestral state reconstruction using
parsimony. Results were parsed using R to obtain a curated list of branches in which the same
SNP was predicted to have happened. As a conservative threshold, and to exclude homoplasies
that may have arisen through high mutation rates, we selected genes that had a more than 4
homoplasies in at least 2 branches of the tree (Supplementary Table 6). We compared the results
to those obtained using the methods implemented in Gubbins 17
and ClonalFrameML 18
(Supplementary Table 7).
6: Genome-wide variation and phylogenetic analyses
Natasha Arora, Fernando González-Candelas, Denise Kühnert and Kay Nieselt
Molecular clock tests
The molecular clock hypothesis was tested with MEGA 6.0 24
through comparisons of the
maximum likelihood values for “the given topology with and without the molecular clock
constraints”. Tests were conducted for all TPA, TPE and TEN genomes (39 samples), for the i)
multiple whole genome alignment excluding the 4 putative recombinant genes (600,087
positions after removing sites with missing data), and ii) for the alignment for all variable
positions excluding the 4 putative recombinant genes (2,235 positions including sites with
missing data, and 630 positions after removing sites with missing data). The model used was the
GTR model with a discrete gamma distribution. Results: The molecular clock hypothesis was
rejected at the 5% significance level.
Phylogenetic trees, coalescence estimation and networks
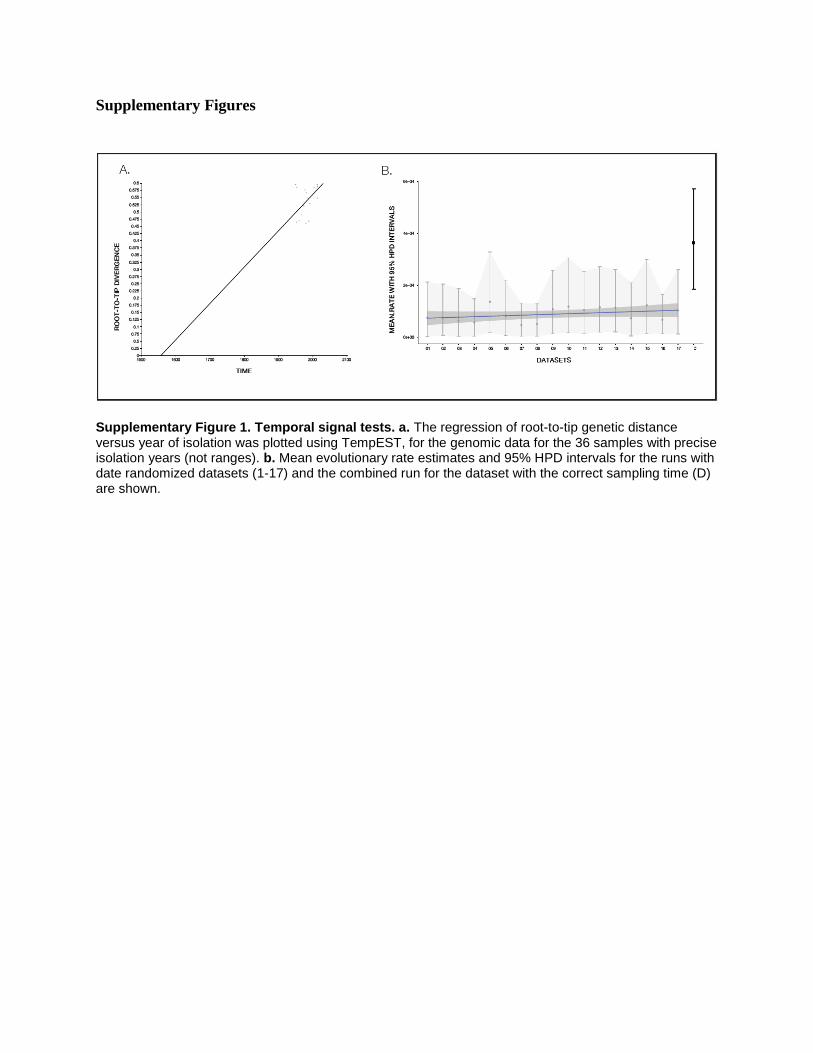
To examine the degree of temporal signal in the samples, we used TempEst v.1.5 25
to carry out a
regression analysis on the root-to-tip genetic distance versus the year of isolation (Supplementary
Fig. 1A). This method assesses the temporal signal under the assumption of a strict molecular
clock, therefore a linear trend with “greater scatter from the regression line suggests a relaxed
molecular clock model may be most appropriate” 25
. We obtained a positive linear relationship
(R2
=0.395, correlation coefficient = 0.629, residual mean squared = 0.001).
Bayesian phylogenetic trees were produced in BEAST 2.3 26
for the 28 sequenced samples and
the 11 published samples. We compared the trees generated with the alignment of all variable
positions in the TPA, TPE and TEN genomes (2,506) and the tree generated with the set of
variable positions after excluding the 4 putative recombinant genes (2,235 positions).
Additionally, rooted trees were generated with Maximum Parsimony by including Treponema
paraluiscuniculi (NC_015714) as the outgroup.
As a calibration for the BEAST trees we used tip dates, that is, the isolation years of all samples.
When not known with precision, we provided a range (for NIC_REF, NIC1, NIC2, and GAU).
The two demographic models (coalescent tree prior under Constant Size and the Birth-Death
Serial Skyline model (BDSS)) resulted in consistent parameter estimates. The relaxed clock
model was chosen over the strict clock model based on marginal likelihood estimates obtained
with PathSampler 26,27
. We carried out replicate BDSS model runs with the following
specifications: uncorrelated lognormal relaxed clock-clock model, GTR plus gamma substitution
model, 100 million generations with parameter sampling every 10,000 generations. After
assessing convergence and suitable burn-in percentages with Tracer 1.6 28
, we combined 5 runs
using LogCombiner 2.4 26
, which resulted in a total of 450 million generations. We report
parameter estimates for the combined runs, with ESS values above 1800 (for the mean
evolutionary rate, ESS was 2088). TreeAnnotator 2.4 26
was then used to produce the annotated
maximum clade credibility tree, which was visualised and formatted with Figtree 1.4.2 29
.
Because TPA samples are the focus of this study and therefore more extensively sampled, we
report mean evolutionary rate and divergence estimates for the TPA lineage. The mean
evolutionary rate estimate obtained is in line with the number of mutations that differed between
the samples NIC_REF and NIC 2 (n=15), which were isolated 15-20 years apart following
continuous rabbit propagation. To confirm the temporal signal in the data is sufficient, we also
re-estimated the evolutionary rate in runs with date randomised data sets 30,31
. As shown in
Supplementary Fig. 1B, the mean evolutionary rate obtained with the correct sampling times
does not overlap with the 95% HPD of the rate estimates inferred from the randomised data sets.
Additionally, we checked that BDSS runs with the same specifications but with only TPA
samples (n=31) produced consistent results. The Nichols clade has a node with posterior
probability below 95%, which may be due to uncertainties in the grouping of SEA81: the
sequence of this sample, publically available, was the only one obtained using solely 454
sequencing (Supplementary Table 3) and shows considerable divergence in the median-joining
network (Fig. 2a). .
The phylogenetic relationships among the closely related TPA samples (n=31) were examined
and visualized through a median joining (MJ) network analysis in Network 4.6 and Network
Publisher 32,33
. The MJ Network was produced using all variable positions after excluding the
putative recombinant loci and sites with missing data, resulting in a total of 628 variable
positions (Fig. 2a).
Genetic variation
We investigated genome-wide patterns of polymorphism and divergence using MEGA 6 24
and
DnaSP v.5.10 to compute various measures of diversity including the average pairwise
nucleotide differences, Nei’s Pi (π), and the number of singletons in each group. We also
produced a heat map to display the number of SNPs that any two genomes share (Supplementary
Fig. 3), and estimated the number of SNPs private to particular groups. All SNPs have been
called with respect to the Nichols reference genome. Results: The heat map (Supplementary Fig.
3) clearly shows the distinction of the two lineages (TPA versus TPE/TEN). A comparison of the
TPA and TPE/TEN genomes revealed between 1 (NIC1) and 339 (AR2) SNPs observed in the
TPA samples and between 1091 (GHA1) and 1443 (Bosnia A) SNPs in the TPE/TEN strains.
Altogether 443 SNPs are specific to the TPA samples and 1703 to the TPE ones.
7: Clade classification Natasha Arora, Linda Grillova, Michal Strouhal, Lucía Gallo Valet, and Kay Nieselt
Samples from this study
From the 70 TPA, TPE, and TEN samples sequenced in this study, 28 fulfilled our criteria for
genome-wide analyses (minimum 80% genome covered with at least 3 reads). For the remaining
42 samples, we carried out the following analyses to classify them according to lineage/clade:
1. NGS read clade prediction
We implemented an NGS clade prediction strategy to classify the genomes according to
lineage (TPA or TPE/TEN), and within the TPA lineage, as part of the SS14 or the Nichols
clade. We performed analyses incorporating all 70 samples and 8 published genomes (CHI,
MEXA, DAL, SEA81, SAMD, CDC2, GAU and BOSA), and checked that our method
accurately classified the 39 samples for which phylogenetic trees had been reconstructed
(section 6 and Fig. 1b).
Our clade prediction strategy comprised two steps. First, we computed the relative genetic
distance of each sample to a representative of each of the three clades: i) the Nichols
genome (for the Nichols clade), ii) the SS14 genome (for the SS14 clade), and iii)
Fribourg-Blanc (FRI) as representative of the TPE/TEN clade. Relative genetic distance
was computed with MEGA 6 24
, yielding the number of base differences per site for all
positions for which at least one of the samples had a SNP call. Note that many of the 2,053
variable positions have an `N’ because of lack of coverage. All such ambiguous positions
were removed for each sequence pair.
Second, we predicted the clade that a sample S belongs to, as the one for which S has the
smallest genetic distance p:
arg min(Nichols, SS14, GHA1) min(p(S,Nichols), p(S, SS14), p(S,FRI))
Predictive power was assessed by computing the prediction strength PS for each sample
prediction, i.e. the relative margin between the closest and furthest class by subtracting the
minimal genetic distance from the maximal genetic distance, dividing that by the sum of
the two distances:
PS = (max(p(S,Nichols), p(S, SS14), p(S,FRI))-min(p(S,Nichols), p(S, SS14),
p(S,Friboug)))/(max(p(S,Nichols), p(S, SS14), p(S,FRI))+min(p(S,Nichols), p(S, SS14),
p(S,FRI)))
2. TP0548 classification scheme:
The TP0548 gene has been used in numerous typing studies. Two typing regions are
generally used: the short and highly variable region as detailed by Marra et al. 34
, and a
longer segment spanning this short region, as detailed by Matějková et al. 35
. Phylogenies
of both of these TP0548 regions enable the distinction of an SS14 clade versus a Nichols
clade for the TPA samples, as illustrated by the trees and networks shown in
Supplementary Fig. 4. TPA can be distinguished from TPE and TEN by visually inspecting
indels and SNPs specific to the subspecies.
For all samples collected in this study, we carried out PCR and Sanger sequencing of a
segment of the TP0548 gene following the protocols and primers of Matějková et al. 35
. For
a few samples (NE12, NE15, NE19, AU16), PCR amplifications and Sanger sequencing
were not successful, so we used the NGS read data from this gene region. We also
examined TP0548 data from the published genomes available in GenBank (samples from
Supplementary Table 3). To classify the samples, we generated an ML tree for this longer
segment of the TP0548 and visually inspected the sequence types (Supplementary Fig. 4).
Results: The results of NGS clade prediction for the 78 genomes are summarized in
Supplementary Table 8. First we checked the accuracy of our method on the clade
predictions for the 39 samples classified through phylogenetic tree reconstruction (Fig. 1b).
All samples resulted in consistent classification. Next, we compared this clade prediction
with the clade classification based on the sequenced TP0548 gene region. For one sample
(SW11) classification was not possible due to insufficient coverage. For the other samples,
when prediction power was above 0.4, the clade prediction algorithm using NGS data was
consistent with TP0548 sequence classification (with the exception of IRAB, for which
Sanger sequencing of the TP0548 typing region shows identity with the TEN sample
BOSA). Overall, the results of the NGS clade prediction show that, even when coverage is
not sufficiently high for genome-wide comparisons, our new algorithm enables reliable
taxonomic classification of TPA samples.
Samples from typing studies
We put together all publicly available TP0548 sequences obtained in typing studies of syphilis
infections around the world 36–44
. These studies focus on the region described by Marra et al. 34
.
Additionally, we incorporated TP0548 sequences obtained for 34 Argentinian clinical samples
by LGV at the University of Buenos Aires, Argentina. Details for these sequences are shown in
Supplementary Table 9. All TP0548 sequences were classified as part of the SS14 clade or part
of the Nichols clade based on an ML tree generated with MEGA 24
(using the GTR model and a
total of 86 positions; Supplementary Fig. 5). Subtypes were distinguished through visual
inspection (Supplementary Table 9).
Clinical samples from this study and global typing studies: We used the SS14 versus Nichols
clade classification for all patient samples from this study and from the global typing studies to
produce a frequency distribution map (Fig. 2b). Results: As illustrated in Fig. 2b and
Supplementary Tables 8-9, most clinical samples around the world fall within the SS14 clade,
but samples from the Nichols clade are also present. Further analyses will be necessary to
investigate possible correlation with demographic variables.
8: Antibiotic resistance Natasha Arora, Günter Jäger, Linda Grillova, Michal Strouhal, and Kay Nieselt
The two mutations associated with resistance to the macrolide azithromycin, A2058G and
A2059G on the 23S ribosomal RNA operon (with positions referring to coordinates in the 23S
ribosomal RNA gene of Escherichia coli), were investigated in separate analyses. Since the
operon contains two copies of the gene, mapping of reads with BWA was carried out
independently for each of the genes, including a flanking region of 200 bases on both the 5’ and
3’ end of each genes. Following variant calling as described in section 4, the presence/absence of
each of the two mutations was recorded for each sample. The two operons could not, however,
be distinguished.
In addition, we used primers specific for each of the two operons to carry out PCR amplifications
as well as Sanger sequencing on the samples, following the protocol in Matějková et al. 35
.
Details on the sequenced samples, as well as resistance or sensitivity to the macrolide as
determined by the presence or absence of the associated mutations are given in Supplementary
Table 8.
We reported the frequencies of mutations associated with resistance for samples pertaining to the
SS14 clade and samples pertaining to the Nichols clade. The clade was determined by the
TP0548 sequences and NGS clade prediction (where prediction strength is above 0.4). When the
clade classification was not congruent, we relied on the TP0548 classification scheme. For
samples where TP0548 sequencing was not successful, we used NGS clade prediction where
prediction strength was above 0.4.
We also examined the mutations in the penicillin regulatory genes TP0500, TP0547, TP0705,
and TP0760 in all 39 sequences of TPA, TPE and TEN, using MEGA.
Results: The mutations associated with macrolide resistance were found in a large fraction of
samples from the SS14 clade, but they were not restricted to this clade. These results are also
consistent with other studies 39,45
. Our analyses of the penicillin regulatory genes showed non-
synonymous mutations in two genes (TP0500 and TP0547). These mutations lead to amino acid
replacements. In TP0705, the missing data in some positions did not allow us to determine the
codons, and therefore, whether mutations were synonymous or non-synonymous. The only
mutation found in TP0760 was a synonymous mutation.
Supplementary Tables
Supplementary Table 1. Sample information. Details of the 70 samples collected and
sequenced: sample name (with original lab designation in parentheses), treponemal subspecies
(TPA for syphilis, TPE for yaws or TEN for bejel), country of origin, source and year of
isolation from the patient are provided. When the year of isolation is not known with precision, a
range of probable years is specified. Year of isolation from the patient differs from the tip
calibration date for the samples propagated continuously in rabbits for a given length of years
(NIC1 and NIC2).
Supplementary Table 2. Read preprocessing, mapping and genotyping results. Results of
read preprocessing, mapping and genotyping for all 70 sequenced samples as well as two
negative samples (library blanks, LB1 and LB2) using EAGER. For each sample this includes
the number of merged reads using Clip&Merge, mapped reads using BWA-mem as well as the
number of duplicates removed, mean coverage and percentage of genome coverage for different
number of reads, the number of SNPS called with GATK, and SRA accession IDs. Samples with
minimum 80% genome covered by at least 3 reads are highlighted in bold.
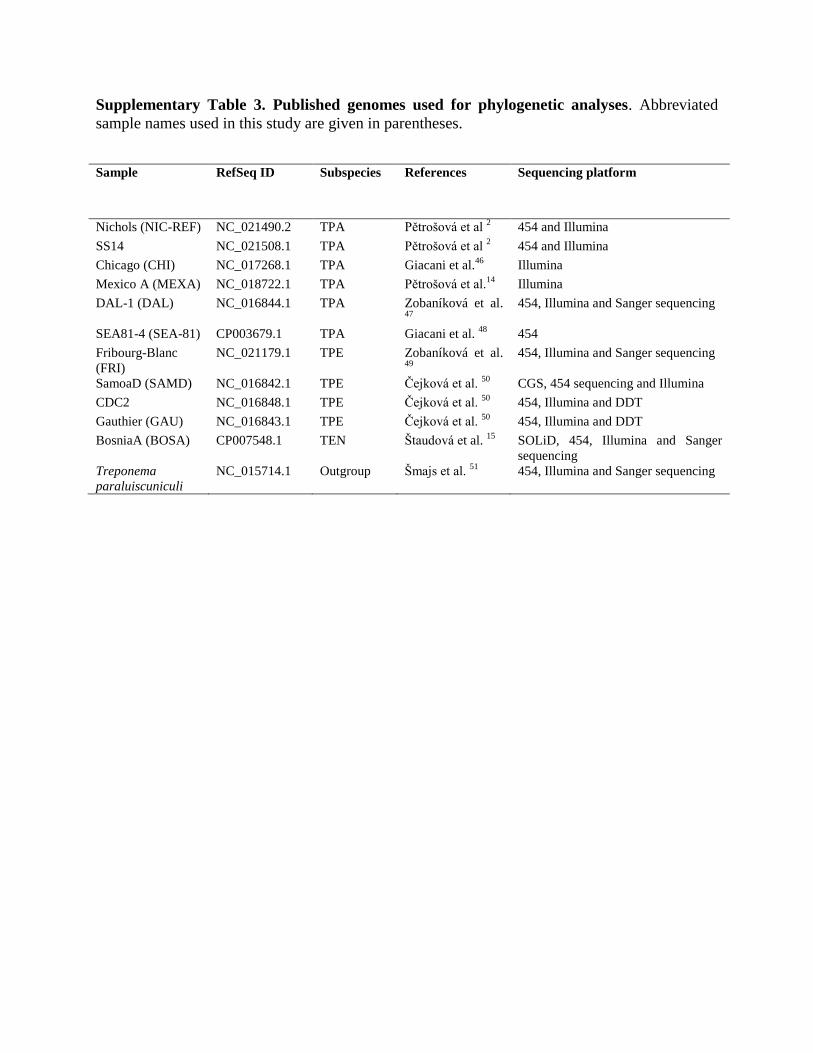
Supplementary Table 3. Published genomes used for phylogenetic analyses. Abbreviated
sample names used in this study are given in parentheses.
Sample RefSeq ID Subspecies References Sequencing platform
Nichols (NIC-REF) NC_021490.2 TPA Pětrošová et al 2 454 and Illumina
SS14 NC_021508.1 TPA Pětrošová et al 2 454 and Illumina
Chicago (CHI) NC_017268.1 TPA Giacani et al.46
Illumina
Mexico A (MEXA) NC_018722.1 TPA Pětrošová et al.14
Illumina
DAL-1 (DAL) NC_016844.1 TPA Zobaníková et al. 47
454, Illumina and Sanger sequencing
SEA81-4 (SEA-81) CP003679.1 TPA Giacani et al. 48
454
Fribourg-Blanc
(FRI)
NC_021179.1 TPE Zobaníková et al. 49
454, Illumina and Sanger sequencing
SamoaD (SAMD) NC_016842.1 TPE Čejková et al. 50
CGS, 454 sequencing and Illumina
CDC2 NC_016848.1 TPE Čejková et al. 50
454, Illumina and DDT
Gauthier (GAU) NC_016843.1 TPE Čejková et al. 50
454, Illumina and DDT
BosniaA (BOSA) CP007548.1 TEN Štaudová et al. 15
SOLiD, 454, Illumina and Sanger
sequencing
Treponema
paraluiscuniculi
NC_015714.1 Outgroup Šmajs et al. 51
454, Illumina and Sanger sequencing
Supplementary Table 4. SNP calls for samples used in genome-wide data analyses (n=39).
Number of SNP calls are provided for i) the 28 samples sequenced in this study that met the
criteria for inclusion in whole-genome data analyses (that is, minimum 80% genome covered by
at least 3 reads); and ii) the 11 published genomes obtained from Genbank. A SNP was called if
a variant to the reference Nichols strain (Supplementary Table 3; RefSeq ID NC_021490.2) was
found at a frequency of 90% or more for the positions with a minimum of 10 reads. In cases
where a position was only covered by 3-9 reads, the SNP was called if all but one read had the
SNP. Information on the number of positions with at least 10 reads, as well as at 3-9 reads is
provided for the samples sequenced in this study. Additionally, we show the missing data across
the positions with 3-9 reads.
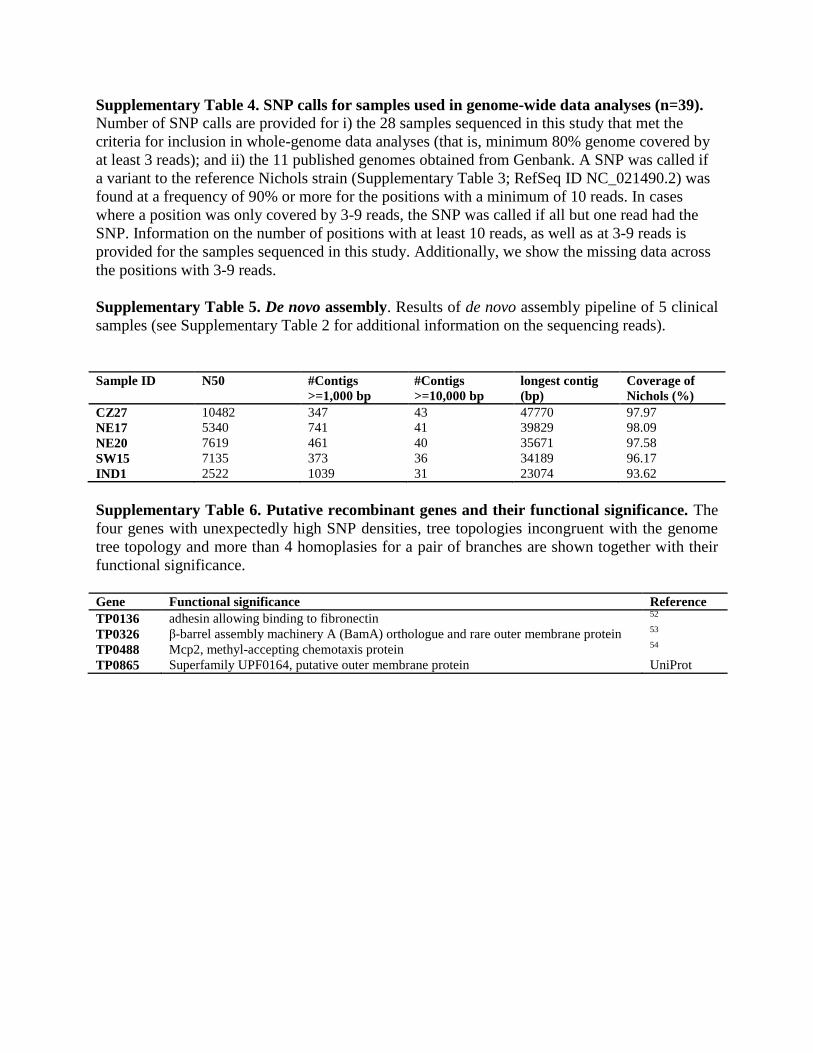
Supplementary Table 5. De novo assembly. Results of de novo assembly pipeline of 5 clinical
samples (see Supplementary Table 2 for additional information on the sequencing reads).
Sample ID N50 #Contigs
>=1,000 bp
#Contigs
>=10,000 bp
longest contig
(bp)
Coverage of
Nichols (%)
CZ27 10482 347 43 47770 97.97
NE17 5340 741 41 39829 98.09
NE20 7619 461 40 35671 97.58
SW15 7135 373 36 34189 96.17
IND1 2522 1039 31 23074 93.62
Supplementary Table 6. Putative recombinant genes and their functional significance. The
four genes with unexpectedly high SNP densities, tree topologies incongruent with the genome
tree topology and more than 4 homoplasies for a pair of branches are shown together with their
functional significance.
Gene Functional significance Reference
TP0136 adhesin allowing binding to fibronectin 52
TP0326 β-barrel assembly machinery A (BamA) orthologue and rare outer membrane protein 53
TP0488 Mcp2, methyl-accepting chemotaxis protein 54
TP0865 Superfamily UPF0164, putative outer membrane protein UniProt
Supplementary Table 7. Putative recombinant genes identified by Gubbins 17
and
ClonalFrameML 18
. The 4 putative recombinant genes identified through the phylogenetic
method (Supplementary Table 6), also identified by Gubbins and ClonalFrameML, are
highlighted in bold.
Supplementary Table 8. Clade classification and antibiotic resistance. Clade classification
and mutations associated with azithromycin resistance for all sequenced and published samples.
Clade prediction is based on the algorithm for NGS data described in the Supplementary
Methods (section 5). TP0548 classification is based on the Sanger sequences obtained for
TP0548 gene region with coordinates 593379 to 594139 (according to Nichols NC_021490.2).
NA denotes missing data (either unavailable NGS data, or unsuccessful PCR amplification and
capillary electrophoresis sequencing for the TP0548 region). Specific indels or SNPs in the
TP0548 region were used to distinguish TPE and TEN samples, respectively. Samples are
categorized as resistant if either of the mutations associated for macrolide resistance were
present. Mutation position: (1) denotes the A2058G mutation and (2) denotes the A2059G
mutation. Samples with prediction strength above 0.4 (shown in bold) provide consistent results
for the NGS clade prediction and TP0548 clade classification, with the exception of IRAB
(italicized).
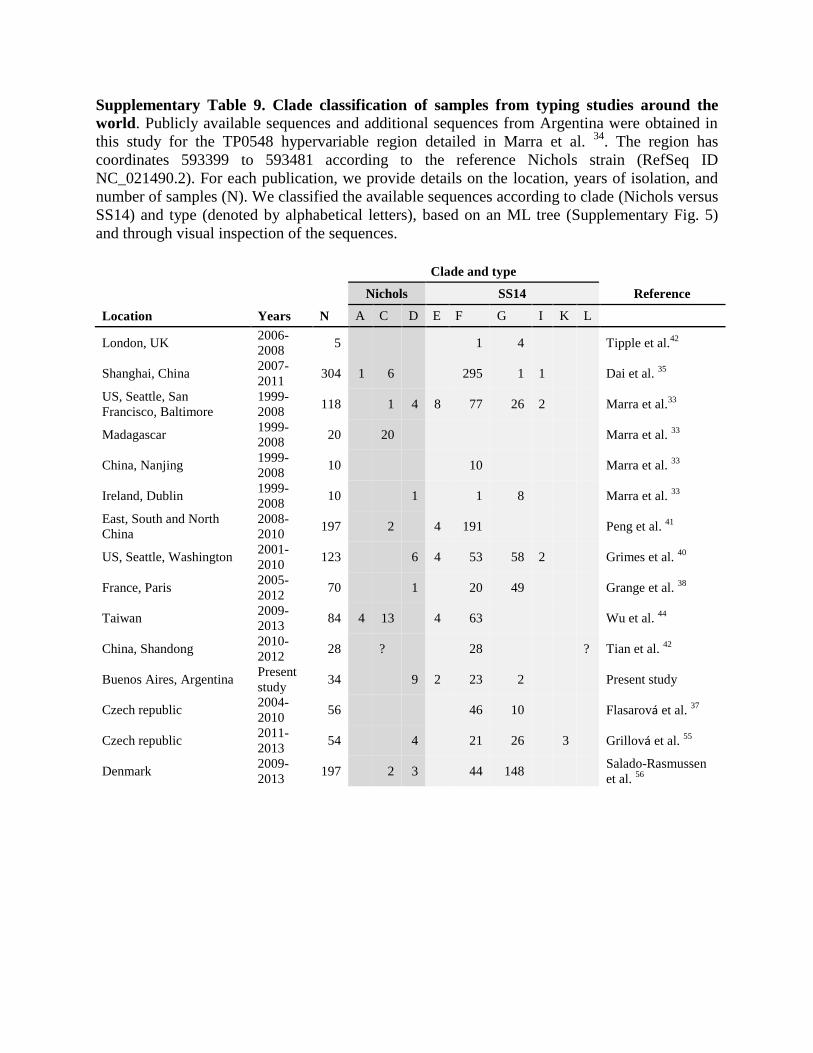
Supplementary Table 9. Clade classification of samples from typing studies around the
world. Publicly available sequences and additional sequences from Argentina were obtained in
this study for the TP0548 hypervariable region detailed in Marra et al. 34
. The region has
coordinates 593399 to 593481 according to the reference Nichols strain (RefSeq ID
NC_021490.2). For each publication, we provide details on the location, years of isolation, and
number of samples (N). We classified the available sequences according to clade (Nichols versus
SS14) and type (denoted by alphabetical letters), based on an ML tree (Supplementary Fig. 5)
and through visual inspection of the sequences.
Clade and type
Nichols SS14 Reference
Location Years N A C D E F G I K L
London, UK 2006-
2008 5 1 4 Tipple et al.
42
Shanghai, China 2007-
2011 304 1 6 295 1 1 Dai et al.
35
US, Seattle, San
Francisco, Baltimore
1999-
2008 118 1 4 8 77 26 2 Marra et al.
33
Madagascar 1999-
2008 20 20 Marra et al.
33
China, Nanjing 1999-
2008 10 10 Marra et al.
33
Ireland, Dublin 1999-
2008 10 1 1 8 Marra et al.
33
East, South and North
China
2008-
2010 197 2 4 191 Peng et al.
41
US, Seattle, Washington 2001-
2010 123 6 4 53 58 2 Grimes et al.
40
France, Paris 2005-
2012 70 1 20 49 Grange et al.
38
Taiwan 2009-
2013 84 4 13 4 63 Wu et al.
44
China, Shandong 2010-
2012 28 ? 28 ? Tian et al.
42
Buenos Aires, Argentina Present
study 34 9 2 23 2 Present study
Czech republic 2004-
2010 56 46 10 Flasarová et al.
37
Czech republic 2011-
2013 54 4 21 26 3 Grillová et al.
55
Denmark 2009-
2013 197 2 3 44 148
Salado-Rasmussen
et al. 56
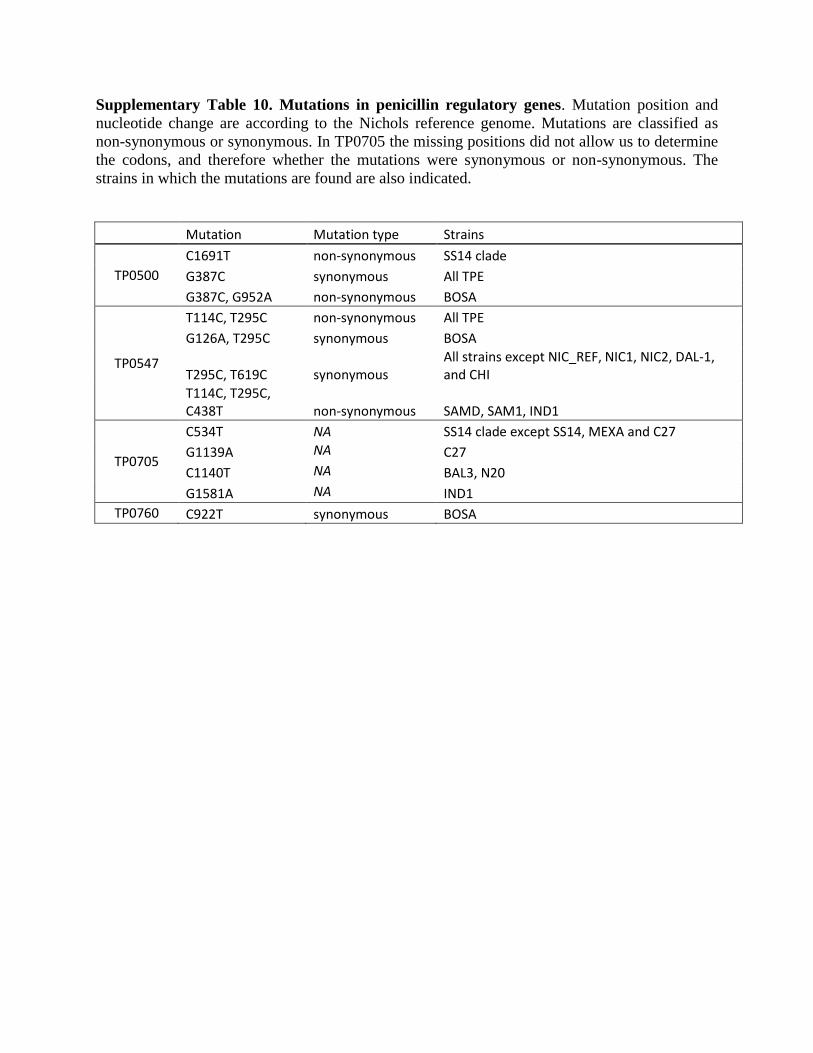
Supplementary Table 10. Mutations in penicillin regulatory genes. Mutation position and
nucleotide change are according to the Nichols reference genome. Mutations are classified as
non-synonymous or synonymous. In TP0705 the missing positions did not allow us to determine
the codons, and therefore whether the mutations were synonymous or non-synonymous. The
strains in which the mutations are found are also indicated.
Mutation Mutation type Strains
TP0500 C1691T non-synonymous SS14 clade G387C synonymous All TPE G387C, G952A non-synonymous BOSA
TP0547
T114C, T295C non-synonymous All TPE G126A, T295C synonymous BOSA
T295C, T619C synonymous All strains except NIC_REF, NIC1, NIC2, DAL-1, and CHI
T114C, T295C, C438T non-synonymous SAMD, SAM1, IND1
TP0705
C534T NA SS14 clade except SS14, MEXA and C27 G1139A NA C27 C1140T NA BAL3, N20 G1581A NA IND1
TP0760 C922T synonymous BOSA
Supplementary Figures
Supplementary Figure 1. Temporal signal tests. a. The regression of root-to-tip genetic distance versus year of isolation was plotted using TempEST, for the genomic data for the 36 samples with precise isolation years (not ranges). b. Mean evolutionary rate estimates and 95% HPD intervals for the runs with date randomized datasets (1-17) and the combined run for the dataset with the correct sampling time (D) are shown.
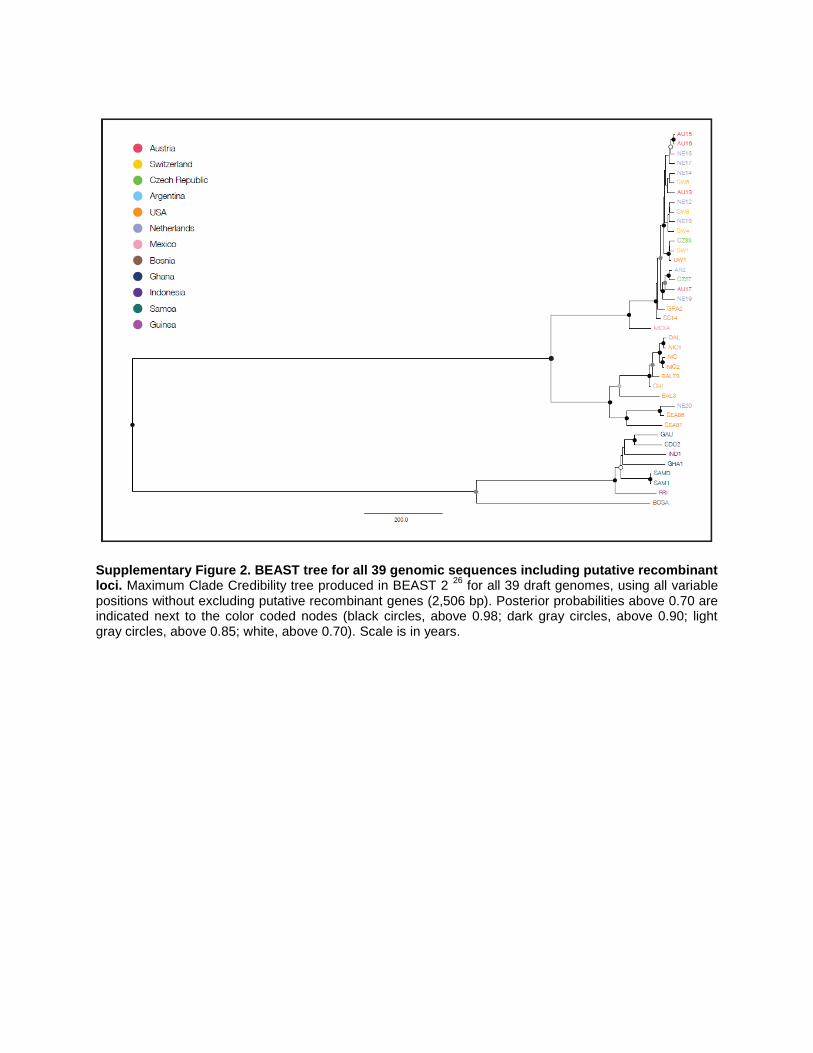
Supplementary Figure 2. BEAST tree for all 39 genomic sequences including putative recombinant loci. Maximum Clade Credibility tree produced in BEAST 2
26 for all 39 draft genomes, using all variable
positions without excluding putative recombinant genes (2,506 bp). Posterior probabilities above 0.70 are indicated next to the color coded nodes (black circles, above 0.98; dark gray circles, above 0.90; light gray circles, above 0.85; white, above 0.70). Scale is in years.
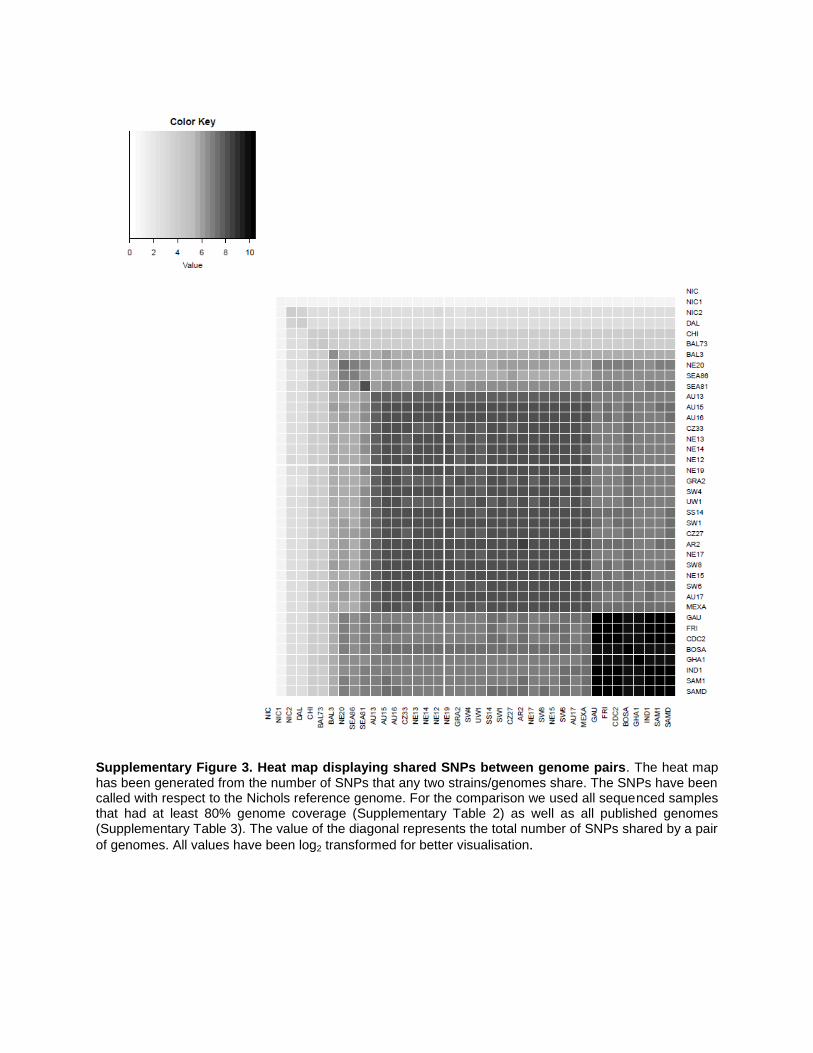
Supplementary Figure 3. Heat map displaying shared SNPs between genome pairs. The heat map has been generated from the number of SNPs that any two strains/genomes share. The SNPs have been called with respect to the Nichols reference genome. For the comparison we used all sequenced samples that had at least 80% genome coverage (Supplementary Table 2) as well as all published genomes (Supplementary Table 3). The value of the diagonal represents the total number of SNPs shared by a pair
of genomes. All values have been log2 transformed for better visualisation.
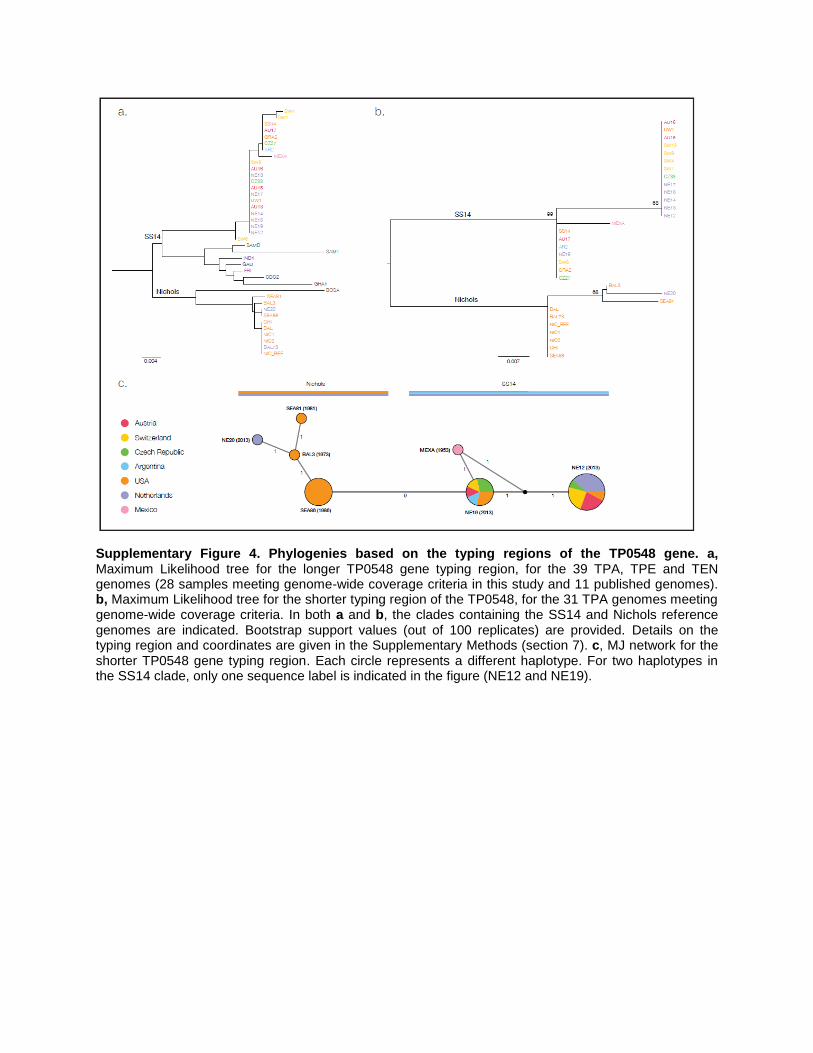
Supplementary Figure 4. Phylogenies based on the typing regions of the TP0548 gene. a, Maximum Likelihood tree for the longer TP0548 gene typing region, for the 39 TPA, TPE and TEN genomes (28 samples meeting genome-wide coverage criteria in this study and 11 published genomes). b, Maximum Likelihood tree for the shorter typing region of the TP0548, for the 31 TPA genomes meeting genome-wide coverage criteria. In both a and b, the clades containing the SS14 and Nichols reference genomes are indicated. Bootstrap support values (out of 100 replicates) are provided. Details on the typing region and coordinates are given in the Supplementary Methods (section 7). c, MJ network for the shorter TP0548 gene typing region. Each circle represents a different haplotype. For two haplotypes in the SS14 clade, only one sequence label is indicated in the figure (NE12 and NE19).
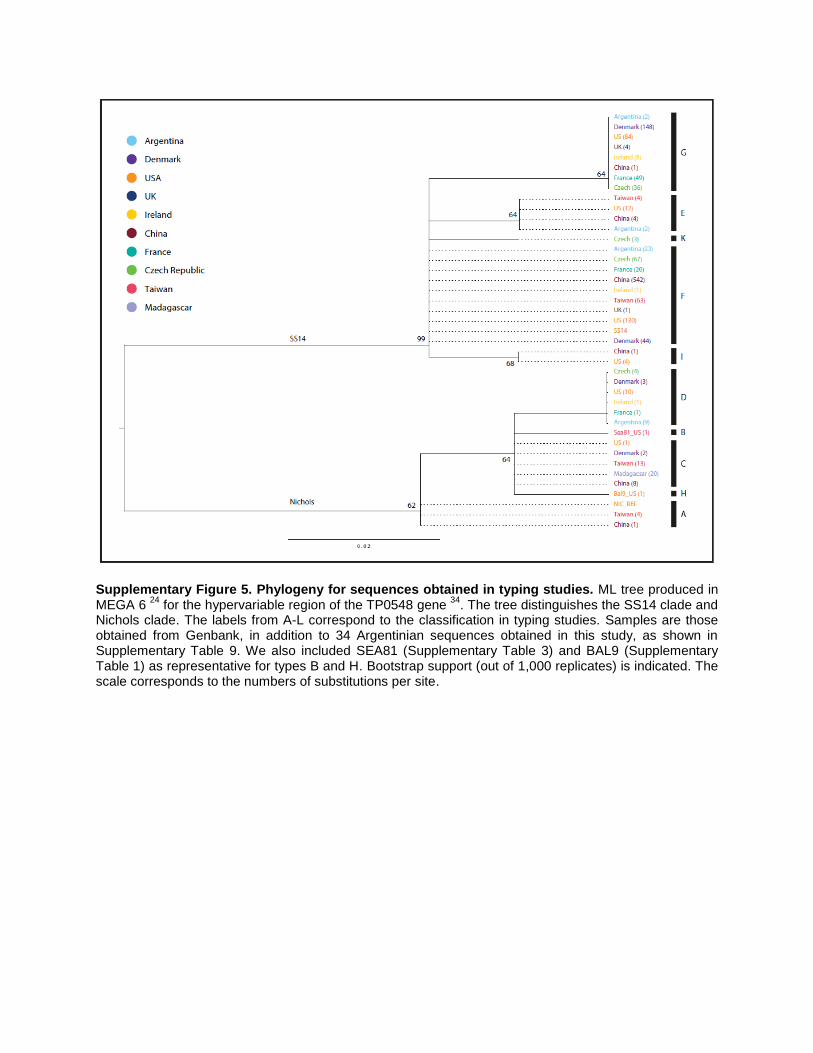
Supplementary Figure 5. Phylogeny for sequences obtained in typing studies. ML tree produced in MEGA 6
24 for the hypervariable region of the TP0548 gene
34. The tree distinguishes the SS14 clade and
Nichols clade. The labels from A-L correspond to the classification in typing studies. Samples are those obtained from Genbank, in addition to 34 Argentinian sequences obtained in this study, as shown in Supplementary Table 9. We also included SEA81 (Supplementary Table 3) and BAL9 (Supplementary Table 1) as representative for types B and H. Bootstrap support (out of 1,000 replicates) is indicated. The scale corresponds to the numbers of substitutions per site.
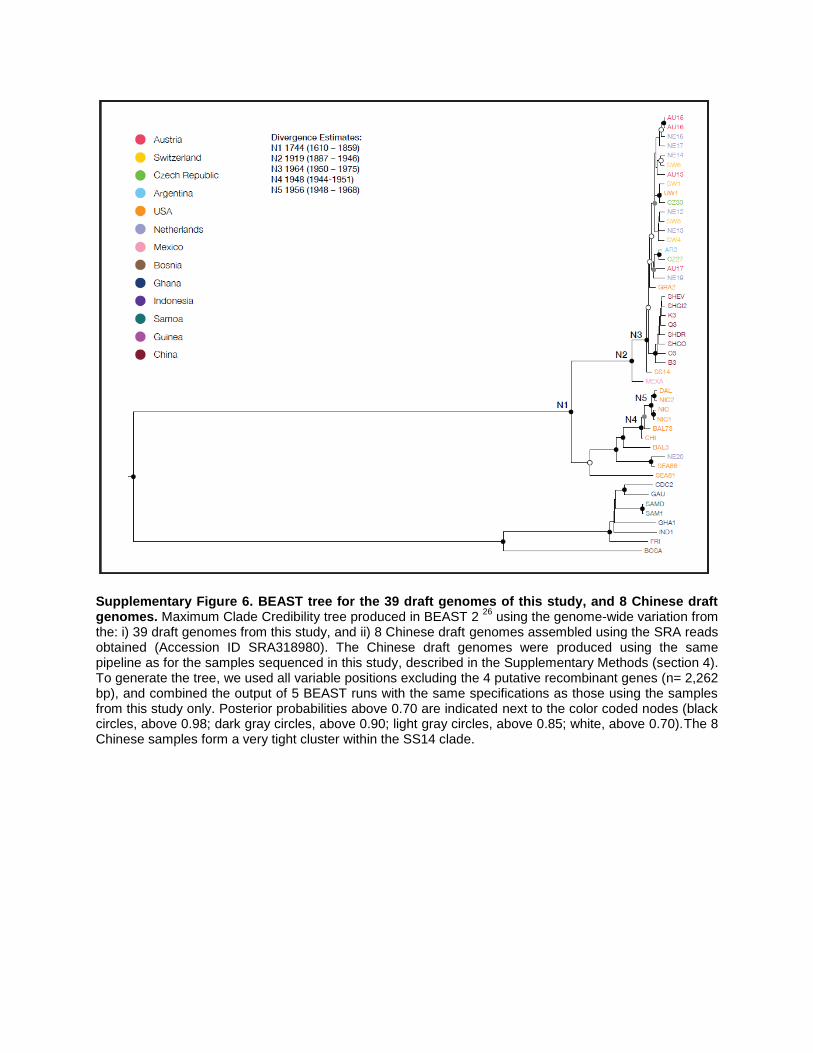
Supplementary Figure 6. BEAST tree for the 39 draft genomes of this study, and 8 Chinese draft genomes. Maximum Clade Credibility tree produced in BEAST 2
26 using the genome-wide variation from
the: i) 39 draft genomes from this study, and ii) 8 Chinese draft genomes assembled using the SRA reads obtained (Accession ID SRA318980). The Chinese draft genomes were produced using the same pipeline as for the samples sequenced in this study, described in the Supplementary Methods (section 4). To generate the tree, we used all variable positions excluding the 4 putative recombinant genes (n= 2,262 bp), and combined the output of 5 BEAST runs with the same specifications as those using the samples from this study only. Posterior probabilities above 0.70 are indicated next to the color coded nodes (black circles, above 0.98; dark gray circles, above 0.90; light gray circles, above 0.85; white, above 0.70).The 8 Chinese samples form a very tight cluster within the SS14 clade.
Supplementary References
1. Nichols, H. J. Observations on a strain of Spirochaeta pallida isolated from the nervous system. J. Exp. Med.
19, 362–371 (1914).
2. Pětrošová, H. et al. Resequencing of Treponema pallidum ssp. pallidum Strains Nichols and SS14: Correction
of Sequencing Errors Resulted in Increased Separation of Syphilis Treponeme Subclusters. PLoS ONE 8,
e74319 (2013).
3. Kircher, M., Sawyer, S. & Meyer, M. Double indexing overcomes inaccuracies in multiplex sequencing on the
Illumina platform. Nucleic Acids Res. 40, e3–e3 (2012).
4. Meyer, M. & Kircher, M. Illumina Sequencing Library Preparation for Highly Multiplexed Target Capture and
Sequencing. Cold Spring Harb. Protoc. 2010, pdb.prot5448-prot5448 (2010).
5. Bos, K. I. Genetic investigations into the Black Death. (McMaster University, 2011).
6. Hodges, E. et al. Hybrid selection of discrete genomic intervals on custom-designed microarrays for massively
parallel sequencing. Nat. Protoc. 4, 960–974 (2009).
7. Peltzer, A. et al. EAGER: Efficient Ancient Genome Reconstruction. Genome Biol. 17, 1 (2016).
8. Li, H. Aligning sequence reads, clone sequences and assembly contigs with BWA-MEM. ArXiv Prepr.
ArXiv13033997 (2013).
9. McKenna, A. et al. The Genome Analysis Toolkit: A MapReduce framework for analyzing next-generation
DNA sequencing data. Genome Res. 20, 1297–1303 (2010).
10. Cingolani, P. et al. A program for annotating and predicting the effects of single nucleotide polymorphisms,
SnpEff: SNPs in the genome of Drosophila melanogaster strain w 1118
; iso-2; iso-3. Fly (Austin) 6, 80–92
(2012).
11. Simpson, J. T. & Durbin, R. Efficient de novo assembly of large genomes using compressed data structures.
Genome Res. 22, 549–556 (2012).
12. Centurion-Lara, A. et al. Fine Analysis of Genetic Diversity of the tpr Gene Family among Treponemal
Species, Subspecies and Strains. PLoS Negl. Trop. Dis. 7, e2222 (2013).
13. Achtman, M. Evolution, Population Structure, and Phylogeography of Genetically Monomorphic Bacterial
Pathogens. Annu. Rev. Microbiol. 62, 53–70 (2008).
14. Pětrošová, H. et al. Whole Genome Sequence of Treponema pallidum ssp. pallidum, Strain Mexico A, Suggests
Recombination between Yaws and Syphilis Strains. PLoS Negl. Trop. Dis. 6, e1832 (2012).
15. Štaudová, B. et al. Whole Genome Sequence of the Treponema pallidum subsp. endemicum Strain Bosnia A:
The Genome Is Related to Yaws Treponemes but Contains Few Loci Similar to Syphilis Treponemes. PLoS
Negl. Trop. Dis. 8, e3261 (2014).
16. Sanchez-Buso, L., Comas, I., Jorques, G. & Gonzalez-Candelas, F. Recombination drives genome evolution in
outbreak-related Legionella pneumophila isolates. Nat Genet 46, 1205–1211 (2014).
17. Croucher, N. J. et al. Rapid phylogenetic analysis of large samples of recombinant bacterial whole genome
sequences using Gubbins. Nucleic Acids Res. (2014). doi:10.1093/nar/gku1196
18. Didelot, X. & Wilson, D. J. ClonalFrameML: Efficient Inference of Recombination in Whole Bacterial
Genomes. PLOS Comput. Biol. 11, e1004041 (2015).
19. Maynard Smith, J. & Smith, N. H. Detecting recombination from gene trees. Mol. Biol. Evol. 15, 590–599
(1998).
20. Schmidt, H. A., Strimmer, K., Vingron, M. & von Haeseler, A. TREE-PUZZLE: maximum likelihood
phylogenetic analysis using quartets and parallel computing. Bioinformatics 18, 502–504 (2002).
21. Strimmer, K. & von Haeseler, A. Quartet Puzzling: A Quartet Maximum-Likelihood Method for
Reconstructing Tree Topologies. Mol. Biol. Evol. 13, 964 (1996).
22. Strimmer, K. & Rambaut, A. Inferring confidence sets of possibly misspecified gene trees. Proc. R. Soc. B Biol.
Sci. 269, 137–142 (2002).
23. Shimodaira, H. & Hasegawa, M. Multiple Comparisons of Log-Likelihoods with Applications to Phylogenetic
Inference. Mol. Biol. Evol. 16, 1114 (1999).
24. Tamura, K., Stecher, G., Peterson, D., Filipski, A. & Kumar, S. MEGA6: Molecular Evolutionary Genetics
Analysis Version 6.0. Mol. Biol. Evol. 30, 2725–2729 (2013).
25. Rambaut, A., Lam, T. T., Max Carvalho, L. & Pybus, O. G. Exploring the temporal structure of heterochronous
sequences using TempEst (formerly Path-O-Gen). Virus Evol. 2, vew007 (2016).
26. Bouckaert, R. et al. BEAST 2: A Software Platform for Bayesian Evolutionary Analysis. PLoS Comput. Biol.
10, e1003537 (2014).
27. Baele, G. et al. Improving the Accuracy of Demographic and Molecular Clock Model Comparison While
Accommodating Phylogenetic Uncertainty. Mol. Biol. Evol. 29, 2157–2167 (2012).
28. Rambaut, A., Suchard, M., Xie, D. & Drummond, A. Tracer v1.6. (2014).
29. Rambaut, A. FigTree v.1.4.2. (2014).
30. Firth, C. et al. Using Time-Structured Data to Estimate Evolutionary Rates of Double-Stranded DNA Viruses.
Mol. Biol. Evol. 27, 2038–2051 (2010).
31. Duchêne, S., Duchêne, D., Holmes, E. C. & Ho, S. Y. W. The performance of the date-randomisation test in
phylogenetic analyses of time-structured virus data. Mol. Biol. Evol. (2015). doi:10.1093/molbev/msv056
32. Bandelt, H.-J., Forster, P. & Röhl, A. Median-joining networks for inferring intraspecific phylogenies. Mol.
Biol. Evol. 16, 37–48 (1999).
33. www.fluxux-engineering.com.
34. Marra, C. M. et al. Enhanced Molecular Typing of Treponema pallidum: Geographical Distribution of Strain
Types and Association with Neurosyphilis. J. Infect. Dis. 202, 1380–1388 (2010).
35. Matejkova, P. et al. Macrolide treatment failure in a case of secondary syphilis: a novel A2059G mutation in
the 23S rRNA gene of Treponema pallidum subsp. pallidum. J. Med. Microbiol. 58, 832–836 (2009).
36. Dai, T. et al. Molecular Typing of Treponema pallidum: a 5-Year Surveillance in Shanghai, China. J. Clin.
Microbiol. 50, 3674–3677 (2012).
37. Flasarová, M. et al. Sequencing-based Molecular Typing of Treponema pallidum Strains in the Czech
Republic: All Identified Genotypes are Related to the Sequence of the SS14 Strain. Acta Derm. Venereol. 92,
669–674 (2012).
38. Grange, P. A. et al. Molecular Subtyping of Treponema pallidum in Paris, France: Sex. Transm. Dis. 40, 641–
644 (2013).
39. Grillová, L. et al. Molecular Typing of Treponema pallidum in the Czech Republic during 2011 to 2013:
Increased Prevalence of Identified Genotypes and of Isolates with Macrolide Resistance. J. Clin. Microbiol. 52,
3693–3700 (2014).
40. Grimes, M. et al. Two Mutations Associated With Macrolide Resistance in Treponema pallidum: Increasing
Prevalence and Correlation With Molecular Strain Type in Seattle, Washington. Sex. Transm. Dis. 39, 954–958
(2012).
41. Peng, R.-R. et al. Molecular Typing of Treponema pallidum Causing Early Syphilis in China: A Cross-
Sectional Study: Sex. Transm. Dis. 39, 42–45 (2012).
42. Tian, H. et al. Molecular typing of Treponema pallidum: identification of a new sequence of tp0548 gene in
Shandong, China. Sex. Transm. Dis. 41, 551 (2014).
43. Tipple, C., McClure, M. O. & Taylor, G. P. High prevalence of macrolide resistant Treponema pallidum strains
in a London centre. Sex. Transm. Infect. 87, 486–488 (2011).
44. Wu, B.-R. et al. Multicentre surveillance of prevalence of the 23S rRNA A2058G and A2059G point mutations
and molecular subtypes of Treponema pallidum in Taiwan, 2009–2013. Clin. Microbiol. Infect. 20, 802–807
(2014).
45. Šmajs, D., Paštěková, L. & Grillová, L. Macrolide Resistance in the Syphilis Spirochete, Treponema pallidum
ssp. pallidum: Can We Also Expect Macrolide-Resistant Yaws Strains? Am. J. Trop. Med. Hyg. 93, 678–683
(2015).
46. Giacani, L. et al. Complete Genome Sequence and Annotation of the Treponema pallidum subsp. pallidum
Chicago Strain. J. Bacteriol. 192, 2645–2646 (2010).
47. Zobanikova, M. et al. Complete genome sequence of Treponema pallidum strain DAL-1. Stand Genomic Sci 7,
12–21 (2012).
48. Giacani, L. et al. Complete Genome Sequence of the Treponema pallidum subsp. pallidum Sea81-4 Strain.
Genome Announc. 2, e00333-14-e00333-14 (2014).
49. Zobanikova, M. et al. Whole genome sequence of the Treponema Fribourg-Blanc: unspecified simian isolate is
highly similar to the yaws subspecies. PLoS Negl Trop Dis 7, e2172 (2013).
50. Cejkova, D. et al. Whole genome sequences of three Treponema pallidum ssp. pertenue strains: yaws and
syphilis treponemes differ in less than 0.2% of the genome sequence. PLoS Negl Trop Dis 6, e1471 (2012).
51. Smajs, D. et al. Complete genome sequence of Treponema paraluiscuniculi, strain Cuniculi A: the loss of
infectivity to humans is associated with genome decay. PLoS One 6, e20415 (2011).
52. Ke, W., Molini, B. J., Lukehart, S. A. & Giacani, L. Treponema pallidum subsp. pallidum TP0136 Protein Is
Heterogeneous among Isolates and Binds Cellular and Plasma Fibronectin via its NH2-Terminal End. PLoS
Negl. Trop. Dis. 9, e0003662 (2015).
53. Desrosiers, D. C. et al. TP0326, a Treponema pallidum β-barrel assembly machinery A (BamA) orthologue and
rare outer membrane protein: T. pallidum BamA orthologue and rare OMP. Mol. Microbiol. 80, 1496–1515
(2011).
54. Greene, S. R. & Stamm, L. V. Molecular characterization of Treponema pallidum mcp2, a putative chemotaxis
protein gene. Infect. Immun. 66, 2999–3002 (1998).
55. Grillová, L. et al. Molecular Typing of Treponema pallidum in the Czech Republic during 2011 to 2013:
Increased Prevalence of Identified Genotypes and of Isolates with Macrolide Resistance. J. Clin. Microbiol. 52,
3693–3700 (2014).
56. Salado-Rasmussen, K. et al. Molecular Typing of Treponema pallidum in Denmark: A Nationwide Study of
Syphilis. Acta Derm. Venereol. 96, 202–206 (2016).