organic matter sources and transformations along a ... · organic matter sources and...
TRANSCRIPT
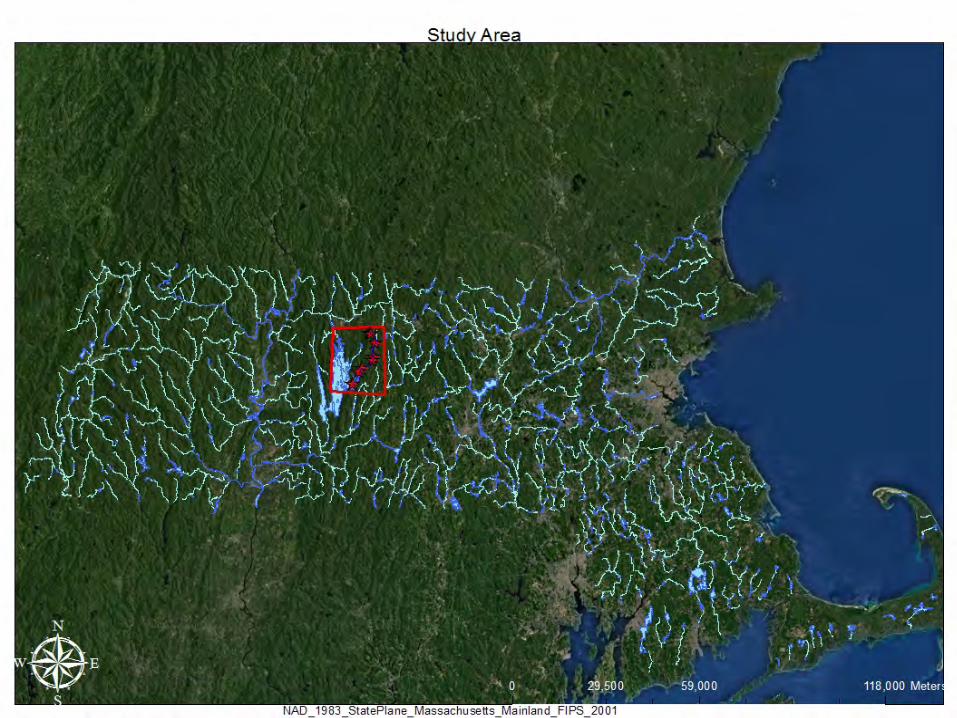
Organic Matter Sources and Transformations Along a Headwater Stream-River Continuum
S. Leigh McCallister and Eric HallVirginia Commonwealth University
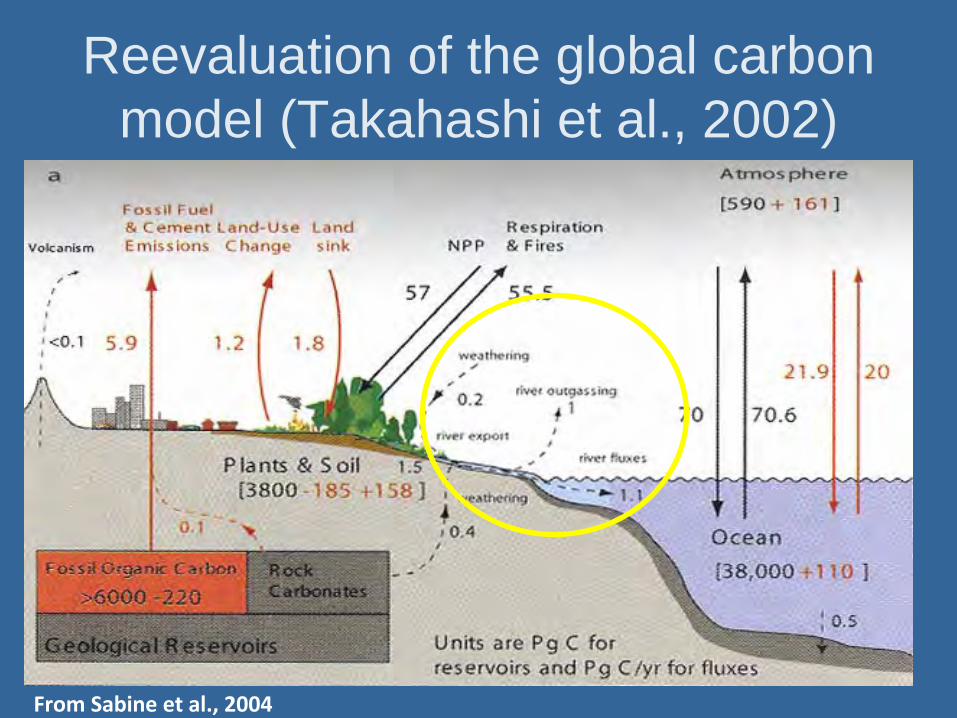
Reevaluation of the global carbon model (Takahashi et al., 2002)
From Sabine et al., 2004
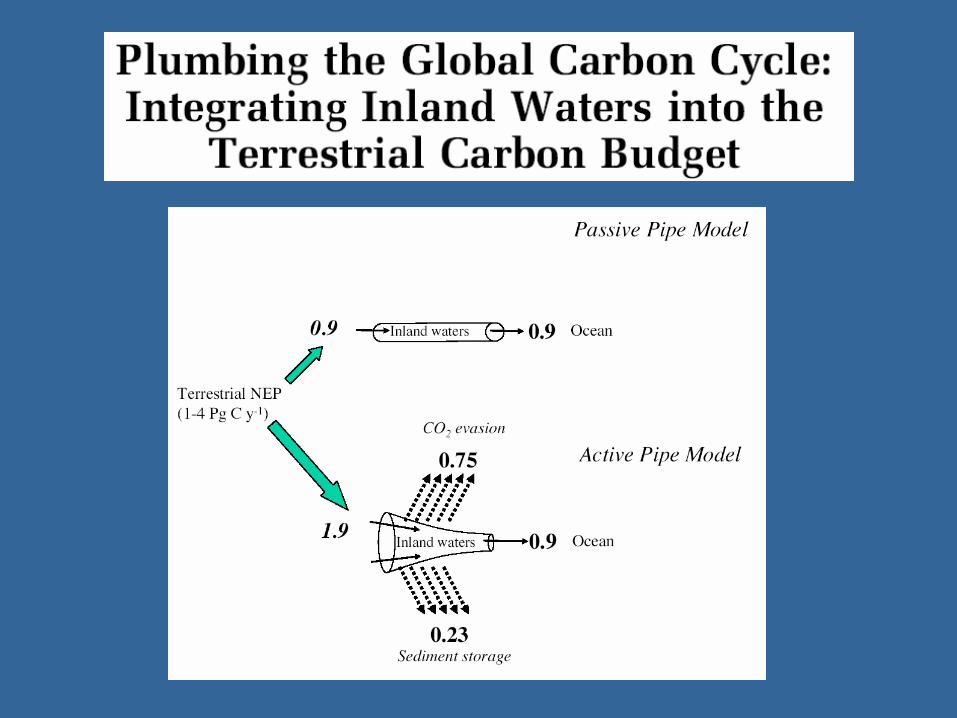
Cole et al. 2007
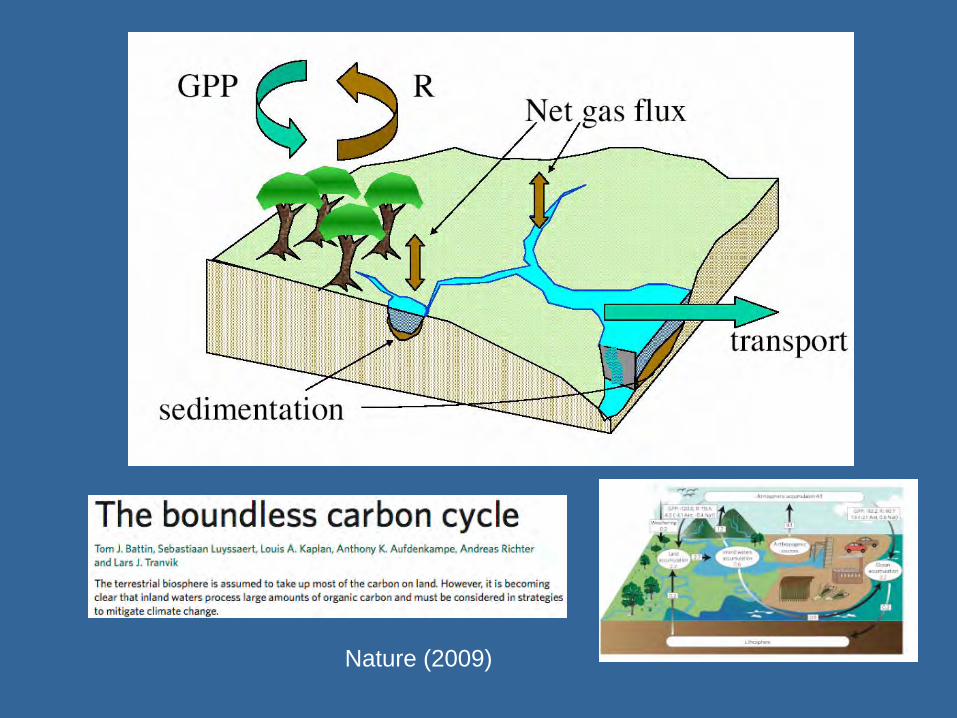
Nature (2009)
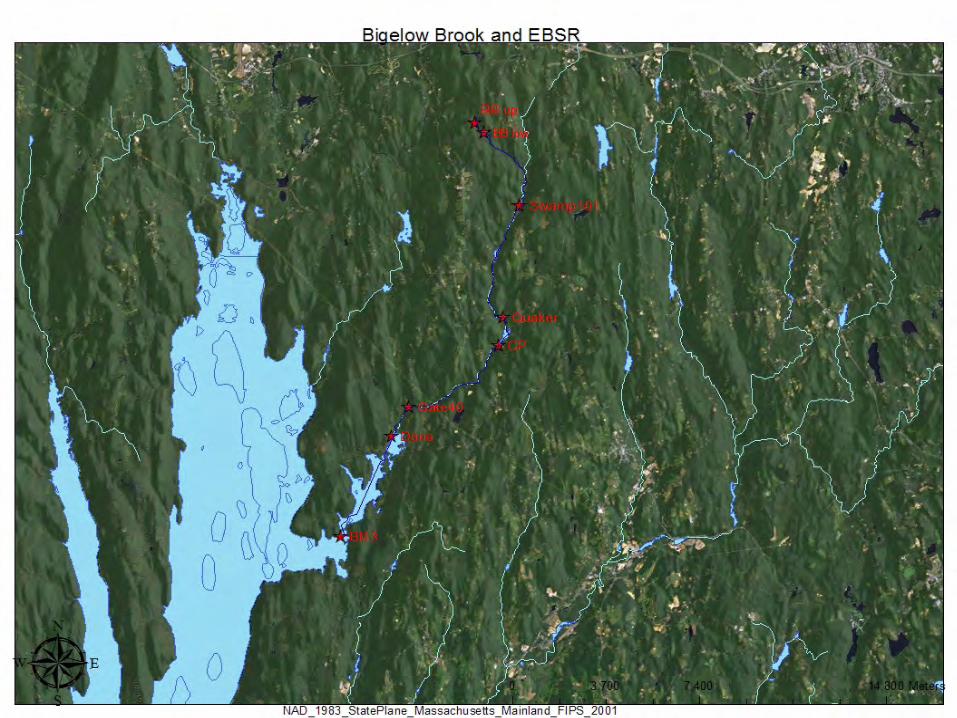
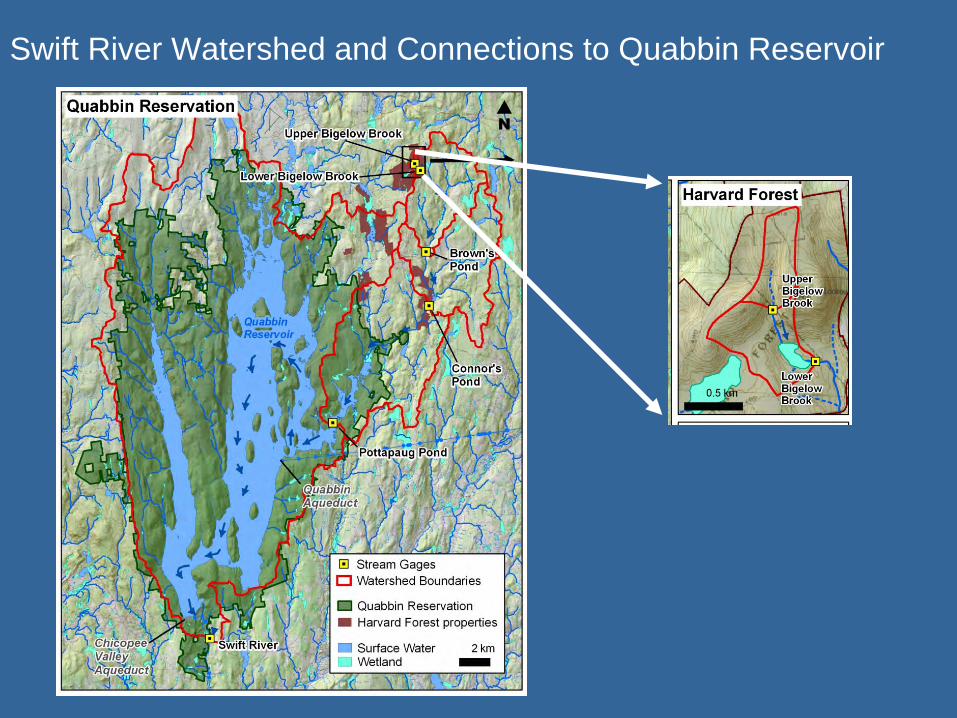
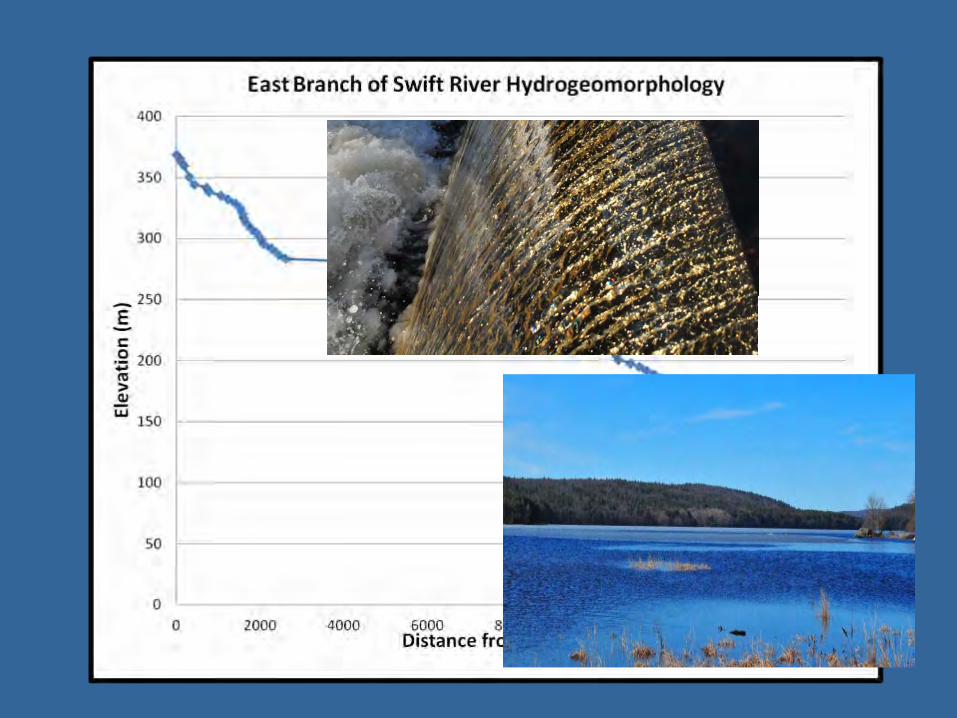
Swift River Watershed and Connections to Quabbin Reservoir
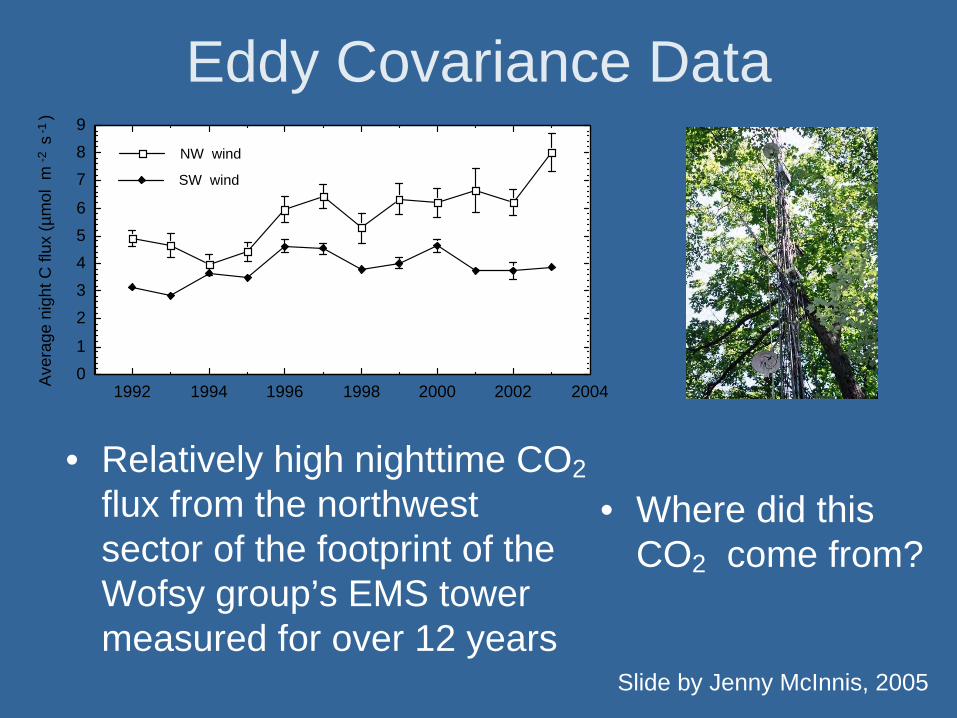
Eddy Covariance Data
• Relatively high nighttime CO2 flux from the northwest sector of the footprint of the Wofsy group’s EMS tower measured for over 12 years
• Where did this CO2 come from?
01
23456
789
Ave
rage
nig
ht C
flux
(µm
ol m
-2 s
-1 )
1992 1994 1996 1998 2000 2002 2004
SW wind
NW wind
Slide by Jenny McInnis, 2005
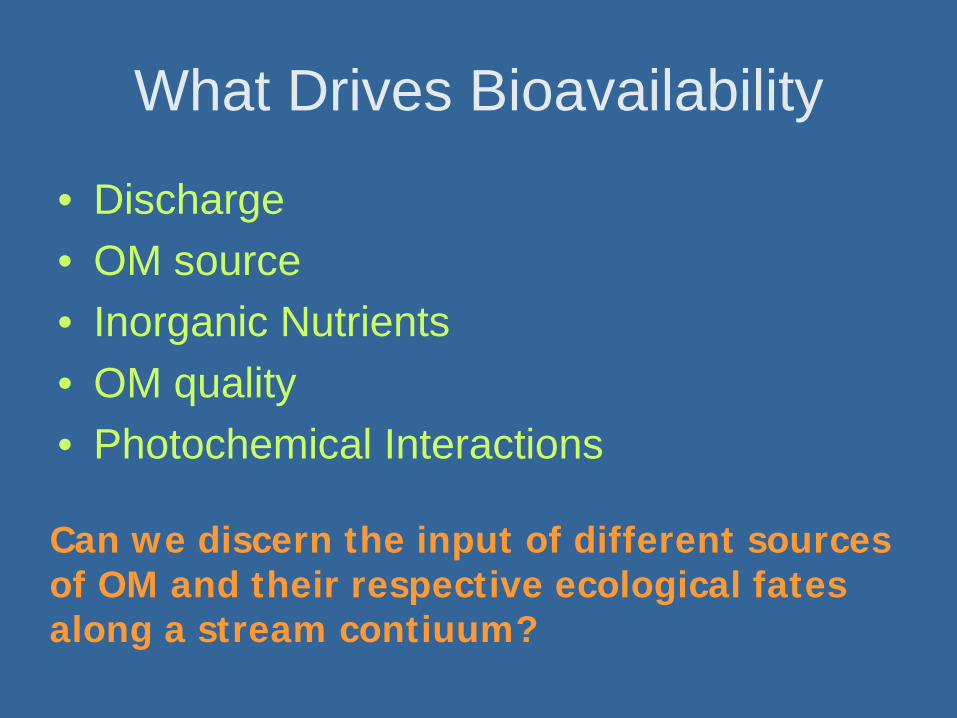
What Drives Bioavailability
• Discharge• OM source• Inorganic Nutrients• OM quality• Photochemical Interactions
Can we discern the input of different sources of OM and their respective ecological fates along a stream contiuum?
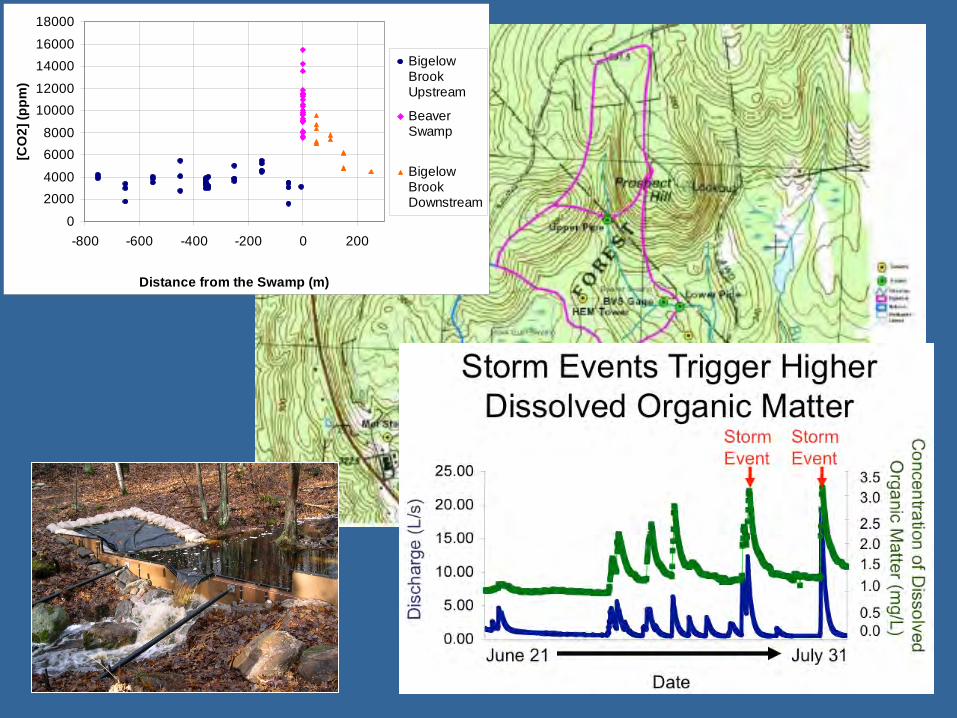
0
20004000
60008000
1000012000
1400016000
18000
-800 -600 -400 -200 0 200
Distance from the Swamp (m)
[CO
2] (p
pm)
BigelowBrookUpstream
BeaverSwamp
BigelowBrookDownstream
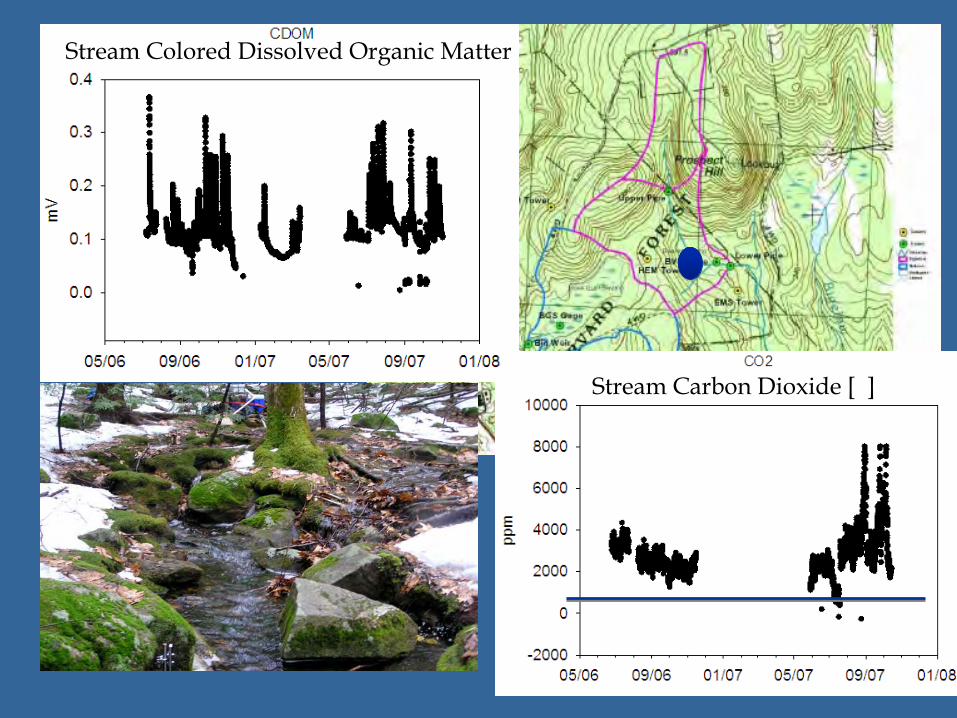
Stream Carbon Dioxide [ ]
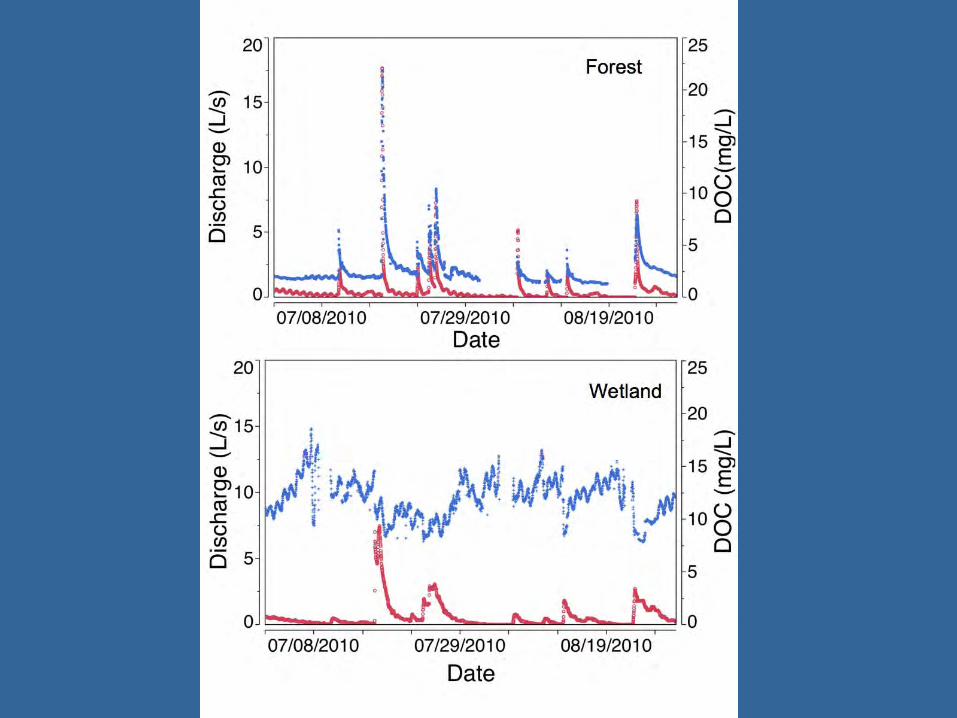
Stream Colored Dissolved Organic Matter
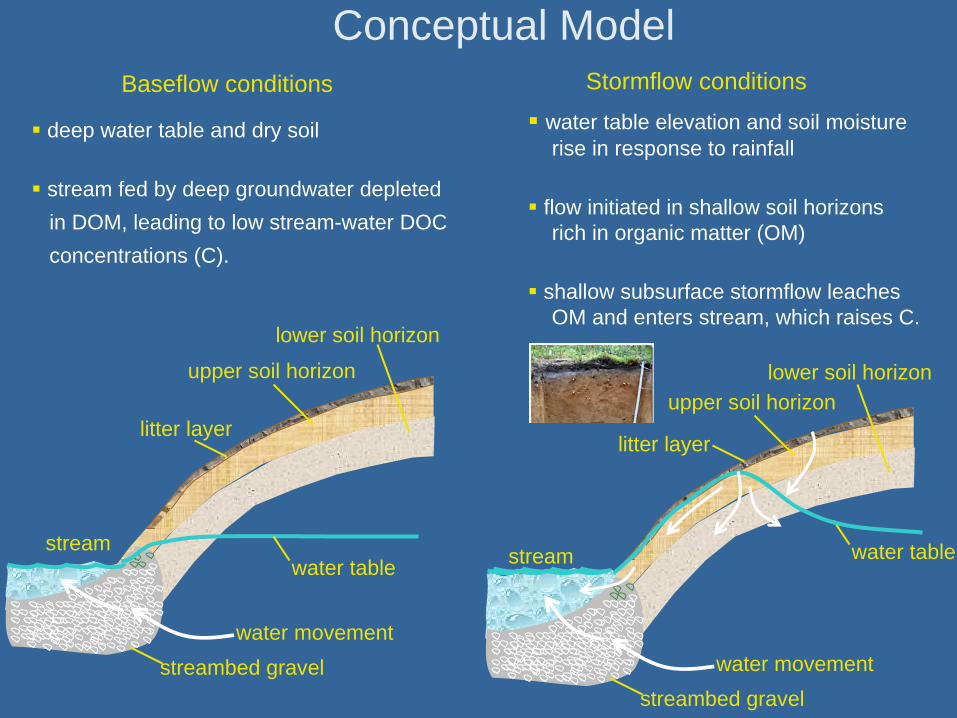
Conceptual Model Baseflow conditions
deep water table and dry soil
stream fed by deep groundwater depleted in DOM, leading to low stream-water DOC concentrations (C).
streamwater table
litter layer
upper soil horizon
lower soil horizon
streambed gravelwater movement
Stormflow conditions
water table elevation and soil moisturerise in response to rainfall
flow initiated in shallow soil horizonsrich in organic matter (OM)
shallow subsurface stormflow leaches OM and enters stream, which raises C.
stream water table
litter layer
upper soil horizonlower soil horizon
streambed gravelwater movement
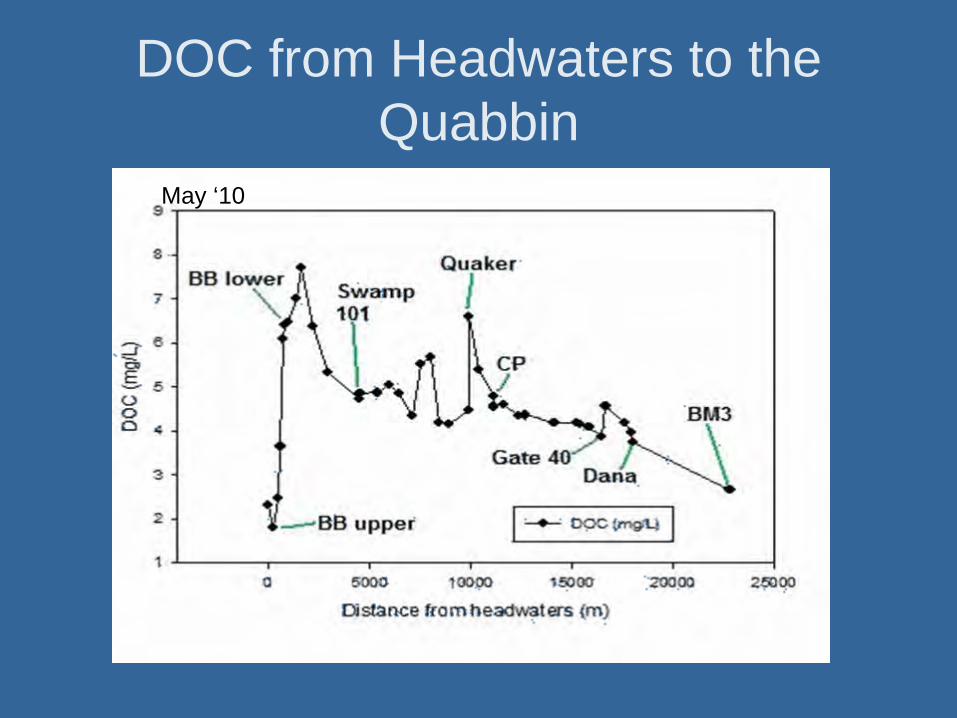
DOC from Headwaters to the Quabbin
May ‘10
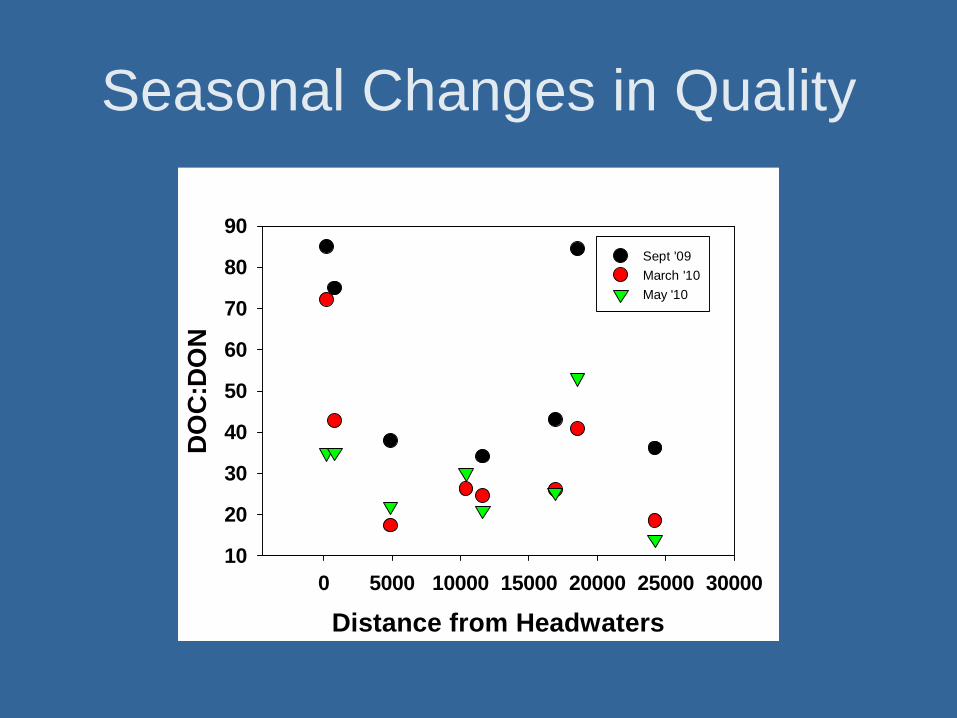
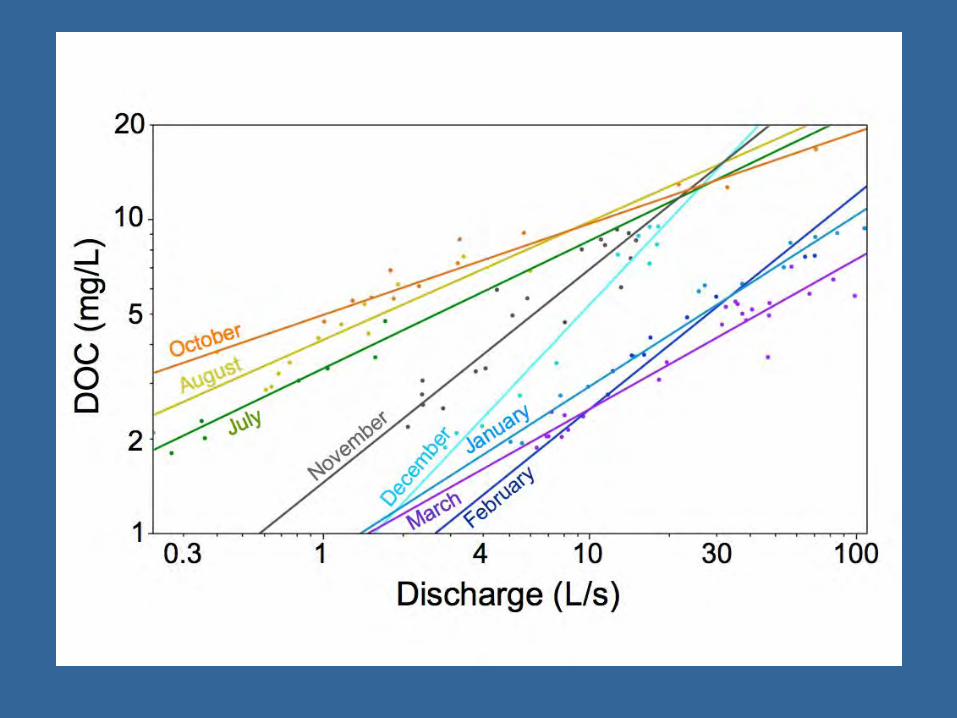
Seasonal Changes in Quality
Distance from Headwaters0 5000 10000 15000 20000 25000 30000
DO
C:D
ON
10
20
30
40
50
60
70
80
90Sept '09March '10May '10
Distance from Headwaters (m)0 5000 10000 15000 20000 25000
% L
abile
(28
days
)
0
5
10
15
20
25
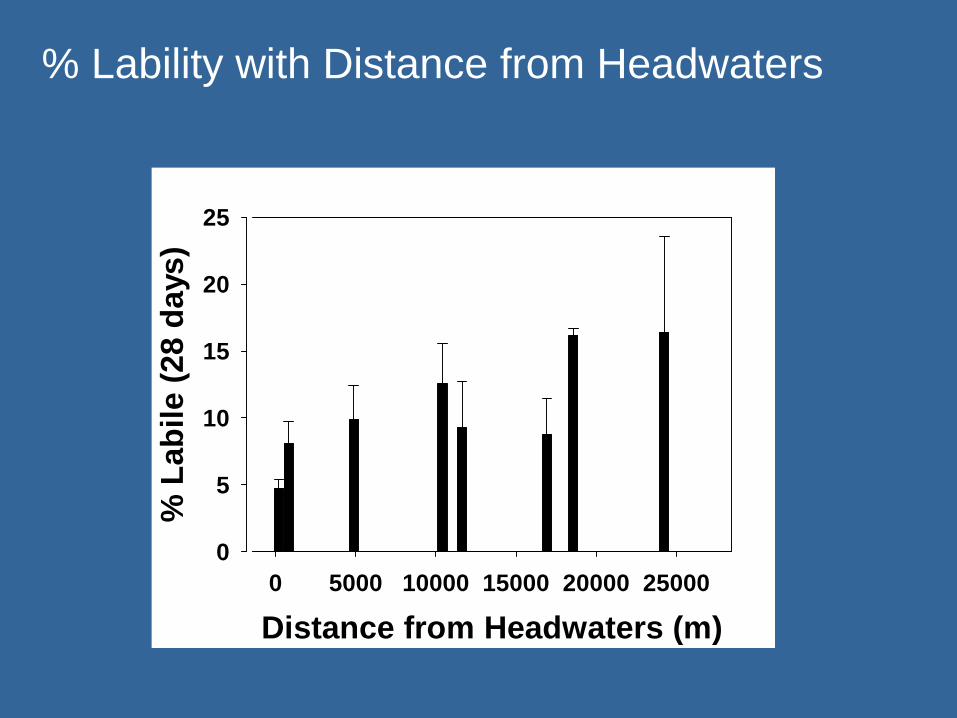
% Lability with Distance from Headwaters
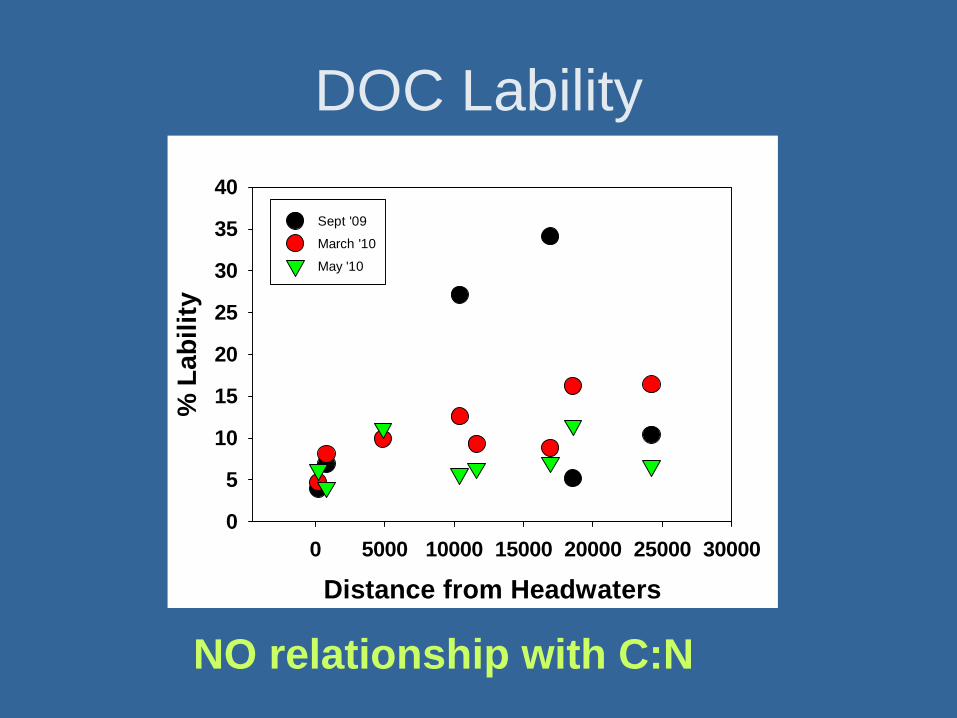
DOC Lability
Distance from Headwaters0 5000 10000 15000 20000 25000 30000
% L
abili
ty
0
5
10
15
20
25
30
35
40Sept '09
March '10
May '10
NO relationship with C:N
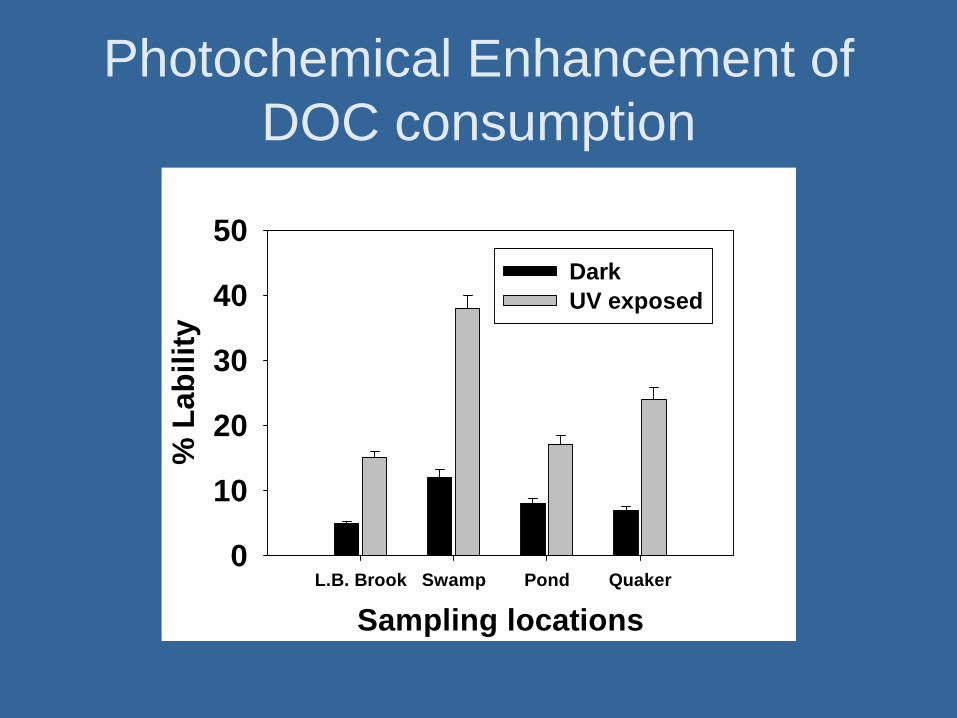
Photochemical Enhancement of DOC consumption
Sampling locationsL.B. Brook Swamp Pond Quaker
% L
abili
ty
0
10
20
30
40
50DarkUV exposed
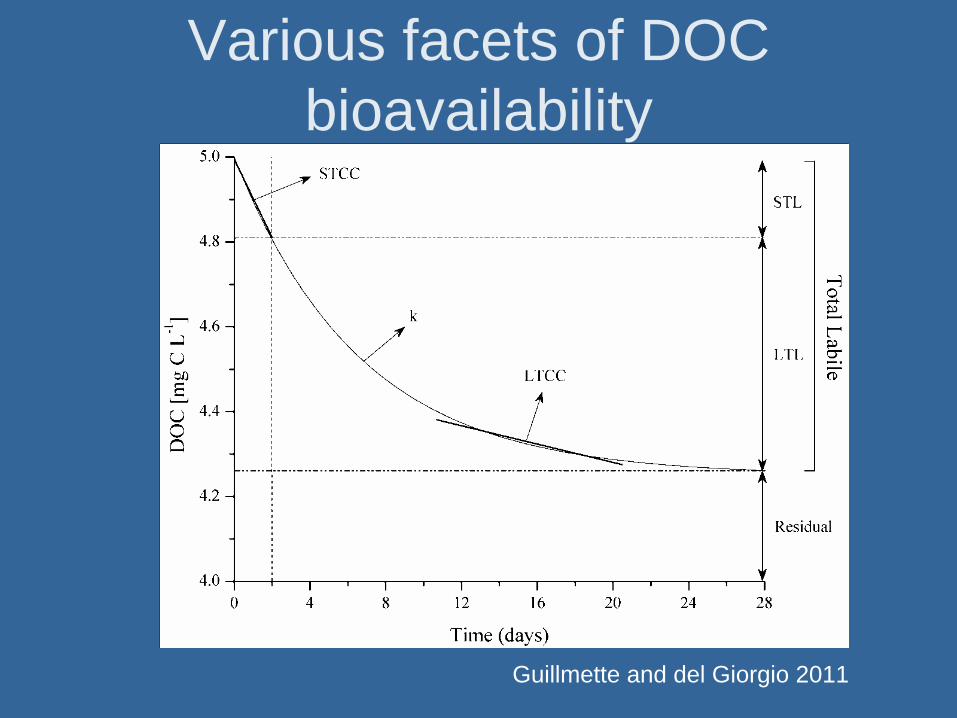
Various facets of DOC bioavailability
k 0
Guillmette and del Giorgio 2011
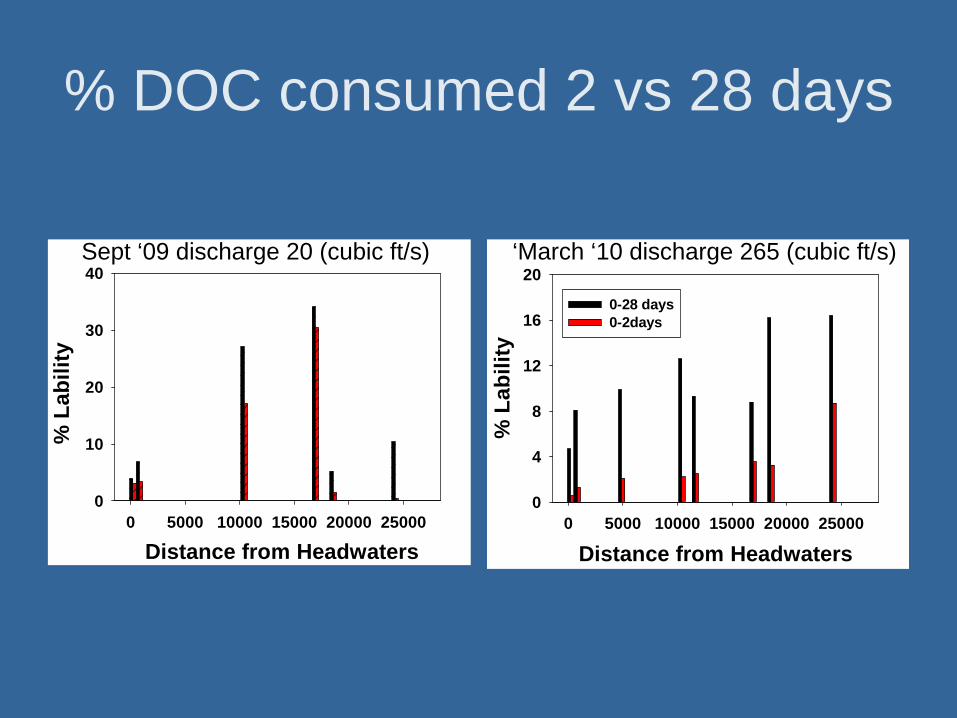
% DOC consumed 2 vs 28 days
Distance from Headwaters0 5000 10000 15000 20000 25000
% L
abili
ty0
4
8
12
16
20
0-28 days0-2days
0 5000 10000 15000 20000 250000
10
20
30
40
% L
abili
ty
Distance from Headwaters
Sept ‘09 discharge 20 (cubic ft/s) ‘March ‘10 discharge 265 (cubic ft/s)
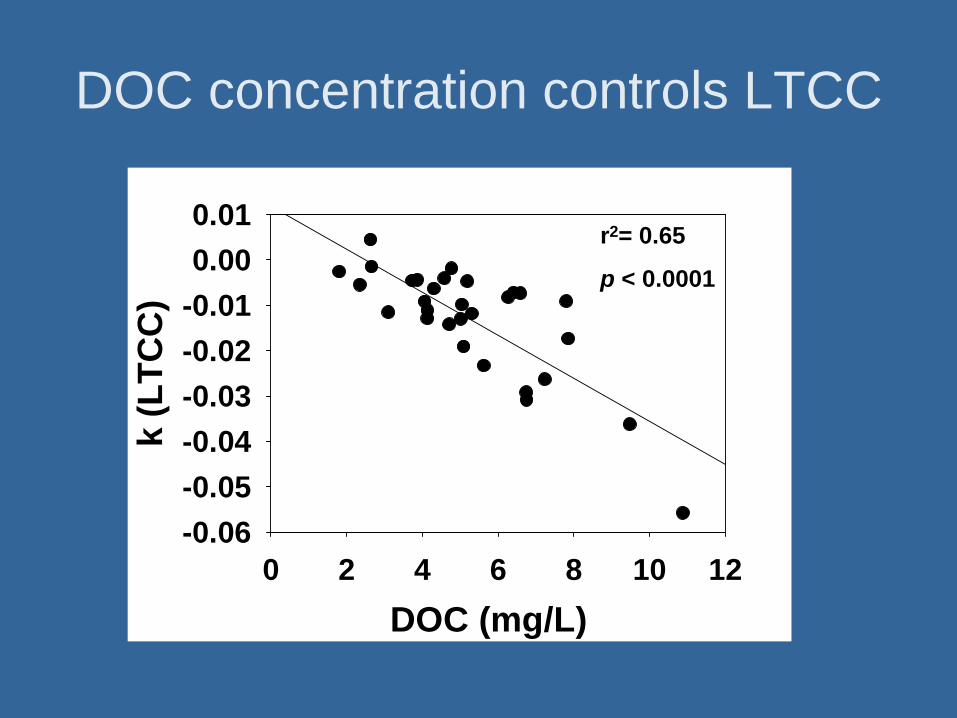
DOC concentration controls LTCC
DOC (mg/L)0 2 4 6 8 10 12
k (L
TCC
)
-0.06-0.05-0.04-0.03-0.02-0.010.000.01
r2= 0.65
p < 0.0001
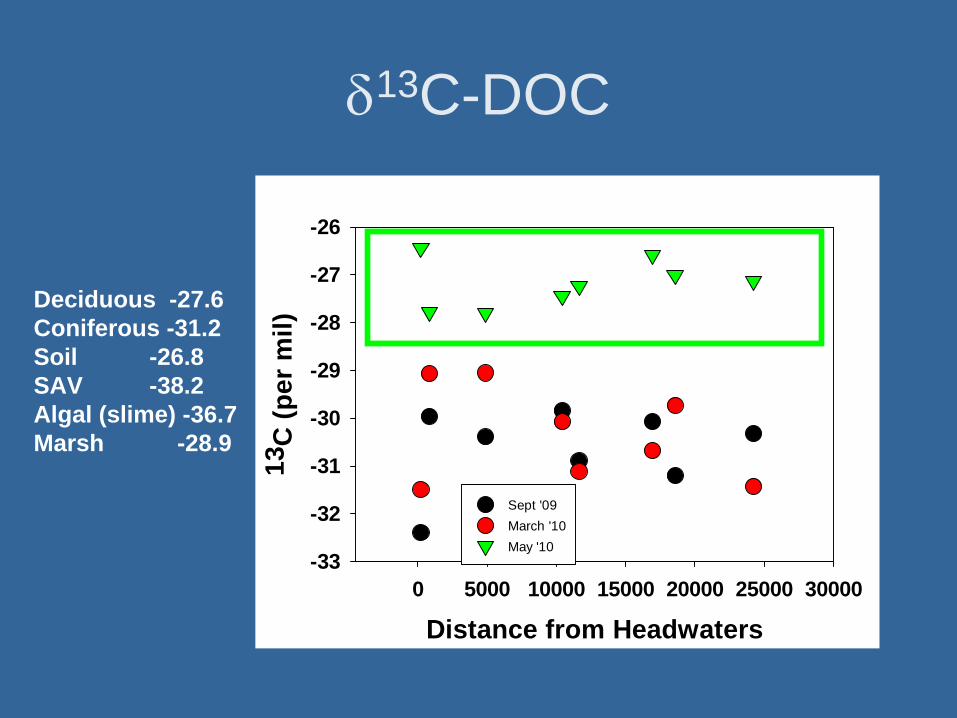
13C-DOC
Distance from Headwaters0 5000 10000 15000 20000 25000 30000
13C
(per
mil)
-33
-32
-31
-30
-29
-28
-27
-26
Sept '09March '10May '10
Deciduous -27.6Coniferous -31.2Soil -26.8SAV -38.2Algal (slime) -36.7Marsh -28.9
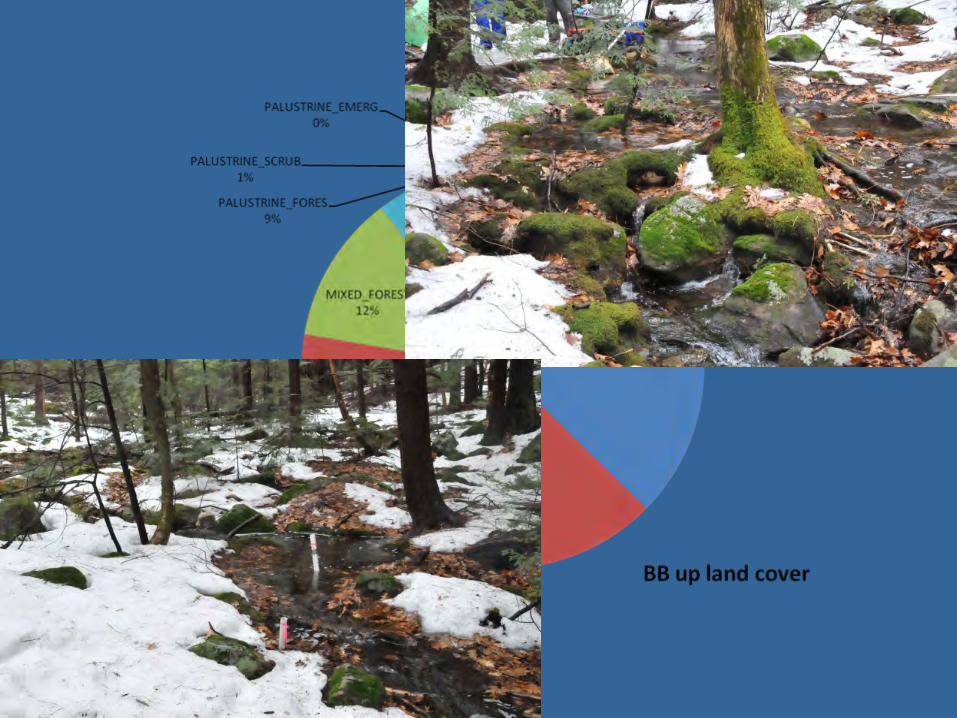
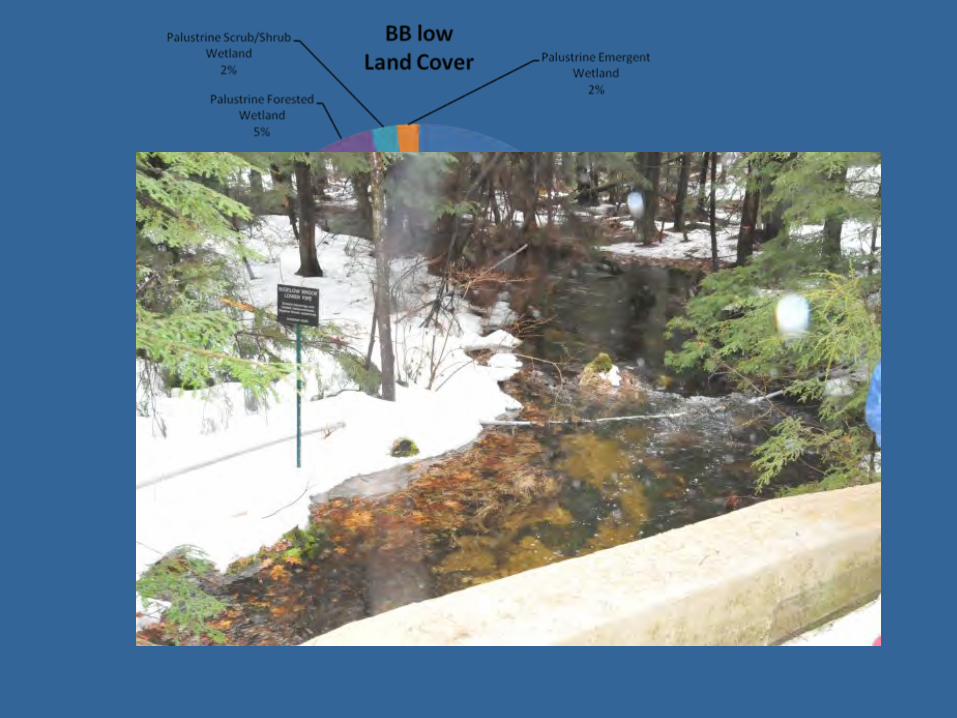
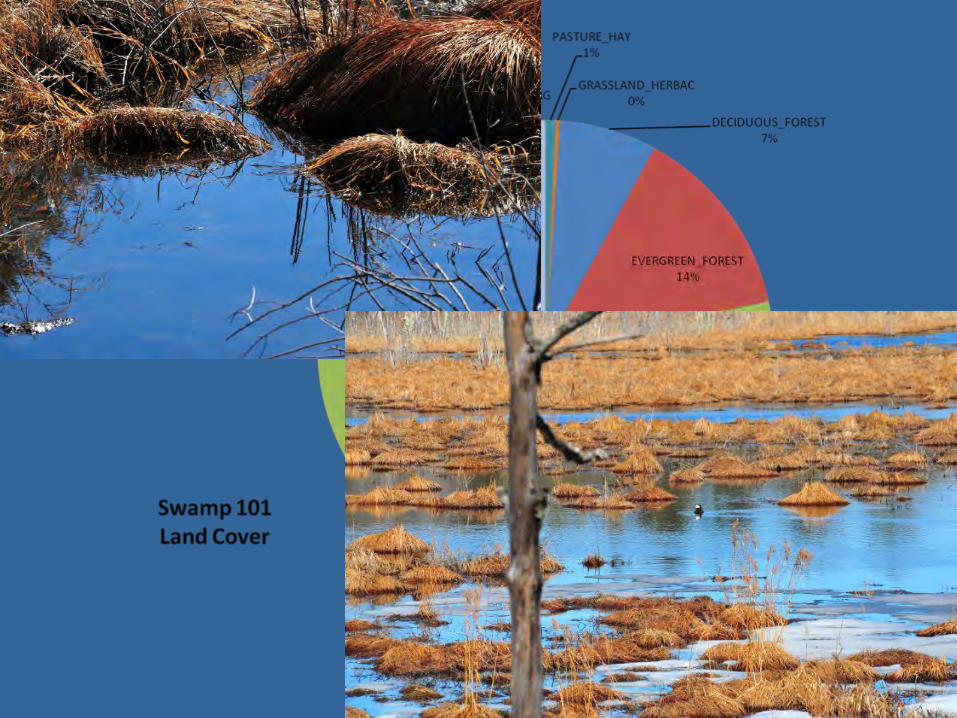
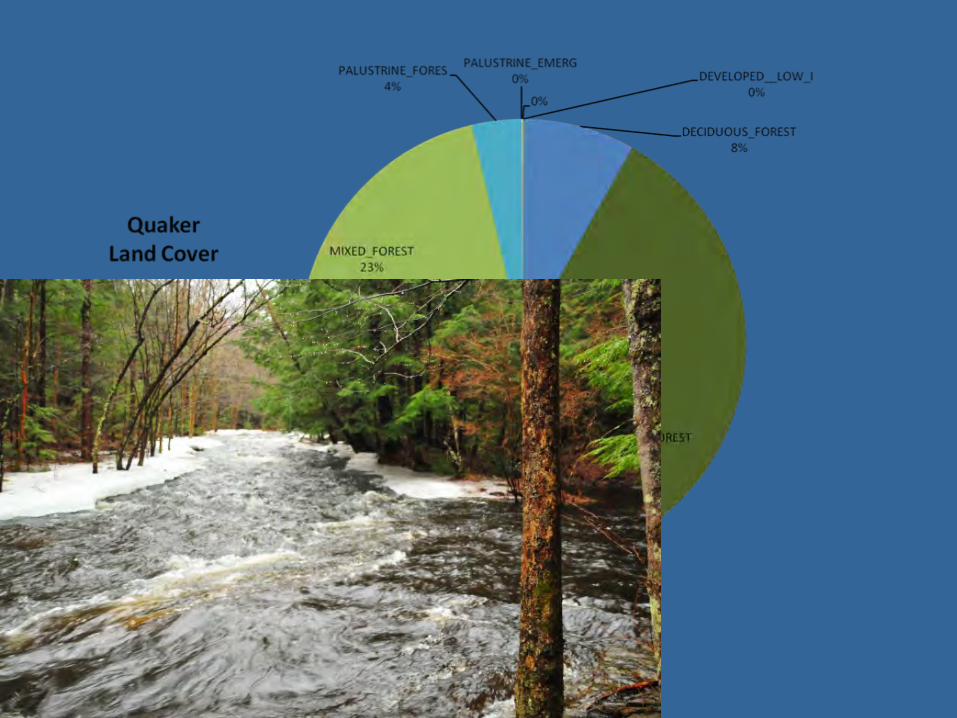
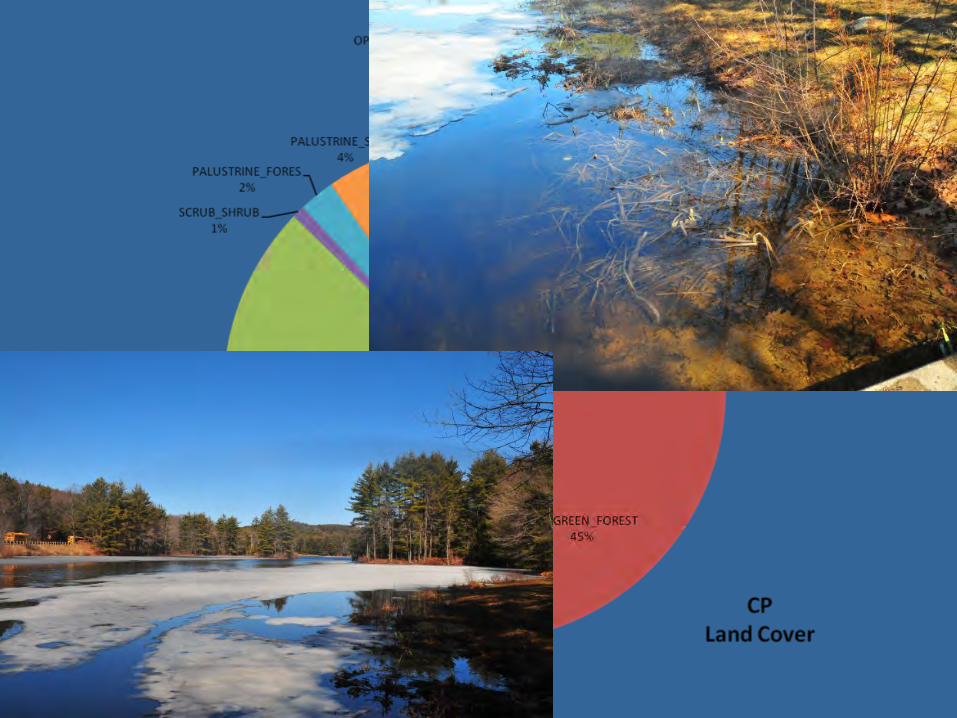
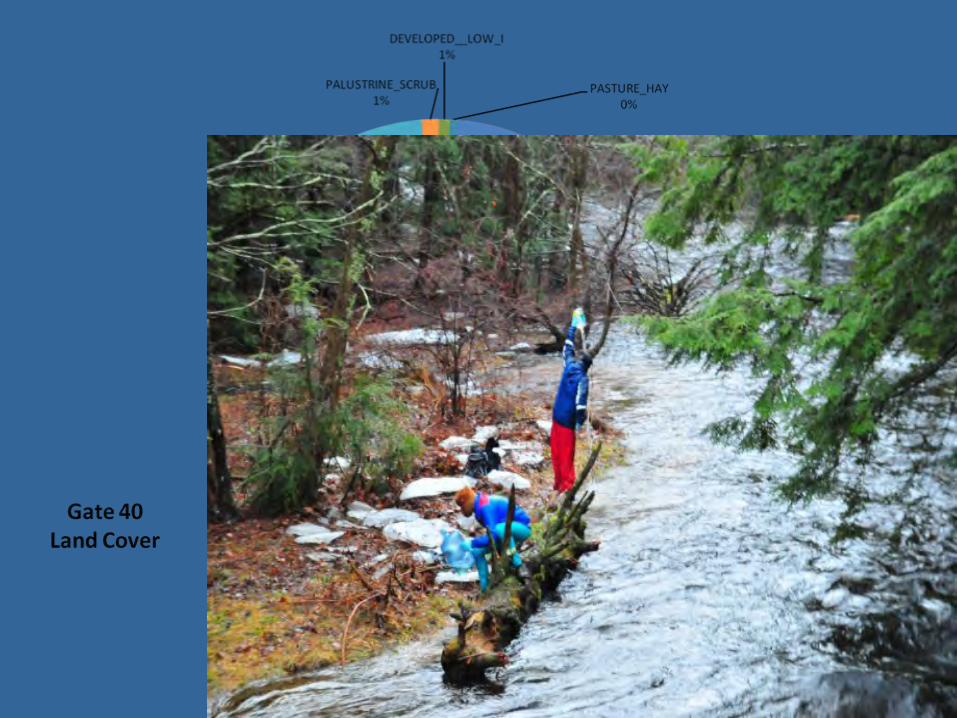
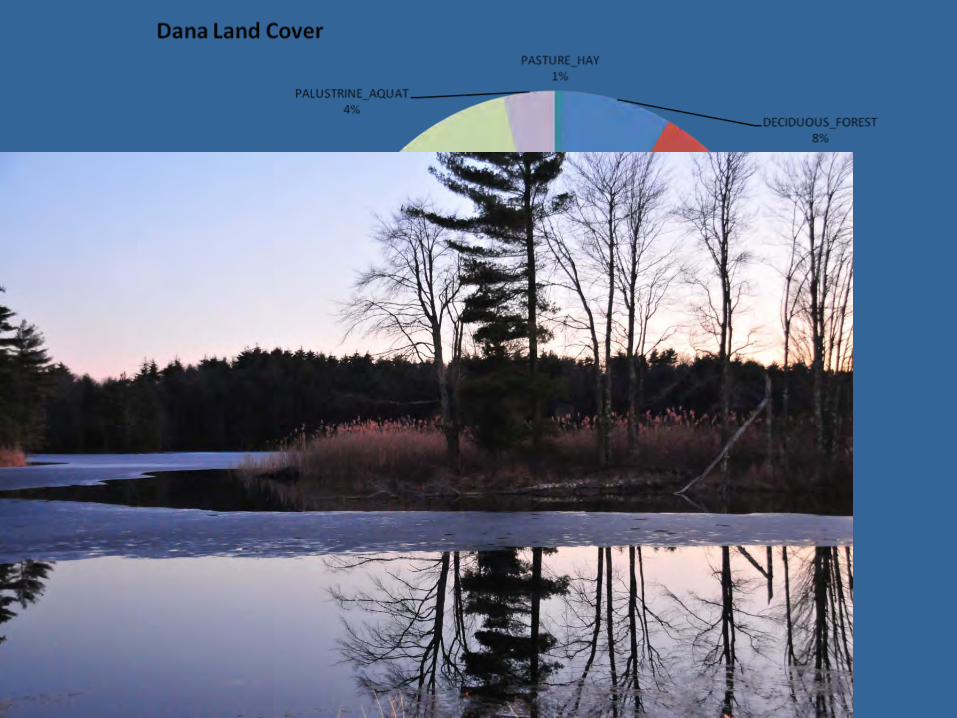
Watershed Controls
Mixed Forest best predictor for stream DOC concentration
Sept ’10 and ’11, Deciduous land cover best predictor for both the amount and % of DOC consumed
May ’09 and May ’10 Open water best predictor for the rate and amount of DOC consumed
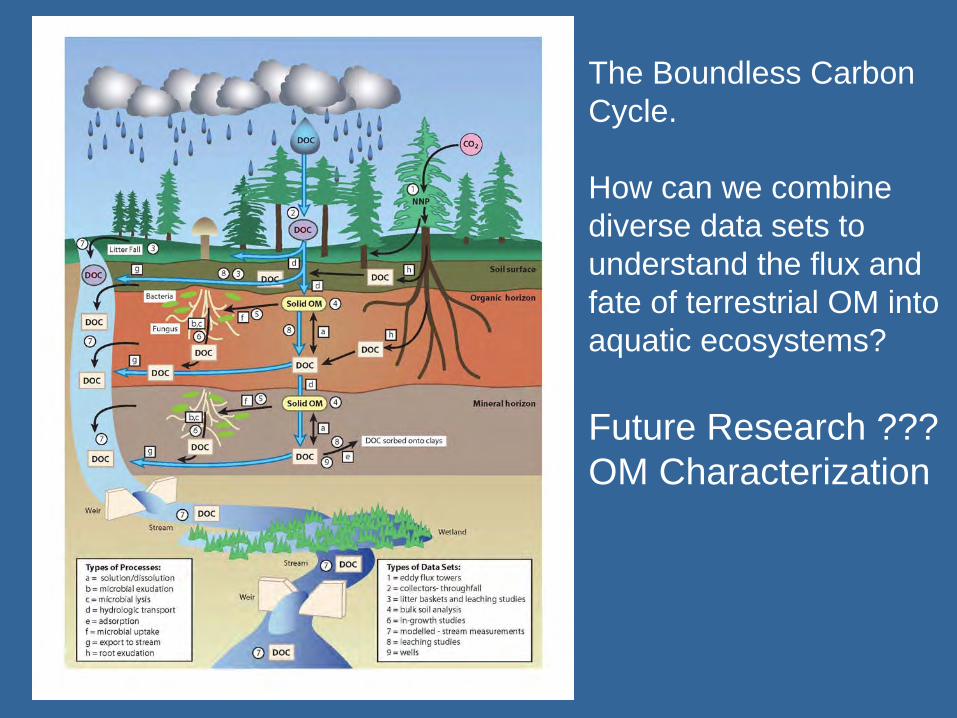
The Boundless Carbon Cycle.
How can we combinediverse data sets tounderstand the flux and fate of terrestrial OM intoaquatic ecosystems?
Future Research ???OM Characterization
Thanks to NSF-DEB
Harvard Forest
Emery Boose
Bill Sobzcak