organic and synthetic envelope laboratory...
TRANSCRIPT
of this book. There is very little evidence of reported problems due to the calcium and/or carbonates (in its various forms).
Organic matter The decay of organic envelope materials is enhanced by the presence of organ- ic matter in the soil, in particular for clay and loamy soils with a high pH (although not reported this could happen in sandy soils too). The USBR (1978/1993) mentions the undesirability of vegetable matter and other delete- rious substances in the gravel envelope which, in time, could alter the hydraulic conductivity. In the same sentence clay is also mentioned as unde- sirable. However, clay would reduce hydraulic conductivity, while deleterious materials (materials that ‘harm’ the gravel envelope) over time could leave gaps after decomposition, and hence reduce the filter action.
The amounts of organic matter are also important when there are substantial quantities of soluble iron (Fe2’) due to the danger of iron ochre, sulphur and manganese deposits. There are no actual measurements of the amount of organic matter content required for drain envelope design, and judgement of the presence of organic matter, particularly in granular envelopes, has been purely subjective. Geotextiles seem to be more susceptible to clogging by organic matter and iron ochre.
Sulphur and manganese Biological activity in subsurface drains may also result in manganese and sul- phur deposits as reported from the Netherlands (Scholten 1989) and the USA (Grass et al. 1975, Ford 1975). Typically, sulphur deposits are encountered in acid sulphate soils encountered in heavy clayey, coastal, areas. When a full soil chemical analysis is performed the presence of sulphur and manganese will be known, but at present no guidelines are available as to which concen- tration will cause trouble.
As mentioned before in the drain maintenance Section (4.5.4), Grass et al. (1975) describe the removal of oxides of iron and manganese (black deposits in drains) using sulphurous acid. Sulphurous acid is a strong reducing acid made by combining sulphur dioxide gas and water inside a drain.
5.6 Organic and synthetic envelope laboratory analysis
Many standard tests have been developed for specifying the properties of geo- textiles few of which apply to organic envelopes as well (primarily the pre- wrapped loose material such as the coconut fibres). Well-known standards on geotextiles are those of the American Society of Testing and Materials (ASTM), the European Committee for Standardisation (CEN) and the
190

International Organisation for Standardisation (ISO). These tests are prima- rily designed to meet the requirements for civil engineering applications of geotextiles and are largely concerned with mechanical properties. However, in the following sections where applicable reference will be made to the various guidelines and standards, no attempt has been made to compare or judge them. They are not specifications!
Box 19 explains some of the abbreviations used in the coding system of the European (CEN) and International Standards (SI). The preferred method of reporting values is in IS0 units, most US-based guidelines are based on'the English units. Guiding values of both systems are therefore mentioned in the text so that those familiar with the English units might recognise the original values. Other organisations such as AASHTO and Task Force 25 try to formulate unified specifications. AASHTO stands for the American Association of State Highway and Transportation Officials and Task Force 25 is a joint committee of various US construction associations (Koerner 1994). Values recommended by these two organisations will be given where appro- priate and available.
Box 19 Abbreviations and explanation of letter codes used with European standards.
I WI Work item WG Working group Mandate Order voucher leading to financing of standardisation work; not the mandate con-
taining the essential characteristics Milestone in the standardisation process: stage 11: discussion in WG going on stage 32: first draft circulated to Technical Committee stage 40: CEN enquiry (6 months period for comments on a draft standard) stage 49: formal vote (final stage before publication) European standard (to be reviewed every 5 years)
Stage
E N I S 0 International standard (to be reviewed every 5 years) E N I S 0 WD ENV prEN European draft standard prENV Draft European pre-standard
Standard that is both EN and I S 0 Working draft (stage in I S 0 corresponding to stage 11 in CEN) European pre-standard (validity period of 2 years)
Mechanical strength, abrasion resistance and degradation properties of geot- extiles are important in drain envelope applications because of the handling requirements of the covered pipes. In particular, for the larger pipe diameters that come in lengths of approximately 6 metres, it is important that the mate- rial has adequate grabhear strength. Field staff tend to lift the pipes by grab-
191
bing the envelope material rather than embracing the pipe and envelope dur- ing the lifting (embracing is a difficult manoeuvre with pipe diameters over 300 mm). The envelope materials must be able to withstand normal handling and passage through the drainage machine without developing tears or holes through which soil materials can enter the pipe. The materials must not stretch excessively or they will not offer the desired mechanical support to the soil by bridging over the tops of the corrugations. The corrugations of the pipe must remain open to serve as an entrance area and passage for water. The most important physical characteristics of a drain envelope material, after it is shown to have adequate physical strength, are the size of the openings and the permeability perpendicular to and in the plane.
5.6.1 Taking samples for testing
There are essentially two procedures for sampling (ASTM D 4354-96): proce- dure A is for specification conformance testing, and procedure B is for quality assurance testing. Both procedures require samples that include all possible sources of variation. EN 963 (1995) also gives guidelines for sampling and preparation of test specimens. The following steps in sampling can be applied to all the tests described: 1. Decide on the division of lots of any shipment or production quantity that
differs from other portions in specifications, style or physical characteris- tics.
2. Then, from each lot randomly select a number of sample (production) units (rolls of fabric, bales of fibre, cases of yarn, or rolls of pre-wrapped drain- pipes) for testing. The (production) unit is a quantity of geotextile agreed upon by purchaser and seller for sampling. Where there is no agreement a production unit quantity of 500 m2 (600 yd2) is suggested. For specification conformance testing, take from each lot the equivalent to the cube root of the total number of units included in the lot, but not less than one. If the cube root is a fractional number, take the next whole number. For quality assurance testing select 1 sample unit for a total of 200 units in the lot, 2 units for 500,3 units for 1000 and 4 units for 1001 or more units. An excep- tion may be made for time intensive quality tests such as ultraviolet degradation (Section 5.6.14); no more than 2 sample units should be select- ed per lot.
3. Select laboratory test samples from each sample unit as suggested for indi- vidual tests in the specifications or standard test descriptions.
4. Finally, from each laboratory sample select or prepare a number of test specimens depending on the type of test. In some cases laboratory samples and tests specimens can be the same.
192
I 1
5.6.2 Thickness
The method used to classify envelope material characteristics depends on the nature of the envelope. Thickness of loose fibre wrappings can be measured directly around the drain with a circometer or measuring tape (CEN/TC 155/WG 18). Thickness determination of geotextiles can be carried out on the geotextile itself, either prior to wrapping or after being removed from the drains, according to IS0 9863 (1990) or EN 964-1 (1995). Koerner (1994) observes that thickness is more a descriptive property rather than a design- oriented property. However, as was shown in Section 5.1.1, the thickness of the envelope has a major effect on the entrance resistance to a drain. Bhattia et al. 1994 indicated that there is a linear relationship between mass per unit area and thickness for non-woven materials (Box 20). ASTM D1599-88 stipu- lates that thickness should be measured to an accuracy of at least 0.02 mm (or 0.001 in) under a pressure of 2.0 kPa (= 0.29 lb/in2 = 42 lb/ ft2 = 20 gf/ cm2). Thickness of commonly used geotextiles range between 0.25 and 7.5 mm (10 - 300 mils, where 1 mil = 0.001 inch = 0.0254 mm).
5.6.3 Mass per unit area
Mass determination of loose fibre wrappings can be carried out according to the method discussed by CEN/TC 155/WG 18 (see Box 20). For geotextiles IS0 9864 (19901, EN 965 (1995), or ASTM D5261-92 are applicable. The mass per unit area is directly related to material cost and to some mechanical proper- ties and hence is of great importance. Mass per unit area available on the market ranges between 130 and 700 g/m2. The selection for drain envelopes depends on a range of other requirements such as thickness in view of entrance resistance, strength in view of handling, characteristic opening size in view of filtering requirements etc. In most cases the mass per unit area will be the independent variable amongst the variables. When two materials are near equivalent in all other properties, the one with a lower mass per unit area is likely to be cheaper.
5.6.4 Tensile strength, grab strength, tear strength, elongation, and seam strength
Tensile strength for geotextiles is the maximum resistance to deformation and can be characterised by force elongation, the breaking force, or the breaking elongation (ASTM D 4439-95, and D 4595-86, EN IS0 10319 (19961, BS 6906 part 1). The grab strength of a fabric is a measure of resistance to deforma- tion but only part of the width of the specimen is gripped in the clamps (ASTM D 4439-95, and D 1682). Seam strength is a measure that is either reported
193
in absolute units (i.e. kN/m) or as a percentage of the strength of the sheet (Koerner 1994, ASTM D 4884-90, EN IS0 10321 (1996)).
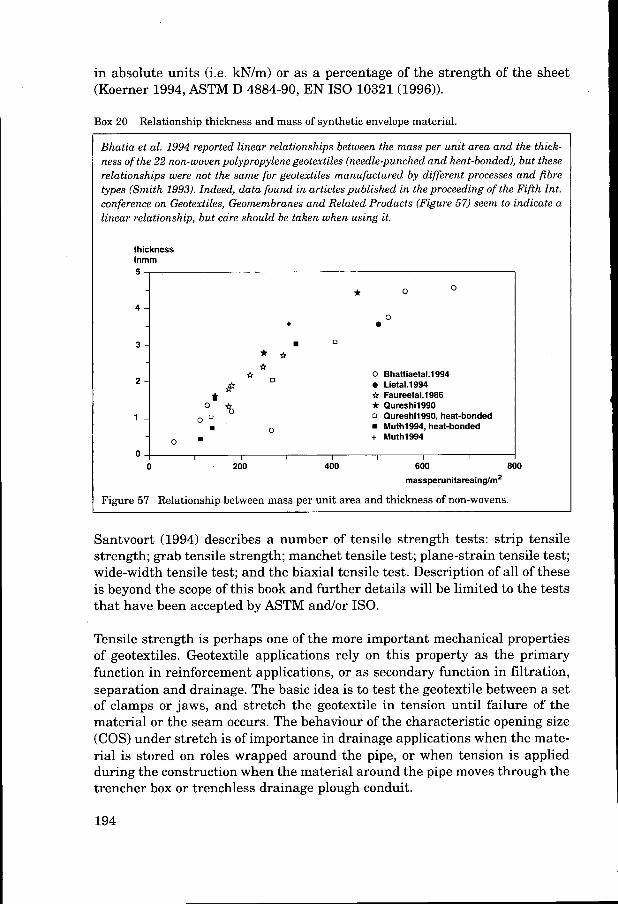
Box 20 Relationship thickness and mass of synthetic envelope material.
Bhatia et al. 1994 reported linear relationships between the mass per unit area and the thick- ness of the 22 non-woven polypropylene geotextiles (needle-punched and heat-bonded), but these relationships were not the same for geotextiles manufactured by different processes and fibre types (Smith 1993). Indeed, data found in articles published in the proceeding of the Fifth Int. conference on Geotextiles, Geomembranes and Related Products (Figure 57) seem to indicate a linear relationship, but care should be taken when using it.
thickness inmm 5
* O O
O '1 +
3i o * * * * o
$I
O % t
1 21 o n
i 0 = " O
O Bhattiaetal.1994 o Lieta1.1994 * Faureetal.1986 * Qureshi1990 o Qureshi1990, heat-bonded
Muth1994, heat-bonded + Muth1994
0 1 I I I I I I I
O 200 400 600 0
massperunitareaing/m*
Figure 57 Relationship between mass per unit area and thickness of non-wovens.
Santvoort (1994) describes a number of tensile strength tests: strip tensile strength; grab tensile strength; manchet tensile test; plane-strain tensile test; wide-width tensile test; and the biaxial tensile test. Description of all of these is beyond the scope of this book and further details will be limited to the tests that have been accepted by ASTM andor ISO.
Tensile strength is perhaps one of the more important mechanical properties of geotextiles. Geotextile applications rely on this property as the primary function in reinforcement applications, or as secondary function in filtration, separation and drainage. The basic idea is to test the geotextile between a set of clamps or jaws, and stretch the geotextile in tension until failure of the material or the seam occurs. The behaviour of the characteristic opening size (COS) under stretch is of importance in drainage applications when the mate- rial is stored on roles wrapped around the pipe, or when tension is applied during the construction when the material around the pipe moves through the trencher box or trenchless drainage plough conduit.
194
The grab strength is important for field handling of wrapped drainpipes, in particular those with larger diameters, when field staff grab the envelope to lift the pipe. Equally important during field handling and construction is the tear strength of the material. It is defined as the force required to either start or propagate a tear in fabric under specified conditions (ASTM D 4439-95). The three commonly used methods to determine the tearing strength are: the Trapezoid Tearing test, the Tongue Tear test and the Elmendorf Tear test. The
I I I first is the one most commonly used in the USA (ASTM D 4533-95).
To determine the tensile strength of the material, the laboratory sample should consist of a full width swath of approximately 1 m in the machine direction from each roll of the lot sample, and preferably not from the outer wrapping of the roll. Elaborate instructions for the number of test specimens based on statistical significance at the 95% probability level are given in ASTM D 4596-93. For test specimens of the seam test, 6 samples are sug- gested per lot sample. Detailed instructions on how to cut and sew the sam- ples are given in ASTM D 4884-90. Grab strength determination is given in ASTM D 1682.
Typical tensile strength values of available geotextiles are (Koerner 1994): wide width tensile strength 9 - 180 kN/m (50 - 1000 lb/in) seam strength 50 - 100% of tensile strength.
Interestingly, Koerner (19941, describes the tensile strength tests in some detail, but does not describe the grab test or grab strength. Yet, in a listing of requirements of governmenthtate agencies of the US, only grab strength and grab elongation are reported not tensile strength. For road and construction drainage requirements the following values were prescribed (values in N are rounded to the nearest 10). Class B requirements seem closest to what may be expected with agricultural drainage.
Grab strength Class A31 800 N (180 lb), one state with 890 N (200 Ib).
Grab strength Class B 360 - 400 N (80 - 90 Ib). AASHTO M288-90 and Task
Grab elongation 15 - 20 %, some States as high as 50,80 and 100%. AASH-
AASHTO M288-90 and Task Force 25 require 400 N (80 Ib).
Force 25 require 360 N.
TO M288-90 and Task Force 25 do not give a required value.
31 Class A geotextiles are used where installation stresses are higher than Class B applications (i.e. very coarse, sharp, angular aggregate is used, a heavy degree of compaction [>95% of AASHTO T991 is specified, or the depth of the trench is greater than 3 m [lo ftl.). Class B geotextiles are used with smooth graded surfaces having no sharp, angular projections and sharp, angular aggregate is not used. Compaction requirements are light (<95% AASHTO T99) and trenches are less than 3 m in depth.
195
For Trapezoid Tearing strength the following values are required in various US States:
Trapezoid tearing strength Class A: 220 N (50 lb). Trapezoid tearing strength Class B: 110 N (25 Ib). When Class A or B is not specified prescribed values are 110 - 220 N (25 - 50 lb).
For sewn-seam strength the following are required in various US States: Sewn-seam strength Class A: 310 - 710 N (70 -160 lb). AASHTO M288-90
Sewn-seam strength Class B: 310 - 360 N (70 - 80 lb). AASHTO M288-90 and Task Force 25 require 710 N.
and Task Force 25 require 310 N.
5.6.5 Static puncture test
The static puncture test determines the force to push a flat plunger through a geotextile and is described in EN IS0 12236 (1996) and ASTM D4833-88. The test measures the resistance of the geotextile against punctures by rocks, gravel, and other sharp objects. The damage might occur during transport or during installation of the drainpipe.
For the laboratory sample take a full width swath of sufficient length along the selvage from each sample roll so that the requirements for test specimens based on statistical considerations (details see ASTM D 4833) can be met. The selvage is the edge of a fabric woven so that it will not unravel.
For road and construction drainage requirements the following values are prescribed (Koerner 1994) by various states in the US and AASHTO and Task Force 25:
Puncture strength Class A: 110 - 360 N (25 - 80 lb). AASHTO M288-90 and
Puncture strength Class B: 110 - 160 N (25 - 35 lb). AASHTO M288-90 and Task Force 25 require 360 N.
Task Force 25 require 110 N.
5.6.6 Compressibility
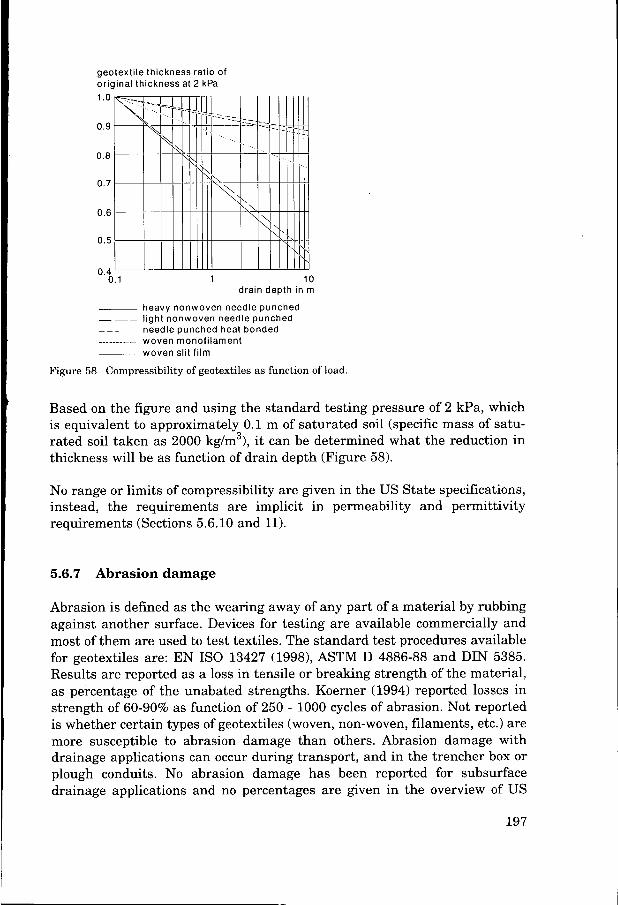
Compressibility of both pre-wrapped loose material and needle punched non- woven material will have a major effect on the transmissivity of the material, and also on the permeability perpendicular to the plane, as well as on the characteristic opening size. Compressibility as a function of applied stress or load is given in Figure 58 for different geotextiles.
196
geotextile thickness ratio of original thickness at 2 kPa
drain depth in m
- heavy nonwoven needle punched
_ _ _ - - needle punched heat bonded ..........~ woven monofilament
light nonwoven needle punched
woven slit film
F igure 58 Compressibi l i ty of geotextiles as funct ion of load.
Based on the figure and using the standard testing pressure of 2 kPa, which is equivalent to approximately 0.1 m of saturated soil (specific mass of satu- rated soil taken as 2000 kg/m3), it can be determined what the reduction in thickness will be as function of drain depth (Figure 58).
No range or limits of compressibility are given in the US State specifications, instead, the requirements are implicit in permeability and permittivity requirements (Sections 5.6.10 and 11).
5.6.7 Abrasion damage
Abrasion is defined as the wearing away of any part of a material by rubbing against another surface. Devices for testing are available commercially and most of them are used to test textiles. The standard test procedures available for geotextiles are: EN IS0 13427 (1998), ASTM D 4886-88 and DIN 5385. Results are reported as a loss in tensile or breaking strength of the material, as percentage of the unabated strengths. Koerner (1994) reported losses in strength of 60-90% as function of 250 - 1000 cycles of abrasion. Not reported is whether certain types of geotextiles (woven, non-woven, filaments, etc.) are more susceptible to abrasion damage than others. Abrasion damage with drainage applications can occur during transport, and in the trencher box or plough conduits. No abrasion damage has been reported for subsurface drainage applications and no percentages are given in the overview of US
197
State agency requirements (Koerner 1994). Santvoort (1994) does not address the issue of abrasion.
5.6.8 Porosity, percent open area
Porosity of geotextiles is a property that is used with non-woven fabrics. Percent Open Area (POA) is primarily applicable for woven, mono-filament fabrics (Koerner 1994). POA varies from 1 - 36% (essentially closed - extreme- ly open) for woven mono-filament geotextiles, with commercial geotextiles often with a POA = 6 -12%. There are no standards for measurement of POA and planimetry is the best way to determine it. Project light through the spec- imen onto a large poster size piece of cardboard, which may or may not be covered with millimetre paper. Then use either a planimeter or count squares where light is projected. The total area (yarns plus voids) must be measured at the same magnification as the voids measured. The technique is not appli- cable for non-wovens.
Van der Sluys and Dierickx (1987) found that the porosity of non-woven geot- extiles they used in permeability experiments had E = 0.81 - 0.87. The poros- ity increased with increase in mass. Several other geotextiles (mono- and multi-filaments) had POA values between 0.65 and 0.77, however there were not enough samples reported to determine a relationship with mass. The range of typical values for porosity was between 50-95% (Koerner 1994).
Porosity of geotextiles can be determined from:
P & = 1- -
Pf T,
where, 1-1 Pf
T,
mass per unit surface area in g/m2 ; fibre density in g/m3 (Box 21); and mean geotextile thickness in m.
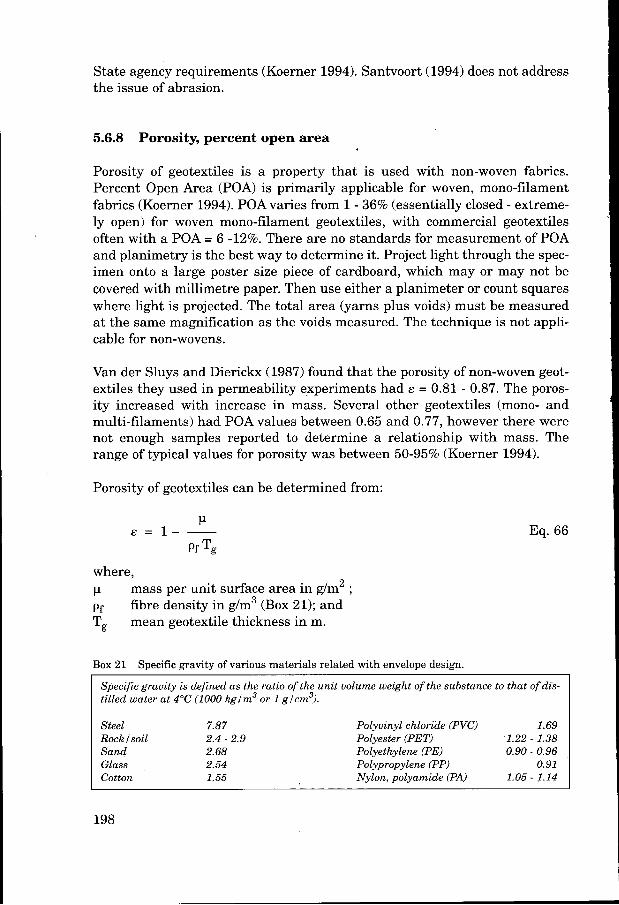
Box 21 Specific gravity of various materials related with envelope design.
Eq. 66
Specific gravity is defined as the ratio of the unit volume wezght of the substance to that of dis- tilled water at 4°C (1000 kglm3 or 1 glcm3).
Steel 7.87
Sand 2.68 Glass 2.54 Cotton 1.55
Rock /soil 2.4 - 2.9 1.69 Polyvinyl chloride (PVC)
Polyester (PET) 1.22 - 1.38 Polyethylene (PE) 0.90 - 0.96 Polypropylene (PPI 0.91 Nylon, polyamide (PA) 1.05 - 1.14
198
Porosity of geotextiles is occasionally measured directly as described in Section 5.6.9. Porosity though highly dependent on the pressure under which the fabric is applied, does not change as dramatically as the thickness of non- wovens (Figure 58). Giroud (1996) demonstrated that a 50% decrease in thick- ness reduced the initial porosity of 0.91 of a typical non-woven, needle- punched geotextile by'10% to 0.82. POA and E are ratios of open area to total area or volume of pore space to total volume. The actual size (distribution) of the pores in geotextiles are characterised in the next section. Just like com- pressibility, POA and porosity are generally not required in specifications, instead, these characteristics are implicit in the requirements for transmis- sivity and permittivity (Sections 5.6.10 and 11).
'
5.6.9
The main function of wrapping geotextile around drain tubes is to enhance the conveyance of water towards the openings of the drainage system while restraining soil particles. To assure soil particle retention, the soil gradation curve must be known as well as the opening size of the geotextile. Therefore, it is essential that at least one characteristic opening size (COS) of the geotextile is known besides the particle size distribution or a characteristic particle size of the soil.
Opening size distribution and characteristic opening size
,
There are different definitions of COS and values often used are 08,, Og0, O,, and Og8 which can be defined as the diameter of the opening of which 85,90, 95 or 98 percent of the openings have a smaller diameter (this corresponds with the 85, 90, 95, or 98 percent of the material retained when using sieving techniques to determine COS). I t should be noted that although COS is an opening size, the definition is often given in terms of an equivalent grain size (since it is usually determined by using the material as a sieve). The design- er should be aware of these differences and consider the opening characteris- tics in relation to the determination method. Depending on the method of determination reported COS values can differ by a factor of 2 - 4.
I
There are a number of direct and indirect methods for the determination of the COS as well as the opening size distribution of geotextiles. The indirect methods comprise three basic sieving methods (Van der Sluys and Dierickx 1990, Gerry and Raymond 1983, ASTMD 4751, Mlynarek et al. 1993): dry sieving, wet sieving, and the hydrodynamic sieving. A fourth method, a com- bination of the dry and wet sieving (modified wet sieving), is also given as a variant. Direct methods are the Bubble Point Method (Hoffman 1983, ASTM 1991), the Mercury Intrusion Method (Prapaharan, et al. 1989, ASTM D-4404); and Image Analysis (Masounave et al. 1980, Lombard and Rollin 1987, Faure et al. 1990, Bhatia et al. 1993). Many manufacturers according to Rollin et al.
199
(1990) use the bubble point method. Finally, another method just mentioned for completeness sake but will not be described in detail, is the moisture des- orption method (Dennis and Davies 1984).
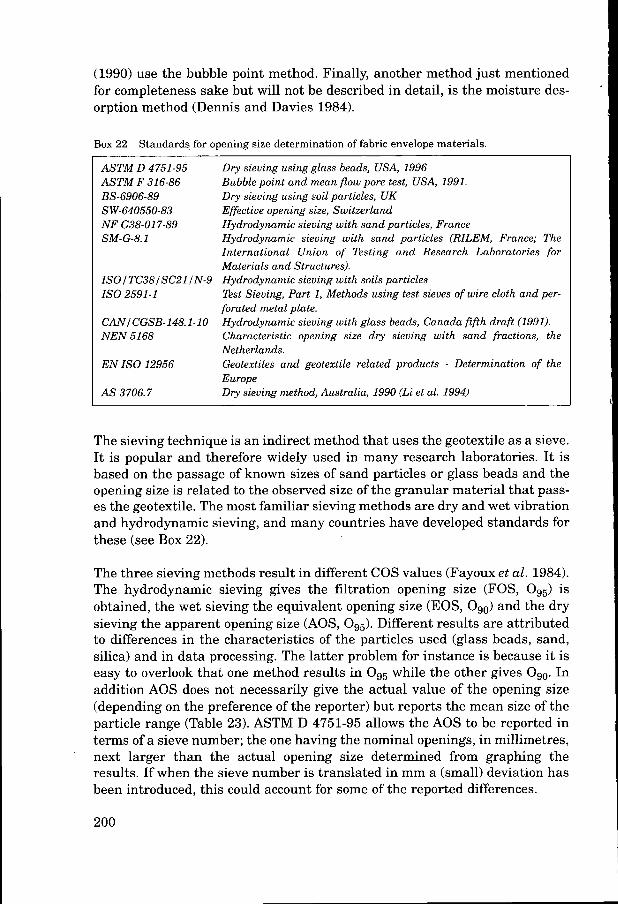
Box 22 Standards for opening size determination of fabric envelope materials.
ASTM D 4751-95 ASTM F 31 6-86 BS-6906-89 S W-640550-83 NF G38-017-89 SM-G-8.1
I S 0 1 TC38lSC21 IN-9 I S 0 2591-1
CAN1 CGSB-148.1-1 O NEN 51 68
EN I S 0 12956
A S 3706.7
Dry sieving using glass beads, USA, 1996 Bubble point and mean flow pore test, USA, 1991. Dry sieving using soil particles, UK Effective opening size, Switzerland Hydrodynamic sieving with sand particles, France Hydrodynamic sieving with sand particles (RILEM, France; The International Union of Testing and Research Laboratories for Materials and Structures). Hydrodynamic sieving with soils particles Test Sieving, Part 1, Methods using test sieves of wire cloth and per- forated metal plate. Hydrodynamic sieving with glass beads, Canada fifth draft (1991). Characteristic opening size dry sieving with sand fractions, the Netherlands. Geotextiles and geotextile related products - Determination of the Europe Dry sieving method, Australia, 1990 (Li et al. 1994)
The sieving technique is an indirect method that uses the geotextile as a sieve. It is popular and therefore widely used in many research laboratories. I t is based on the passage of known sizes of sand particles or glass beads and the opening size is related to the observed size of the granular material that pass- es the geotextile. The most familiar sieving methods are dry and wet vibration and hydrodynamic sieving, and many countries have developed standards for these (see Box 22).
The three sieving methods result in different COS values (Fayow et al. 1984). The hydrodynamic sieving gives the filtration opening size (FOS, Og5) is obtained, the wet sieving the equivalent opening size (EOS, Og0) and the dry sieving the apparent opening size (AOS, Og5). Different results are attributed to differences in the characteristics of the particles used (glass beads, sand, silica) and in data processing. The latter problem for instance is because it is easy to overlook that one method results in Og5 while the other gives Ogo. In addition AOS does not necessarily give the actual value of the opening size (depending on the preference of the reporter) but reports the mean size of the particle range (Table 23). ASTM D 4751-95 allows the AOS to be reported in terms of a sieve number; the one having the nominal openings, in millimetres, next larger than the actual opening size determined from graphing the results. If when the sieve number is translated in mm a (small) deviation has been introduced, this could account for some of the reported differences.
200
When the same base material was used and data processing was done in the same way, no significant differences were found between the three sieving methods, even when either sand or glass beads were used (Van der Sluys and Dierickx, 1990). With dry sieving static electricity and loss of fines becoming airborne due to the vibrations affected sieving results with the very fine par- ticle sizes (Dierickx 199313). Rollin et al. (1990) suggested that glass beads should be used when FOS lower than 75 ym is expected to be determined for selecting envelope materials to be used in silty uniform soils.
I
1 i
I
Calculating the COS using textile properties such as the Denier number and mass of the geotextile have met with mixed success. The pore size distribution of two non-woven geotextiles with the same weight but one manufactured with a denier fibre of 3 and the other of 9 will be completely different. The size and type of needles used for needle punched non-woven geotextiles, the specific polymer used (knowing that it is polypropylene is not enough!), the stabilisers and the sizing or finishing, all have different hydrophobic and hydrophilic effects: they all affect and determine the characteristic opening size. All these parameters cannot be examined without an unreasonable amount of work, and it is therefore necessary to have an index or performance test (Floss et al. 1990). The COS determination methods most used will be briefly described, followed by a conclusion and comparison between the methods.
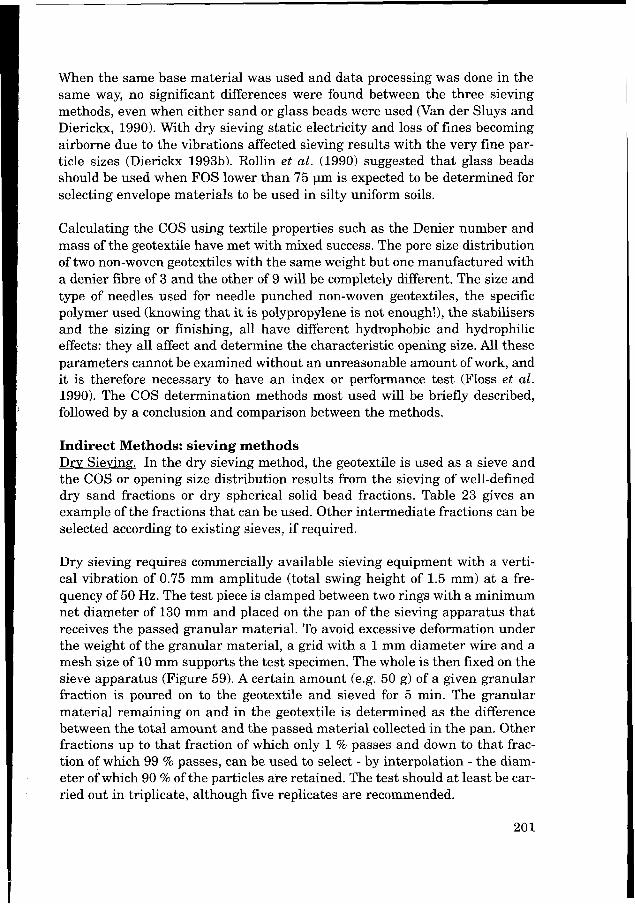
Indirect Methods: sieving methods Drv Sieving. In the dry sieving method, the geotextile is used as a sieve and the COS or opening size distribution results from the sieving of well-defined dry sand fractions or dry spherical solid bead fractions. Table 23 gives an example of the fractions that can be used. Other intermediate fractions can be selected according to existing sieves, if required.
Dry sieving requires commercially available sieving equipment with a verti- cal vibration of 0.75 mm amplitude (total swing height of 1.5 mm) at a fre- quency of 50 Hz. The test piece is clamped between two rings with a minimum net diameter of 130 mm and placed on the pan of the sieving apparatus that receives the passed granular material. To avoid excessive deformation under the weight of the granular material, a grid with a 1 mm diameter wire and a mesh size of 10 mm supports the test specimen. The whole is then fixed on the sieve apparatus (Figure 59). A certain amount (e.g. 50 g) of a given granular fraction is poured on to the geotextile and sieved for 5 min. The granular material remaining on and in the geotextile is determined as the difference between the total amount and the passed material collected in the pan. Other fractions up to that fraction of which only 1 % passes and down to that frac- tion of which 99 % passes, can be used to select - by interpolation - the diam- eter of which 90 % of the particles are retained. The test should at least be car- ried out in triplicate, although five replicates are recommended.
20 1
Dry sieving is a quick and simple method which can be done with commer- cially available sieving equipment. Its disadvantage, however, is that it is dif- ficult to apply to fine structured geotextiles with a COS smaller than 100 pm because of electrostatic forces which make the fine granular particles adhere to the geotextile, giving false results. The method also requires the availabil- ity of granular fractions. Dry sieving has been accepted to determine the open- ing size of loose fibre wrappings (CEN/TC 155N 1261E 1994).
Table 23 Sand fractions to determine the characteristic opening size of geotextiles. (after Santvoort (1994).
Range of Mean particle size Range of Mean particle size particle size, pm used for COS, pm particle size, pm used for COS, pm
37 - 53 53 - 74 74 - 105
105 - 149 149 - 210 210 - 250 250 - 297 297 - 420
45.0 63.5 89.5
127.0 179.5 230.0 273.5 358.5
420- 590 590- 840 840 - 1 190
1 190 - 1680 1680 - 2 O00 2 O00 - 2 380 2 380 - 3 360 3 360 - 4 760
505.0 715.0
1015.0 1435.0 1840.0 2 190.0 2 870.0 4 060.0
f
i
vertical sieving motion
clamping device
granular material
grid support specimen I I ' II
amplitude regulator A
$ Figure 59 Diagram of the equipment for dry sieving.
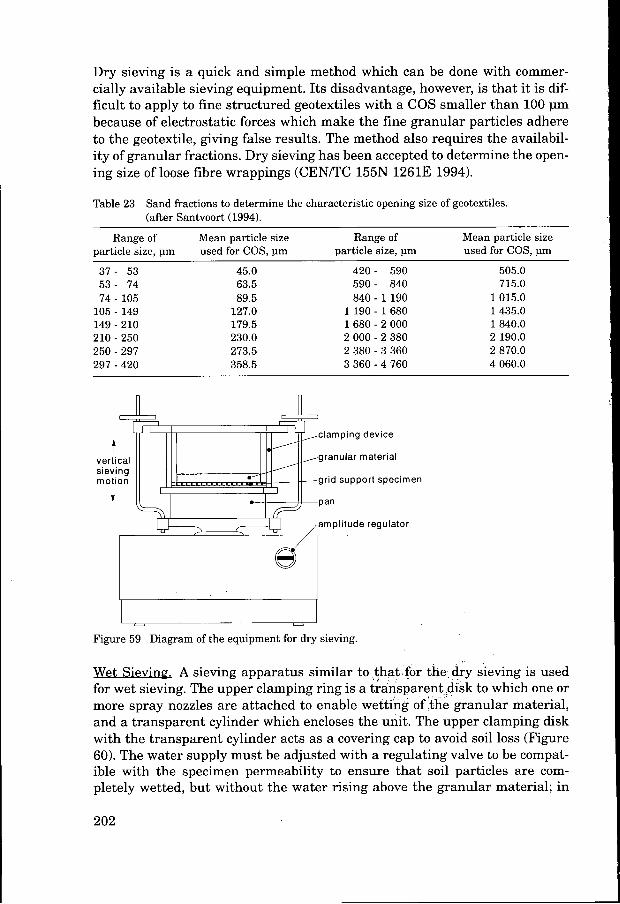
Wet Sieving. A sieving apparatus similar to that for the dry sieving is used for wet sieving. The upper clamping ring is a transparentAdisk to which one or more spray nozzles are attached to enable wetting of'the granular material, and a transparent cylinder which encloses the unit. The upper clamping disk with the transparent cylinder acts as a covering cap to avoid soil loss (Figure 60). The water supply must be adjusted with a regulating valve to be compat- ible with the specimen permeability to ensure that soil particles are com- pletely wetted, but without the water rising above the granular material; in
202
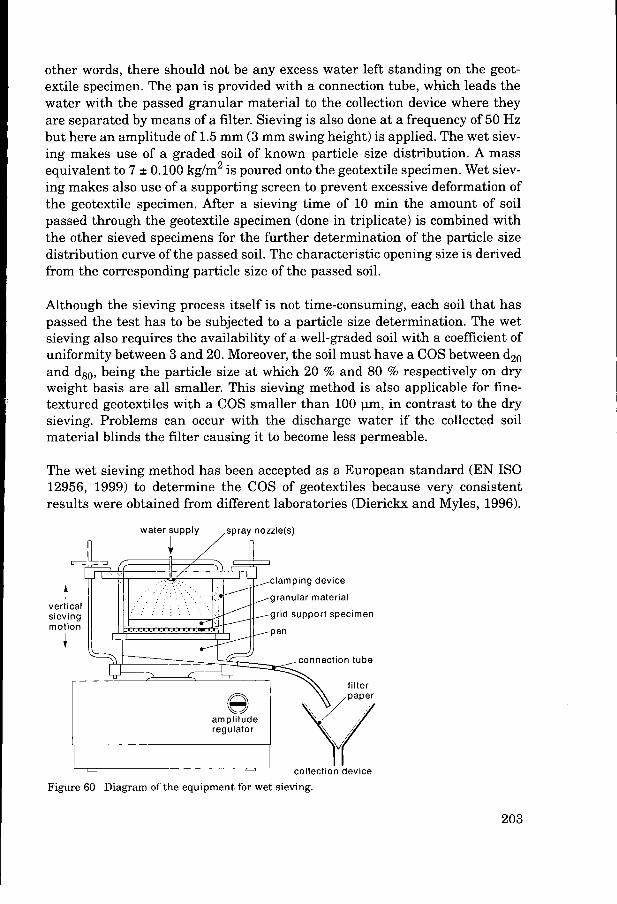
other words, there should not be any excess water left standing on the geot- extile specimen. The pan is provided with a connection tube, which leads the
Although the sieving process itself is not time-consuming, each soil that has passed the test has to be subjected to a particle size determination. The wet sieving also requires the availability of a well-graded soil with a coefficient of uniformity between 3 and 20. Moreover, the soil must have a COS between d,, and d8,, being the particle size at which 20 % and 80 % respectively on dry weight basis are all smaller. This sieving method is also applicable for fine- textured geotextiles with a COS smaller than 100 pm, in contrast to the dry sieving. Problems can occur with the discharge water if the collected soil material blinds the filter causing it to become less permeable.
,
The wet sieving method has been accepted as a European standard (EN IS0 12956, 1999) to determine the COS of geotextiles because very consistent results were obtained from different laboratories (Dierickx and Myles, 1996).
water supply ,spray nozzle(s)
n clamping device
granular material
grid support specimen
onnection tube
filter
Y Y ' collection device
F igure 60 D i a g r a m of t h e equipment for w e t sieving.
203
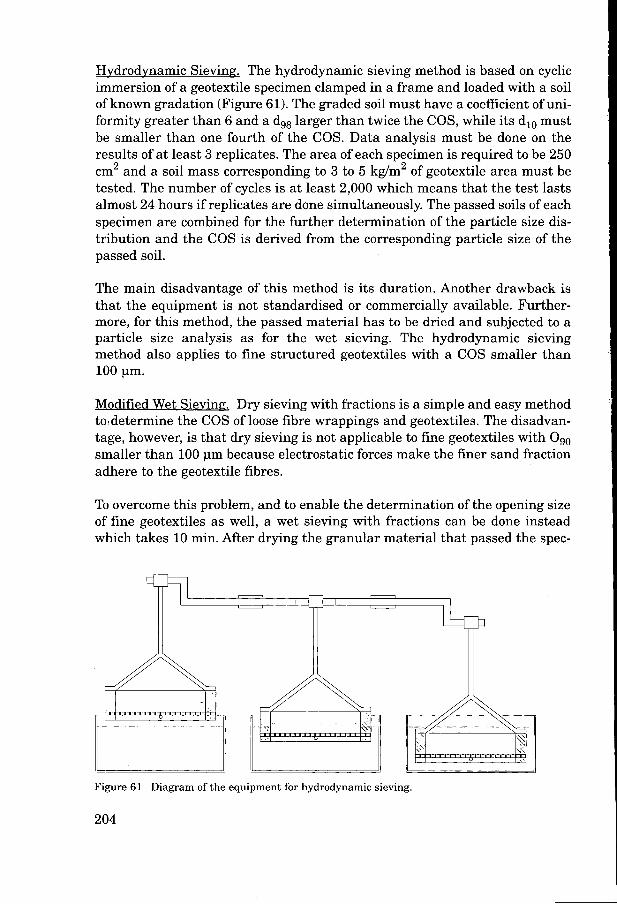
Hvdrodynamic Sieving. The hydrodynamic sieving method is based on cyclic immersion of a geotextile specimen clamped in a frame and loaded with a soil of known gradation (Figure 61). The graded soil must have a coefficient of uni- formity greater than 6 and a dg8 larger than twice the COS, while its d,, must be smaller than one fourth of the COS. Data analysis must be done on the results of at least 3 replicates. The area of each specimen is required to be 250 cm2 and a soil mass corresponding to 3 to 5 kg/m2 of geotextile area must be tested. The number of cycles is at least 2,000 which means that the test lasts almost 24 hours if replicates are done simultaneously. The passed soils of each specimen are combined for the further determination of the particle size dis- tribution and the COS is derived from the corresponding particle size of the passed soil.
The main disadvantage of this method is its duration. Another drawback is that the equipment is not standardised or commercially available. Further- more, for this method, the passed material has to be dried and subjected to a particle size analysis as for the wet sieving. The hydrodynamic sieving method also applies to fine structured geotextiles with a COS smaller than 100 pm.
Modified Wet Sieving. Dry sieving with fractions is a simple and easy method to?determine the COS of loose fibre wrappings and geotextiles. The disadvan- tage, however, is that dry sieving is not applicable to fine geotextiles with Og0 smaller than 100 pm because electrostatic forces make the finer sand fraction adhere to the geotextile fibres.
To overcome this problem, and to enable the determination of the opening size of fine geotextiles as well, a wet sieving with fractions can be done instead which takes 10 min. After drying the granular material that passed the spec-
>
Figure 61 Diagram of the equipment for hydrodynamic sieving.
204
imen, the data of the modified wet sieving can be analysed in the same way as for dry sieving.
Direct methods Bubble Method. This method is based on the following two principles: (1) a dry porous material will allow the passage of air through all of its pores when any amount of air pressure is applied to one side of the material; and (2) a sat- urated porous material will only allow a fluid to pass through when the pres- sure applied exceeds the capillary attraction of the fluid in the largest pore. Because the smaller pores pass air as the air pressure is increased, the largest opening (Og5) and pore size distribution of the geotextile can be evaluated. The main drawback of the method is that the results depend on the interpre- tation by the observer.
Mercurv Intrusion Method. The mercury intrusion porosimetry method is based on the theory (Washburn equation) which relates the pressure required to force a non-wetting fluid (mercury) into pores of a geotextile with the radius of the pores intruded. Pore size distribution can be determined. Although the mercury displacing some of the fibres affects mercury intrusion, the results of replications remain in a very narrow range.
Imane Analvsis. This is a technique that measures pore spaces directly with- in a cross-sectional plane of a geotextile. The tests were time-consuming and there was no standard methodology then. The results could be replicated fair- ly well (Bhatia et al. 1994).
Concluding remarks on determination Characteristic Opening Size Bhatia et al. 1994 compared the various methods of determining COS, and Table 24 and Table 25 summarise their findings based on the material presented in their paper. Taking the dry sieving method as the baseline method with an Og5 as the AOS, Table 24 shows that the AOS determined by the wet sieving, hydrodynamic sieving, and the bubble point method gave 50% smaller AOS values on average than the dry sieving method. The mercury intrusion and image analysis methods produced higher values. Preference is given to the wet and hydrodynamic sieving methods as the best and most practical method for determining the EOS and FOS (Ogo, 0 9 5 respectively). However, this conclusion is subject to the type of material tested (Table 25); not a single method performed best for all materials.
205
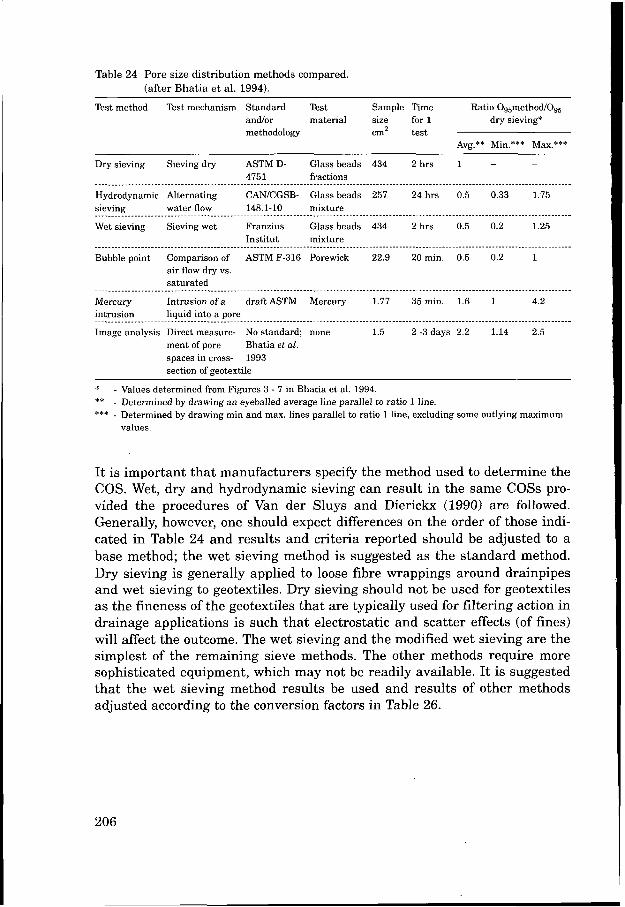
Table 24 Pore size distribution methods compared. (after Bhatia et al. 1994).
Test method Test mechanism Standard Test Sample Time Ratio Os5method/Os, and/or material size for 1 dry sieving* methodology cmz test
Avg.** Min.*** Max.***
Dry sieving Sievingdry ASTM D- Glass beads 434 2 hrs 1 - -
4751 fractions
Hydrodynamic Alternating CANKGSB- Glass beads 257 24 hrs 0.5 0.33 1.75 sieving water flow 148.1-10 mixture
Wet sieving Sieving wet Franzius Glass beads 434 2 hrs 0.5 0.2 1.25 ................................................................................................................................................
Institut mixture ................................................................................................................................................ Bubble point Comparison of ASTM F-316 Porewick 22.9 20 min. 0.5 0.2 1
air flow dry vs. saturated ................................................................................................................................................
Mercury Intrusion ofa draftAsTM Mercury 1.77 35 min. 1.6 1 4.2 intrusion liquid into a pore
Image analysis Direct measure- No standard; none 1.5 2 -3 days 2.2 1.14 2.5 ................................................................................................................................................
ment of pore spaces in cross- 1993 section of geotextile
Bhatia et al.
* ** *** - Determined by drawing min and max. lines parallel to ratio 1 line, excluding some outlying maximum
- Values determined from Figures 3 - 7 in Bhatia e t al. 1994. - Determined by drawing an eyeballed average line parallel to ratio 1 line.
values.
It is important that manufacturers specify the method used to determine the COS. Wet, dry and hydrodynamic sieving can result in the same COSs pro- vided the procedures of Van der Sluys and Dierickx (1990) are followed. Generally, however, one should expect differences on the order of those indi- cated in Table 24 and results and criteria reported should be adjusted to a base method; the wet sieving method is suggested as the standard method. Dry sieving is generally applied to loose fibre wrappings around drainpipes and wet sieving to geotextiles. Dry sieving should not be used for geotextiles as the fineness of the geotextiles that are typically used for filtering action in drainage applications is such that electrostatic and scatter effects (of fines) will affect the outcome. The wet sieving and the modified wet sieving are the simplest of the remaining sieve methods. The other methods require more sophisticated equipment, which may not be readily available. It is suggested that the wet sieving method results be used and results of other methods adjusted according to the conversion factors in Table 26.
206
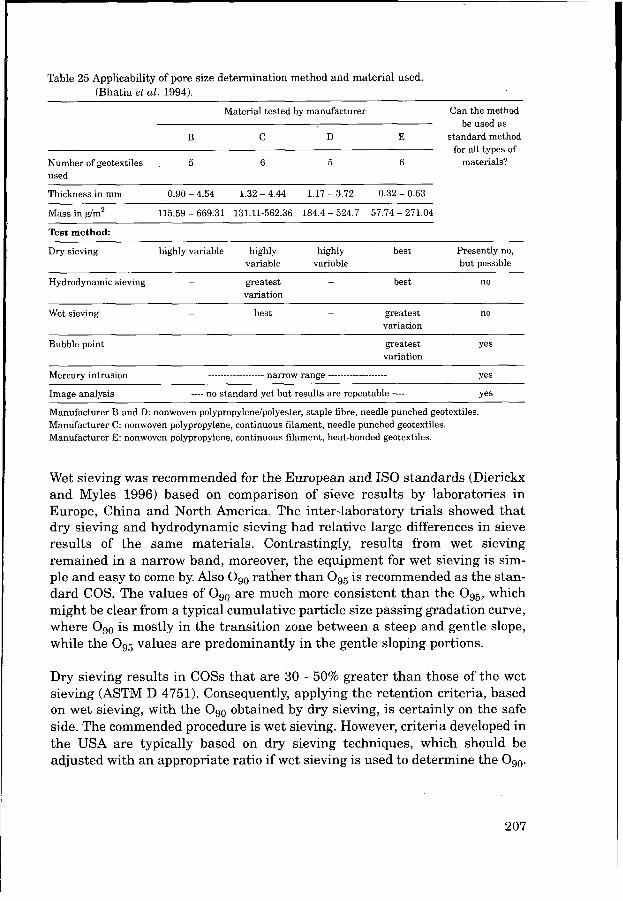
Table 25 Applicability of pore size determination method and material used. (Bhatia et al. 1994).
Material tested by manufacturer Can the method be used as
B C D E standard method for all types of
Number of geotextiles . 5 6 5 6 materials? used
Thickness in mm 0.90-4.54 1.32-4.44 1.17-3.72 0.32-0.63
Mass in g/m2 115.59 - 669.31 131.11-562.36 184.4 - 524.7 57.74 - 271.04
Test method
Dry sieving highly variable highly highly best Presently no, variable variable but possible
- - Hydrodynamic sieving greatest best no variation
- - Wet sieving best greatest no variation
Bubble point greatest yes variation
~~ ~
Yes
Yes
_.______________.. narrow range ___...___________.. Mercury intrusion
Image analysis ---- no standard yet but results are repeatable ----
Manufacturer B and D: nonwoven polypropylene/polyester, staple fibre, needle punched geotextiles. Manufacturer C : nonwoven polypropylene, continuous filament, needle punched geotextiles. Manufacturer E: nonwoven polypropylene, continuous filament, heat-bonded geotextiles.
Wet sieving was recommended for the European and IS0 standards (Dierickx and Myles 1996) based on comparison of sieve results by laboratories in Europe, China and North America. The inter-laboratory trials showed that dry sieving and hydrodynamic sieving had relative large differences in sieve results of the same materials. Contrastingly, results from wet sieving remained in a narrow band, moreover, the equipment for wet sieving is sim- ple and easy to come by. Also OgO rather than O,, is recommended as the stan- dard COS. The values of O,, are much more consistent than the Og5, which might be clear from a typical cumulative particle size passing gradation curve, where Og0 is mostly in the transition zone between a steep and gentle slope, while the Og5 values are predominantly in the gentle sloping portions.
Dry sieving results in COSs that are 30 - 50% greater than those of the wet sieving (ASTM D 4751). Consequently, applying the retention criteria, based on wet sieving, with the 0 9 0 obtained by dry sieving, is certainly on the safe side. The commended procedure is wet sieving. However, criteria developed in the USA are typically based on dry sieving techniques, which should be adjusted with an appropriate ratio if wet sieving is used to determine the Og0.
207
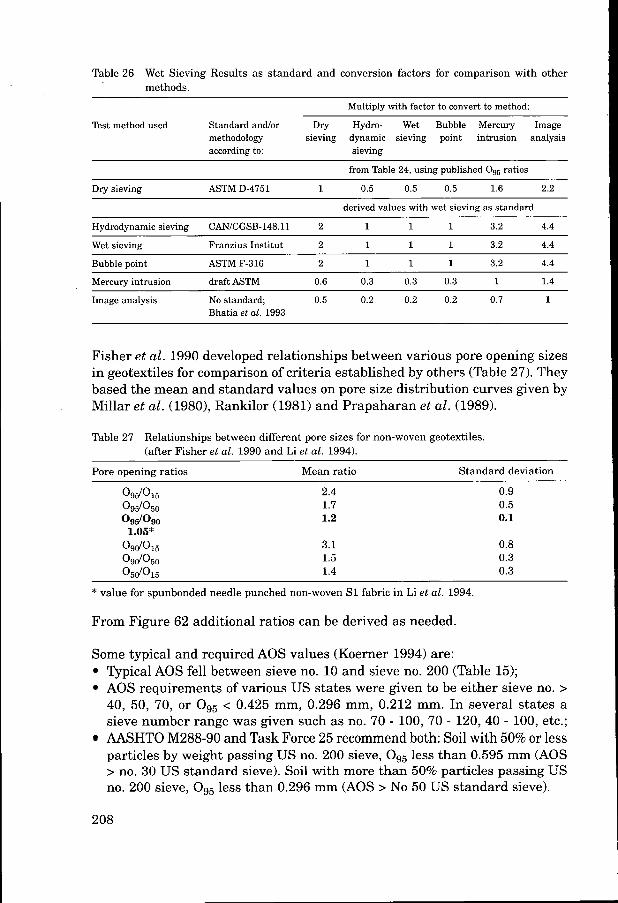
Table 26 Wet Sieving Results as standard and conversion factors for comparison with other methods.
Multiply with factor to convert to method:
Test method used Standard and/or Dry Hydro- Wet Bubble Mercury Image methodology sieving dynamic sieving point intrusion analysis according to: sieving
from Table 24, using published O,, ratios
Dry sieving ASTM D-4751 1 0.5 0.5 0.5 1.6 2.2
derived values with wet sieving as standard
Hydrodynamic sieving CAN/CGSB-148.11 2 1 1 1 3.2 4.4
Wet sieving Franzius Institut 2 1 1 1 3.2 4.4 ~
Bubble point ASTM F-316 2 1 1 1 3.2 4.4
Mercurv intrusion draft ASTM 0.6 0.3 0.3 0.3 1 1.4
Image analysis No standard; 0.5 0.2 0.2 0.2 0.7 1 Bhatia et al. 1993
Fisher et al. 1990 developed relationships between various pore opening sizes in geotextiles for comparison of criteria established by others (Table 27). They based the mean and standard values on pore size distribution curves given by Millar et al. (1980), Rankilor (1981) and Prapaharan et al. (1989).
Table 27 Relationships between different pore sizes for non-woven geotextiles. (after Fisher et al. 1990 and Li et al. 1994).
Pore opening ratios Mean ratio Standard deviation
O9do15 2.4 0.9
OsdOso 1.2 0.1
O9d0l5 3.1 0.8
095/050 1.7 0.5
1.05*
09d050 1.5 0.3 05d015 1.4 0.3
* value for spunbonded needle punched non-woven S1 fabric in Li et al. 1994.
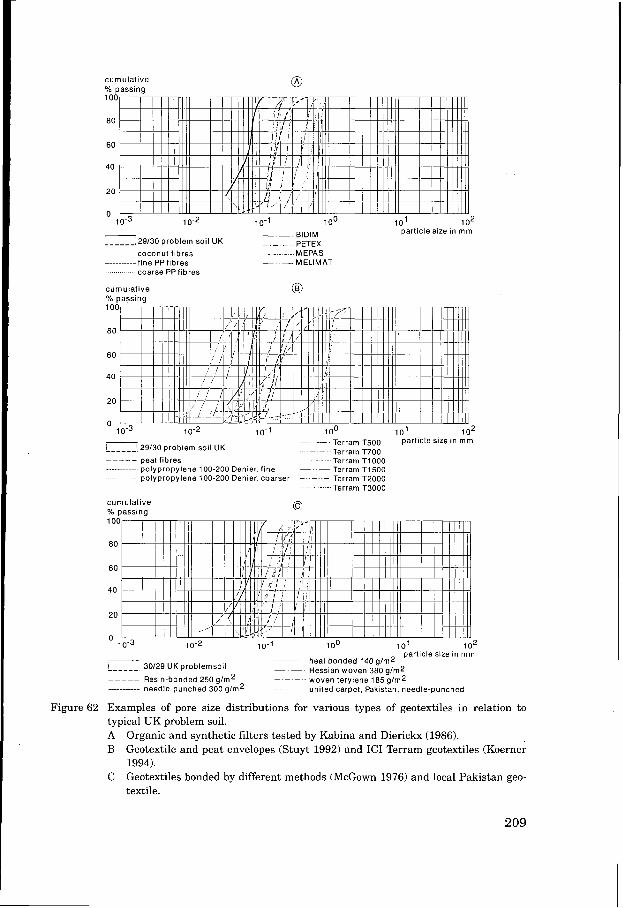
From Figure 62 additional ratios can be derived as needed.
Some typical and required AOS values (Koerner 1994) are: Typical AOS fell between sieve no. 10 and sieve no. 200 (Table 15); AOS requirements of various US states were given to be either sieve no. > 40, 50, 70, or 09, < 0.425 mm, 0.296 mm, 0.212 mm. In several states a sieve number range was given such as no. 70 - 100,70 - 120,40 - 100, etc.; AASHTO M288-90 and Task Force 25 recommend both: Soil with 50% or less particles by weight passing US no. 200 sieve, O,, less than 0.595 mm (AOS > no. 30 US standard sieve). Soil with more than 50% particles passing US no. 200 sieve, Og5 less than 0.296 mm (AOS > No 50 US standard sieve).
208
cumulative % passing 1 O0
80
60
40
20
O I 0-3 1 0 2 10-1 1 O0 101 10 2
particle size in mm - _ _ BlDlM _ _ _ _ _ _ 29/30 problem soil UK - - - PETEX _ _ _ _ _ coconut fibres MEPAS
-- fine PPfibres - - MELIMAT coarse PPfibres
cumulative @ % passing 100
80
60
40
20
O 10-3 10-2 10 1 O0 101 1 o2 - ~- T~~~~~ ~ 5 0 0 particle size in mm ------ i 29/30 problem soil UK Terram T700 _ _ _
peat fibres Terram TI000 polypropylene 100-200 Denier f ine ~ ~ Terram T1500 polypropylene 100-200 Denier, coarser ~ ~ - Terram T2000
Terram T3000
~ ~ _ _ _
o cumulative % passing
particle size in mm - heat bonded 140glm2 _ _ _ _ _ _ 30129 UK problemsoil _ _ , Hessian woven 380 alm2
~ _ _ _ _ Resin-bonded 250 g/m2 ~ woven terylene 1859/m2 ........... needle-punched 300 g/m2
Figure 62 Examples of pore size distributions for various types of geotextiles in relation to typical UK problem soil. A B
C
. . . ~ ~ ~ united carpet, Pakistan, needle-punched
Organic and synthetic filters tested by Kabina and Dierickx (1986). Geotextile and peat envelopes (Stuyt 1992) and IC1 Terram geotextiles (Koerner 1994). Geotextiles bonded by different methods (McGown 1976) and local Pakistan geo- textile.
209