orefinders resources inc. - orefinders – canadian based ... · 4.8.4 bond ball mill grindability...
TRANSCRIPT

Orefinders Resources Inc.
Mirado Phase 1 Project
Closure Plan
STORY ENVIRONMENTAL INC.

As a step towards helping to protect the environment SEI is now only using 100% post-consumer paper.
Orefinders Resources Inc.
Mirado Phase 1 Project
Closure Plan
Prepared for: Orefinders Resources Inc.
110-2300 Carrington Road West Kelowna, British Columbia
V4T 2N6
Prepared by:
STORY ENVIRONMENTAL INC. 332 Main St.
Haileybury, ON P0J 1K0
August 2014

Orefinders Resources Inc. Closure Plan
STORY ENVIRONMENTAL INC. Page i of viii
TABLE OF CONTENTS
ABBREVIATIONS VI
1 LETTER OF TRANSMITTAL 1
2 CERTIFICATION 2
2.1 TECHNICAL CERTIFICATIONS 3
3 PROJECT INFORMATION 5
3.1 PROPONENT INFORMATION 5
3.2 LAND TENURE INFORMATION 6
3.3 SITE PLAN 9
4 CURRENT PROJECT SITE CONDITIONS 10
4.1 LOCAL LAND USE 10
4.2 TOPOGRAPHY 10
4.3 SURFACE WATERS AND DRAINAGE AREAS 12
4.3.1 WATER QUANTITY 12
4.3.2 SURFACE WATER QUALITY 26
4.4 GROUNDWATER 28
4.4.1 GROUNDWATER AQUIFERS AND QUANTITY 28
4.4.2 GROUNDWATER QUALITY 33
4.5 TERRESTRIAL PLANT AND ANIMAL LIFE 34
4.5.1 TERRESTRIAL VEGETATION 35
4.5.2 WILDLIFE 35
4.5.3 OTHER CONSIDERATIONS 37
4.6 AQUATIC PLANT AND ANIMAL LIFE 37
4.6.1 AQUATIC VEGETATION AND FISHERIES 37
4.6.2 BENTHIC INVERTEBRATES 37
4.7 AMBIENT AIR QUALITY 40

Orefinders Resources Inc. Closure Plan
STORY ENVIRONMENTAL INC. Page ii of viii
4.7.1 AIR QUALITY MONITORING 40
4.7.2 STUDY PERIOD CLIMATE, 2013-2014 42
4.8 GEOCHEMICAL STUDIES 45
4.9 PREVIOUS SITE ACTIVITIES 54
4.9.1 SOILS AND SEDIMENT CONTAMINATION ASSESSMENT 59
4.9.2 SURFACE WATER CONTAMINATION ASSESSMENT 60
4.9.3 GROUNDWATER CONTAMINATION ASSESSMENT 60
5 PROJECT DESCRIPTION 61
5.1 PROJECT SUMMARY 61
5.2 MINERALOGY 62
5.2.1 REGIONAL GEOLOGY 62
5.2.2 LOCAL GEOLOGY 62
5.2.3 MINERALIZATION 64
5.2.4 METALLURGY 65
5.3 MINING ACTIVITIES 66
5.4 PROCESSING 66
5.5 BUILDINGS AND INFRASTRUCTURE 66
5.6 TAILINGS 66
5.7 MATERIALS HANDLING 67
5.8 WASTE MANAGEMENT AND TREATMENT 67
5.9 WATER MANAGEMENT AND TREATMENT 67
5.10 CHEMICAL AND FUEL STORAGE 68
5.11 PROJECT SCHEDULE 68
6 PROGRESSIVE REHABILITATION 69
7 REHABILITATION MEASURES – TEMPORARY SUSPENSION 70
8 REHABILITATION MEASURES – STATE OF INACTIVITY 71
9 REHABILITATION MEASURES – CLOSED OUT 72

Orefinders Resources Inc. Closure Plan
STORY ENVIRONMENTAL INC. Page iii of viii
9.1 SHAFTS, RAISES, AND OPEN STOPES 72
9.2 ADIT AND DECLINE PORTALS 72
9.3 OTHER MINE OPENINGS 72
9.4 STABILITY OF SURFACE AND SUBSURFACE MINE WORKINGS 72
9.5 BUILDINGS AND INFRASTRUCTURE 72
9.6 MACHINERY, EQUIPMENT, AND STORAGE TANKS 73
9.7 TRANSPORTATION CORRIDORS 73
9.8 CONCRETE STRUCTURES 73
9.9 PETROLEUM PRODUCTS, CHEMICALS, AND WASTE 73
9.10 POLYCHLORINATED BIPHENOLS (PCBS) 73
9.11 WASTE MANAGEMENT SITES 73
9.12 CONTAMINATED SOILS 73
9.13 TAILINGS AREAS 74
9.14 WASTE ROCK PILE AND OTHER STOCKPILES 74
9.15 WATERCOURSES AND DRAINAGE 74
9.16 REVEGETATION 75
9.17 SCHEDULE 75
10 MONITORING 76
10.1 PHYSICAL MONITORING PROGRAM 76
10.1.1 TEMPORARY SUSPENSION 76
10.1.2 STATE OF INACTIVITY 76
10.1.3 CLOSURE 76
10.2 SURFACE WATER AND GROUNDWATER MONITORING PROGRAMS 77
10.2.1 TEMPORARY SUSPENSION 77
10.2.2 STATE OF INACTIVITY 77
10.2.3 CLOSURE 77
10.3 BIOLOGICAL MONITORING PROGRAMS 79
10.3.1 TEMPORARY SUSPENSION 79
10.3.2 STATE OF INACTIVITY 79
10.3.3 CLOSURE 80
11 EXPECTED SITE CONDITIONS 81

Orefinders Resources Inc. Closure Plan
STORY ENVIRONMENTAL INC. Page iv of viii
11.1 LAND USE 81
11.2 TOPOGRAPHY 81
11.3 SURFACE WATERS 81
11.4 GROUNDWATERS 81
11.5 TERRESTRIAL PLANT AND ANIMAL LIFE 81
11.6 AQUATIC PLANT AND ANIMAL LIFE 82
12 COSTS 83
13 FINANCIAL ASSURANCE 84
14 REFERENCES 85
LIST OF FIGURES WITHIN THE BODY OF THE DOCUMENT Page
4.2.2 Characteristic Landscape of the Mirado Project Area 11 4.3.1.3 Modelled daily flows in the Misema River at the Mirado site 14 4.3.1.4 Rating curve for M2-OR site 17 4.3.1.5 Comparison of Specific Flows measured at M2-OR 19 4.3.1.6 Comparison of Specific Flows measured at M2-OR – only low flows 20 4.3.1.7 2011 Rating Curve and Modelled 2014 Rating curve for Misema River 23 4.7.2.1 Plots of Mirado Weather Station Data 41 4.8.1 Bond Ball Mill Work Index Database (SGS, 2014) 45 5.1.1 Mirado Phase 1 Project Timeline 57 LIST OF TABLES WITHIN THE BODY OF THE DOCUMENT Page
3.2.1 Mirado Phase 1 Project Claims 7 3.2.2 List of Patented Claims in the Mirado Project (SRK, 2013) 8 3.2.3 List of Staked Claims in the Mirado Project (SRK, 2013) 8 4.3.1.1 Summary of Regional Flow Gauging Stations 13 4.3.1.2 Summary of Flow Data from Mousseau Creek 25 4.7.1.1 Air Quality Study Locations, Parameters and Sampling Frequency 36 4.7.2.1 Summary of Monthly Air Temperature and Rainfall/Precipitation 39 4.8.1 Gold Assay by Pulp and Metallics from Stockpile Samples (SGS, 2014) 42 4.8.2 Head Analysis of Individual Samples from Stockpiles (SGS, 2014) 43 4.8.3 ICP Scan and Specific Gravity of Comp ABCD (SGS, 2014) 44 4.8.4 Bond Ball Mill Grindability Test Results from Stockpiles (SGS, 2014) 44 4.8.5 Cyanidation Test Results from Stockpiles (SGS, 2014) 45 4.8.6 Modified Acid Base Accounting Results from Stockpiles (SGS, 2014) 47 4.8.7 Shake Flask Extraction Test Results from Stockpiles (SGS, 2014) 48 4.9.1 Historic Drilling on the Mirado Property (SRK, 2013) 53 4.9.2 Existing Mine Features in the Mirado Phase 1 Project Property 54

Orefinders Resources Inc. Closure Plan
STORY ENVIRONMENTAL INC. Page v of viii
LIST OF PHOTOS WITHIN THE BODY OF THE DOCUMENT Page
4.3.1 Downstream View of M2-OR Site 18 4.3.2 Downstream View of MM3C Site 21 APPENDICES
APPENDIX A - Figures
3.3.1 Mirado Phase 1 Project Site Plan 3.3.2 Mirado Project Claim Boundary 3.3.3 Mirado Phase 1 Project Environmental Study Area 4.2.1 Mirado Phase 1 Project Site Topography 4.3.1.1 Mirado Phase 1 Project Stream Gauging Sites 4.3.1.2 Mirado Phase 1 Project Watershed Delineation 4.3.2.1 Mirado Phase 1 Project Surface Water Sampling Sites 4.4.1.3.1 Mirado Phase 1 Project Groundwater Sampling Sites 4.5.1.1 Community Mapping 4.6.2.1 Mirado Phase 1 Project Benthic Invertebrate and Sediment Sampling Sites 4.7.1.1 Mirado Phase 1 Project Air Monitoring Sites 4.8.2 NP vs AP 4.8.3 NAG vs NNP 4.9.1 Mirado Phase 1 Project Area Historic Underground Workings 4.9.1.2 Parameters of Concern in Sediment Sampling Sites 11.2.1 Mirado Phase 1 Project Post Closure Topography APPENDIX B - Tables
4.3.2.1 Surface Water and Groundwater Sampling Locations and Rationale 4.3.2.2 Surface Water Sampling Results 4.3.2.3 Surface Water Provincial Water Quality Objectives Exceedances 4.4.2.1 Groundwater Sampling Results 4.5.1.1 Vegetation Communities and Descriptions 4.6.2.1 Benthic Invertebrate Analysis 4.6.2.2 Benthic Invertebrate Analysis – Site Averages 4.7.1.2 Orefinders Air Monitoring – Mirado Site TSP and Metals Results 4.7.1.3 Orefinders Air Monitoring – Boston Creek Site TSP and Metals Results 4.7.1.4 Orefinders Air Monitoring – Dustfall Results 4.7.1.5 Orefinders Air Monitoring – PASS Results 4.8.8 Whole-Rock Major Elemental Analysis Results 4.8.9 and 4.8.10 ICP-OES/MS Strong Acid Digest Elemental Analyses Results 4.8.11 Percentage of Total Amount of Soluble Constituents 4.8.12 Distilled Water Extraction Results 4.8.13 Modified Acid-Base Accounting Results 4.8.14 Net Acid Generation Testing Results 12.1 Mirado Phase 1 Project Closure Costs APPENDIX C – Well Records

Orefinders Resources Inc. Closure Plan
STORY ENVIRONMENTAL INC. Page vi of viii
Abbreviations
“<” less than
“>” greater than
“%” percent
“oC” degrees Celsius
“µg/m3” micrograms per cubic metre
“µm” micrometre
“AAQC” Ontario’s Ambient Air Quality Criteria
“ABA” Acid Base Accounting
“Air T” Air Temperature
“Air RH” Relative Humidity
“AP” Acid Potential
“Ashley Gold” Ashley Gold Mines Ltd.
“Azimuth” Azimuth Environmental Consulting, Inc.
“Cathroy Larder” Cathroy Larder Mines Ltd.
“CO3 NP” carbonate neutralizing potential
“Code” Mine Rehabilitation Code of Ontario
“COSEWIC” Committee on the Status of Endangered Wildlife in
Canada
“COSSARO” Committee on the Status of Species at Risk in Ontario
“CXS” Canadian Exploration Services Ltd.
“DI” De-Ionized
“Dynatec” Dynatec Mining Ltd.
“ELC” Ontario Ecological Land Classifications
“EPT” Ephemeroptera, Plecoptera, and Trichoptera
“ESA” Environmental Study Area
“Golden Shield” Golden Shield Resources Ltd.
“g/m2/30d” grams per square metre in 30 days
“Hawk” Hawk Precious Metals Inc.
“ICP” Inductively Coupled Plasma
“ICP-OES/MS” inductively coupled plasma-optical emission
spectrometry/mass spectroscopy
“IP” induced polarization
“kg H2SO4 / t” kilograms of sulphuric acid per tonne
“kg/t” kilograms per tonne
“km” kilometre
“km2” square kilometre

Orefinders Resources Inc. Closure Plan
STORY ENVIRONMENTAL INC. Page vii of viii
“LEL” Lowest Effect Level
“LOI” Loss on Ignition
“m” metre
“m3/s” cubic metres per second
“Ma” million years
“Maxxam” Maxxam Analytics Inc.
“metres a.s.l.” metres above sea level
“mg/L” milligram per litre
“Micon” Micon Gold Inc.
“MMER” Metal Mining Effluent Regulations
“MNDM” Ontario Ministry of North Development and Mines
“MNR” Ministry of Natural Resources
“MOECC” Ministry of the Environment and Climate Change
“NA” not applicable or not analysed
“NaCN” sodium cyanide
“NAG” Net Acid Generation
“NaOH” sodium hydroxide
“ND” not detectable
“NNP” Net Neutralizing Potential
“NOx” nitrogen oxides
“NP” Neutralizing Potential
“NPR” Net Potential Ratio
“Operations Manual” Operations Manual for Air Quality Monitoring in Ontario
”O. Reg. 153/04” Ontario Regulation 153/04, Ontario Soil, Groundwater, and
Sediment Standards
“O. Reg. 240/00” Ontario Regulation 240/00, Mine Development and
Closure
“Orefinders” Orefinders Resources Inc.
“PASS” Maxxam’s Passive Air Sampling System
“ppb” parts per billion
“PWQO” Provincial Water Quality Objectives
“Sediment Guidelines” Guidelines for the Protection and Management of Aquatic
Sediment Quality in Ontario
“SEI” Story Environmental Inc. in Haileybury, Ontario
“SEL” Severe Effect Level
“SFE” shake flask extraction
“SGS” SGS Canada Inc.
“SO2” sulphur dioxide

Orefinders Resources Inc. Closure Plan
STORY ENVIRONMENTAL INC. Page viii of viii
“Solar Rad.” Solar Radiation
“SOP” Standard Operating Procedure
“SRK” SRK Consulting Inc.
“tpd” tonnes per day
“TSP” total suspended particulates
“UTM” Universal Transverse Mercator
“wt%” weight percent
“White Pine” White Pine Resources Inc.
“WSC” Water Survey of Canada
“Yama” Yama Gold Mines Ltd.

Orefinders Resources Inc. Closure Plan
STORY ENVIRONMENTAL INC. Page 1 of 86
1 Letter of Transmittal
__ ______ 2014
Mr. Robert Ferguson Acting Director of Mine Rehabilitation Ministry of Northern Development and Mines 933 Ramsey Lake Road, 6th Floor Sudbury, ON P3E 6B5
Dear Mr. Ferguson,
Re: Orefinders Resources Inc. – Mirado Phase 1 Project - Closure Plan
Orefinders Resources Ltd (“Orefinders”) is pleased to submit eight (8) copies of the following
Closure Plan to _______________. This submission is made in accordance with the
requirements prescribed under Part VII of the Ontario Mining Act and has been formatted as per
Ontario Regulation 240/00 made under the Act.
This Closure Plan and its associated appendices are being submitted to the Director for filing,
pursuant to Part VII of the Mining Act. It is understood that Orefinders is solely responsible for
ensuring that the rehabilitation measures proposed in this Closure Plan are carried out in
accordance with the Closure Plan, including any future changes or amendments filed with the
Director.
The undersigned is authorized, as an employee of the company, to act on behalf of Orefinders.
Yours truly,
Orefinders Resources Inc.
Name
Position

Orefinders Resources Inc. Closure Plan
STORY ENVIRONMENTAL INC. Page 2 of 86
2 Certification
I hereby certify that,
a) the attached Closure Plan complies in all respects with the Mining Act and
Ontario Regulation 240/00, Mine Development and Closure Under Part VII of the
Act (“O. Reg. 240/00”), including the Mine Rehabilitation Code of Ontario
(“Code”);
b) the proponent relied upon qualified professionals in the preparation of the
Closure Plan (amendment), where required, under the Mining Act and O. Reg.
240/00, including the Code;
c) the cost estimates of the rehabilitation work described in the attached Closure
Plan (amendment) are based on the market value cost of the goods and services
required by the work;
d) the amount of financial assurance provided for in the attached Closure Plan
(amendment) is adequate and sufficient to cover the cost of the rehabilitation
work required in order to comply with the Mining Act and O. Reg. 240/00,
including the Code;
e) the proponent has carried out reasonable and good faith consultations with
appropriate representatives of all aboriginal peoples affected by the project (not
applicable); and
f) the attached Closure Plan constitutes full, true and plain disclosure of the
rehabilitation work currently required to restore the site to its former use or
condition or to make the site suitable for a use the Director sees fit in accordance
with the Mining Act and O. Reg. 240/00, including the Code.
The undersigned are authorized, as employees of the company, to act on behalf of Orefinders
Resources Inc.
______________________________ ____________________________
Name Name
Chief Financial Officer (?) Other Senior Office (Title?)
Orefinders Resources Inc. Orefinders Resources Inc.

Orefinders Resources Inc. Closure Plan
STORY ENVIRONMENTAL INC. Page 3 of 86
2.1 Technical Certifications
This Closure Plan was prepared by professionals at Story Environmental Inc. (“SEI”), 332 Main
St., Haileybury, Ontario, P0J 1K0, telephone (705) 672 - 3324, facsimile (705) 672 - 3325.
Certification of Maria Story, P. Eng.
On behalf of Orefinders Resources Inc., I prepared the Orefinders Resources Inc. Closure Plan
for the Mirado Phase 1 Project, with input from Orefinders Resources Inc. and other qualified
professionals. I certify that the proposed closure measures, requiring certification according to
Section 12(3) of Ontario Regulation 240/00, Mine Development and Closure under Part VII of
the Act, are in accordance with the Mining Act and the associated Mine Rehabilitation Code of
Ontario.
I, Maria Story, P. Eng., am a Chemical Engineer, and President and owner of Story
Environmental Inc. I have 22 years of professional engineering experience related to the
establishment of monitoring programs, interpretation and reporting of chemical and geochemical
data, engineering design of environmental management systems and water treatment systems,
and project management for mining, industry, and municipal clients.
I, Maria Story, P. Eng., provide certification for the following:
1. the applicability of the surface water quality tests and frequency of the surface water
monitoring program during Closure; and
2. the applicability of the groundwater quality tests and the frequency of the groundwater
monitoring program during Closure.
I personally examined the site and related data, on several occasions between October 2013
and July 2014. The Closure Plan is based on these personal examinations as well as the
following information obtained from Orefinders Resources Inc.:
a) the associated Project Definition prepared by Story Environmental Inc., entitled
Orefinders Resources Inc. Project Definition for Mirado Phase 1 Project Catharine
Township, Ontario, July 2014 (SEI, 2014);
b) Azimuth Environmental Consulting Inc. regarding baseline biological and ecological
conditions at the site of the proposed Project; and

Orefinders Resources Inc. Closure Plan
STORY ENVIRONMENTAL INC. Page 4 of 86
c) project scheduling and geological details as provided by Orefinders Resources Inc.
I do not have any direct or indirect interest, current or expected, in Orefinders Resources Inc.,
Orefinders Resources Inc. affiliates, including any direct or indirect beneficial ownership in the
securities of Orefinders Resources Inc. or any of its affiliates nor do I have any knowledge of
anyone who has provided information to me for inclusion in this Closure Plan as having any
direct or indirect interest in this project, Orefinders Resources Inc. affiliates, including any direct
or indirect beneficial ownership in the securities of Orefinders Resources Inc. or any of its
affiliates.
_________________________________ _____________________________
Maria Story, P. Eng. Date
332 Main St.
Haileybury, Ontario
P0J 1K0
Telephone: (705) 672- 3324
Facsimile: (705) 672 - 3325

Orefinders Resources Inc. Closure Plan
STORY ENVIRONMENTAL INC. Page 5 of 86
3 Project Information
3.1 Proponent Information
Orefinders Reources Inc.
West Kelowna Office Site Office
110-2300 Carrington Road 58 Prospect Ave
West Kelowna, British Columbia Kirkland Lake, Ontario
V4T 2N6 P2N 2V9
T 250 707 0911 T 705 567 2287
F 250 768 0849
Contacts:
Bill Yeomans P.Geo. [email protected] T 250-707-0911
President, CEO and Director F 250 768 0849
C 250 864 0948
Kevin Piepgrass P.Geo. [email protected] T 250-707-0911
Vice President Exploration F 250-768-0849
C 250-707-0911

Orefinders Resources Inc. Closure Plan
STORY ENVIRONMENTAL INC. Page 6 of 86
3.2 Land Tenure Information
Mirado Project
The Mirado Project comprises 12 contiguous patented mining claims with an aggregated area of
1.77 square kilometres (“km2”) (432.52 acres), formerly known as the Mirado property
(Table 3.2.1), and 23 contiguous staked mining claims with an area of approximately 12.17 km2
(3,007 acres). Ten of these claims constitute an area formerly known as the MZ property. The
remaining thirteen claims have been staked directly by Orefinders or have been purchased by
Orefinders in recent transactions. With Orefinders’ acquisition of claim tenement packages, the
entire area is considered the Mirado Project. The patented mining claims are in good standing
and are wholly owned by Orefinders. The claims are patented with Fee Simple Absolute title to
mining and surface rights with minor surface right reservations, mostly for road allowances and
power line easements. Timber rights are reserved for the Crown. The staked mining claims held
by Orefinders, Ashley Gold Mines Limited (“Ashley Gold”), Mr. W. Metherall and
Mr. D. B. Zabudsky are in good standing. The claims were staked for mining rights only and
have no surface rights. Timber rights are held by the Crown. The Mirado Phase 1 Project which
is the subject of this Project Definition and subsequent Closure Plan submission is the two
claims L24691 and L34751, see Table 3.2.1. The mineral resources of the Mirado Project
including those of Phase 1 discussed in this report are located within tenements identified in
Table 3.2.2 and Table 3.2.3.

Orefinders Resources Inc. Closure Plan
STORY ENVIRONMENTAL INC. Page 7 of 86
Table 3.2.1 Mirado Phase 1 Project Claims
Claim number
Concession Name Ownership Township Parcel
Area (km2)
Contains Resource? date staked
Expiry/due date Status
L24691 Mirado Orefinders Catharine 12447 SEC SST 0.19 yes L34751 Mirado Orefinders Catharine 12466 SEC SST 0.18 yes Total: 0.37
Adjacent Properties
Concession Name Ownership Township Parcel
Area (km2)
Contains Resource? date staked
Expiry/due date Status
East: L24690 Mirado Orefinders Catharine 12446 SEC SST 0.16 yes
L34750 Mirado Orefinders Catharine 12465 SEC SST 0.15 yes South:
L1199884 MZ Zabudsky McElroy
0.16
07/26/2002 07/27/2017 Active L1196951 MZ Zabudsky Catharine
0.5
08/03/2000 08/04/2017 Active
West: L1146327 MZ Metherall Catharine
0.69 yes 04/09/2000 04/10/2017 Active
North: L31378 Mirado Orefinders McElroy 6417 SEC SST 0.13 yes
L31749 Mirado Orefinders McElroy 12445 SEC SST 0.11 yes Total: 1.9

Orefinders Resources Inc. Closure Plan
STORY ENVIRONMENTAL INC. Page 8 of 86
Table 3.2.2 List of Patented Claims in the Mirado Project (SRK, 2014)
Table 3.2.3 List of Staked Claims in the Mirado Project (SRK, 2014)

Orefinders Resources Inc. Closure Plan
STORY ENVIRONMENTAL INC. Page 9 of 86
3.3 Site Plan
The site plan of the Mirado Phase 1 Project is shown in Figure 3.3.1, Appendix A. The larger
Mirado Project area claims are displayed in Figure 3.3.2, Appendix A. The Environmental Study
Area which delineates approximately the extent of the environmental monitoring (does not
include background Misema River monitoring site MM0 or Boston Creek air monitoring site) is
shown in Figure 3.3.3, Appendix A.

Orefinders Resources Inc. Closure Plan
STORY ENVIRONMENTAL INC. Page 10 of 86
4 Current Project Site Conditions
4.1 Local Land Use
The Mirado Phase 1 Project site is a previously disturbed area, which includes forested
sections, ore stockpiles and one overburden pit that is filled with water (described subsequently
as South Pit). There is a legacy of mining activity in the area which has recently included
exploration drilling activities. Logging has also occurred in the area and Georgia Pacific is
scheduled to begin harvesting trees in the Mirado Project patented claims in Q3 of 2014.
The land adjacent to the Mirado Project is used for multiple purposes from natural resource to
recreational. Natural resource activities include forestry and mining. Forest harvesting has
occurred several times in the vicinity of the Mirado Project. This year, Georgia Pacific will be
harvesting trees within the Mirado Project site. The historical Adam’s Mine is located about
7 kilometres (“km”) northwest of the Project site. However no current mining activities are
occurring on this property. There are many active mining claims in the surrounding area of the
Mirado Project site with some historic mine features present on surrounding claims.
There are a number of areas around the Mirado Phase 1 Project site which are used for
recreational purposes, such as hunting and fishing. There is also a snowmobile trail near the
site, used for snowmobiling during the winter and four wheeling during the summer. The closest
residential area, the village of Boston Creek, is located approximately 8 km west of the site.
4.2 Topography
The topography in the Mirado Phase 1 Project area is flat to mildly rugged with a maximum
relief of approximately 50 metres (“m”). The average elevation is approximately 290 metres
above sea level (“metres a.s.l.”) but ranges from about 260 to 310 metres a.s.l. The vegetation
ranges from mature spruce, pine, birch, and poplar to scattered, locally thick underbrush.
Vegetation in the resource area has mostly been cleared. The topography is shown in Figure
4.2.1, Appendix A.
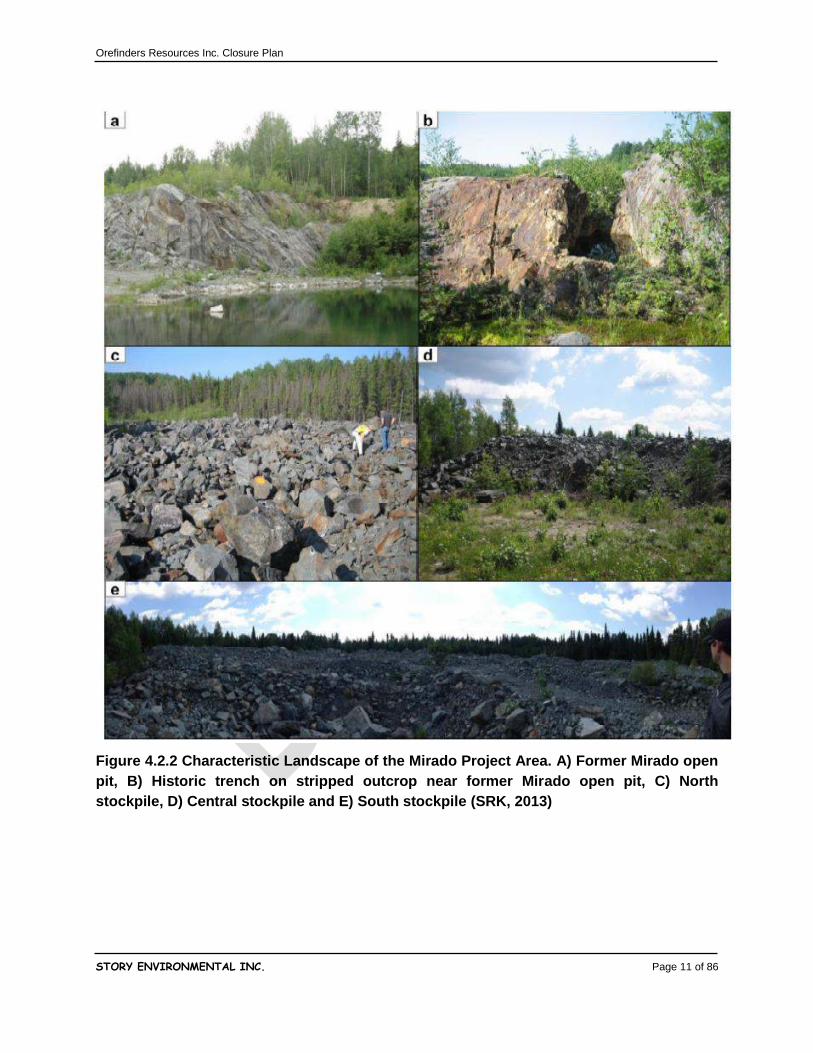
The historical South Pit and three areas hosting the stockpiled ore dominate the Project area,
Figure 4.2.2, Frames C), D) and E).
Orefinders Resources Inc. Closure Plan
STORY ENVIRONMENTAL INC. Page 11 of 86
Figure 4.2.2 Characteristic Landscape of the Mirado Project Area. A) Former Mirado open
pit, B) Historic trench on stripped outcrop near former Mirado open pit, C) North
stockpile, D) Central stockpile and E) South stockpile (SRK, 2013)

Orefinders Resources Inc. Closure Plan
STORY ENVIRONMENTAL INC. Page 12 of 86
4.3 Surface Waters and Drainage Areas
4.3.1 Water Quantity
The Mirado Project Site is located within a region dominated by numerous lakes, rivers, and
creeks. The major surface water body adjacent to the Mirado Project site is the Misema River
(Figure 4.3.1.1, Appendix A). The Misema River forms the eastern border of two of the Mirado
claims. It flows to the south and is confluent with the Blanche River north of Englehart, Ontario,
before eventually discharging into Lake Timiskaming. Misema River. The physiography/surficial
geology of Misema watershed is more influenced by clay near the Mirado site as opposed to its
headwaters which are dominated by bedrock/shield terrain. This can be seen in the colour
difference comparing the Misema River nearby the Mirado Project site compared with the
headwaters in the Misema River photographs shown below.
Smaller surface water bodies near the Mirado Project site include Mousseau Creek, to the west
of the Mirado Claims, Little Long Lake to the northwest of the claims, and a chain of small
unnamed lakes that flows to the north away from the site. This chain of lakes is known in this
report as the “Two Lakes Tributary” (shortened to “TLT”). All of these surface waters ultimately
drain to the Misema River.
The Mirado Project claims themselves include relatively few surface water features. There are
two human-made pits, which are known herein as the South Pit (water sampling point “Pit 1”)
and the Mirado Pit (water sampling point “Pit 2”). The South Pit is a relatively shallow
excavation that was formed by scraping away overburden to expose the bedrock surface. This
is the same area described in section 4.9 of this report, as being stripped of overburden in early
1987. The Mirado Pit is deeper (see Figure 4.2.2 A)), having formed as a result of excavating
bedrock for a proposed open pit mine in 1987.
Water Quantity utilizing Existing Data
The drainage area of the Misema River at site MM3C (its confluence with Mousseau Creek) is
659 km2 (Figure 4.3.1.2, Appendix A). Only a single measurement of flow is so far available
from the Misema River at site MM3C. For the purposes of this Closure Plan, historical and
modern datasets from nearby sites on the Misema River have been used to supplement this

Orefinders Resources Inc. Closure Plan
STORY ENVIRONMENTAL INC. Page 13 of 86
single site-specific measurement. Collection of site-specific data is ongoing, as described below
in the sub-section titled “Water Quantity – Site-Specific Measurements of Water Quantity”.
Historical data are available from two regional Water Survey of Canada (“WSC”) gauging
stations, while recent data are available from a third WSC station. All three stations are listed in
Table 4.3.1.1 below.
Table 4.3.1.1: Summary of Regional Flow Gauging Stations Maintained by Water Survey of Canada WSC Station No. Site Location Drainage Area
(km2)
Proximity to
Mirado
Years of
Record
02JC008 Blanche River
above Englehart 1782 15 km south 1968-2014
02JC009 Blanche River at
Swastika 251 20 km northwest 1968-1978
02JC010 Larder River above
Raven Lake 256 25 km northeast 1981-1991
Of these three, station 02JC008 on the Blanche River is particularly useful for this project
because it continues to provide flow data and these (provisional) data are made available in
near real-time on the internet at Environment Canada’s Water Office site
(http://www.wateroffice.ec.gc.ca/graph/graph_e.html?stn=02JC008). In addition, the Misema
River is a major tributary to the Blanche. At the Mirado site, the Misema River makes up over
one-third of the total drainage area of the Blanche River above Englehart (i.e.,
659 km2/1782 km2 = 37%). Therefore, annual average daily flows in the Misema River at the
Mirado site have been modelled here by multiplying the average daily flows at 02JC008 by 0.37
(37%). The resulting annual hydrograph is shown below in Figure 4.3.1.3.
Figure 4.3.1.3 suggests average peak flows associated with the spring melt of approximately 40
cubic metres per second (“m3/s”) in late April. There are two low flow periods: one in late winter
(early March) and a second in late summer (early September). Modelled average low flows
during these two periods are 2.3 to 2.5 m3/s.

Orefinders Resources Inc. Closure Plan
STORY ENVIRONMENTAL INC. Page 14 of 86
Figure 4.3.1.3 Modelled daily flows in the Misema River at the Mirado site, based on average flows at WSC station 02JC008 for the 1974 to 2010 period Source: “7Q Analysis for 02JC008.xls”, Mean Hydrograph
Compared to the Misema River, Mousseau Creek has a smaller watershed with a drainage area
of approximately 18 km2, see Figure 4.3.1.2. Using the same modelling approach based on
02JC008 average flows, peak spring flows of approximately 1.1 m3/s and low flows of
<0.10 m3/s are anticipated in Mousseau Creek. It is noted that this pro-rating of flows from the
much larger Blanche River down to the scale of the Mousseau Creek is associated with
considerable uncertainty. The hydrology of smaller systems such as the Mousseau is more
difficult to predict due to site-specific factors such as beaver activity (particularly for low flows).
Water Quantity – Site-Specific Measurements of Water Quantity
For this project, collecting information related to seasonal low flows has been the focus. Low
flows are usually a bigger concern for mining activity due to potential effects of water takings
and/or waste water discharges (not currently anticipated as part of the work outlined in this
Closure Plan). Existing datasets will be adequate for predicting high flows adjacent to the
Mirado Project site.
0
5
10
15
20
25
30
35
40
45
1-J
an
31
-Jan
3-M
ar
2-A
pr
3-M
ay
2-J
un
3-J
ul
2-A
ug
2-S
ep
2-O
ct
2-N
ov
2-D
ecMo
de
lled
Flo
w in
Mis
em
a R
ive
r at
M
irad
o S
ite
(m
3 /s)

Orefinders Resources Inc. Closure Plan
STORY ENVIRONMENTAL INC. Page 15 of 86
Two types of measurements have been used to collect water quantity data at the Mirado Project
site: instantaneous measurements of flow at three sites, as well as continuous monitoring of
water levels at two sites. Instantaneous measurements of flow have taken place at three sites:
1. MM3C on the Misema River immediately downstream of its confluence with the
Mousseau Creek;
2. M2-OR on the Misema River approximately 15 km upstream of the Mirado Project site;
3. MOU1 on Mousseau Creek downstream of the access road crossing;
Continuous monitoring of water levels has taken place at MM3C and M2-OR. These sites are
instrumented with level-recording data-loggers, housed in protective ABS piping and securely
anchored within the channel using rebar posts driven into the river bed. Care has been taken to
ensure historical continuity of the gauge datum at each site, by establishing multiple elevation
benchmarks near the cross-section at the time of instrument installation. A separate level
logger (i.e., a “baro logger”) has been placed in the atmosphere near the weather station for
purposes of correcting for the effects of variations in barometric pressure on the water level
data. These sites are shown in Figure 4.3.1.1 and 4.3.1.2, Appendix A.
Streamflow measurements at each of the three sites have taken place on a total of one to four
dates from 15 October 2013 to 31 July 2014. This existing dataset will be supplemented with
additional measurements through the 2014 low flow season, depending on flow conditions.
As described below, SEI has used a pre-existing rating curve for the M2-OR site to develop a
good understanding of flows in the Misema River upstream of the Mirado Project site. Together
with existing data from the WSC station 02JC008 downstream of the site on the Blanche River,
these two datasets provide a clear indication of flows in the Misema adjacent to the Mirado
Project site.
Selection of Seasonally-Continuous Monitored Sites for Measuring Levels and Flows
The Mousseau Creek site was not instrumented for continuous collection of level data because
of the following reasons:
1) A lack of good sites for level logger installation near the MOU1 site. Beaver dams both
upstream and downstream of this site mean that variations in levels during low flow

Orefinders Resources Inc. Closure Plan
STORY ENVIRONMENTAL INC. Page 16 of 86
conditions would reflect beaver activity more so than variations in flows. In other words,
the natural control that determines levels is not stable.
2) The small-scale nature of proposed mining activity and no apparent need for water
takings from, or discharges to, the Mousseau Creek.
3) The nearby presence of a higher flow system for potential longer-term purposes of water
takings or discharges (the Misema River).
To date, SEI has conducted four spot measurements of streamflow on Mousseau Creek at low-
to-moderate flow conditions in October 2013, April 2014, June 2014 and July 2014.
During the first phases of data collection for this project in October 2013, SEI selected two sites
on the Misema River near the Mirado Project for collection of level data: MM2 DS and MM3C
(see Figure 4.3.1.1, Appendix A). Due to the timing of these installations, after the end of the
summer low flow period, an emphasis was placed on choosing sites where winter ice cover
would be minimal or non-existent. These conditions are required to ensure reliable collection of
level data during winter low flow conditions using non-vented loggers (Onset HOBO loggers).
Therefore, the MM2 DS and MM3C sites were selected at sites of narrower channels and
immediately upstream of rapids, where higher flow velocities and limited ice cover was
anticipated. These types of sites also typically provide stable hydraulic controls for long-term
gauging.
However, a return visit to the MM2 DS site in December 2013 revealed heavy ice cover at this
site, perhaps due to the unusually cold early winter air temperatures. Therefore, the MM2 DS
level logger was transferred to the upstream M2-OR site on 20 December 2013. Similar
problems with heavy ice cover were encountered at the MM3C site. At MM3C, the level logger
was re-launched at the same site on 18 April 2014, after break-up occurred.
The M2-OR site is located on the Misema River approximately 15 km upstream of the Mirado
Project Site. At this point on the Misema River, the watershed area is 404 km2, or
approximately 61% of the 659 km2 area of the Misema River at the MM3C site. Conversely, the
MM3C watershed is 1.63 times larger than the M2-OR watershed.
Previously, SEI (2012) developed a rating curve that relates measured flows to levels at the
M2-OR site on the Misema River, based on six data points collected in 2011. Since 2011, this

Orefinders Resources Inc. Closure Plan
STORY ENVIRONMENTAL INC. Page 17 of 86
rating curve has been maintained with annual checks of both flows and surveying of the staff
gauge datum. On 24 March 2014, SEI measured a flow of 1.41 m3/s at the M2-OR site at a
water level of 280.76 metres a.s.l., which is fully consistent with the 2011 rating curve
(Figure 4.3.1.4 below).
Figure 4.3.1.4 Rating curve for M2-OR site, relating measured flows to measured water levels (“Stage”). Units on the horizontal axis are metres a.s.l minus 280 Source: “M2 Rating Curve for Orefinders.grf”
Aside from the existence of a robust rating curve for low flows, the M2-OR site has the added
advantage of maintaining minimal ice cover during winter low flow conditions. Channel control
is provided by a combination of human-made control associated with bridge infrastructure for a
snowmobile trail crossing, as well as natural control associated with bedrock and large boulders
at the rapids immediately downstream of the bridge (Photo 4.3.1).

Orefinders Resources Inc. Closure Plan
STORY ENVIRONMENTAL INC. Page 18 of 86
Photo 4.3.1: Downstream view of M2-OR site, showing snowmobile bridge. Rapids are visible downstream of the bridge. Photo taken 25 July 2014. Note clarity/colour of water
Water Quantity: Results of 2013-2014 Flow Monitoring
An alternative way to present streamflow data is to divide the measured flow value by drainage
area, to obtain “specific flow” with units of (m3/s)/km2. This allows direct comparison of flows
measured at sites draining different-sized watersheds. For example, flows at the 404 km2
M2-OR watershed can be compared to those measured at the larger 02JC008 station
(1782 km2). Figure 4.3.1.5 shows that specific flows from the M2-OR site agree well with those
measured by Environment Canada for the period from 20 December 2013 to 10 June 2014.
This agreement is particularly good for low and moderate flows. Poorer agreement is observed
for the higher flows observed during the spring melt of early May 2014. This is due to a lack of
high flow data in the rating curve from the M2-OR site (Figure 4.3.1.4). M2-OR flow data are not
reliable at specific flows above 0.04 (m3/s)/km2 because this value represents twice the highest
measured flow included in the M2-OR rating curve. Extrapolation outside this range is not valid.

Orefinders Resources Inc. Closure Plan
STORY ENVIRONMENTAL INC. Page 19 of 86
Figure 4.3.1.5 Comparison of Specific Flows measured at M2-OR to those from Environment Canada Station 02JC008 (Provisional Data), December 2013 to July 2014 Source: “M2-OR_Workbook_29_July_2014_ACS.xls”, Comparison of M2 & 02JC008.
Within the range of flows for which the M2-OR rating curve is valid, specific flows on the Misema
River upstream of the Mirado Project site and on the Blanche River downstream of the site
appear to be closely related. This is expected given the large sizes of their watersheds and
relatively close proximities of the two regional stations.
Figure 4.3.1.6 therefore focuses on specific flows below 0.04 (m3/s)/km2 for the Misema and
Blanche River systems. It also extends Figure 4.3.1.5 to include measured and modelled flow
data from MM3C. The procedure for modelling flow at MM3C is described further below.
0.00
0.02
0.04
0.06
0.08
0.10
0.12
0.14
16
-De
c-1
3
30
-Dec-1
3
13
-Ja
n-1
4
27
-Ja
n-1
4
10
-Fe
b-1
4
24
-Fe
b-1
4
10
-Ma
r-1
4
24
-Mar-
14
07
-Ap
r-1
4
21
-Ap
r-1
4
05
-May-1
4
19
-Ma
y-1
4
02
-Ju
n-1
4
16
-Ju
n-1
4
30
-Ju
n-1
4
14
-Ju
l-1
4
28
-Jul-
14
Spe
cifi
c Fl
ow
((m
3 /s)
/km
2 )
M2-OR
02JC008
M2-OR specific flow is overestimated at flows above 0.04 (m3/s)/km2 due to a lack of rating curve data at values greater than 0.02 (m3/s)/km2 (~7 m3/s at M2-OR)

Orefinders Resources Inc. Closure Plan
STORY ENVIRONMENTAL INC. Page 20 of 86
Figure 4.3.1.6 Comparison of Specific Flows measured at M2-OR, Environment Canada Station 02JC008 (Provisional Data), MM3C (measured), and MM3C (modelled), December 2013 to July 2014. Only low flows are shown (specific flows <0.04 (m3/s)/km2) Source: “M2-OR_Workbook_29_July_2014_ACS.xls”, Comparison of M2 & 02JC008.
A single measurement of flow at the MM3C site was conducted on 25 July 2014. The gauging
cross-section used is shown in Photo 4.3.2. The flow was measured at 3.97 m3/s, at a local
stage elevation of -0.641 m (as measured down from the top of the rebar staff gauge)1. This
flow of approximately 4 m3/s is consistent with anticipated average flows in late July at MM3C
based on modelling results shown in Figure 4.3.1.3. On a specific flow basis, the measured
flow of 3.97 m3/s at MM3C on 25 July 2014 equates to 0.0060 (m3/s)/km2. This specific flow
compares reasonably well to flows reported for the same day from the M2-OR gauging station
(0.0052 (m3/s)/km2)2, as well as provisional flow data from Environment Canada’s 02JC008
gauging station (0.0047 (m3/s)/km2). This single flow data point from 25 July 2014 is plotted as
“MM3C Measure” in Figure 4.3.1.6.
1 Local benchmarks at MM3C have not yet been surveyed for geodetic elevations. This survey work will
be completed in fall 2014. 2 Note that this flow from M2-OR for 25 July 2014 is based on level data collected from midnight through
to 1:15 PM local time, when the level logger was down-loaded by SEI.
0.00
0.02
0.04
16
-Dec-1
3
30
-De
c-1
3
13
-Jan
-14
27
-Ja
n-1
4
10
-Fe
b-1
4
24
-Fe
b-1
4
10
-Ma
r-1
4
24
-Ma
r-1
4
07
-Ap
r-1
4
21
-Ap
r-1
4
05
-Ma
y-1
4
19
-Ma
y-1
4
02
-Ju
n-1
4
16
-Ju
n-1
4
30
-Ju
n-1
4
14
-Jul-
14
28
-Ju
l-1
4
Spe
cifi
c Fl
ow
((m
3 /s)
/km
2 )
M2-OR
02JC008
MM3C Measure
MM3C Model

Orefinders Resources Inc. Closure Plan
STORY ENVIRONMENTAL INC. Page 21 of 86
Photo 4.3.2: Downstream view of MM3C gauging cross-section on Misema River. Photo taken 25 July 2014. Note browner colour of water compared to Misema River upstream at M2-OR (see Photo 4.3.1)
Site-specific level data collected at MM3C by SEI in recent ice-free months indicate that levels
at MM3C fluctuate nearly synchronously with those at upstream site M2-OR, especially during
periods of receding flow. For instance, flows and levels dropped steadily at the end of the
spring freshet, from 19 May to 1 June 2014, before an increase in flows on 3 June
(Figures 4.3.1.5 and 4.3.1.6). During this period of declining flows from 19 May to 1 June, the
average daily water level at M2-OR dropped by 70.5 centimetres, whereas the level at MM3C
dropped by 69.8 centimetres (data not shown). This suggests that the hydraulics of the M2-OR
and MM3C sites are fundamentally similar, despite being separated by approximately 15 km.
On the basis of this apparent hydraulic similarity of the two sites, SEI has transferred the
low-flow rating curve from the M2-OR site to the MM3C site. The purpose of this exercise was
not to produce a precise rating curve for the MM3C site, but instead to establish the degree to
which existing rating curve data from M2-OR could be applied at the MM3C site. This rating
curve transfer was conducted as a two-step process:
1) Flow values in the rating curve from M2-OR were increased by a factor of 1.63x to
account for the increased watershed area at MM3C (i.e., 1.63 = (659/404)km2);
2) Local elevation3 values in the rating curve from M2-OR were adjusted iteratively until
the single flow measurement from MM3C on 25 July 2014 plotted close to the
modelled rating curve. The MM2-OR elevation data were adjusted by adding 0.14 m
to derive an “equivalent” MM3C local elevation.
3 Because elevation data from MM3C have not yet been surveyed to geodetic (metres a.s.l.), local
elevations from the two sites were used.

Orefinders Resources Inc. Closure Plan
STORY ENVIRONMENTAL INC. Page 22 of 86
Data underlying this procedure are shown in Figure 4.3.1.7 and the resulting modelled
polynomial rating curve for site MM3C is shown in Figure 4.3.1.7B. This modelled rating curve
has been used to generate flow data based on level data collected from MM3C during the
ice-free period from 18 April to 25 July 2014, as shown by the “MM3C Model” data in
Figure 4.3.1.6.
In general, modelled specific flow data for MM3C correspond well to both the data from
upstream site M2-OR and downstream site 02JC008 (Figure 4.3.1.6).
This modelling exercise demonstrates that the rating curve for the M2-OR site (Figure 4.3.1.7A)
can likely be transferred to the MM3C site with modification to account for the increased size of
the MM3C watershed. SEI plans to conduct one or two measurements of flow at MM3C during
summer low flow conditions in August-September 2014 to test the validity of the modelled rating
curve shown in Figure 4.3.1.7B.
Insufficient site-specific data (either logged water levels or direct flow measurements) are
currently available to fully characterize summer low flow conditions at MM3C, since a complete
summer season of site-specific data is not yet available. However, the historical dataset
available from Environment Canada’s 02JC008 gauging station contains a complete record from
1974 to 2012. Together with contemporary (provisional) flow data from 02JC008 and ongoing
monitoring through summer and early fall 2014, reliable estimates can be produced of low flow
indices such as the 7Q20 (the daily low flow averaged over a seven-day period, which is
expected to occur, on average, once every two years (i.e., with a 20-year return period)). SEI
notes that Orefinders is not currently planning any water takings or discharges for the first phase
of the project and therefore estimates of low flows are not an urgent requirement.

Orefinders Resources Inc. Closure Plan
STORY ENVIRONMENTAL INC. Page 23 of 86

Orefinders Resources Inc. Closure Plan
STORY ENVIRONMENTAL INC. Page 24 of 86
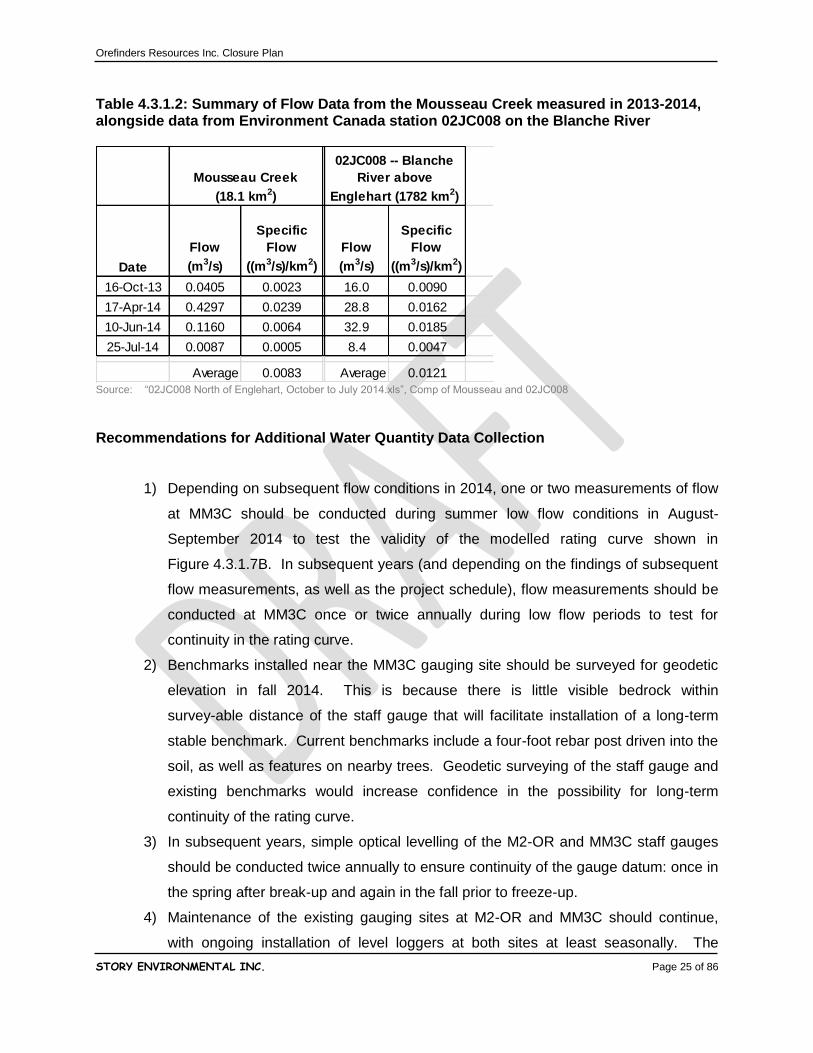
Table 4.3.1.2 below summarizes flow data measured at the Mousseau Creek MOU1 site on four
dates in 2013-2014, alongside synchronous data from the much larger Blanche River
watershed. The following interpretation of these data can be provided:
1) The average specific flow for the Mousseau Creek (0.0083 (m3/s)/km2) is similar to
the average specific flow from the Blanche River on the same four dates
(0.0121 (m3/s)/km2). This suggests that SEI’s watershed delineation for Mousseau
Creek is reasonably accurate and that the hydrologic behaviour of the creek is
somewhat predictable on this basis.
2) Specific flows measured in the Mousseau Creek were substantially lower than at the
Blanche River on three of the four dates (October, June and July). This indicates
that low flows, on a unit-area basis, from the Mousseau Creek are lower than in the
Blanche. This could be due either to relatively minor water storage in the Mousseau
watershed (i.e., the watershed is relatively “flashy” due to its small size), or to beaver
activity during low flow periods which can results in depressed downstream flows
due to storage of water behind dams.
3) Specific flow measured in the Mousseau Creek (0.0239 (m3/s)/km2) in April 2014 was
higher than in the Blanche (0.0162 (m3/s)/km2) on the same day. This suggests a
faster response to the onset of snowmelt in Mousseau Creek, consistent with its
much smaller size than the Blanche. Although data are not available from the peak
flow period later in the April freshet, it is likely that peak specific flows from the
Mousseau Creek exceeded those in the Blanche due to this size effect.
If Orefinders eventually requires a nearby water body for significant water takings or discharges,
they will likely not choose Mousseau Creek, especially given the presence of the much larger
Misema River. Mousseau Creek is a poor choice due to several factors including the observed
low specific flows in Mousseau Creek, as well as the lack of predictability in these flows due to
extensive beaver activity on this small channel. As well, much better historical flow data is
available from local watersheds which are similar in size to the Misema River, enabling a good
understanding of the Misema River hydrology.
Orefinders Resources Inc. Closure Plan
STORY ENVIRONMENTAL INC. Page 25 of 86
Table 4.3.1.2: Summary of Flow Data from the Mousseau Creek measured in 2013-2014, alongside data from Environment Canada station 02JC008 on the Blanche River
Source: “02JC008 North of Englehart, October to July 2014.xls”, Comp of Mousseau and 02JC008 Recommendations for Additional Water Quantity Data Collection
1) Depending on subsequent flow conditions in 2014, one or two measurements of flow
at MM3C should be conducted during summer low flow conditions in August-
September 2014 to test the validity of the modelled rating curve shown in
Figure 4.3.1.7B. In subsequent years (and depending on the findings of subsequent
flow measurements, as well as the project schedule), flow measurements should be
conducted at MM3C once or twice annually during low flow periods to test for
continuity in the rating curve.
2) Benchmarks installed near the MM3C gauging site should be surveyed for geodetic
elevation in fall 2014. This is because there is little visible bedrock within
survey-able distance of the staff gauge that will facilitate installation of a long-term
stable benchmark. Current benchmarks include a four-foot rebar post driven into the
soil, as well as features on nearby trees. Geodetic surveying of the staff gauge and
existing benchmarks would increase confidence in the possibility for long-term
continuity of the rating curve.
3) In subsequent years, simple optical levelling of the M2-OR and MM3C staff gauges
should be conducted twice annually to ensure continuity of the gauge datum: once in
the spring after break-up and again in the fall prior to freeze-up.
4) Maintenance of the existing gauging sites at M2-OR and MM3C should continue,
with ongoing installation of level loggers at both sites at least seasonally. The
Date
Flow
(m3/s)
Specific
Flow
((m3/s)/km2)
Flow
(m3/s)
Specific
Flow
((m3/s)/km2)
16-Oct-13 0.0405 0.0023 16.0 0.0090
17-Apr-14 0.4297 0.0239 28.8 0.0162
10-Jun-14 0.1160 0.0064 32.9 0.0185
25-Jul-14 0.0087 0.0005 8.4 0.0047
Average 0.0083 Average 0.0121
02JC008 -- Blanche
River above
Englehart (1782 km2)
Mousseau Creek
(18.1 km2)

Orefinders Resources Inc. Closure Plan
STORY ENVIRONMENTAL INC. Page 26 of 86
M2-OR site has proven its utility as a year-round gauging site. Maintenance of the
MM3C site should continue on a seasonal basis during the ice-free period, since
heavier ice conditions at this site preclude reliable data collection during the winter.
5) Given SEI’s current understanding of the Orefinders project, there is little value in
collecting additional flow data at Mousseau Creek.
4.3.2 Surface Water Quality
Water Quality - Comparison of Surface Water Monitoring Data against Provincial Water
Quality Objectives (“PWQO”)
The surface water monitoring sites are illustrated in Figure 4.3.2.1 (Appendix A). Table 4.3.2.1
(Appendix B) describes each of the surface water monitoring sites and its purpose in the
monitoring program.
Analytical results from surface water sampling conducted in October and December 2013, and
February, April and June 2014 are presented in Table 4.3.2.2 (Appendix B). The data are
compared against PWQOs and exceedances of the PWQOs are reported in Table 4.3.2.3
(Appendix B).
The surface water within the local Mirado Project Misema River watershed is generally of good
quality and consistent with other similar water bodies in northern Ontario. The total iron PWQO
of 0.3 mg/L was exceeded at least once at six of the 11 sites. Exceedances of the iron PWQO
commonly occur naturally in northern Ontario. Exceedances of the iron PWQO occurred at
upstream sites (LLT and MM0) as well as at sites closer to historical mining activities (MM2 and
Trench 1). Trench 1 is a trench along a trail to the Misema River and was originally sampled for
onsite water quality since it was draining to the Misema River. It has shown consistently high
concentrations of iron, although there was a marked decrease in June from 3.9 mg/L in April to
0.75 mg/L. Aside from Trench 1, particularly elevated concentrations at other sites (e.g., 4.0
mg/L at MOU1 and 4.6 mg/L at MOU2), all occurring in winter, could represent dissolution of
iron from sediment or the upstream Adam’s Mine (an iron-ore mine) under anoxic/reducing
conditions as a result of ice cover.

Orefinders Resources Inc. Closure Plan
STORY ENVIRONMENTAL INC. Page 27 of 86
Similarly, the dissolved aluminum PWQO of 0.075 mg/L was exceeded at five sites, with most of
these exceedances occurring in Dec 2013. The highest single concentration (0.12 mg/L)
occurred at MOU2, where dissolved aluminum exceedances were recorded on two of the four
sampling dates. There were no exceedances of the dissolved aluminum PWQO in the June
sampling event.
Dissolved oxygen concentrations lower than the PWQO for cold water biota were recorded at
some ice-covered sites (MOU1 in December and February, Pit 1 and Pit 2 in February and April,
Trench 1 in December and April and MOU2 in February). There were five violations of the
PWQO for dissolved oxygen recorded in ice-free conditions (5.54 mg/L at Trench 1 in Oct 2013,
5.74 mg/L at MOU1 in June 2014 and 3.6 mg/L in MOU2 in June 2014 versus a PWQO of 6.0
mg/L, 4.1 mg/L in Trench 1 in June 2014 and 4.35 mg/L in LLT in June 2014 versus a PWQO of
5.0 mg/L). Trench 1 is a human-made feature which collects water (precipitation, run-off, and
snowmelt); it has no inflow of water, other than these sources, so lower concentrations of
dissolved oxygen would be expected at this sample site. This sample site slowly drains to the
Misema River through a series of trenches and small water falls which have been created over
the years through erosion by this drainage. As this water flows ephemerally to the Misema
River, it would become oxygenated therefore these reduced concentrations of dissolved oxygen
are not a concern. The MOU1, MOU2 and LLT sites are all small creeks or tributaries that have
shallow water which becomes warm in the summer months, thus holding less dissolved oxygen.
Total phosphorus exceedances were found at three of the 11 sites. The highest concentrations
(ranging from 0.091, to 0.12 mg/L) were found in Trench 1 during three of the four sampling
events. It is unknown why this human-made feature contains elevated concentrations of total
phosphorus. However the exceedances are only three to four times the PWQO and this water
represents a very small contribution to the Misema River.
Acidity of the surface water is circum-neutral, with no pH values of less than 6.0 recorded in the
field. However, one violation of the PWQO range for pH (6.5-8.5) was observed in December
2013, with a pH of 8.94 at MM2.
Two exceedances of the Interim PWQO for total copper (0.005 mg/L, with hardness greater
than 20 mg/L) were recorded at the Pit 2 in December 2013 and MM2 in October 2013 (0.0074
and 0.007 mg/L, respectively)

Orefinders Resources Inc. Closure Plan
STORY ENVIRONMENTAL INC. Page 28 of 86
Two exceedances of the Interim PWQO for zinc (0.084 mg/L at Trench 1 and 0.042 mg/L at
MM2 versus an Interim PWQO of 0.02 mg/L) occurred at the Trench 1 site in December 2013
and MM2 site in April 2014.
One exceedance of the interim PWQO for cadmium (0.0001 mg/L with hardness less than 100
mg/L) occurred at the Trench 1 site (0.00014 mg/L).
These exceedances are relatively minor. Three human-made surface water features, Pit 1, Pit 2
and Trench 1, represent almost one half of the exceedances. The exceedance at MOU1 and
MOU2 for total iron and dissolved aluminum may be from the historical iron-ore mine, Adam’s
Mine, which is upgradient of these sampling locations. The elevated total iron and dissolved
aluminum concentrations at MM2 are typical of northern Ontario; as are the elevated iron
concentrations at MM3. The other exceedances are only sporadic.
Surface Water Monitoring Program
Surface water sampling is occurring at the sites illustrated on Figure 4.3.2.1, Appendix A, on a
bimonthly basis. See Table 4.3.2.1, Appendix B, for a description and rationale for each surface
water site. However, sampling at all the locations was not possible during the December,
February or April sampling events due to unsafe ice conditions. The surface water is being
monitored for the parameters as specified in Ontario Regulation 240/00, Mine Development and
Closure under Part III of the Act. Part 5, Surface Water Monitoring (“O. Reg. 240/00”) as well as
cyanide speciation between total and free, field pH, and temperature. The results to date are
presented in Table 4.3.2.2 of Appendix B and are discussed above.
The sampling methodology for the surface water sites is described in the SEI Orefinders site-
specific Standard Operating Procedure (“SOP”) which is available upon request.
4.4 Groundwater
4.4.1 Groundwater Aquifers and Quantity
4.4.1.1 Quaternary Geology

Orefinders Resources Inc. Closure Plan
STORY ENVIRONMENTAL INC. Page 29 of 86
The area is mostly underlain by glaciolacustrine fine grained deposits consisting of clay, varved
clay and silt. These deposits are most prominent to the immediate east and south of the site. A
thin veneer of drift (glacial till) covers most of the high bedrock outcrops that occur at the site
and towards the north and west. These types of deposits and the associated terrain usually
result in numerous perched water tables due to the low permeability of these surface materials.
The surficial deposits become larger in grain size (sand) northeast through the southeast of the
site, east of the Misema River, grading from deltaic deposits to beach type deposits. These
latter deposits area associated with the Munro Esker.
The Munro Esker is a major regional glaciofluvial deposit (northwest – southeast trending) that
likely constitutes a significant overburden aquifer. It is located on the eastern side of the
Misema River and is unlikely to be hydraulically connected to groundwater systems on the
western side of the Misema River (at the Mirado Site).
4.4.1.2 Water Well Records
Water well records for wells within a 10 kilometre radius of the site were reviewed. The centroid
was located at 588011E 5317305N UTM NAD83. The water well records were provided by the
Wells Help Desk which is a division of the Environmental Monitoring and Reporting Branch of
the Ministry of the Environment and Climate Change. As well, the online Interactive Well
Records Map (http://www.ontario.ca/environment-and-energy/map-well-record-data) was also
consulted.
Based on this review, a total of 9 water wells are located within the 10 kilometre radius. One of
the well records is plotted incorrectly (7047153 – refers to a well on the Kanichee Mine Road
near Temagami, Ontario) and, thus has been eliminated from the discussion. A second water
well record (7215214) refers to the wells that were installed at the site during the recent
groundwater assessment program undertaken by SEI. This record is new, thus there is no
paper record available at this time through the Wells Help Desk. A third record (630381) refers
to a water well that was abandoned and sealed after drilling. The 9 available records are
presented in Appendix C for reference.
The closest well to the site (600860) is located at a distance of approximately 8.2 kilometres to
the southwest. In fact, most of the water wells (5 in total) are located in this region which is

Orefinders Resources Inc. Closure Plan
STORY ENVIRONMENTAL INC. Page 30 of 86
known as Krugerdorf. One well is located in the Boston Creek area (6301807) and the
remaining well is located on Highway 624 towards Marter.
The wells in the Krugerdorf area typically encounter clay until approximately 19 metres below
grade and then, what is described on the logs as, red and pink rock and / or granite. The wells
are cased into the competent rock and open hole beyond that point. The pumps are typically
placed about 3 metres above the bottom of the well. The wells range from 32 to 231 metres in
depth. In one case (630382), a sand and gravel unit was encounter at 19.8 to 21 metres below
grade and, due to the presence of water in these materials, the drilling was terminated. The
static water level in the wells after pumping was typically located within 12 metres of grade. All
of the wells have relatively low recommended pumping rates from 1 to 20 litres per minute.
The well in the Boston Creek area (6301807) encountered sand approximately 3 metres below
grade and then, what is described on the log as, greenstone. The well was cased 6 metres into
the competent rock and open hole beyond that point. The pump was positioned about
1.5 metres above the bottom of the well. The well is 82 metres deep. The static water level was
located at 2.7 metres below grade. This well was also low in production with a recommended
pumping rate of 1 litre per minute.
The well towards Marter (6303030) encountered clay until approximately 11 metres below grade
and then, what is described on the log as, green rock. The well was cased 11.5 metres below
grade, into the competent rock, and open hole beyond that point. The wells underwent hydro
fracturing from 18 metres to the bottom of the well at 62 metres with pressure variation from 500
to 1 300 pounds per square inch (34.4 to 89.6 bar). The pump was positioned about 7.6 metres
above the bottom of the well. The static water level was located at 1.8 metres below grade. This
well was also low in production with a recommended pumping rate of 9 litres per minute.
In general, the water wells in the area of the site are quite deep and completed in hard rock
formations. The water production from the wells is poor thus the requirement for hydro fracturing
and over drilling. The hydro fracturing being used to try and increase groundwater flow from the
formation to the well and over drilling used to allow some storage of water within the casing. The
static water levels, at this point, rise above the overburden (clay in most cases) / bedrock
interface suggesting an upwards groundwater gradient in these areas with the clay acting as a
confining layer.
4.4.1.3 Groundwater
Orefinders Resources Inc. Closure Plan
STORY ENVIRONMENTAL INC. Page 31 of 86
Local Hydrogeology
The undulating terrain at the site and the associated infill deposits (glacial tills; glaciolacustrine
materials (clay, varved cay, and silt); alluvial sands and silts) are responsible for varied a
groundwater regime throughout the area. The higher topographic areas are overlain by a thin
veneer of glacial till while the depressions / valley are in-filled with glaciolacustrine (clay, varved
clay, and silt) and alluvial materials (sands and silts). Typically, at this site, the rising sequence
of lithology within the depressions consists of bedrock; alluvial materials (sands and silts);
glaciolacustrine (clay, varved clay, and silt) and glacial till. Typically, in such a sequence, the
more permeable alluvial materials act as a drain for the more impermeable glaciolacustrine
materials and the bedrock. The groundwater table in the glaciolacustrine materials is perched
above the alluvial materials and slowly draining (downward gradient) into the alluvial materials,
while the groundwater in the bedrock is flowing into the alluvial materials (downward gradient).
In both cases the alluvial materials are acting as a drain for the groundwater beneath various
areas across the site. The discharge from these depressions will be towards low topographic
area, specifically the nearby Misema River and Mousseau Creek.
Groundwater Assessment
Thirteen monitoring wells were installed at the site in October / November 2013 at a total of
seven locations (nested wells were installed at most locations). Three wells encountered
bedrock at depths ranging from 3.7 metres (12 feet) to 16.5 metres (54 feet). Overburden
textures are variable, ranging from sand to clay. Clay was present in the overburden at five out
of seven sites. The clay exhibited a varved texture, thus confirming its glaciolacustrine origin.
Only the overburden at the two sites, where the overburden was shallowest, was dominated by
sand (at MW-1 and MW-BG). The locations of the monitoring wells are illustrated on Figure
4.4.1.3.1, Appendix A.
The wells have been monitored a total of four times since their installation in 2013. During each
monitoring visit, the elevation of the groundwater in each well was measured and groundwater
samples were collected for laboratory analysis. The results of the laboratory analysis are
presented in Section 4.4.2. The results of the groundwater elevation measurements are
discussed below.

Orefinders Resources Inc. Closure Plan
STORY ENVIRONMENTAL INC. Page 32 of 86
The monitoring wells installed with the bedrock (MW1-BR, MW2-BR, and MW4-BR) were
installed to a completion depth of 262 meters above sea level (“masl”), which is the approximate
elevation of the Misema River. The overburden wells were installed to shallower depths to
provide groundwater levels in the quaternary deposits.
The wells allow for ongoing monitoring of the groundwater quality and levels. For each
monitoring well installation, the annulus around the well casing was backfilled with silica sand to
approximately 0.3 m above the top of the screened section. In some cases, the native materials
sloughed against the screen prior to placement of the silica sand. The remainder of the annulus
above the sand was sealed with bentonite to minimize the potential for surface water infiltration
into the monitoring well. Above ground casings were installed for all of the monitoring wells. The
groundwater elevation data is presented on Table 4.4.1.3.1 in Appendix B.
Bedrock Monitoring Wells
The groundwater surface in the bedrock wells tends to exhibit a southerly flow direction with an
approximate gradient of 0.05 m/m. The phreatic surface within these wells ranges from 16 to
34 m above the elevation of the Misema River (259 masl). The elevation of the water within the
nearby pits (South Pit and Mirado Pit) is approximately 289 masl and this elevation is consistent
with the current interpretation of both the groundwater flow direction and gradient beneath the
site. Since the ground surface in the area is undulating, typical of glacial terrain, it is difficult to
illustrate the depth of the groundwater below grade at the site. However, in reference to the
wells completed in the bedrock, the groundwater is located anywhere from 4 to 14 m below
grade.
Overburden Monitoring Wells
Based on the groundwater elevations measured in the overburden wells, it appears there is a
slight upwards groundwater gradient, i.e. the bedrock groundwater discharging to the
overburden materials, to the east and south of the pits. North of the pits, there is a downward
groundwater gradient. Based on this evidence, it is suspected that the water within the pits does
not have a great deal of influence on the local groundwater elevations. In fact, it appears that
the surface topography is the major influence on the elevation of the shallow (overburden)
groundwater beneath the site. The groundwater in the vicinity of the pits, which is also the

Orefinders Resources Inc. Closure Plan
STORY ENVIRONMENTAL INC. Page 33 of 86
height of land in that area, is present at an elevation of approximately 294 masl. Beyond the
pits, the groundwater elevations decrease with the associated decrease in topographic
elevations. In general, the groundwater elevations within the overburden wells are within 4 m of
grade. The lowest overburden groundwater elevation is continually present in a monitoring well
located to the south of the pits (MW3). This monitoring well is completed in a sand and gravel
unit and exhibits a groundwater elevation of approximately 270 masl. The direction of
groundwater flow in the overburden materials varies from southeast to southwest towards the
Misema River and Mousseau Creek. The hydraulic conductivity of these overburden materials
has not been determined conclusively at this time. However, in a relative sense, the hydraulic
conductivity within the alluvial materials are much higher than those within the bedrock and
glaciolacustrine materials.
Former Mine Workings
The former underground mine workings trend for approximately 590 m in a northeast-southwest
direction. The surface manifestations of the workings consist of two open pits (South Pit and
Mirado Pit) now filled with water) and a shaft located approximately 425 m northeast of the pits.
The pits are approximately 30 m deep. There are four levels of workings which originate from
the shaft (38 m; 76 m; 115 m; and 152 m). The shaft extends to approximately 161 m. The
majority of the workings are centered beneath the shaft and the pits with drifts connecting the
two areas on the 76 m, 115 m, and 152 m levels. There appears to be a level at the base of
Mirado pit, however it is not connected to any of the underground workings.
4.4.2 Groundwater Quality
Groundwater Sampling Program
Based on a review of the local topography, geology and Project Area, SEI developed a
groundwater assessment program. The program has included the drilling of boreholes within
the overburden materials and bedrock across the Project area. Monitoring wells were installed
in each of the boreholes and, to date, a total of 13 groundwater wells are located in the ESA.
The borehole drilling and well completion was undertaken from 30 October 2013 to 21
November 2013. The program focused on the Mirado Project site. All of the monitoring well
locations are presented on Figure 4.4.1.3.1, Appendix A.

Orefinders Resources Inc. Closure Plan
STORY ENVIRONMENTAL INC. Page 34 of 86
Project Area groundwater monitoring wells were developed and sampled in December 2013 and
February, April and June 2014. The groundwater wells are scheduled to be sampled bimonthly.
The SOP that is followed when conducting the groundwater sampling was developed by SEI
and is available upon request.
During the initial drilling program a truck-mounted auger drilling rig was utilized to install the
groundwater wells. Monitoring well locations MW1, MW2, and MW4 include two nested wells,
one in the overburden, i.e., MW1-OB, and one in the bedrock, i.e., MW1-BR. MW3 includes two
nested wells, one deep, MW3-D, and one shallow, MW3-S. Monitoring well location MWT1 has
two nested wells, one in the overburden under the tailings, MWT1-OB, and one in the saturated
zone within the tailings, MWT1-Sat.
A summary of the groundwater data collected to date is presented in Table 4.4.2.1
(Appendix B). The data has been compared to Ontario Regulation 153/04, Ontario Soil,
Groundwater, and Sediment Standards (“O. Reg. 153/04”), Table 2 Full Depth Generic Site
Condition Standards in a Potable Ground Water Condition and Table 3 Full Depth Generic Site
Condition Standards in a Non-Potable Ground Water Condition.
Other than several exceedances of potable drinking water standards in the groundwater
collected from a well installed within the tailings, MMT1-Sat, and the well completed in the
overburden under the tailings, MWT1-OB, there were only two other exceedances of potable
drinking water standards in the background well, MW-BG, for dissolved cobalt.
4.5 Terrestrial Plant and Animal Life
Azimuth Environmental Consulting, Inc. (“Azimuth”) conducted a terrestrial inventory of the
Mirado Phase 1 Project area to characterize and evaluate the existing Natural Heritage
Features, provide baseline data and to support permitting requirements for the project.
The inventory includes a review of existing data sources, along with field surveys. Prior to
undertaking the field studies, an initial classification of habitats was undertaken using recent air
photo imagery. Vegetation boundaries were then checked in the field and adjusted as
necessary. Vegetation community types were classified using the Ontario Ecological Land
Classification (“ELC”) protocols of the Ecosites of Ontario Manual (Banton et al., 2009). Field

Orefinders Resources Inc. Closure Plan
STORY ENVIRONMENTAL INC. Page 35 of 86
surveys to define vegetation community types and plant species compositions were completed
in June 2014.
Particular care was taken during the field work to detect any federally or provincially designated
species, notably Species at Risk as identified by the Committee on the Status of Endangered
Wildlife in Canada (“COSEWIC”), and by the Committee on the Status of Species at Risk in
Ontario (“COSSARO”). Specific surveys for Whip-poor-will were carried out in May and June
2014 to determine the habitat requirements of Whip-poor-will associated with the site.
4.5.1 Terrestrial Vegetation
The Mirado Phase 1 Project is comprised of approximately 20 plant communities in 9 unique
ecosites. This is broken down into 4 deciduous forest ecosites and 5 coniferous forest ecosites,
together with coniferous swamps, and open water communities. Vegetation communities and
descriptions are outlined in Table 4.5.1.1, Appendix B. Resulting community mapping for the
Mirado Phase 1 Project Area is illustrated in Figure 4.5.1.1, Appendix A.
The proposed Mirado Phase 1 Project is within an area that has been subjected to
anthropogenic alterations in the recent past. The vegetation communities present within the
area are very common on the landscape. None of the forested and wetland vegetation
communities in the Mirado Phase 1 Project area are considered Provincially Rare, nor were any
provincially or federally threatened or endangered plant species observed within the Mirado
Phase 1 Project area.
4.5.2 Wildlife
Wildlife species utilizing the study area were identified from direct observation and through
interpretation of sign (i.e. tracks, scats, vocalizations, etc.) as a matter of course while
conducting the survey. Moose (Alces alces), Beaver (Castor canadensis), Northern River Otter
(Lontra canadensis), Black Bear (Ursus americanus), Grey Wolf (Canis lupis), Porcupine
(Erethizon dorsatum), Skunk (Mephitis mephitis), Raccoon (Procyon lotor), Red Fox (Vulpes
vulpes), Eastern Chipmunk (Tamias striatus), Red Squirrel (Tamiasciurus hudsonicus),
Snowshoe hare (Lepus americanus), Muskrat (Ondatra zibethicus) were mammals observed on
site during the assessment process. Green Frog (Rana clamitans), Leopard Frog (Rana

Orefinders Resources Inc. Closure Plan
STORY ENVIRONMENTAL INC. Page 36 of 86
pipiens), Spring Peeper (Hyla crucifer), Woodfrog (Rana sylvatica), American Toad (Bufo
americanis), were amphibians observed on site during the assessment process. Great Horned
Owl (Bubo virginianus), Barred Owl (Strix varia), Common Nighthawk (Chordeiles minor), Least
Flycatcher (Empidonax minimus), Pileated Woodpecker (Dryocopus pileatus), Swainson’s
Thrush (Catharus ustulatus), Veery (Catharus fuscescens), and Mallard (Anas platyrhynchos)
were avian species observed during the assessment process. With the exception of Common
Nighthawk none of the species observed are designated species at risk.
While nocturnal bird surveys (whip-poor-will surveys) were carried out during May and June
2014, no Whip-poor-will were documented in appropriate habitat within 1 km of the two survey
locations identified in Figure 4.5.1.1. There is currently no expectation that Significant Habitat
for Threatened or Endangered species as listed under the Endangered Species Act will be
impacted by the proposed closure plan.
All migratory birds listed under the Migratory Birds Convention Act (“MBCA”) are protected. The
Fish and Wildlife Conservation Act (“FWCA”) also protects certain amphibians, reptiles and
mammals from hunting, collection or the collection of their eggs.
4.5.2.1 Common Nighthawk
Common Nighthawk is listed as Species of Special Concern under the Endangered Species
Act, 2007. Habitat for species of Special Concern is typically considered to be Significant
Wildlife Habitat. Common Nighthawk is also listed federally as Threatened. The Federal
Species at Risk Act provides protection for both the individuals and their critical habitat on all
lands.
Standard protocols for confirmation of habitat use in nocturnal birds require that the species be
identified in more than one survey during a single breeding season. Common nighthawk was
identified during a single site assessment in June of 2014 and would thus be considered as a
possible breeder within the area. The location of the Common Nighthawk sighting during the
2014 field season was the south stockpile and is outlined on Figure 4.5.1.1. Common
Nighthawk typically nests in open habitats where the ground is devoid of vegetation which is a
condition that is provided by the south stockpile. While it has not been determined if this
stockpile would constitute critical habitat for the Common Nighthawk, additional discussions with

Orefinders Resources Inc. Closure Plan
STORY ENVIRONMENTAL INC. Page 37 of 86
Environment Canada staff may be required if work which would change the condition of the
south stockpile is proposed.
Ministry of Natural Resources (“MNR”) direction related to the Common Nighthawk in the past
has been to ensure a 100 meter buffer around any occupied Common Nighthawk nests during
their breeding season from mid-May to the end of August.
4.5.3 Other Considerations
There are no Areas of Natural and Scientific Interest (“ANSI”), Environmentally Sensitive Areas
or Provincially Significant Wetlands (“PSW”) within the Mirado Phase 1 Project Area.
It should be noted that the absence of a protected species within the Study Area does not
indicate that it will never occur within the area. Given the dynamic character of the natural
environment, there is a constant variation in habitat use. Care should be taken in the
interpretation of presence of species of concern including those listed under the Endangered
Species Act, and Species at Risk Act (“SARA”). The MNR generally recommends that future
work taking place more than a year from the study should be subjected to review. The purpose
of this review should be to ensure that no changes to existing policies or changes to existing
habitat in the study area have occurred. Changes to policy, or the natural environment could
result in shifts, removal, or addition of new Key Natural Heritage features.
4.6 Aquatic Plant and Animal Life
4.6.1 Aquatic Vegetation and Fisheries
Due to the nature of this project, detailed fish and fish habitat assessments will not be
undertaken for this phase of the project. It is anticipated that the work to be conducted will not
affect fish or fish habitat. If the project advances into Phase 2, which involves a larger area, fish
and fish habitat studies will be undertaken.
4.6.2 Benthic Invertebrates
Orefinders Resources Inc. Closure Plan
STORY ENVIRONMENTAL INC. Page 38 of 86
Benthic invertebrates were sampled in the Misema River, Mousseau Creek, and the South Pit
on site during October 2013 to determine the background benthic communities in the
watercourses and to help identify any possible contamination. All sampling sites can be seen in
Figure 4.6.2.1, Appendix A.
At each of the Misema River sites, three samples were taken and processed separately. One
sample was collected from the two Mousseau Creek sites and the site in the South Pit.
Samples were collected using standard methodologies as documented in Environment
Canada’s Metal Mining Technical Guidance for Environmental Effects Monitoring. The
equipment to collect the samples for sieving purposes was an Ekman Grab Sampler or a
500 micrometre (“µm”) kick net. Samples were:
sieved with a 500 µm wash bucket,
placed into 1-litre jars,
preserved in 10 % buffered formalin, and
sent to ZEAS Incorporated, Nobleton, Ontario, to be sorted and identified.
Benthic invertebrates were identified to the lowest practical taxonomic level, in some cases
down to species level.
The following indicators to determine the health of the benthic communities were calculated
(Tables 4.6.2.1 and 4.6.2.2, Appendix B):
Total Density (number of organisms per square metre),
Total Taxa Richness (number of taxa present at the sampling station, a higher value for
Richness can indicate a healthier and balanced community),
Simpson’s Diversity Index (a measure of the diversity of the community, the closer the
value is to one, the more diverse the community is),
Simpson’s Evenness (a measure of the proportional distribution of organisms in the
community, the closer the value is to one, the more evenly distributed the community is),
Total Ephemeroptera Plecoptera Trichoptera (“EPT”) (pollutant sensitive benthos, a high
percentage of EPT can indicate better water quality),
% EPT, and
% Chironomids (pollutant tolerant benthos, a high percentage could represent poorer
water quality).

Orefinders Resources Inc. Closure Plan
STORY ENVIRONMENTAL INC. Page 39 of 86
For the Misema River sites, these indicators were calculated for all three samples collected from
each site and then averaged to find a value per sampling site.
The Misema River was sampled in three different locations: MM0 (upstream), MM1
(downstream of the Little Long Lake and Two Lakes tributaries and upstream of the Mirado
Site), and MM3 (downstream of the Mirado Site and the Mousseau Creek input). The substrate
at the two locations upstream of the Mirado site was dominated by clay and sand and the total
site depths were between 4 and 5 m. The physical features were considerably different at the
downstream location (MM3), depth was relatively shallow (1.5 m or less) and the substrate
consisted of boulders, cobbles, and gravel. The combination of the substrate and faster moving
water made it more difficult to collect a benthic sample; however, this was the most accessible
location in the Misema River downstream of the Mirado Site. Total density (number of
organisms per square metre) decreased throughout the Misema River (Table 4.6.2.2, Appendix
B), however, taxa richness (number of species present) increased. Simpson’s Diversity was
consistent upstream of the Mirado Site, 0.82 at MM0 and 0.81 at MM1, and increased to 0.94 at
MM3, downstream of the Mirado Site. These values indicate the benthic community is slightly
more diverse downstream. Simpson’s Evenness ranged from 0.31 to 0.48, increasing
downstream; however, the lower values indicate that the benthic community is not evenly
distributed. % EPT (42-51%) and % Chironomids (26-36%) are relatively consistent throughout
the Misema River. A higher percentage of EPT than Chironomids indicates that there are more
pollutant sensitive benthos in the water body, which could represent better water quality.
Benthic invertebrates were collected from two sites in Mousseau Creek: MOU2 (upstream of
any influence from Mirado Site) and MOU1 (downstream of Mirado Site). Substrate at MOU2
was clay and sand, while at MOU1, it was sand and gravel (Table 4.6.2.2, Appendix B). Total
site depth was similar at both sites (0.6 / 0.5 m). Total density increased drastically from the
upstream site (76 organisms per square metre) to the downstream site (404 organisms per
square metre); however, the total taxa richness was similar (31 at MOU2 and 37 at MOU1).
Simpson’s Diversity was high at both sites (>0.90), indicating a diverse benthic community.
Simpson’s Evenness decreased throughout the creek. MOU2 had an evenness of 0.63 and
MOU1 had an evenness of 0.29. Both sites had a higher % Chironomids than % EPT; however
the downstream site had more Chironomids than the upstream site.

Orefinders Resources Inc. Closure Plan
STORY ENVIRONMENTAL INC. Page 40 of 86
One benthic sample was collected from the shore of the South Pit on the Mirado Site. Substrate
in the South Pit was clay and sand and the total depth of the sampling site was 0.6 m. The
South Pit had a total density of 812 organisms per square metre and 32 species present.
Simpson’s Diversity was high (0.90) and Simpson’s Evenness was low (0.30). The benthic
community may be diverse but not distributed evenly throughout the species. The South Pit has
a low % EPT and a similar % Chironomids to the other samples collected in the area.
4.7 Ambient Air Quality
4.7.1 Air Quality Monitoring
The baseline ambient air quality monitoring study commenced in 2013. It consists of monitoring
total suspended particulates (“TSP”), metals, total dustfall, sulphur dioxide (“SO2”), and nitrogen
oxides (“NOx”). Details of sampling locations, frequency and parameters are provided in
Table 4.7.1.1. Sampling sites are illustrated in Figure 4.7.1.1, Appendix A. An air monitoring site
has been set up on the Mirado Site to determine the baseline air quality of the site. A second air
monitoring site has been set up in Boston Creek, the nearest residential community to the
Mirado Site, to determine the baseline air quality in the community before Orefinders
commences work. A background dustfall site has also been established west of the Mirado Site
away from travelled roadways.
TABLE 4.7.1.1 Air Quality Study Locations, Parameters and Sampling Frequency
Location Sample ID Name Air Quality Parameter Sampling Frequency
Mirado Site
M-TSP1 TSP and metals Every 6th day
M-DF1 Total Dustfall Monthly
M-SO2#1
M-NO2#1
SO2
NO2 Monthly
- Meteorological
parameters Continuously
Boston Creek
BC-TSP2 TSP and metals Every 6th day
BC-DF2 Total Dustfall Monthly
BC-SO2#2
BC-NO2#2
SO2
NO2 Monthly

Orefinders Resources Inc. Closure Plan
STORY ENVIRONMENTAL INC. Page 41 of 86
Location Sample ID Name Air Quality Parameter Sampling Frequency
Background Site BG-DF3 Total Dustfall Monthly
TSP is monitored using portable and battery operated air samplers (MiniVol™ TAS). The
MiniVol™ TASs have been configured to collect TSP and operates at 5 litres per minute. TSP
samples are taken for 24 hours from midnight to midnight every sixth day. The filters are
analysed for TSP as well as total metals. Due to the lack of electricity at the site, one of the
Ministry of the Environment and Climate Change (“MOECC”) reference method samplers for
TSP and metals could not be used. The MiniVol™ TAS was developed by Airmetrics along with
the U.S. Environmental Protection Agency for remote sites and locations without power.
Although it operates at a lower flow rate than that specified by the Operations Manual for Air
Quality Monitoring in Ontario (MOECC, 2008) (“Operations Manual”), it provides results that
closely agree with reference method samplers.
Mechanical problems were experienced by the TSP samplers during some sampling periods
due to extreme cold temperatures. These occurrences are indicated as a “-“ in the result table,
Table 4.7.1.2, Appendix B.
Total dustfall is collected using laboratory supplied open top plastic jars that are exposed to the
atmosphere for a period of 30 days. Jars are supported by wooden boxes attached to ladders
at least three metres from the ground. The procedure for total dustfall follows the MOECC SOP
described in the Operations Manual. SO2 and NO2 is being sampled using Maxxam Analytics’
(“Maxxam”) Passive Air Sampling System (“PASS”). This system was developed by Maxxam
with the support of the following agencies: Alberta Environmental Protection, Alberta Research
Council, Clean Air Strategic Alliance of Alberta, and National Research Council.
The TSP and metals results (from December 2013 to May 2014) for the Mirado Site can be
found in Table 4.7.1.2, Appendix B, and the results for the Boston Creek Site can be found in
Table 4.7.1.3, Appendix B. Results have been compared to Ontario’s Ambient Air Quality
Criteria (“AAQC”). All TSP concentrations are low, ranging from non-detect (with a detection
limit of 39 micrograms per cubic metre (“µg/m3”)) to 80 µg/m3 at the Mirado Site. The 24-hour
AAQC for TSP (suspended particulate matter, <44 µm) is 120 µg/m3. TSP concentrations were
also low at the Dobie Site, ranging from non-detect to 68.8 µg/m3. With the exception of two

Orefinders Resources Inc. Closure Plan
STORY ENVIRONMENTAL INC. Page 42 of 86
samples, TSP concentrations were higher in Boston Creek than at the Mirado Site. All metal
concentrations were well below the AAQC at both sites.
Dustfall results for the three sites and the blank for January to May 2014 can be found in Table
4.7.1.4, Appendix B. Total particulate concentrations were calculated by adding the soluble and
insoluble particulates and dividing it by the surface area of the mouth of the dustfall jar. These
concentrations were then adjusted to a 30 day averaging time to compare to the AAQC of 7
grams per square metre in 30 days (“g/m2/30d”). Due to the preservative, copper sulphate to
prevent algal growth, used in the dustfall jars, the blank jars contain a very small concentration
of soluble particulates. It can be assumed that all of the jars will have the same very small
unknown amount of soluble particulates due to this preservative. All total dustfall concentrations
are low ranging from 0.27 to 1.15 g/m2/30d. Concentrations were similar between all three sites
for each month sampled and are all much less than the AAQC of 7 g/m2/30d.
The monthly PASS results for SO2 and NO2 are shown in Table 4.7.1.5, Appendix B. There is
currently no 30 day AAQC for SO2 and NO2 in Ontario. Alberta’s 30 day AAQC for SO2 is 11 parts
per billion (“ppb”). SO2 and NO2 concentrations were low at both sites, ranging from less than 0.1 to
0.7 ppb SO2 and less than 0.1 to 0.7 ppb NO2.
The air sampling sites were sampled according to the SOP developed by SEI. The SOP is available
upon request.
4.7.2 Study Period Climate, 2013-2014
An Onset HOBO U30 weather station was installed at the Mirado Site on 10 November 2014. It
measures the following parameters at 10-minute intervals: air temperature, relative humidity,
solar radiation, wind direction, wind speed, and rainfall.
Table 4.7.2.1 summarizes basic study period climate data collected from November 2013 to
July 2014. Monthly summaries of average air temperature and total precipitation are compared
to climate normals from Kirkland Lake for 1971 to 2000 published by Environment Canada.
This comparison indicates the following climatic characteristics of the study period:

Orefinders Resources Inc. Closure Plan
STORY ENVIRONMENTAL INC. Page 43 of 86
1. The months of December 2013 and March 2014 were each approximately 3.5oC colder
than normal and the winter as a whole was cold, with only February recording normal
temperatures.
2. Precipitation in May and July 2014 at the Mirado site was close to normal, and average
air temperatures were within 1oC of normal in both months.
3. June 2014 was relatively warm (1.5oC above normal) and moderately dry with total
precipitation 20% below normal.
Table 4.7.2.1: Summary of Monthly Air Temperature and Rainfall/Precipitation recorded at Orefinders’ Mirado Site, as well as 1971-2000 Climate Normals from the Kirkland Lake Airport
Source: “Orefinders_Weather_Station_Workbook_ACS_30_July_2014.xls” , Pivot Table_30_July_ACS
Figures 4.7.2.1A and 4.7.2.1B show more detailed climate data from the Mirado weather station
for one day in late June 2014 (28 June 2014). The purpose of these figures is to demonstrate
the full capabilities of the weather station data collection. These data could be used for future
studies such as water balance (estimating evapotranspiration), as well as to supplement
regional wind data for air dispersion work.
The data in Figure 4.7.2.1A suggest the following weather characteristics on 28 June 2014:
Orefinders Kirkland Lake Orefinders Kirkland Lake
Mirado
Average Air
Temp (°C)
1971 to 2000
Climate Normal
(°C)
Deviation
From
Normal (oC)
Mirado
Precipitation
Total (mm)
1971 to 2000
Climate Normal
(mm)
Deviation
From Normal
(%)
Nov 2013** -5.6 n.a.
Dec 2013 -16.3 -12.9 -3.4 n.a.
Jan 2014 -17.8 -17.1 -0.7 n.a.
Feb 2014 -14.6 -14.8 0.2 n.a.
Mar 2014 -11.3 -7.7 -3.6 n.a.
Apr 2014 0.8 1.3 -0.5 613) 54.0
May 2014 10.7 9.8 0.9 85.4 73.6 16%
Jun 2014 16.5 15 1.5 72.4 90.6 -20%
Jul 2014** 16.9 17.8 -0.9 93.2 90.5 3%
Notes
1) **Indicates incomplete months of data
(weather station was installed on 10 November 2013, and most recently downloaded on 25 July 2014.)
2) "n.a." Indicates Not Available.
3) Total Precipitation measured at Orefinders in April 2014 is likely not a reliable value, since
this total includes some snowfall (which the rain gauge cannot measure reliably), as well as rainfall.

Orefinders Resources Inc. Closure Plan
STORY ENVIRONMENTAL INC. Page 44 of 86
1) Clear sky conditions dominated, as evidenced by the almost symmetrical pattern of
solar radiation through the day: peaking at approximately 900 W/m2 at noon (Eastern
Standard Time), with occasional reductions in afternoon solar radiation likely due to
scattered clouds. Though rain data are not shown in the figure, no rain was recorded
on 28 June.
2) Air temperatures dropped to a minimum of approximately 10oC in the early morning
before the sun rose, and then peaked at approximately +30oC in the afternoon.
3) Relative humidity peaked at nearly 90% at the time of minimum air temperature in
early morning and dropped to less than 40% in the afternoon, due to increased
moisture-holding capacity of the warmer afternoon air.
The data in Figure 4.7.2.1B indicate the following wind characteristics on 28 June 2014:
1) Wind speeds were less than 0.2 metres/second (“m/s”) for most of the early morning,
before rising to speeds of >1 m/s in the afternoon. Wind speeds declined again in
the evening.
2) Wind direction during most of the day ranged between 120o and 240o, with a median
value of 173o. This is a wind direction of nearly due south (slightly to the east), which
is broadly consistent with the warm and generally clear weather conditions shown in
Figure 4.7.2.1A.

Orefinders Resources Inc. Closure Plan
STORY ENVIRONMENTAL INC. Page 45 of 86
Figure 4.7.2.1: Plots of Mirado weather station data for 28 June 2014. In A – Upper Panel are Air Temperature (“Air T”), Relative Humidity (“Air RH”) and Solar Radiation (“Solar Rad.”). In B – Lower Panel are Wind Speed and Wind Direction. Source: “Orefinders_Weather_Station_Workbook_ACS_30_July_2014.xls” , Pivot Table_30_July_ACS
4.8 Geochemical Studies
Stockpile Samples
Metallurgical Testing
01002003004005006007008009001000
0102030405060708090
100
28
/06
/20
14
0:0
0
28
/06
/20
14
6:0
0
28
/06
/20
14
12
:00
28
/06
/20
14
18
:00
29
/06
/20
14
0:0
0
Sola
r R
adia
tio
n (
W/m
2 )
Air
T (
oC
) an
d R
el.
Hu
mid
ity
(%)
Air T
Air RH
Solar Rad.
A
0
40
80
120
160
200
240
280
320
360
0
0.2
0.4
0.6
0.8
1
1.2
1.4
1.6
1.8
28
/06
/20
14
0:0
0
28
/06
/20
14
6:0
0
28
/06
/20
14
12
:00
28
/06
/20
14
18
:00
29
/06
/20
14
0:0
0
Win
d D
ire
ctio
n (
ofr
om
Tru
e N
)
Ave
rage
Win
dsp
ee
d (
m/s
)
Wind Speed
WindDirection
B

Orefinders Resources Inc. Closure Plan
STORY ENVIRONMENTAL INC. Page 46 of 86
Orefinders provided eight pails of samples to SGS Canada Inc. (“SGS”) for metallurgical
testwork. They contained four stockpile samples, two pails of each sample, from the Mirado
Phase 1 Project. Each sample was crushed to minus 6 mesh and 10 kg was removed for Bond
work index determination. The remainder was crushed to minus 10 mesh for metallurgical
testwork. The minus 10 mesh material was rotary split into 1 kg test charges. One test charge
was submitted for gold assay by pulp and metallics. The entire kilogram was pulverized until
less than 30 grams of plus 150 mesh material remained. The entire plus 150 mesh fraction was
assayed for gold. Two separate 30 gram samples were riffled from the minus 150 mesh fraction
and assayed for gold. The gold content was calculated from these results and is shown in
Table 4.8.1. Because the gold grade was lower than expected for some samples, the pulp and
metallics assay was repeated on two additional 1 kg Sample A test charges.
Table 4.8.1 Gold Assay by Pulp and Metallics from Stockpile Samples (SGS, 2014)
Additional analyses, including a whole rock analysis, were conducted on the four samples on a
separate head sample which was riffled from a test charge. These analyses are given in
Table 4.8.2. In addition, a composite was prepared by mixing 1 kg of each of the four samples
and labeled Comp ABCD. A head sample was riffled out and submitted for a multi-element
Inductively Coupled Plasma (“ICP”) scan and specific gravity determination. The results are
shown in Table 4.8.3.

Orefinders Resources Inc. Closure Plan
STORY ENVIRONMENTAL INC. Page 47 of 86
Table 4.8.2 Head Analysis of Individual Samples from Stockpiles (SGS, 2014)

Orefinders Resources Inc. Closure Plan
STORY ENVIRONMENTAL INC. Page 48 of 86
Table 4.8.3 ICP Scan and Specific Gravity of Comp ABCD (SGS, 2014)
Bond Ball Mill Grindability Testwork
A standard Bond Ball Mill Grindability Test was performed on the four individual samples using
a 100 mesh closing screen. The results are summarized in Table 4.8.4 and compared to the
SGS database in Figure 4.8.1. Samples B and D fell in the medium range of hardness whereas
Samples A and C fell in the hard range of hardness.
Table 4.8.4 Bond Ball Mill Grindability Test Results from Stockpiles (SGS, 2014)

Orefinders Resources Inc. Closure Plan
STORY ENVIRONMENTAL INC. Page 49 of 86
Figure 4.8.1 Bond Ball Mill Work Index Database (SGS, 2014)
Cyanidation Testwork
Tests were conducted on the four samples to investigate the recovery of gold by carbon-in-
leach cyanidation. The ground samples were preaerated at 50% solids for 6 hours maintaining
pH 11-11.5. Then carbon and cyanide were added and the samples were leached for 24 hours.
The cyanide addition was 1 g/L sodium cyanide (“NaCN”). This concentration was maintained
once after 2 hours then allowed to drop. A second test was conducted on Sample B at a finer
grind because the gold recovery in the first test was less than 90%. The results are presented in
Table 4.8.5.
Table 4.8.5 Cyanidation Test Results from Stockpiles (SGS, 2014)

Orefinders Resources Inc. Closure Plan
STORY ENVIRONMENTAL INC. Page 50 of 86
The recovery of gold ranged from 91.2% to 94.4% under these conditions and averaged 92.9%
(excluding test CN-2 which was conducted at the coarser grind). Reagent consumptions were
moderate at 0.3-0.4 kilograms/tonne (“kg/t”) NaCN and approximately 0.7 kg/t CaO.
Environmental Testwork
A composite of leach residues was prepared for preliminary environmental characterisation.
Equal weights of the wet residues from tests CN-1, CN-5, CN-3 and CN-4, representing the four
samples, were combined and submitted for modified acid base accounting (“ABA”) and a shake
flask extraction test.
Modified Acid Base Accounting
The modified ABA test provided quantification of the total sulphur, sulphide sulphur, and
sulphate concentrations present and the acid potential (“AP”) related to the oxidation of the
sulphide sulphur concentration. The test method determined the neutralizing potential (“NP”) of
the samples by initiating a reaction with excess acid and then identified the quantity of acid
neutralised by the samples NP by back-titrating to pH 8.3 with sodium hydroxide (“NaOH”). The
balance between the AP and NP assists in defining the potential of the sample to generate acid
drainage. The results are shown in Table 4.8.6.
The modified ABA test results for the combined residues reported an alkaline paste pH of 8.4
and a fizz rate of 3 suggesting appreciable alkalinity and the presence of available reactive
carbonate minerals. Determination of the NP resulted in a value of 48.0 t CaCO3/1000 t, while
the calculated carbonate NP (“CO3 NP”) indicated that 82% of the total NP was due to fast-
acting carbonate minerals. However, the combined residue had a significant sulphide
concentration (1.77%) and the NP available would be insufficient to neutralize the AP, as
indicated by the negative Net NP value and a NP/AP ratio less than 1. Because of this, the
combined residue is classified as potentially acid generating (“PAG”).

Orefinders Resources Inc. Closure Plan
STORY ENVIRONMENTAL INC. Page 51 of 86
Table 4.8.6 Modified Acid Base Accounting Results from Stockpiles (SGS, 2014)
Shake Flask Extraction Test
The shake flask extraction (“SFE”) test was used to evaluate the mobility of contaminants from
the combined residue solids under the pH conditions imposed by the waste material itself and
under the constraints imposed by contaminant solubility limitations. De-ionized (“DI”) water
leachant was added to the samples at a 3:1 liquid to solid ratio. The sample was rotated end
over end at 29 ± 2 rpm for a period of 24 hours prior to being filtered through a 0.45 μm
cellulose acetate membrane filter. The resultant filtrate solution was analysed for pH,
conductivity, alkalinity, acidity, anions and dissolved metals analyses. The results are shown in
Table 4.8.7 along with the Schedule 4 limits of the Metal Mining Effluent Regulations (“MMER”).
The pH of the leachate was 8.38. All analyses of regulated elements were well below the MMER
limit.

Orefinders Resources Inc. Closure Plan
STORY ENVIRONMENTAL INC. Page 52 of 86
Table 4.8.7 Shake Flask Extraction Test Results for Stockpiles (SGS, 2014)

Orefinders Resources Inc. Closure Plan
STORY ENVIRONMENTAL INC. Page 53 of 86
Historical Tailings Samples
Orefinders also conducted Acid Rock Drainage and Metal Leaching Tests on three tailings
samples collected during the installation of the monitoring wells in the historic tailings, at site
MWT1. It is to be noted that the historical tailings are not located on the two claims that are part
of the Phase 1 work, but they have been included in this Closure Plan for the sake of
completeness. One sample was collected from the unsaturated zone (i.e., above the water
table) (MWT1-1) and the other two were collected from the saturated zone (i.e., below the water
table) (MWT1-2A and MWT1-2B). The following test work was completed on each sample:
whole-rock major elemental analysis, Inductively Coupled Plasma Optical Emission
Spectrometry/Mass Spectroscopy (“ICP-OES/MS”) strong acid digest elemental analyses,
distilled water extraction, modified ABA, and Net Acid Generation (“NAG”) testing. Results of
this test work are described below and presented in Figures 4.8.2 and 4.8.3 in Appendix A and
Tables 4.8.8 to 4.8.14 in Appendix B.
Whole-rock elemental analysis showed high percentages of silicon in the samples, ranging from
25.7 – 27.5 weight percent (“wt%”) (Table 4.8.8, Appendix B). Elements ranging from 1-10 wt%
of the sample include aluminum, iron, magnesium, and calcium. Sodium, potassium, titanium,
phosphorus, manganese, and chromium were all less than 1 wt%. Loss on ignition (“LOI”)
results ranged from 6.08 – 8.25 wt%.
The ICP-OES/MS trace metal scan was performed to provide quantitative analyses of the trace
metallic components of the samples. These results can be used to identify if any metals are
present at potential environmentally significant concentrations. Results can be seen in Table
4.8.9 and 4.8.10, Appendix B. Metals present at concentrations greater than 0.1 wt% in the
samples include: aluminum (5.5 – 6.2 wt%), calcium (2.1 – 2.4 wt%), iron (4.8 – 6.5 wt%),
potassium (1.9 - 2 wt%), sodium (0.42 – 0.62 wt%), and zinc (0.39 – 0.68 wt%). However, the
soluble portions of the above mentioned metals are all quite low, ranging from 9.2x10⁻⁷ wt% for
iron to 7.01 wt% for calcium, see percent of soluble constituents in Table 4.8.11, Appendix B.
Results from the distilled water extraction are presented in Table 4.8.12, Appendix B alongside
the MMER daily concentration limits for comparative purposes. Only zinc, 1.24 mg/L, in the
unsaturated sample (MWT1-1) was outside the specified MMER daily concentration limit of

Orefinders Resources Inc. Closure Plan
STORY ENVIRONMENTAL INC. Page 54 of 86
1.0 mg/L. All other analyses in the distilled water extracts from the tailings samples were within
the MMER limits.
The results from the modified ABA test indicate there is a low potential for acid generation,
Table 4.8.13, Appendix B. All samples produced a positive Net Neutralization Potential (ranging
from 80 - 111 t CaCO3 /1000 t), indicating that there is more Neutralizing Potential present than
Acid Potential. Net Potential Ratio (“NPR”) measures the proportion of NP to AP in a sample.
The unsaturated sample had an NPR of 2.1, showing that it has a low potential for acid
generation (Figure 4.8.2, Appendix A). The saturated samples had NPRs of 1.23 and 1.6,
showing that these samples possibly have the potential for acid generation. All pH readings for
samples were well above 7, ranging from 7.49 – 7.86, showing that no samples are currently
acidic.
NAG tests were conducted to determine the balance between the acid consuming and acid
generating components of the samples. The samples are forced to completely oxidize and react
during the analysis, to show what can occur over time. After oxidation for two of the three
samples the results indicated 0 kilograms of sulfuric acid per tonne (“kg H2SO4 / t”), Table
4.8.14, Appendix B. However, one of the saturated samples produced a NAG result of 0.3 kg
H2SO4 / t. This sample (MWT1-2B) also produced the lowest final pH (6.58). Figure 4.8.3,
Appendix A, compares the Net Neutralizing Potential (“NNP”) from the ABA test to the final pH
of the NAG test, and illustrates that the three samples are neutral (as they have a positive NNP
and pHs are above 4).
4.9 Previous Site Activities
Mirado Project
1920s - Exploration for gold in the vicinity of the Mirado project commenced. At that time the
property was known as the Cathroy Larder property.
1937 to 1943. - Yama Gold Mines Limited (“Yama”) held the property. After an initial surface
drilling program, Yama sank a three-compartment vertical shaft to a depth of 550 feet
(168 m) and established four levels approximately 125 feet (38 m) apart, including levels
at the 125, 250, 375 and 500 feet horizons (38, 76, 114, and 128 m). For a 15-month
period between late 1941 and 1943, the company operated a small 50 to 75 tons per

Orefinders Resources Inc. Closure Plan
STORY ENVIRONMENTAL INC. Page 55 of 86
day mill with mill feed coming from narrow shrinkage stopes near the shaft on or above
the 250 foot (76 m) level in an area now known as the North zone. Yama recovered
3,227 ounces of gold and 946 ounces of silver from 22,250 tons of mineralized rock. The
average grade of the material was 0.145 ounces per ton gold.
1943 - World War II severely curtailed production with the rationing of steel and explosives.
Cathroy Larder Mines Ltd. (“Cathroy Larder”) took over Yama and concentrated their
exploration efforts on an area southwest of the shaft, where a second gold bearing zone
was outlined by diamond drilling in 1945 in an area now known as the South zone.
1943 to 1948 - No gold production was reported by Cathroy Larder.
1948 - All work was suspended by Cathroy Larder in August when the full effects of the Bretton
Woods Agreement, which fixed gold at US$35 per ounce, and rising production costs
made gold mining uneconomic. The property remained in the hands of Cathroy Larder
until 1960.
1959 - A year earlier, K. Carmichael of Kirkland Lake staked ground in the immediate vicinity of
the Cathroy Larder tenements and optioned the property to Kordol Exploration Limited in
1960.
1960 to 1963 - Kordol completed trenching and surface sampling and reported gold values of
up to 1.01 ounces per ton gold from Claim 3004539. On December 12, 1960, Mirado
Nickel Mines (“Mirado”) optioned the property from Cathroy Larder and proceeded to
rehabilitate the underground workings. The underground workings were dewatered and
re-mapped. Segsworth (1964) completed an in house historic reserve estimate of
435,000 tons grading 0.23 ounces of gold per tonne. SRK Consulting Inc. (“SRK”) has
cautioned that this estimate is historical and cannot be verified and as such should not
be relied upon.
1963 - During a brief period of time, Broulan Reef Mines optioned the property from Mirado
Nickel Mines and then subsequently returned the property after receiving negative
results from their drilling work.
1963 to 1980 - The property remained idle.
1980 to 1983 - Amax Minerals Exploration (“Amax”) compiled an extensive amount of data from
the previous drill programs into a single set of level plans and sections. Detailed
mapping and prospecting was performed during the summer of 1980, and three phases
of diamond drilling were completed on the property. During the summer of 1981,
stripping and rock saw channel sampling was conducted in the vicinity of the South

Orefinders Resources Inc. Closure Plan
STORY ENVIRONMENTAL INC. Page 56 of 86
zone; this work was completed by the end of September. Amax returned the property to
Mirado in 1983.
1985 to 1987 - Golden Shield Resources Ltd. (“Golden Shield”) entered into an option
agreement with Mirado and Royado Mines Ltd. in which Golden Shield could acquire a
100 percent interest in Mirado's Cathroy Larder gold property. In January 1986, Golden
Shield contracted Dynatec Mining Ltd. (“Dynatec”) from North Bay, Ontario to rehabilitate
and expand infrastructure in and around the Mirado mine. During this same period,
detailed underground mapping and sampling programs were completed on all four
levels. An economic study of three alternative metallurgical processes was undertaken
and environmental base line studies were completed for the surrounding fish and wildlife
habitat and watersheds. A base line water sampling program was also completed. All of
this work was conducted by Environmental Applications Group Limited in 1986. A
technical and financial evaluation report for the Mirado Gold Mine project was prepared
by representatives of Golden Shield and several outside consulting firms including
Dynatec, Bryan Wilson and Associates, E. H. Associates, Environmental Applications
Group Limited, and Markham Data Inc. The report included detailed plans for a
proposed open pit to be developed during the winter of 1987. The pit was designed to
provide access to the underground workings on the 125 foot level. In early 1987,
Dynatec stripped the South zone in an area where the D Zone was drilled near surface.
Preliminary calculations indicated that an overall stripping ratio of 3:1 was economic, and
that pit faces could be safely excavated to a 70 degree angle. Approximately 82,000
cubic yards of overburden was removed as part of the exploration sampling program
(Golden Shield, 1987). A custom milling agreement was reached in 1986 with the owner
of the McBean Mill (Queenston/Inco) for milling mineralized material at a rate of 600 tons
per day. No records from the 1987 mine production or milling are available.
1987 - Later that year, Golden Shield became a victim to the stock market crash of 1987. The
property was subsequently returned to Mirado.
2010 - Mirado merged with two other junior mining companies to become Micon Gold Inc.
(“Micon”).
2012 - Micon signed the agreement with Fechi.
Mirado Project – formerly MZ property
1990 to 2012 - The former MZ property experienced further exploration work.

Orefinders Resources Inc. Closure Plan
STORY ENVIRONMENTAL INC. Page 57 of 86
2000 to 2002 - Messrs. Metherall and Zabudsky conducted surface sampling, mechanized
trenching, and drilling with a portable X-ray drill on Claims L-1146327 and L-1196951. In
2002 the MZ claims were optioned to 1179785 Ontario Inc.
2003 – The option agreement was amended in January 2003. Subsequently, the agreement
was transferred to Hawk Precious Metals Inc. (“Hawk”) in 2003. Results from their drill
program were discouraging and Hawk dropped the option and returned the property to
the vendors.
2009 to 2010 - White Pine Resources Inc. (“White Pine”) optioned the MZ property.
A summary of all known historic drilling on the Mirado property is presented in Table 4.9.1.
Table 4.9.1 Historic drilling on the Mirado property
Orefinders Exploration
2012 to 2013 - Orefinders conducted basic survey and reconnaissance work on the Mirado
Project site including the identification of old mine survey control points and drill collars.
Orefinders also completed a total of 67.8 km of line cutting. Lines were cut at a bearing
of 38 degrees, and replicating historical grids. In the spring of 2012, Orefinders engaged
Canadian Exploration Services Ltd. (“CXS”) of Larder Lake, Ontario to carry out an
induced polarization survey of the Mirado property. The survey consisted of 14.5 km of
dipole-dipole survey and 6 km of deep induced polarization survey. CanEx collected

Orefinders Resources Inc. Closure Plan
STORY ENVIRONMENTAL INC. Page 58 of 86
resistivity and chargeability data. In 2013, Orefinders focused on the consolidation and
compilation of historical exploration and assay data and the completion of a 12,060 m
core drilling program.
The historic mine features present on the Mirado Phase 1 Project area include the three
stockpiles, the overburden stockpile and the South Pit. These are detailed on Table 4.9.2.
Table 4.9.2 Existing Mine Features in the Mirado Phase 1 Project Area
Feature UTM
Northing
UTM
Easting Field Observations on Feature
North
Stockpile
5318400 587200 Currently in a level, flat state. the stockpile has a
maximum height of 3m in the SW edge. The
stockpile tapers off to ground level toward the
North.
angle of repose is approximately 30 degrees
South
Stockpile
5317900 587000 Currently a leveled rock pile with an area to the
south that may have been used as a borrow pit at
some point. It varies in height from 4-6 m and has
an average angle of repose between 20-25
degrees.
Central
Stockpile
5318200 587100 Remains as an irregular surface that has never
been leveled and is a conglomerate of individual
loads 1-2 m in height. Boulder size is highly
irregular: from gravel size to car sized.
Overburden
Stockpile
5318200 586900 Overburden pile from Mirado Pit excavation. Was
approximately 82,000 cu.yds, removed but has
since been used as a borrow pit. Now grown over
with pants and trees. Will be used as a source of
topsoil for site reclamation at closure.
South Pit 5318200 587250 Should we even include this?

Orefinders Resources Inc. Closure Plan
STORY ENVIRONMENTAL INC. Page 59 of 86
Underground Workings
The historic workings associated with the Mirado Project were developed primarily by Yama in
the early 1940s and include the shaft and four levels detailed earlier in this section. There is a
section of the 250’ level underground workings which underlie the Mirado Phase 1 Project area
at the South Pit, as shown on Figure 4.9.1, Appendix A.
4.9.1 Soils and Sediment Contamination Assessment
Sediment samples have been collected from the Misema River, Mousseau Creek, and the
South Pit on site in October 2013 to determine previous contamination of these water bodies.
All samples were coordinated with the benthic invertebrate sampling. Sampling sites can be
seen in Figure 4.6.2.1, Appendix A. Sediment samples were collected the top 10 centimetres of
the substrate using an Ekman Grab Sampler. Each sample was:
1. transferred directly from the Ekman Grab Sampler to the laboratory supplied jars
and the jars were sealed;
2. placed in a cooler with ice and stored on ice for delivery to the laboratory; and
3. shipped overnight to Maxxam Analytics Inc., Mississauga, Ontario.
Analytical results have been assessed according to the Guidelines for the Protection and
Management of Aquatic Sediment Quality in Ontario (“Sediment Guidelines”). These Sediment
Guidelines establish two levels of effect – Lowest Effect Level (“LEL”) and Severe Effect Level
(“SEL”).
Table 4.9.1.1 (Appendix B) shows the sediment results alongside the Sediment Guidelines.
Total organic carbon, chromium, copper, and nickel were present at concentrations that
exceeded the Provincial Sediment Quality Objective’s lowest effect level at some of the sites.
These exceedances were found both upstream and downstream of the Mirado property.
Chromium, copper, and nickel concentrations are illustrated in Figure 4.9.1.2, Appendix A.
Similar spatial trends were seen for all three parameters. Concentrations of chromium, copper,
and nickel in Mousseau Creek increased throughout the creek. Concentrations of all three
parameters exceeded their respective LELs in the South Pit. At one of the three downstream
sites in the Misema River the concentrations of the three parameters exceeded their respective
LELs, at the other two sites, concentrations were below the LELs. However the concentrations
of this downstream site which shows exceedances are similar to the elevated concentrations in
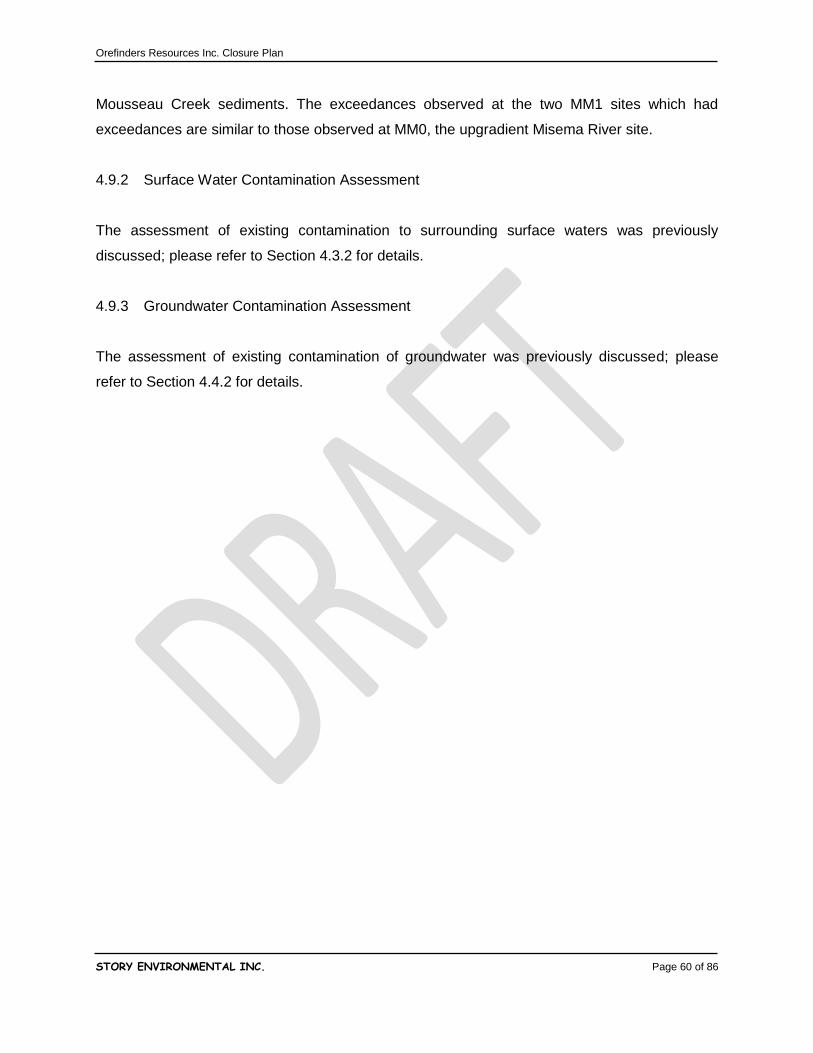
Orefinders Resources Inc. Closure Plan
STORY ENVIRONMENTAL INC. Page 60 of 86
Mousseau Creek sediments. The exceedances observed at the two MM1 sites which had
exceedances are similar to those observed at MM0, the upgradient Misema River site.
4.9.2 Surface Water Contamination Assessment
The assessment of existing contamination to surrounding surface waters was previously
discussed; please refer to Section 4.3.2 for details.
4.9.3 Groundwater Contamination Assessment
The assessment of existing contamination of groundwater was previously discussed; please
refer to Section 4.4.2 for details.

Orefinders Resources Inc. Closure Plan
STORY ENVIRONMENTAL INC. Page 61 of 86
5 Project Description
5.1 Project Summary
The Mirado Phase 1 Project will involve the removal of stockpiled ore from the Mirado Project
site. In order to accomplish this, the ore will be crushed on-site and loaded into haul trucks. The
ore will then be hauled off-site for processing. The removal of ore is anticipated to take up to ten
weeks. As of August 2014, upgrading of the access road has been completed by Georgia
Pacific. The removal of stockpiled ore will commence in early October 2014.
Baseline studies of the local environment have been conducted since October 2013. The
studies are ongoing and the results thus far have been included in this document.
Orefinders proposes the timeline, as presented below in Figure 5.1.1, for the Mirado Phase 1
Project.
Figure 5.1.1 Mirado Phase 1 Project Timeline

Orefinders Resources Inc. Closure Plan
STORY ENVIRONMENTAL INC. Page 62 of 86
5.2 Mineralogy
5.2.1 Regional Geology
The Mirado Project is located in the central Abitibi Greenstone Belt. The belt has an east-west
dimension of approximately 700 km and a north-south dimension of approximately 300 km at its
widest (e.g., Goodwin and Ridler, 1970; Mueller et al., 2002). To the north, the Abitibi
Greenstone Belt is bordered by the Quetico Gneiss Belt, to the southeast it is truncated by the
Grenville front, and to the west by the Kapuskasing structural zone. The Abitibi Greenstone Belt
is interpreted to have formed as accretionary arc complex, involving a north-directed subduction
zone, arc rifting, and the generation of large amounts of komatiitic and tholeiitic to calc-alkaline
magmas. The volcanic and sedimentary rocks were intruded by syntectonic tonalite-
trondhjemite-granodiorite plutons (e.g., Bellefleur et al., 1998; Ayer et al., 2002; Wyman et al.,
2002). Structural observations of major fault systems support the interpretation that the
convergence of the building blocks of the greenstone belt was oblique (Daigneault and
Archambault, 1990; Hocq, 1990). Dimroth et al. (1982) subdivided the Abitibi Greenstone Belt
into southern and northern zones, based on differences in sedimentary and volcanic lithologies
and metamorphic grade. Shallow marine terrigenous sediments and plutonic pebbles in
conglomerates are only known in the northern zone. Only the southern zone has a
conglomerate apron along its southern contact, whereas the northern zone is characterized by
intrusive contacts. Volcanologically, the main difference between the two zones is the near
absence of ultramafic rock in the north compared with voluminous ultramafic flows at the bases
of volcanic cycles in the southern zone (Jensen, 1978a; Allard et al., 1979; Dimroth et al., 1982).
The Mirado project is located in the southern volcanic zone. Large crustal scale east-west
structural zones occur throughout the Abitibi Greenstone Belt that. One of them, the Larder-
Lake-Cadillac Break is located immediately to the north of the Mirado project. Numerous gold
deposits are located along this structure including the Kerr-Addison and the Kirkland Lake
mines.
5.2.2 Local Geology
The geology of the Mirado Project consists of two principal rock assemblages; the Skead and
the McElroy assemblages, both with a general age of 2,750 to 2,700 million years (“Ma”). The
assemblages are interpreted to be conformable to each other, and both are folded around the

Orefinders Resources Inc. Closure Plan
STORY ENVIRONMENTAL INC. Page 63 of 86
Round Lake batholith located on the west side of Catharine Township. The Skead assemblage
consists of a variety of mafic to felsic pyroclastic flows and fragmental units with minor interflow
sediments. The pyroclastic units consist of monolithic to heterolithic lapilli tuff and coarse
fragmental units. Minor wacke and conglomerate occur throughout. The stratigraphy faces to
the north. In the project area, the units strike at 290 degrees and dip from 70 to 85 degrees to
the north. The hanging wall contact of the Skead assemblage is marked by an iron formation
horizon.
The overlying McElroy assemblage comprises mainly massive mafic metavolcanic rock,
subordinate felsic metavolcanic rock, and very minor komatiite. A host of late dykes crosscut the
Skead and McElroy assemblages and are described variably as syenite, syenite porphyry,
feldspar porphyry, gabbro, diorite, and lamprophyre. No significant regional structures have
been documented in the McElroy or Catharine townships. However, Abraham (1951) notes that
there are transverse faults in the south-eastern part of McElroy Township that strike 025
degrees with horizontal displacements of over 300 m.
Outcrop on the Mirado property is scarce and is mostly restricted to the area around the
historical open pit. Other areas of the property are mostly covered by thin glacial overburden.
The geology is mostly known through government mapping, drilling, underground mining,
trenching, and interpretation of geophysical data. Unpublished geological maps were produced
in the 1960s by Baker (1962, 1964), Bourne (1985) and various other reports from the 1980s by
Amax and Golden Shield. Orefinders has relied heavily on maps by Golden Shield.
The northeastern part of the property is underlain by the McElroy assemblage, which does not
host known gold mineralization. The Skead assemblage underlies the majority of the property,
while the southernmost part is underlain by the Catherine assemblage. According to Bourne
(1985), the Mirado property lies on the north limb of a major antiformal structure. Rock types in
the mine area are largely fragmental volcanic rock and rhyolite cut by small syenite porphyry,
diorite, and lamprophyre dykes. South of the open pit, a volcanic breccia with large mafic clasts
and isolated sulphide stringers is exposed. Mafic dykes strike mainly northwest to north and are
crosscut by an east-striking porphyry dyke. Sulphide stringers and veins are crosscut by barren
mafic and feldspar porphyry dykes. Dykes exhibit no internal fabric and crosscut the cleavage
and foliation fabrics in the surrounding tuff, indicating that they are younger than the regional
foliation. A striking feature of the Main zone in the surrounds of the open pit is a west-northwest

Orefinders Resources Inc. Closure Plan
STORY ENVIRONMENTAL INC. Page 64 of 86
striking shear zone that separates massive tuff in the south from tuff with a penetrative planar
fabric in the north. North of this zone, specifically on the north shore of the open pit,
agglomerate and lapilli tuff show foliation formed by elongated clasts. The shear zone itself is
characterized by tightly spaced cleavage, locally with an oblique mineral lineation. From the
Main zone open pit to the North Zone the felsic tuff generally exhibits west-northwest striking
cleavage of varying intensity. The shear zone dips approximately 80 degrees to the north-
northeast. In the Main zone, the gold mineralization is constrained to the north by this east-
northeast striking shear zone. A north-northeast-striking fault observed in core delimits the main
auriferous zone to the east. This fault is characterized by slickensides with chlorite, and broken
core and may correlate with a northeast-striking fault with subhorizontal lineation and sinistral
sense-of-shear documented on the south side of the open pit. The gold mineralization in the
west, south, and at depth does not seem to be constrained by major structures. In the south and
at depth, gold grades decrease at the contact to the rhyolite; however, the rhyolite is not barren.
The geometry of the rhyolite contact is irregular. Within the Main zone sulphide stringers occur
at varying orientations. Northwest of the open pit sulphide stringers strike mainly west-
northwest. Pyrite stringers in the massive rock south of the shear zone strike dominantly north
to north-northwest and northeast at a high angle to the shear zone. Sulphide stringers in
oriented core strike mainly west-northwest, north, and east. However, core orientation is erratic
and these measurements should be treated with caution. Quartz veins up to several centimetres
thick occur throughout the Mirado project area. At surface, veins strike mainly northeast and dip
southeast at varying angles. Quartz veins crosscut rock fabrics, brittle faults, and sulphide
stringers. These veins likely represent the youngest structures observed in the Mirado Project
area. Orefinders has not tested these veins individually for gold, but timing relationships and the
occurrence of gold associated with sulphide mineralization suggest that these late stage quartz
veins are barren.
5.2.3 Mineralization
Gold mineralization at the Mirado Project occurs in the Main zone (also referred to as the South
zone is some historical reports) and the North zone. The shaft is located in the North zone, but
almost all exploration work since the 1960s has been focused on the Main zone. Gold
mineralization in the Main zone commonly occurs in highly silicified fragmental rock with varying
amounts of pyrite and subordinate chalcopyrite and sphalerite. Sulphide mineralization occurs
as stringers, blebs and disseminations. The distribution of gold is highly variable and

Orefinders Resources Inc. Closure Plan
STORY ENVIRONMENTAL INC. Page 65 of 86
inconsistent. Past attempts to outline continuous gold subzones have been unsuccessful. Some
gold occurs at and near the contact with a rhyolite which, based on information from core
logging, forms an irregular body on the south side and below the Main zone. In the North zone,
gold mineralization is associated with a series of sulphide, quartz, and quartz carbonate veinlets
parallel to the shear zone foliation. The strike continuity of the veins is good. Bourne (1985)
reports that the North zone system was mined in five parallel stopes for about 500 feet along
strike on the 250 foot level and the system can be traced for about 1,000 feet along strike. The
North zone extends to the 500 foot level and is open at depth.
5.2.4 Metallurgy
Historic Metallurgical Studies
In early 1986, Golden Shield commissioned metallurgical test work. Settling and filtration tests
were conducted by Bill Stone of EIMCO, based in Salt Lake City, Utah, and test slurries were
prepared by Lakefield Research in Lakefield, Ontario. Tests were performed to assess the
effects of flotation methods and variations on cyanidation procedures on gold extraction.
Additionally, amalgamation and grindability testwork, mineralogical studies and Bond Work
Index grindability tests were completed (Hayden, 1986).
Initial metallurgical studies were performed on one representative composite sample from the
Mirado project. The sample consisted of 350 kilograms comprising 129 individual core intervals.
SRK was not able to determine the origin of the samples within the Mirado deposit. In a second
stage of testing, representative core samples from the North and Main zones were used. The
test work included amalgamation tests, flotation tests, cyanidation tests, settling and filtration
tests, and grindability tests. The following conclusion is taken from Hayden, 1986, p. 21.
“The composite sample as received contains fine gold particles. The sulphide
minerals identified do not interfere with the metallurgical processing. The optimum
grind to liberate the gold particles from the matrix is 95 percent minus 200 mesh.
The grinding power required is 13.8 kilowatt hour/tonne. 33.8 percent of the gold is
free of this grind. Both flotation and cyanidation processes were conducted in this
investigation. Selective flotation showed that a copper concentrate could recover
66.5 percent of the gold and 76.8 percent of the copper at a concentration grade of
1066 grams gold per tonne and 4.92 percent copper. The copper grade in the
concentrate was unacceptable to copper smelters. Bulk flotation recovered 95

Orefinders Resources Inc. Closure Plan
STORY ENVIRONMENTAL INC. Page 66 of 86
percent of the gold in a rougher concentrate at a grade of 50 grams of gold per
tonne. The concentrate could be upgraded to 100 grams gold per tonne in two
cleaning stages at a recover of 92 to 93 percent. The gold extraction from the
flotation rougher concentrate was 93 percent, for an overall gold recover of 89
percent. Direct cyanidation extracted more than 95 percent of the gold in 24 hours
with 0.5 grams per litre NaCN at pH 11. The cyanide strength, pulp density and
aeration did not affect the gold extraction efficiency. Reagent requirements
depended upon the pH and aeration. More cyanide was consumed at the lower pH
and without aeration. In general, 0.4 kilograms NaCN per tonne and 0.3 kilograms
CaO per tonne was sufficient for 95 percent gold extractions. For environments
considerations, the cyanidation residue contained high sulphide, making it a
potential acid producer. Cyanide destruction of the barren solution resulted in a
decrease from 527 milligram NaCN per litre to 0.16 milligram NaCN per litre with the
SO2-air process. Due to iron complex cyanide, the chlorination process could not
decrease the cyanide to acceptable levels.”
Recent metallurgical test work has previously been described in section 4.8.
5.3 Mining Activities
Not applicable.
5.4 Processing
Not applicable.
5.5 Buildings and Infrastructure
Not applicable.
5.6 Tailings
Not applicable.

Orefinders Resources Inc. Closure Plan
STORY ENVIRONMENTAL INC. Page 67 of 86
5.7 Materials Handling
The ore is to be removed by four to five 30 ton haul trucks at a rate of about 400 tonnes per day
(“tpd”). It is estimated that the haulage of the stock piles totaling approximately 20 000 tonnes of
ore, will require up to 10 weeks. Hauling will occur during daylight hours for a 12 hour shift each
day, 7 days per week.
Crushing and screening equipment to operate at a rate of 400 tpd. The crushing and screening
work will be contracted out to a local contractor with equipment which has an Air and Noise
Environmental Compliance Approval.
The major operational phase is the removal and haulage of two stockpiles of ore, the Central
Stockpile and the North Stockpile (see Site Plan in Figure 3.3.1, Appendix A). The South
Stockpile will not be removed as it is not economical to haul and process this stockpile.
The removal and haulage of stockpiled ore will require truck drivers as well as loader operators
and will provide work for up to 7 people working 12 hour daily shifts for a period of
approximately 10 weeks.
There will be no chemical processing of materials on-site. Metallurgical and environmental test
work on the stockpile samples and historic tailings from the larger Mirado Project site detailed in
section 4.8 indicate that acid mine drainage will not be an issue with either the ore leaving the
site or any piles remaining on site.
5.8 Waste Management and Treatment
Only domestic waste will be generated. This waste will be taken off-site to a licenced facility for
disposal.
5.9 Water Management and Treatment
No dams, dikes, or diversions other than storm water management diversion ditches, may be
required for the Mirado Phase 1 Project. Storm water will be diverted away from water bodies
and sediment control measures will be utilized as required.

Orefinders Resources Inc. Closure Plan
STORY ENVIRONMENTAL INC. Page 68 of 86
5.10 Chemical and Fuel Storage
Portable fuelling stations will be used for diesel generators and loaders on site. These will be
located away from traffic in a designated area and safety precautions including having a fuelling
procedure and spill kit nearby will be implemented.
5.11 Project Schedule
The proposed development schedule is to remove the stockpiled ore and process it off-site
following the filing of this Mirado Phase 1 Project Closure Plan. Orefinders hope to transport the
ore off-site for processing by the beginning of October.

Orefinders Resources Inc. Closure Plan
STORY ENVIRONMENTAL INC. Page 69 of 86
6 Progressive Rehabilitation
According to Section 139.(1) Part VII, Rehabilitation of Mining Lands, Mining Act, R.S.O. 1990,
Chapter M.14, “progressive rehabilitation” is defined as: rehabilitation done continually and
sequentially during the entire period that a project or mine hazard exists.
Progressive rehabilitation of mine hazards on the Mirado Phase 1 Project site, as outlined in
Table 4.9.2, by recontouring or burial has not yet been implemented because these piles will be
removed for processing or used for future construction activities.

Orefinders Resources Inc. Closure Plan
STORY ENVIRONMENTAL INC. Page 70 of 86
7 Rehabilitation Measures – Temporary Suspension
According to Section 139.(1) Part VII, Rehabilitation of Mining Lands, Mining Act, R.S.O. 1990,
Chapter M.14, “temporary suspension” is defined as: the planned or unplanned suspension of a
project in accordance with a filed closure plan where protective measures are in place and the
site is being monitored continuously by the proponent.
Temporary suspension will be carried out in accordance with Section 22 of O. Reg. 240/00,
outlined below.
Orefinders will take all reasonable measures to prevent personal injury or property damage that
is reasonably foreseeable as a result of placing the project in a state of temporary suspension.
There are no buildings, or other structures, mine openings, electrical systems, or mechanical
and hydraulic systems on site, thus access will not be restricted. No explosives will be used,
thus no control or disposal is planned. The physical, chemical, and biological monitoring studies
will be continued. No contaminated effluents are anticipated, thus no control measures are
required. Any domestic waste on-site shall be disposed of off-site at a licenced facility.
Temporary fuel storage units will be removed. The ore stockpiles will be levelled as much as
possible to be maintained in a stable and safe condition. These actions will be implemented
within 30 days of notifying the Ministry of the change in project status to temporary suspension.
Prior to placing the project in a state of temporary suspension, Orefinders, will notify the Director
in the prescribed form and manner.

Orefinders Resources Inc. Closure Plan
STORY ENVIRONMENTAL INC. Page 71 of 86
8 Rehabilitation Measures – State of Inactivity
According to Section 139.(1) Part VII, Rehabilitation of Mining Lands, Mining Act, R.S.O. 1990,
Chapter M.14, “inactivity” means: the indefinite suspension of a project in accordance with a
filed closure plan where protective measures are in place but the site is not being continuously
monitored by the proponent. During a state of inactivity it is likely that the mine may return to
production and consequently it is not reasonable to proceed to full closure. Since the site is not
being continually monitored by the proponent, the measures implemented by the proponent
must ensure a higher degree of stability and security than those implemented under temporary
suspension.
Due to the nature of this Project, rehabilitation measures during a state of inactivity would be
similar to those proposed for temporary suspension.
Orefinders will take all reasonable measures to prevent personal injury or property damage that
is reasonably foreseeable as a result of placing the project in a state of inactivity. There are no
mine openings, electrical systems, or mechanical and hydraulic systems on site, thus access
will not be restricted. No contaminated effluents are anticipated thus no control measures are
required. Any domestic waste on-site shall be disposed of off-site at a licenced facility.
Temporary fuel storage units will be removed. Any remaining ore stockpiles will be monitored
and levelled as much as possible to be maintained in a stable and safe condition. All materials,
or conditions created as a result of mining that produce or may produce acid rock drainage or
metal leaching shall be dealt with in accordance with the management plan referred to in
section 59 of the Code. Orefinders shall inspect the site at least once every six months to
ensure that all required rehabilitative measures are in place. These actions will be implemented
within 30 days of notifying the Ministry of the change in project status to state of inactivity. Prior
to placing the project in a state of inactivity, Orefinders, will notify the Director in the prescribed
form and manner.

Orefinders Resources Inc. Closure Plan
STORY ENVIRONMENTAL INC. Page 72 of 86
9 Rehabilitation Measures – Closed Out
According to Section 139.(1) Part VII, Rehabilitation of Mining Lands, Mining Act, R.S.O. 1990,
Chapter M.14, “closure” means: the final stage of closure has been reached and that all the
requirements of a closure plan have been complied with as related to advanced exploration,
mining or mine production. Prior to proceeding with closure of a mining project, a notice must
be provided to the Director of the Ontario Ministry of North Development and Mines (“MNDM”)
as per Subsection 144 (1) of the Mining Act. The closure measures for the Project are outlined
below.
9.1 Shafts, Raises, and Open Stopes
Not applicable.
9.2 Adit and Decline Portals
Not applicable.
9.3 Other Mine Openings
Not applicable.
9.4 Stability of Surface and Subsurface Mine Workings
There are no surface or subsurface mine workings associated with the Mirado Phase 1 Project.
There is however a section of the historic subsurface mine workings which underlie the Mirado
Phase 1 Project Area as shown in Figure 4.9.1. These drift developments have no crown pillars,
thus there will be no crown pillar assessment done as part of close out.
9.5 Buildings and Infrastructure
Not applicable.

Orefinders Resources Inc. Closure Plan
STORY ENVIRONMENTAL INC. Page 73 of 86
9.6 Machinery, Equipment, and Storage Tanks
All equipment will be removed from site.
9.7 Transportation Corridors
The access road has been improved by Georgia Pacific for use in their logging operations.
Georgia Pacific is responsible for road maintenance. Thus access to the Mirado Phase 1 Project
site will not be closed off or revegetated as it is a travel way used by others.
9.8 Concrete Structures
Not applicable.
9.9 Petroleum Products, Chemicals, and Waste
All portable fuelling stations will be removed from site. Domestic waste will be disposed of off-
site.
9.10 Polychlorinated Biphenols (PCBs)
Not applicable.
9.11 Waste Management Sites
Not applicable.
9.12 Contaminated Soils
The only source of soil contamination anticipated from the Project activities is from petroleum
products at the portable fuelling stations. However, the contractors will be responsible for the
fuelling stations during the project and will be required to clean-up any spills. Thus rehabilitation
of contaminated sites will not be a part of closure activities.

Orefinders Resources Inc. Closure Plan
STORY ENVIRONMENTAL INC. Page 74 of 86
9.13 Tailings Areas
Not applicable.
9.14 Waste Rock Pile and Other Stockpiles
The North and Central Stockpiles will be removed from the site and any remaining rock that is
left unprocessed will be transferred to the South Stockpile. The South Stockpile is already
deemd to be stable as it has been stable for a period of almost 30 years. Any new rock added
will be left in a stable orientation. The South Stockpile will then be left as is due to its potential
role as a species at risk wildlife habitat as detailed in section 4.5.2.1. If in future development,
the South Stockpile is required for construction purposes, negotiation with Environment Canada
will be required to determine if any habitat compensation or other mitigation strategy is required
for these species.
All materials, or conditions created as a result of mining, that produce or may produce acid rock
drainage or metal leaching must be dealt with in accordance with the management plan referred
to in section 59 of the Code. As described in section 4.8 composite samples from the stockpiles
were tested for acid production and found to be potentially acid generating. However the
samples were residual samples from the cyanidation testing and therefore more representative
of the ARD of what processed rock i.e., tailings samples would be. Metal leaching was tested
on the same residual sampled using a shake flask test, none of the samples showed leaching of
elevated concentrations of metals. Although the chance of acid rock drainage is very small, run
off from the South Stockpile will be sampled on an ongoing basis to continue to assess this acid
generating potential. Monitoring will continue as outlined in section 10.2.3.
The overburden stockpile referred to in section 4.9 will be used as a source of topsoil for site
rehabilitation.
9.15 Watercourses and Drainage
The South Pit will be left as is on the site as it is not a source of contamination and does not
pose a hazard. All remaining drainage channels will be left so as not to require maintenance
and shall be consistent with the future use of the land.

Orefinders Resources Inc. Closure Plan
STORY ENVIRONMENTAL INC. Page 75 of 86
9.16 Revegetation
All disturbed sites shall be graded, covered with a layer of 0.1 m of topsoil and revegetated.
9.17 Schedule
These actions will be implemented within one year of notifying the Ministry of the change in
project status to closed out.

Orefinders Resources Inc. Closure Plan
STORY ENVIRONMENTAL INC. Page 76 of 86
10 Monitoring
10.1 Physical Monitoring Program
10.1.1 Temporary Suspension
Stockpiles will be inspected on a monthly basis during a temporary suspension and these
inspections will be recorded in a logbook.
If anything is identified, during these inspections, which appears to be unstable or unsafe, an
investigation by the appropriate personnel or qualified professional will be conducted to identify
the most suitable means of rendering the situation stable or safe and the situation will be
repaired as quickly as possible.
10.1.2 State of Inactivity
Stockpiles will be inspected on a quarterly basis during a state of inactivity and these
inspections will be recorded in a logbook.
If anything is identified, during these inspections, which appears to be unstable or unsafe, an
investigation by the appropriate personnel or qualified professional will be conducted to identify
the most suitable means of rendering the situation stable or safe and the situation will be
repaired as quickly as possible.
10.1.3 Closure
A post-closure monitoring program will be implemented to ensure reclamation and security
measures remain effective and continue to provide a high level of public and environmental
protection. The post-closure monitoring program will be compliant and carried out in accordance
with the Code.
The main objective of the post-closure monitoring program is to demonstrate that all land, water
management, and structures related to the Project are stable and safe to the public and the
environment. Inspections of the closure measures will be conducted on an annual basis for the

Orefinders Resources Inc. Closure Plan
STORY ENVIRONMENTAL INC. Page 77 of 86
first five years following closure. Subsequent to this five year period, the frequency of the
inspections will be reviewed and revised as, and if, appropriate.
Appropriate corrective measures will be implemented if indication of instability is identified.
Written inspection and monitoring reports will be submitted to the manager responsible for the
Site, outlining the findings of all inspections and monitoring programs. It will be the manager’s
responsibility to address the recommendations for follow-up or remedial work.
A written report detailing the results from the post-closure monitoring and rehabilitation program
will be submitted to the Director of the MNDM five years following closure.
10.2 Surface Water and Groundwater Monitoring Programs
10.2.1 Temporary Suspension
During a temporary suspension the baseline data collection of surface water and groundwater
samples will continue as per O. Reg. 240/00 section 22 (2) 5 as outlined in sections 4.3.2 and
4.4.2, respectively. Air monitoring activities will be ongoing as well as the hydrological data
collection as outlined in Section 4.7.1 and 4.3.1, respectively.
10.2.2 State of Inactivity
During a state of inactivity the remaining rock and overburden pile(s) on site will be monitored
according to the O. Reg. 240/00 section 23. (2) 8, twice annually. If there is sign of acid rock
drainage or metal leaching, this shall be dealt with according to the management plan referred
to in section 59 of the Code.
10.2.3 Closure
Upon closure, surface water and groundwater monitoring will continue as required by the Code
(Part 5 – Surface Water Monitoring and Part 6 – Ground Water Monitoring). It is anticipated that
monitoring of run-off from the South Stockpile will be conducted twice yearly, once at spring
melt and once during a rain event. The groundwater monitoring will also continue on a twice

Orefinders Resources Inc. Closure Plan
STORY ENVIRONMENTAL INC. Page 78 of 86
yearly basis at sites MW3-S and MW-3D, the groundwater wells down gradient of the proposed
project, as seen on Figure 4.4.1.3.1.
The South Stockpile runoff will be sampled and the water analysed for the following parameters:
field pH;
field temperature
field conductivity;
total suspended solids;
total dissolved solids;
alkalinity;
acidity;
hardness;
cyanide (free and total);
total ammonia;
sulphate;
aluminum;
arsenic;
cadmium;
calcium;
copper;
iron;
lead;
mercury;
molybdenum;
nickel; and
zinc.
The groundwater monitoring locations will be sampled and the water analysed for the following
parameters:
field pH;
field temperature
field conductivity;
total suspended solids;
alkalinity;

Orefinders Resources Inc. Closure Plan
STORY ENVIRONMENTAL INC. Page 79 of 86
acidity;
hardness;
cyanide (free and total);
total ammonia;
sulphate;
aluminum;
arsenic;
cadmium;
calcium;
copper;
iron;
lead;
mercury;
molybdenum;
nickel; and
zinc.
These monitoring programs will continue twice annually for five years following closure. At the
end of five years after closure, the surface water and groundwater monitoring programs will be
reviewed to determine the future monitoring requirements and whether the groundwater wells
can be decommissioned according the Ontario Regulation 903, Wells. A report summarizing the
conclusions of this review process will be submitted to the MNDM.
10.3 Biological Monitoring Programs
10.3.1 Temporary Suspension
A biological monitoring program will not be required during a temporary suspension.
10.3.2 State of Inactivity
A biological monitoring program will not be required during a state of inactivity.

Orefinders Resources Inc. Closure Plan
STORY ENVIRONMENTAL INC. Page 80 of 86
10.3.3 Closure
Biological monitoring of the aquatic habitat is not expected to be required at this point as there is
no effluent produced by the Project activities and acid rock drainage is not anticipated as
suggested by test work shown in section 4.8. Biological monitoring will be implemented if water
quality monitoring shows the potential for significant impact to the aquatic environment.
Biological monitoring of the terrestrial habitat is not expected to be required at this point.
Disturbance, including forestry and mining, is a common feature on the landscape, and the
animal populations are well adapted to this cycle of regeneration.
One of the main rehabilitation efforts will be revegetation. The areas which have undergone
revegetation will be inspected annually (at the end of each growing season) to establish the
effectiveness of the existing revegetation measures and whether any remedial work (restoration
work or soil amendments) is required. These inspections will continue until the vegetation has
been established. Once the vegetation is established, annual inspections will be conducted as
required by the Code (Part 9, Section 77). Once a self-sustaining cover has been established
and the objectives of Section 68 of the Code have been met, the monitoring and inspection
program will be discontinued.

Orefinders Resources Inc. Closure Plan
STORY ENVIRONMENTAL INC. Page 81 of 86
11 Expected Site Conditions
11.1 Land Use
After closure it is anticipated that the Mirado Phase 1 Project site will be restored to its pre-
Project baseline conditions and will revegetate providing wildlife habitat. The area will continue
to be used for recreational activities such as fishing and hunting.
11.2 Topography
Generally, the area will be flattened, contoured, scarified, and/or spread with topsoil and
vegetated at closure.
Local topography of existing conditions at the Mirado Phase 1 Project is shown in Figure 4.2.1,
Appendix A. The expected post-closure condition is schematically shown in Figure 11.2.1,
Appendix A.
11.3 Surface Waters
There is no anticipated impact to surface waters from the Project.
11.4 Groundwaters
There is no anticipated impact to groundwaters from the Project.
11.5 Terrestrial Plant and Animal Life
Following closure, it is expected that the site will quickly begin reverting to the Poplar and Birch
vegetation communities that currently dominate the area. This is backed up by the current state
of the vegetation communities throughout the site, many of which are nearly indistinguishable
from the surrounding landscape areas. Wildlife use of the site would therefore be expected to
return to the current use as the vegetation communities re-establish themselves. Disturbance,
including forestry and mining, is a common feature on the landscape, and the animal
populations are well adapted to this cycle of regeneration. Further, the presence of large open

Orefinders Resources Inc. Closure Plan
STORY ENVIRONMENTAL INC. Page 82 of 86
areas of Rock Barren and open water contributes to the overall biodiversity of the area providing
habitat for species native to the area, which would not be well served by a forested condition.
11.6 Aquatic Plant and Animal Life
It is expected that there will be no alteration of watercourses and aquatic habitat associated with
the Project. There are no discharges from the Project thus water quality in surrounding water
courses is expected to be unchanged from the current condition.

Orefinders Resources Inc. Closure Plan
STORY ENVIRONMENTAL INC. Page 83 of 86
12 Costs
A summary of the estimated costs to implement the Closure Plan for the Project can be found in
Table 12.1, Appendix B.

Orefinders Resources Inc. Closure Plan
STORY ENVIRONMENTAL INC. Page 84 of 86
13 Financial Assurance
Financial assurance for closure in the form and amount set out below will be provided by
Orefinders in accordance with O. Reg. 240/00. The amount is based on the estimated costs of
closure at the time of preparation of this Closure Plan. Closure costs will be reassessed from
time to time in accordance with current provisions of the Mining Act and its regulations. Any
addition to, or refunding of, financial assurance will be undertaken following acceptance of the
assessment report and discussions with the Directors of Mine Rehabilitation, MNDM.
The proponent acknowledges that it shall be responsible for providing $72,348 subject to any
required approved changes to the Closure Plan. Financial assurance is provided in the form of a
Letter of Credit.

Orefinders Resources Inc. Closure Plan
STORY ENVIRONMENTAL INC. Page 85 of 86
14 References
Abraham, E.M., 1951. Geology of McElroy and Part of Boston Townships; Ontario Department
of Mines, Annual Report 59, 66, accompanied by map 1950-3.
Allard, G.O., Caty, J.L., Chown, E.H., Cimon, J., Gobeil, A., Baker, D., 1979. Stratigraphy and
metallogeny of Chibougamau area. Geological Association of Canada/Mineralogical
Association of Canada, Field excursion B-1 , Laval University, Quebec, P.Q., 95 .
Ayer, J., Amelin, Y., Corfu, F., Kamo, S., Ketchum, J., Kwok, K., Trowell, N., 2002. Evolution of
the southern Abitibi Greenstone Belt based on U Pb geochronology: autochthonous
volcanic construction followed by plutonism, regional deformation and sedimentation.
Precambrian Research 115, 63-95.
Baker J. M., 1962. Report on Property in McElroy and Catharine Townships, District of
Temiskaming, Ontario, for Mirado Nickel Mines Ltd. Internal report.
Baker J. M., 1964. Supplementary Report on Gold Property in McElroy and Catharine
Townships, District of Temiskaming, Ontario for Mirado Nickel Mines Ltd. Internal report.
Banton, E., Johnson, J., Lee. H., Racey, G., Uhlig, P and Wester, M., 2009. Ecosites of Ontario,
Operational Draft. Ecological Land Classification Working Group.
Bellefleur, G., Calvert, A.J., Chouteau, M.C., 1998. Crustal geometry of the Abitibi Subprovince,
in light of three-dimensional seismic reflector orientations. Canadian Journal of Earth
Sciences 35, 569-582.
Bourne, D.A., 1985. Report on the Cathroy Larder Gold Property, McElroy and Catharine
Townships, Kirkland Lake Area, Ontario for Golden Shield Resources Ltd. Internal
report.
Daigneault, R., and Archambault, G., 1990. Les grands couloirs de deformation de la sous-
province de l'Abitibi. In: M. Rive, G. Riverin, A. Simard, JM Lulin and Y. Gagnon
(Editors), The Northwestern Quebec Polymetallic Belt: A Summary of 60 Years of Mining
Exploration., vol. 43. CIMM. Spec., 43-64.
Dimroth, E., Imreh, L., Rocheleau, M., Goulet, N., 1982. Evolution of the south-central part of
the Archean Abitibi Belt, Quebec. Part I: Stratigraphy and paleogeographic model.
Canadian Journal of Earth Sciences 19, 1729-1758.
Goodwin, A.M., and Ridler, R.H., 1970. The Abitibi orogenic belt. In Basins and geosynclines of
the Canadian Shield. Edited by A.J. Baer, Geological Survey of Canada, Paper 70-40, 1-
30.
Golden Shield Resources, May 1987. Report of Activities in Support of OMEP Application.
OM86-G-P-1-1 by Golden Shield Resources. Unauthored internal report.

Orefinders Resources Inc. Closure Plan
STORY ENVIRONMENTAL INC. Page 86 of 86
Hayden A.S., 1986. An Investigation of The Recovery of Gold from the samples submitted by
Golden Shield Resources Ltd. Progress Report No. l. Internal report.
Hocq, M., 1990. Carte lithotectonique des sous-provinces de l'Abitibi et du Pontiac. Ministère de
l'Energie et des Ressources du Québec, DV 89-04.
Jensen, L.S., 1978a. Archean komatiitic, tholeiitic, calc-alkaline and alkalic volcanic sequences
in Kirkland Lake area. Toronto 1978 Field excursion guidebook. Edited by L. Currie and
W.O. MacKasey. Geological Association of Canada, 237-259.
Mueller, W.U., and Mortensen, J.K., 2002. Age constraints and characteristics of subaqueous
volcanic construction, the Archean Hunter Mine Group, Abitibi greenstone belt.
Precambrian Research 115, 119-152.
Segsworth R.L., 1964. Report on Mirado Nickel Mines Ltd., McElroy and Catharine Townships,
Temiskaming. Internal report.
SGS Canada Inc., 2014. An Investigation into the Recovery of Gold from Mirado Project
Samples. SGS Canada, Lakefield Ontario, Canada.
SRK Consulting Inc., 2013. Mineral Resource Evaluation Technical Report for the Mirado Gold
Project, Ontario. SRK Consulting (Canada) Inc. Toronto Ont. Canada
Story Environmental Inc. (SEI), 2012. Queenston Mining Inc. Upper Beaver Project Advanced
Exploration Closure Plan, Gauthier Township, Ontario. Submitted to Ministry of Northern
Development and Mines, 26 July 2012.
Wyman, D.A., Kerrich, R., Polat, A., 2002. Assembly of Archean cratonic mantle lithosphere and
crust: plume arc interaction in the Abitibi Wawa subduction accretion complex.
Precambrian Research 11, 37-62.

Orefinders Resources Inc. Closure Plan
STORY ENVIRONMENTAL INC. APPENDIX A
APPENDIX A
Figures

Orefinders Resources Inc. Closure Plan
STORY ENVIRONMENTAL INC. APPENDIX B
APPENDIX B
Tables

Orefinders Resources Inc. Closure Plan
STORY ENVIRONMENTAL INC. APPENDIX C
APPENDIX C
Well Records

PROFESSIONAL SEALS
I/R DD/MM/YY ISSUE/REVISION DESCRIPTION DRN ENGCHK DES IDR APP
DRAWING NUMBERPROJECT NUMBER ISSUE/REVISION
DO NOT SCALE THIS DOCUMENT.ALL MEASUREMENTS MUST BE OBTAINED FROM STATED DIMENSIONS.
Orefinders Resources Inc.Mirado Project Phase 1 Site Plan
Waste Rock Stockpiles, Mirado Pit & South Pit
121-01-19-08-01 SEI-121-19-0003 AA 16/06/2014 Mirado Phase 1 Project Area NRM MM NRM MES
A
A
A
A
A
A
Access Road(Southwest to Highway 564)
Road
Road
OverburdenStockpile
SouthPit
MiradoPit
SouthStockpile
NorthStockpile
CentralStockpile
586700
586700
586800
586800
586900
586900
587000
587000
587100
587100
587200
587200
587300
587300
587400
587400
Service Layer Credits: Sources: Esri, DeLorme, NAVTEQ, TomTom,Intermap, increment P Corp., GEBCO, USGS, FAO, NPS, NRCAN,GeoBase, IGN, Kadaster NL, Ordnance Survey, Esri Japan, METI, Esri
Mirado Project Phase 1 Site PlanFigure . .1
EnvironmentalStudyArea
0 52.5Kilometers
Legend
Mirado Project Phase 1 Area
Document Path: R:\SEI\Orefinders\121-01_Environmental Monitoring for Baseline Studies\GIS Maps\121-01-19-08-01 Closure Plan Maps\SEI-121-01-19-0003 Mirado Phase 1 Area (Portrait 8.5x11).mxd
0 75 15037.5 M
Figure .1
UTM NAD83 Zone 17N

5315000
5315000
5316000
5316000
5317000
5317000
5318000
5318000
5319000
5319000
5320000
5320000
5321000
5321000
µL
eg
en
d
No
te:
Ort
ho
rec
tifi
ed
imag
ery
was
ob
tain
ed
fro
mth
eM
inis
try
of
Na
tura
lR
eso
urc
es
.It
was
flo
wn
inS
ep
tem
be
ro
f20
08
&2
00
9.

5317000
5317000
5318000
5318000
5319000
5319000
5320000
5320000
5321000
5321000

PROFESSIONAL SEALS
I/R DD/MM/YY ISSUE/REVISION DESCRIPTION DRN ENGCHK DES IDR APP
DRAWING NUMBERPROJECT NUMBER ISSUE/REVISION
DO NOT SCALE THIS DOCUMENT.
ALL MEASUREMENTS MUST BE OBTAINED FROM STATED DIMENSIONS.
Orefinders Resources Inc.Mirado Project Phase 1
Waste Rock Stockpiles, Mirado Pit & South Pit
121-01-19-08-01 SEI-121-19-0010 AA 12/08/2014 Mirado Phase 1 Project Area NRM MM NRM MES
A
A
A
A
A
A
Access Road(Southwest to Highway 564)
Road
Road
OverburdenStockpile Area to Be
Seeded
South Pit
South Stockpile
North Stockpile
CentralStockpile
287.5
586700
586700
586800
586800
586900
586900
587000
587000
587100
587100
587200
587200
587300
587300
587400
587400
Service Layer Credits: Sources: Esri, DeLorme, NAVTEQ, TomTom,Intermap, increment P Corp., GEBCO, USGS, FAO, NPS, NRCAN,GeoBase, IGN, Kadaster NL, Ordnance Survey, Esri Japan, METI, Esri
Mirado Project Phase 1 SiteFigure 4.2.1
EnvironmentalStudyArea
0 52.5Kilometers
Legend
Stockpile Contour Lines 0.25 m
Contour Lines 0.5 m (Above Sea Level)
Mirado Project Phase 1 Area
Document Path: R:\SEI\Orefinders\121-01_Environmental Monitoring for Baseline Studies\GIS Maps\121-01-19-08-01 Closure Plan Maps\SEI-121-01-19-0010 Stockpiles Now (Portrait 8.5x11).mxd
0 75 15037.5 M
Figure 4.2.1
UTM NAD83 Zone 17N

5316800
5316800
5317200
5317200
5317600
5317600
5318000
5318000
5318400
5318400
5318800
5318800
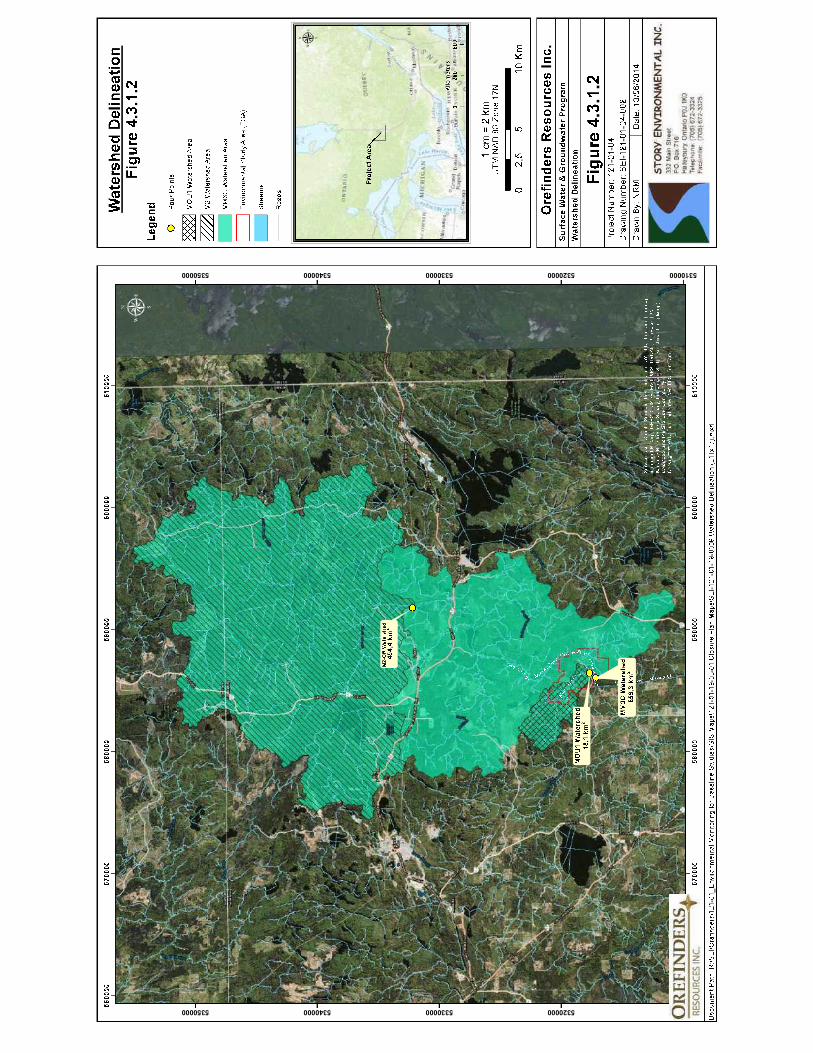
5310000
5320000
5320000
5330000
5330000
5340000
5340000
5350000
5350000

5317000
5317000
5318000
5318000
5319000
5319000
5320000
5320000
5321000
5321000

5317000
5317000
5318000
5318000
5319000
5319000
5320000
5320000
5321000
5321000


5317000
5317000
5318000
5318000
5319000
5319000
5320000
5320000
5321000
5321000

5317000
5317000
5318000
5318000
5319000
5319000
5320000
5320000
5321000
5321000

Fig
ure
4.8
.2N
eu
tralizin
gP
ote
nti
al
vs
Acid
Po
ten
tial
0
20
40
60
80
10
0
12
0
0.0
02
0.0
04
0.0
06
0.0
08
0.0
01
00
.00
12
0.0
0
NP(tCaCO3/1000t)
AP
(tC
aCO
3/1
00
0t)
MW
T1-1
MW
T1-2
A
MW
T1-2
B
NP
R=
1
NP
R=
2
NP
R=
4
AR
Dp
ote
nti
al:n
on
eA
RD
po
ten
tial
:lo
w
AR
Dp
ote
nti
al:p
oss
ible
AR
Dp
ote
nti
al:l
ike
ly
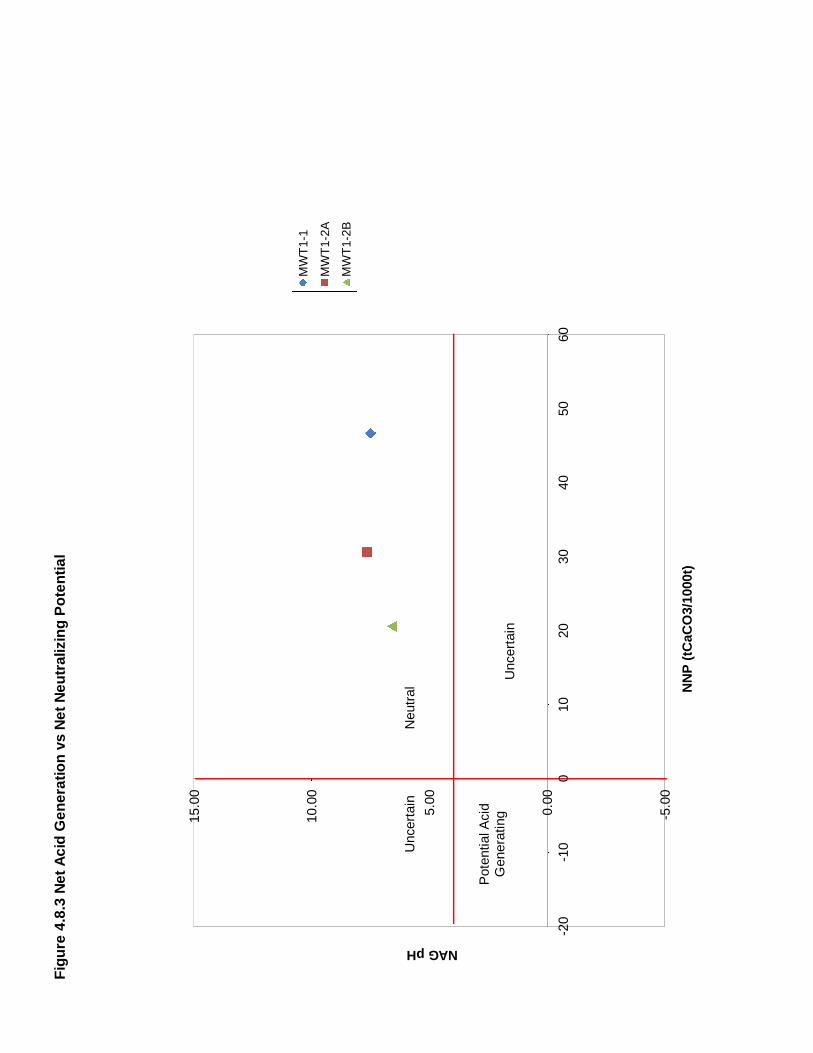
Fig
ure
4.8
.3N
et
Ac
idG
en
era
tio
nvs
Ne
tN
eu
tralizin
gP
ote
nti
al
-5.0
0
0.0
0
5.0
0
10.0
0
15.0
0
-20
-10
010
20
30
40
50
60
NAGpH
NN
P(t
CaC
O3/1
000t)
MW
T1-1
MW
T1-2
A
MW
T1-2
B
Uncert
ain
Uncert
ain
Pote
ntialA
cid
Genera
ting
Neutr
al
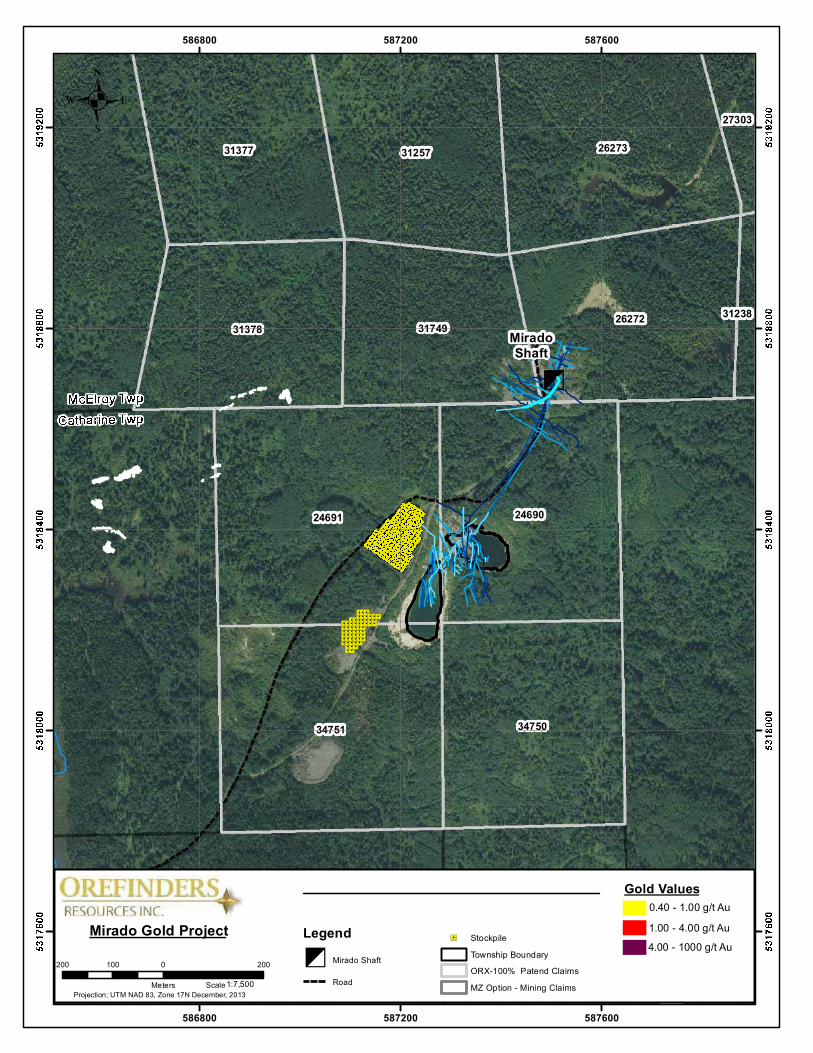
"/"/"/"/"/"/
"/"/"/"/"/"/"/"/
"/"/"/"/"/"/"/"/"/
"/"/"/"/"/"/"/"/
"/"/"/"/"/"/"/"/"/
"/"/"/"/"/"/"/"/
"/"/"/"/
"/"/"/"/"/"/"/
»
24691
34751
26273
24690
34750
26272
3125731377
31378 31749
27303
31238
586800
586800
587200
587200
587600
587600
.
MiradoShaft
200 0 200100
Meters 1:7,500
Projection; UTM NAD 83, Zone 17N December, 2013
Mirado Gold Project
Scale
Legend» Mirado Shaft
Road
Gold Values
0.40 - 1.00 g/t Au
1.00 - 4.00 g/t Au
4.00 - 1000 g/t Au"/ Stockpile
Township Boundary
ORX-100% Patend Claims
MZ Option - Mining Claims

Fig
ure
4.9
.1.2
Para
mete
rso
fC
on
cern
inS
ed
imen
tS
am
pli
ng
Sit
es
0
10
20
30
40
50
60
MM
0-3
MM
0-2
MM
0-1
MM
1-3
MM
1-2
MM
1-1
MO
U2
MO
U1
MM
3-3
MM
3-2
MM
3-1
Concentrations(ug/g)
Sam
plin
gSi
tes
Aci
dEx
trac
tab
leC
hro
miu
m(C
r)
Aci
dEx
trac
tab
leC
op
pe
r(C
u)
Aci
dEx
trac
tab
leN
icke
l(N
i)
Lin
ear
(Cr
LEL)
Lin
ear
(Cu
&N
iLEL
)
PIT
1
Mo
uss
eau
Mis
em
aM
ise
ma

PROFESSIONAL SEALS
I/R DD/MM/YY ISSUE/REVISION DESCRIPTION DRN ENGCHK DES IDR APP
DRAWING NUMBERPROJECT NUMBER ISSUE/REVISION
DO NOT SCALE THIS DOCUMENT.
ALL MEASUREMENTS MUST BE OBTAINED FROM STATED DIMENSIONS.
Orefinders Resources Inc.Mirado Project Phase 1 Site Plan Post Closure
Waste Rock Stockpiles, Mirado Pit & South Pit
121-01-19-08-01 SEI-121-19-0011 AA 12/08/2014 Mirado Phase 1 Project Area NRM MM NRM MES
A
A
A
A
A
A
Access Road(Southwest to Highway 564)
Road
Road
OverburdenStockpile Area to Be
Seeded
South Pit
South Stockpile
North Stockpile
CentralStockpile
287.5
586700
586700
586800
586800
586900
586900
587000
587000
587100
587100
587200
587200
587300
587300
587400
587400
Service Layer Credits: Sources: Esri, DeLorme, NAVTEQ, TomTom,Intermap, increment P Corp., GEBCO, USGS, FAO, NPS, NRCAN,GeoBase, IGN, Kadaster NL, Ordnance Survey, Esri Japan, METI, Esri
Mirado Project Phase 1 Post Closure
Figure 11.2.1
EnvironmentalStudyArea
0 52.5Kilometers
Legend
Stockpile Contour Lines 0.25 m
Contour Lines 0.5 m (Above Sea Level)
Waste Rock Stockpiles Post Closure
Mirado Project Phase 1 Area
Document Path: R:\SEI\Orefinders\121-01_Environmental Monitoring for Baseline Studies\GIS Maps\121-01-19-08-01 Closure Plan Maps\SEI-121-01-19-0011 Stockpiles Post Closure (Portrait 8.5x11).mxd
0 75 15037.5 M
Figure 11.2.1
UTM NAD83 Zone 17N

Table 4.3.2.1 Surface Water and Groundwater Sampling Locations and Rationale
SW Sampling Location Surface Water BodyEasting
(m)
Northing
(m) Rationale
MM3 Misema River at "rope site" 585835 5317221 Downstream of Site and Downstream of inflow of
Mousseau Creek confluence
MOU1 Mousseau Creek
downstream of road/old
shaft
586453 5317640 Downstream of access road & old shaft -- immediately
upstream of confluence with Misema
MOU2 Mousseau Creek upstream
of road/old shaft
586284 5318569 Upstream of access road & old shaft
Pit 1 South Pit 587283 5318312 Sample water quality within on-site existing pit
Pit 2 Mirado Pit 587331 5318364 Sample water quality within on-site existing pit
Trench 1 Trench along trail to
Misema
587853 5318703 On-site water quality which drains to Misema River at
certain times of year
MM2 Misema River at Ski-Doo
Trail
588132 5318664 To become an "upstream" site after confirming similarity
of chemistry at MM1 and MM2
TLT Small tributary to Misema
draining Two small
unnamed Lakes/ponds
587643 5320186 Upstream contribution to Misema River
LLT Small tributary to Misema
draining Little Long Lake
587272 5320738 Upstream contribution to Misema River
MM1 Misema River, DS of
Adams Mine site
586957 5320882 Misema River water quality upstream of site.
MM0 Upgradient Misema River 585864 5321707 Upgradient Misema River
GW Sampling Location
MW1-BRBedrock groundwater
quality around pit587465 5318520
MW1-OBOverburden groundwater
quality around Mirado Pit587469 5318512
MW2-BRBedrock groundwater
quality around Mirado Pit587519 5318267
MW2-OBOverburden groundwater
quality around Mirado Pit587521 5318267
MW3-DDeep well to the south of
the Mirado and South Pits587190 5317971
MW3-S Shallow well to the south of
the Mirado and South Pits587189 5317972
MW4-BRBedrock groundwater
quality upgradient of site587074 5318358
MW4-OB-D
Overburden deep
groundwater quality
upgradient of site587074 5318348
MW4-OB-S
Overburden shallow
groundwater quality
upgradient of site587077 5318343
MW5Groundwater quality down
gradient of tailings587825 5318699
MWT1-OB Tailings in over burden 587597 5318861
MWT1-Sat Tailings in saturated zone 587596 5318855
MW-BG Background 585929 5317754
Notes:
1) Coordinates are based on NAD 83 Zone 17U
R:\SEI\Orefinders\121-01_Environmental Monitoring for Baseline Studies\121-01-19-08-01 Closure
Plan\Table 4.3.2.1 Water monitoring sites rationale.xlsx

Table 4.3.2.2 Surface Water Sampling Summary
LLT MM0 MM1
Parameter Units
Water Quality
Objective
Lower Limit
Water Quality
Objective
Upper Limit
Minimum
RDLMaximum RDL
18/10/2013 26/06/2014 18/10/2013 26/06/2014 18/10/2013
Acidity as CaC03 mg/L - - 10 10 ND ND ND ND ND
Alkalinity (Total as CaCO3) mg/L - - 1 1 26 30 44 46 46
Conductivity µmhos/cm - - 1 1 63 68 120 120 120
Conductivity (Field) µS/cm - - - - 82.2 70.4 114.3 119.1 116.2
Dissolved (0.2u) Aluminum (Al) mg/L - 0.075 0.005 0.005 0.09 0.061 0.03 0.028 0.029
Dissolved Oxygen (Field) mg/L 5 - - - NA 4.35 NA NA NA
6 - - - NA NA 9.24 6.05 9.48
7 - - - 10.37 NA NA NA NA
8 - - - NA NA NA NA NA
Dissolved Sulphate (SO4) mg/L - - 1 1 ND ND 9 13 10
Free Cyanide mg/L - 0.005 0.002 0.002 ND ND ND ND ND
Hardness (CaCO3) mg/L - - 1 1 30 36 58 59 61
Mercury (Hg) mg/L - 0.0002 0.0001 0.0001 ND ND ND ND ND
pH s.u. 6.5 8.5 - - 7.12 7.23 7.38 7.76 7.39
pH (Field) s.u. 6.5 8.5 - - 7.32 7.35 7.58 7.42 7.71
Temperature (Field) °C - - - - 7.7 22.9 10.3 19.4 10.6
Total Aluminum (Al) mg/L - - 0.005 0.005 0.12 0.27 0.14 0.32 0.14
Total Ammonia-N mg/L - - 0.05 0.05 ND ND ND ND ND
Total Arsenic (As) mg/L - 0.005 0.001 0.001 ND ND ND ND ND
Total Cadmium (Cd) mg/L - 0.0001 0.0001 0.0001 ND ND ND ND ND
0.0005 0.0001 0.0001 NA NA NA NA NA
Total Calcium (Ca) mg/L - - 0.2 0.2 9.1 10 16 17 16
Total Copper (Cu) mg/L - 0.005 0.001 0.001 0.0012 ND 0.0018 0.0021 0.0019
Total Cyanide (CN) mg/L - - 0.005 0.005 ND ND ND ND ND
Total Dissolved Solids mg/L - - 10 10 98 80 104 94 104
Total Iron (Fe) mg/L - 0.3 0.1 0.1 0.45 1.3 0.27 0.35 0.29
Total Lead (Pb) mg/L - 0.001 0.0005 0.0005 NA NA NA NA NA
0.003 0.0005 0.0005 ND ND ND ND ND
0.005 0.0005 0.0005 NA NA NA NA NA
Total Molybdenum (Mo) mg/L - 0.04 0.0005 0.0005 ND ND ND ND ND
Total Nickel (Ni) mg/L - 0.025 0.001 0.001 0.003 0.0024 ND ND ND
Total Suspended Solids mg/L - - 1 2 2 10 2 9 2
Total Zinc (Zn) mg/L - 0.02 0.005 0.005 ND 0.0089 ND 0.0057 ND
Unionized Ammonia (Calculated) mg/L - 0.02 - - ND ND ND ND ND
Radium-226 Bq/L - 1 0.005 0.01 ND ND ND ND ND
Nitrate (N) mg/L - - 0.1 0.1 ND ND ND ND ND
Nitrate + Nitrite mg/L - - 0.1 0.1 ND ND ND ND ND
Nitrite (N) mg/L - - 0.01 0.01 ND ND ND ND ND
Total Phosphorus mg/L - 0.03 0.002 0.002 0.006 0.024 0.01 0.017 0.009
Notes:
NA - Not Analyzed either due to unsafe sampling conditions, insufficient water quantity at the site or for other reasons.
ND - Not DetectedR:\SEI\Orefinders\121-01_Environmental Monitoring for Baseline Studies\121-01-04_SW and GW Program\ss\Orefin

Table 4.3.2.2 Surface Water Sampling Summary
Parameter Units
Water Quality
Objective
Lower Limit
Water Quality
Objective
Upper Limit
Minimum
RDLMaximum RDL
Acidity as CaC03 mg/L - - 10 10
Alkalinity (Total as CaCO3) mg/L - - 1 1
Conductivity µmhos/cm - - 1 1
Conductivity (Field) µS/cm - - - -
Dissolved (0.2u) Aluminum (Al) mg/L - 0.075 0.005 0.005
Dissolved Oxygen (Field) mg/L 5 - - -
6 - - -
7 - - -
8 - - -
Dissolved Sulphate (SO4) mg/L - - 1 1
Free Cyanide mg/L - 0.005 0.002 0.002
Hardness (CaCO3) mg/L - - 1 1
Mercury (Hg) mg/L - 0.0002 0.0001 0.0001
pH s.u. 6.5 8.5 - -
pH (Field) s.u. 6.5 8.5 - -
Temperature (Field) °C - - - -
Total Aluminum (Al) mg/L - - 0.005 0.005
Total Ammonia-N mg/L - - 0.05 0.05
Total Arsenic (As) mg/L - 0.005 0.001 0.001
Total Cadmium (Cd) mg/L - 0.0001 0.0001 0.0001
0.0005 0.0001 0.0001
Total Calcium (Ca) mg/L - - 0.2 0.2
Total Copper (Cu) mg/L - 0.005 0.001 0.001
Total Cyanide (CN) mg/L - - 0.005 0.005
Total Dissolved Solids mg/L - - 10 10
Total Iron (Fe) mg/L - 0.3 0.1 0.1
Total Lead (Pb) mg/L - 0.001 0.0005 0.0005
0.003 0.0005 0.0005
0.005 0.0005 0.0005
Total Molybdenum (Mo) mg/L - 0.04 0.0005 0.0005
Total Nickel (Ni) mg/L - 0.025 0.001 0.001
Total Suspended Solids mg/L - - 1 2
Total Zinc (Zn) mg/L - 0.02 0.005 0.005
Unionized Ammonia (Calculated) mg/L - 0.02 - -
Radium-226 Bq/L - 1 0.005 0.01
Nitrate (N) mg/L - - 0.1 0.1
Nitrate + Nitrite mg/L - - 0.1 0.1
Nitrite (N) mg/L - - 0.01 0.01
Total Phosphorus mg/L - 0.03 0.002 0.002
MM1 MM2
26/06/2014 16/10/2013 13/12/2013 20/02/2014 17/04/2014 25/06/2014
ND ND ND 10 ND ND
44 46 44 61 48 44
120 NA NA 160 140 120
120.9 118 132.9 140.8 138.9 121.4
0.028 0.04 0.079 0.042 0.056 0.034
6.38 NA NA NA NA 6.86
NA 8.04 NA NA NA NA
NA NA NA NA NA NA
NA NA 8.9 10.22 13.53 NA
14 8 14 14 14 15
ND ND ND ND ND ND
59 51 63 80 59 60
ND ND ND ND ND ND
7.61 NA NA 7.63 7.08 7.64
7.6 7.56 8.94 7.45 7.46 7.72
21 11.2 1.8 0 0.2 20.1
0.31 0.16 0.24 0.17 0.23 0.28
ND ND ND ND 0.13 ND
ND ND ND ND ND ND
ND ND ND ND ND ND
NA NA NA NA NA NA
17 17 19 23 18 16
0.0021 0.007 0.0021 0.0038 0.0025 0.0021
ND ND ND ND ND ND
116 82 84 80 126 58
0.34 0.3 0.41 0.25 0.45 0.4
NA NA NA NA NA NA
ND ND ND NA ND ND
NA NA NA ND NA NA
ND ND 0.0016 ND ND ND
ND ND 0.0011 0.0045 0.0016 0.001
14 1 3 4 4 6
ND ND 0.0051 0.0057 0.042 ND
ND ND ND ND 0.000313 ND
ND ND ND ND ND ND
ND ND ND 0.13 0.56 ND
ND ND ND 0.13 0.56 ND
ND ND ND ND ND ND
0.019 0.009 0.006 0.007 0.015 0.012
Notes:
NA - Not Analyzed either due to unsafe sampling conditions, insufficient water quantity at the site or for other reasons.
ND - Not DetectedR:\SEI\Orefinders\121-01_Environmental Monitoring for Baseline Studies\121-01-04_SW and GW Program\ss\Orefin

Table 4.3.2.2 Surface Water Sampling Summary
Parameter Units
Water Quality
Objective
Lower Limit
Water Quality
Objective
Upper Limit
Minimum
RDLMaximum RDL
Acidity as CaC03 mg/L - - 10 10
Alkalinity (Total as CaCO3) mg/L - - 1 1
Conductivity µmhos/cm - - 1 1
Conductivity (Field) µS/cm - - - -
Dissolved (0.2u) Aluminum (Al) mg/L - 0.075 0.005 0.005
Dissolved Oxygen (Field) mg/L 5 - - -
6 - - -
7 - - -
8 - - -
Dissolved Sulphate (SO4) mg/L - - 1 1
Free Cyanide mg/L - 0.005 0.002 0.002
Hardness (CaCO3) mg/L - - 1 1
Mercury (Hg) mg/L - 0.0002 0.0001 0.0001
pH s.u. 6.5 8.5 - -
pH (Field) s.u. 6.5 8.5 - -
Temperature (Field) °C - - - -
Total Aluminum (Al) mg/L - - 0.005 0.005
Total Ammonia-N mg/L - - 0.05 0.05
Total Arsenic (As) mg/L - 0.005 0.001 0.001
Total Cadmium (Cd) mg/L - 0.0001 0.0001 0.0001
0.0005 0.0001 0.0001
Total Calcium (Ca) mg/L - - 0.2 0.2
Total Copper (Cu) mg/L - 0.005 0.001 0.001
Total Cyanide (CN) mg/L - - 0.005 0.005
Total Dissolved Solids mg/L - - 10 10
Total Iron (Fe) mg/L - 0.3 0.1 0.1
Total Lead (Pb) mg/L - 0.001 0.0005 0.0005
0.003 0.0005 0.0005
0.005 0.0005 0.0005
Total Molybdenum (Mo) mg/L - 0.04 0.0005 0.0005
Total Nickel (Ni) mg/L - 0.025 0.001 0.001
Total Suspended Solids mg/L - - 1 2
Total Zinc (Zn) mg/L - 0.02 0.005 0.005
Unionized Ammonia (Calculated) mg/L - 0.02 - -
Radium-226 Bq/L - 1 0.005 0.01
Nitrate (N) mg/L - - 0.1 0.1
Nitrate + Nitrite mg/L - - 0.1 0.1
Nitrite (N) mg/L - - 0.01 0.01
Total Phosphorus mg/L - 0.03 0.002 0.002
MM3 MOU1
16/10/2013 17/04/2014 25/06/2014 16/10/2013 13/12/2013 20/02/2014
ND ND ND ND ND 16
49 48 46 46 41 82
NA 130 120 NA NA 180
119.9 136 124.3 96.2 108.1 152.3
0.028 0.059 0.033 0.036 0.11 0.051
NA NA NA NA NA NA
10.04 NA 6.93 NA NA NA
NA NA NA 7.35 NA NA
NA 13.85 NA NA 5.34 4.16
8 12 14 ND ND ND
ND ND ND ND ND ND
54 58 57 47 48 94
ND ND ND ND ND ND
NA 7.32 7.76 NA NA 7.55
7.51 7.72 7.55 6.91 7.77 6.55
11 0.1 19.8 8.7 0 -0.01
0.16 0.38 0.28 0.1 0.5 0.46
ND 0.15 ND ND 0.099 0.27
ND ND ND ND ND ND
ND ND ND ND ND ND
NA NA NA NA NA NA
18 17 17 13 13 24
0.0021 0.0015 0.0028 ND 0.0018 0.0014
ND ND ND ND ND ND
100 122 70 98 84 120
0.31 0.57 0.4 0.31 1.1 2
NA NA NA NA NA NA
ND ND ND ND ND NA
NA NA NA NA NA ND
ND ND 0.0025 ND ND ND
0.0011 0.0012 0.0032 0.0013 0.0016 0.0019
3 6 6 3 4 7
ND ND 0.0053 ND 0.0061 0.0068
ND 0.000651 ND ND 0.000478 0.000079
ND ND ND ND ND ND
ND 0.71 ND ND 0.18 0.24
ND 0.71 ND ND 0.18 0.24
ND ND ND ND ND ND
0.011 0.021 0.01 0.014 0.022 0.024
Notes:
NA - Not Analyzed either due to unsafe sampling conditions, insufficient water quantity at the site or for other reasons.
ND - Not DetectedR:\SEI\Orefinders\121-01_Environmental Monitoring for Baseline Studies\121-01-04_SW and GW Program\ss\Orefin

Table 4.3.2.2 Surface Water Sampling Summary
Parameter Units
Water Quality
Objective
Lower Limit
Water Quality
Objective
Upper Limit
Minimum
RDLMaximum RDL
Acidity as CaC03 mg/L - - 10 10
Alkalinity (Total as CaCO3) mg/L - - 1 1
Conductivity µmhos/cm - - 1 1
Conductivity (Field) µS/cm - - - -
Dissolved (0.2u) Aluminum (Al) mg/L - 0.075 0.005 0.005
Dissolved Oxygen (Field) mg/L 5 - - -
6 - - -
7 - - -
8 - - -
Dissolved Sulphate (SO4) mg/L - - 1 1
Free Cyanide mg/L - 0.005 0.002 0.002
Hardness (CaCO3) mg/L - - 1 1
Mercury (Hg) mg/L - 0.0002 0.0001 0.0001
pH s.u. 6.5 8.5 - -
pH (Field) s.u. 6.5 8.5 - -
Temperature (Field) °C - - - -
Total Aluminum (Al) mg/L - - 0.005 0.005
Total Ammonia-N mg/L - - 0.05 0.05
Total Arsenic (As) mg/L - 0.005 0.001 0.001
Total Cadmium (Cd) mg/L - 0.0001 0.0001 0.0001
0.0005 0.0001 0.0001
Total Calcium (Ca) mg/L - - 0.2 0.2
Total Copper (Cu) mg/L - 0.005 0.001 0.001
Total Cyanide (CN) mg/L - - 0.005 0.005
Total Dissolved Solids mg/L - - 10 10
Total Iron (Fe) mg/L - 0.3 0.1 0.1
Total Lead (Pb) mg/L - 0.001 0.0005 0.0005
0.003 0.0005 0.0005
0.005 0.0005 0.0005
Total Molybdenum (Mo) mg/L - 0.04 0.0005 0.0005
Total Nickel (Ni) mg/L - 0.025 0.001 0.001
Total Suspended Solids mg/L - - 1 2
Total Zinc (Zn) mg/L - 0.02 0.005 0.005
Unionized Ammonia (Calculated) mg/L - 0.02 - -
Radium-226 Bq/L - 1 0.005 0.01
Nitrate (N) mg/L - - 0.1 0.1
Nitrate + Nitrite mg/L - - 0.1 0.1
Nitrite (N) mg/L - - 0.01 0.01
Total Phosphorus mg/L - 0.03 0.002 0.002
MOU1 MOU2
17/04/2014 25/06/2014 23/10/2013 13/12/2013 21/02/2014 17/04/2014
11 ND ND ND ND 11
27 47 37 45 87 27
75 98 NA NA 180 77
75.3 98.7 79.9 112.5 185 77.2
0.11 0.042 0.072 0.12 0.059 0.11
NA NA NA NA NA NA
NA 5.74 NA NA NA NA
NA NA NA NA NA NA
11.12 NA 9.72 10.25 7.91 11.28
ND ND ND ND ND ND
ND ND ND ND ND ND
32 56 41 50 98 34
ND ND ND ND ND ND
6.77 7.54 NA NA 7.82 6.75
6.96 7.27 7.13 7.78 7.44 7.53
-0.1 19.2 3.4 0.4 0.1 -0.1
0.53 0.18 0.4 0.63 0.49 0.63
0.2 ND ND 0.12 0.34 0.22
ND ND ND ND ND ND
ND ND ND ND ND ND
NA NA NA NA NA NA
9.6 14 11 14 26 9.6
0.0022 0.0015 0.0014 0.002 0.0019 0.0024
ND ND ND ND ND ND
84 64 84 88 130 92
0.88 0.6 0.79 1.4 2.3 1.1
NA NA NA NA NA NA
ND ND ND ND NA ND
NA NA NA NA ND NA
ND 0.00065 ND ND 0.00067 ND
0.0016 0.002 ND 0.0021 0.0019 0.0022
5 4 2 5 5 11
ND ND ND 0.0075 0.014 0.0078
0.000149 ND ND 0.000613 0.000776 0.000607
ND ND ND 0.027 ND 0.041
1.1 ND 0.13 0.15 0.2 1.09
1.1 ND 0.13 0.15 0.2 1.09
ND ND ND ND ND ND
0.036 0.024 0.021 0.017 0.037 0.043
Notes:
NA - Not Analyzed either due to unsafe sampling conditions, insufficient water quantity at the site or for other reasons.
ND - Not DetectedR:\SEI\Orefinders\121-01_Environmental Monitoring for Baseline Studies\121-01-04_SW and GW Program\ss\Orefin

Table 4.3.2.2 Surface Water Sampling Summary
Parameter Units
Water Quality
Objective
Lower Limit
Water Quality
Objective
Upper Limit
Minimum
RDLMaximum RDL
Acidity as CaC03 mg/L - - 10 10
Alkalinity (Total as CaCO3) mg/L - - 1 1
Conductivity µmhos/cm - - 1 1
Conductivity (Field) µS/cm - - - -
Dissolved (0.2u) Aluminum (Al) mg/L - 0.075 0.005 0.005
Dissolved Oxygen (Field) mg/L 5 - - -
6 - - -
7 - - -
8 - - -
Dissolved Sulphate (SO4) mg/L - - 1 1
Free Cyanide mg/L - 0.005 0.002 0.002
Hardness (CaCO3) mg/L - - 1 1
Mercury (Hg) mg/L - 0.0002 0.0001 0.0001
pH s.u. 6.5 8.5 - -
pH (Field) s.u. 6.5 8.5 - -
Temperature (Field) °C - - - -
Total Aluminum (Al) mg/L - - 0.005 0.005
Total Ammonia-N mg/L - - 0.05 0.05
Total Arsenic (As) mg/L - 0.005 0.001 0.001
Total Cadmium (Cd) mg/L - 0.0001 0.0001 0.0001
0.0005 0.0001 0.0001
Total Calcium (Ca) mg/L - - 0.2 0.2
Total Copper (Cu) mg/L - 0.005 0.001 0.001
Total Cyanide (CN) mg/L - - 0.005 0.005
Total Dissolved Solids mg/L - - 10 10
Total Iron (Fe) mg/L - 0.3 0.1 0.1
Total Lead (Pb) mg/L - 0.001 0.0005 0.0005
0.003 0.0005 0.0005
0.005 0.0005 0.0005
Total Molybdenum (Mo) mg/L - 0.04 0.0005 0.0005
Total Nickel (Ni) mg/L - 0.025 0.001 0.001
Total Suspended Solids mg/L - - 1 2
Total Zinc (Zn) mg/L - 0.02 0.005 0.005
Unionized Ammonia (Calculated) mg/L - 0.02 - -
Radium-226 Bq/L - 1 0.005 0.01
Nitrate (N) mg/L - - 0.1 0.1
Nitrate + Nitrite mg/L - - 0.1 0.1
Nitrite (N) mg/L - - 0.01 0.01
Total Phosphorus mg/L - 0.03 0.002 0.002
MOU2 Pit 1
25/06/2014 16/10/2013 23/10/2013 13/12/2013 20/02/2014 17/04/2014
11 ND ND ND 10 ND
50 78 90 91 87 74
100 NA NA NA 260 210
106.5 224.9 227.3 269.5 259.7 253.9
0.036 0.008 ND ND ND 0.006
NA NA NA NA NA NA
3.6 7.22 NA NA NA NA
NA NA 8.83 NA NA NA
NA NA NA 10.75 7.22 7.89
ND 35 36 37 39 35
ND ND ND ND ND ND
57 110 120 130 140 99
ND ND ND ND ND ND
7.47 NA NA NA 7.83 7.49
7.38 8.28 8.08 7.91 7.66 7.35
19.4 12.7 8.7 1 2.1 1.5
0.14 0.064 0.11 0.18 0.062 0.19
ND ND ND ND ND 0.1
ND ND ND ND ND ND
ND NA NA NA NA ND
NA ND ND ND ND NA
15 36 37 43 43 33
0.0013 0.001 0.0012 0.0013 0.0023 0.0015
ND ND ND ND ND ND
100 144 144 158 138 152
0.62 ND ND 0.12 ND 0.19
NA NA NA NA NA NA
ND NA NA NA NA NA
NA ND ND ND ND ND
0.00075 0.00082 ND 0.0017 ND ND
0.0017 ND ND ND ND ND
3 ND 1 3 8 3
ND ND ND 0.0055 0.0071 ND
ND ND ND ND ND 0.000209
ND ND ND ND ND ND
ND ND ND ND ND 0.1
ND ND ND ND ND 0.1
ND ND ND ND 0.016 ND
0.018 0.005 0.008 0.012 0.01 0.013
Notes:
NA - Not Analyzed either due to unsafe sampling conditions, insufficient water quantity at the site or for other reasons.
ND - Not DetectedR:\SEI\Orefinders\121-01_Environmental Monitoring for Baseline Studies\121-01-04_SW and GW Program\ss\Orefin

Table 4.3.2.2 Surface Water Sampling Summary
Parameter Units
Water Quality
Objective
Lower Limit
Water Quality
Objective
Upper Limit
Minimum
RDLMaximum RDL
Acidity as CaC03 mg/L - - 10 10
Alkalinity (Total as CaCO3) mg/L - - 1 1
Conductivity µmhos/cm - - 1 1
Conductivity (Field) µS/cm - - - -
Dissolved (0.2u) Aluminum (Al) mg/L - 0.075 0.005 0.005
Dissolved Oxygen (Field) mg/L 5 - - -
6 - - -
7 - - -
8 - - -
Dissolved Sulphate (SO4) mg/L - - 1 1
Free Cyanide mg/L - 0.005 0.002 0.002
Hardness (CaCO3) mg/L - - 1 1
Mercury (Hg) mg/L - 0.0002 0.0001 0.0001
pH s.u. 6.5 8.5 - -
pH (Field) s.u. 6.5 8.5 - -
Temperature (Field) °C - - - -
Total Aluminum (Al) mg/L - - 0.005 0.005
Total Ammonia-N mg/L - - 0.05 0.05
Total Arsenic (As) mg/L - 0.005 0.001 0.001
Total Cadmium (Cd) mg/L - 0.0001 0.0001 0.0001
0.0005 0.0001 0.0001
Total Calcium (Ca) mg/L - - 0.2 0.2
Total Copper (Cu) mg/L - 0.005 0.001 0.001
Total Cyanide (CN) mg/L - - 0.005 0.005
Total Dissolved Solids mg/L - - 10 10
Total Iron (Fe) mg/L - 0.3 0.1 0.1
Total Lead (Pb) mg/L - 0.001 0.0005 0.0005
0.003 0.0005 0.0005
0.005 0.0005 0.0005
Total Molybdenum (Mo) mg/L - 0.04 0.0005 0.0005
Total Nickel (Ni) mg/L - 0.025 0.001 0.001
Total Suspended Solids mg/L - - 1 2
Total Zinc (Zn) mg/L - 0.02 0.005 0.005
Unionized Ammonia (Calculated) mg/L - 0.02 - -
Radium-226 Bq/L - 1 0.005 0.01
Nitrate (N) mg/L - - 0.1 0.1
Nitrate + Nitrite mg/L - - 0.1 0.1
Nitrite (N) mg/L - - 0.01 0.01
Total Phosphorus mg/L - 0.03 0.002 0.002
Pit 1 Pit 2
25/06/2014 16/10/2013 13/12/2013 20/02/2014 17/04/2014 25/06/2014
ND ND ND 15 ND ND
64 130 150 150 110 130
190 NA NA 400 300 330
189.2 342.2 397.4 391.4 391.6 337
0.009 ND ND ND ND 0.005
6.98 NA NA NA NA 5.94
NA 6.89 NA NA NA NA
NA NA NA NA NA NA
NA NA 9.65 5.61 5.18 NA
29 45 49 55 43 45
ND ND ND ND ND ND
100 160 210 220 140 180
ND ND ND ND ND ND
7.98 NA NA 7.99 7.78 8.22
8.23 8.03 7.95 7.62 7.5 8.17
20.3 12.9 0.3 2.8 1.7 20.9
0.083 0.0076 0.022 0.014 0.014 0.012
ND ND 0.074 0.095 0.17 ND
ND ND ND ND ND ND
NA NA NA NA NA NA
ND ND ND ND ND ND
28 58 77 72 52 56
0.0016 0.0026 0.0074 0.0021 0.0018 0.0023
ND ND ND ND ND ND
144 250 230 250 208 224
ND ND ND ND ND ND
NA NA NA NA NA NA
NA NA NA NA NA NA
ND ND ND ND ND ND
ND 0.0015 0.0018 0.0011 0.00085 0.00091
ND 0.0024 ND ND ND 0.0015
3 ND ND 1 ND ND
0.0093 ND 0.0076 0.0092 0.0055 ND
ND ND 0.000553 0.00041 0.000509 ND
ND ND ND ND ND ND
ND ND ND ND 0.13 ND
ND ND ND ND 0.13 ND
ND ND ND ND ND ND
0.009 0.003 ND 0.005 0.004 0.006
Notes:
NA - Not Analyzed either due to unsafe sampling conditions, insufficient water quantity at the site or for other reasons.
ND - Not DetectedR:\SEI\Orefinders\121-01_Environmental Monitoring for Baseline Studies\121-01-04_SW and GW Program\ss\Orefin

Table 4.3.2.2 Surface Water Sampling Summary
Parameter Units
Water Quality
Objective
Lower Limit
Water Quality
Objective
Upper Limit
Minimum
RDLMaximum RDL
Acidity as CaC03 mg/L - - 10 10
Alkalinity (Total as CaCO3) mg/L - - 1 1
Conductivity µmhos/cm - - 1 1
Conductivity (Field) µS/cm - - - -
Dissolved (0.2u) Aluminum (Al) mg/L - 0.075 0.005 0.005
Dissolved Oxygen (Field) mg/L 5 - - -
6 - - -
7 - - -
8 - - -
Dissolved Sulphate (SO4) mg/L - - 1 1
Free Cyanide mg/L - 0.005 0.002 0.002
Hardness (CaCO3) mg/L - - 1 1
Mercury (Hg) mg/L - 0.0002 0.0001 0.0001
pH s.u. 6.5 8.5 - -
pH (Field) s.u. 6.5 8.5 - -
Temperature (Field) °C - - - -
Total Aluminum (Al) mg/L - - 0.005 0.005
Total Ammonia-N mg/L - - 0.05 0.05
Total Arsenic (As) mg/L - 0.005 0.001 0.001
Total Cadmium (Cd) mg/L - 0.0001 0.0001 0.0001
0.0005 0.0001 0.0001
Total Calcium (Ca) mg/L - - 0.2 0.2
Total Copper (Cu) mg/L - 0.005 0.001 0.001
Total Cyanide (CN) mg/L - - 0.005 0.005
Total Dissolved Solids mg/L - - 10 10
Total Iron (Fe) mg/L - 0.3 0.1 0.1
Total Lead (Pb) mg/L - 0.001 0.0005 0.0005
0.003 0.0005 0.0005
0.005 0.0005 0.0005
Total Molybdenum (Mo) mg/L - 0.04 0.0005 0.0005
Total Nickel (Ni) mg/L - 0.025 0.001 0.001
Total Suspended Solids mg/L - - 1 2
Total Zinc (Zn) mg/L - 0.02 0.005 0.005
Unionized Ammonia (Calculated) mg/L - 0.02 - -
Radium-226 Bq/L - 1 0.005 0.01
Nitrate (N) mg/L - - 0.1 0.1
Nitrate + Nitrite mg/L - - 0.1 0.1
Nitrite (N) mg/L - - 0.01 0.01
Total Phosphorus mg/L - 0.03 0.002 0.002
TLT Trench 1
18/10/2013 26/06/2014 16/10/2013 13/12/2013 17/04/2014 25/06/2014
ND ND ND ND 33 13
32 22 57 65 71 42
71 55 NA NA 150 110
68.1 55.6 122.5 194.5 164.8 116.5
0.034 0.026 0.036 0.1 0.08 0.029
NA 5.35 NA NA NA 4.1
NA NA 5.54 NA NA NA
9.05 NA NA NA NA NA
NA NA NA 3.24 2.74 NA
ND 3 6 23 4 14
ND ND ND ND ND ND
36 28 59 84 63 59
ND ND ND ND ND ND
7.03 7.24 NA NA 6.99 7.39
7.32 7.75 7.1 7.78 6.85 7.25
9.2 23.7 11 0.6 0 22.1
0.085 0.14 1.6 1.5 0.67 0.088
ND ND ND 0.52 1.5 ND
ND ND ND ND ND ND
ND ND ND 0.00014 ND ND
NA NA NA NA NA NA
9.1 7.6 20 26 19 16
0.0027 0.0012 0.0022 0.0031 0.0013 0.0012
ND ND ND ND ND ND
84 268 98 134 126 72
0.23 0.21 2 4.9 3.9 0.75
NA ND NA NA NA NA
ND NA 0.0012 NA 0.00064 ND
NA NA NA 0.001 NA NA
ND ND ND 0.0015 ND ND
0.0017 0.0013 0.0018 0.0026 0.0013 0.0011
1 8 43 58 26 4
ND ND 0.01 0.084 0.02 0.0087
ND ND ND 0.002702 0.000875 ND
0.031 ND ND ND ND ND
ND ND ND ND 0.2 ND
ND ND ND ND 0.2 ND
ND ND ND ND ND ND
0.008 0.015 0.091 0.1 0.12 0.034
Notes:
NA - Not Analyzed either due to unsafe sampling conditions, insufficient water quantity at the site or for other reasons.
ND - Not DetectedR:\SEI\Orefinders\121-01_Environmental Monitoring for Baseline Studies\121-01-04_SW and GW Program\ss\Orefin

Table 4.3.2.3 Provincial Water Quality Objective (PWQO)
Exceedances Sorted by Surface Water Sample Site
Sample Site Units Parameter
Water
Quality
Objective
Lower
Limit
Water
Quality
Objective
Upper
Limit
Sample Date
Total
Number of
Samples
Water Quality
Objective
Exceedance
(Yes=1 or No=0)Total
MM3 mg/L Total Iron (Fe) - 0.3 16/10/2013 3 1 0.31
17/04/2014 3 1 0.57
25/06/2014 3 1 0.40
MOU1 mg/L Total Iron (Fe) - 0.3 16/10/2013 6 1 0.31
13/12/2013 6 1 1.10
20/02/2014 6 1 4.00
17/04/2014 6 1 0.88
25/06/2014 6 1 0.60
Dissolved (0.2u) Aluminum (Al) - 0.075 13/12/2013 6 1 0.11
17/04/2014 6 1 0.11
Dissolved Oxygen (Field) 6 - 25/06/2014 5 1 5.74
8 - 13/12/2013 5 1 5.34
20/02/2014 5 1 4.16
Total Phosphorus - 0.03 17/04/2014 6 1 0.036
Pit 1 mg/L Dissolved Oxygen (Field) 8 - 20/02/2014 6 1 7.22
17/04/2014 6 1 7.89
Pit 2 mg/L Dissolved Oxygen (Field) 8 - 20/02/2014 5 1 5.61
17/04/2014 5 1 5.18
Total Copper (Cu) - 0.005 13/12/2013 6 1 0.007
Trench 1 mg/L Total Iron (Fe) - 0.3 16/10/2013 4 1 2.00
13/12/2013 4 1 4.90
17/04/2014 4 1 3.90
25/06/2014 4 1 0.75
Dissolved (0.2u) Aluminum (Al) - 0.075 13/12/2013 4 1 0.10
17/04/2014 4 1 0.08
Dissolved Oxygen (Field) 6 - 16/10/2013 4 1 5.54
8 - 13/12/2013 4 1 3.24
17/04/2014 4 1 2.74
5 - 25/06/2014 4 1 4.10
Total Cadmium (Cd) - 0.0001 13/12/2013 4 1 0.00014
Total Zinc (Zn) - 0.02 13/12/2013 4 1 0.08
Total Phosphorus - 0.03 16/10/2013 4 1 0.09
13/12/2013 4 1 0.10
17/04/2014 4 1 0.12
25/06/2014 4 1 0.03
MM2 mg/L Total Iron (Fe) - 0.3 13/12/2013 6 1 0.41
17/04/2014 6 1 0.45
25/06/2014 6 1 0.40
Dissolved (0.2u) Aluminum (Al) - 0.075 13/12/2013 6 1 0.079
Total Zinc (Zn) - 0.02 17/04/2014 6 1 0.04
Total Copper (Cu) - 0.005 16/10/2013 6 1 0.007
s.u. pH (Field) 6.5 8.5 13/12/2013 5 1 8.94
LLT mg/L Total Iron (Fe) - 0.3 18/10/2013 2 1 0.45
26/06/2014 2 1 1.30
Dissolved (0.2u) Aluminum (Al) - 0.075 18/10/2013 2 1 0.090
Dissolved Oxygen (Field) 5 - 26/06/2014 2 1 4.35
MM0 mg/L Total Iron (Fe) - 0.3 26/06/2014 2 1 0.35
MM1 mg/L Total Iron (Fe) - 0.3 26/06/2014 2 1 0.34
MOU2 mg/L Total Iron (Fe) - 0.3 23/10/2013 6 1 0.79
13/12/2013 6 1 1.40
21/02/2014 6 1 4.60
17/04/2014 6 1 1.10
25/06/2014 6 1 0.62
Dissolved (0.2u) Aluminum (Al) - 0.075 13/12/2013 6 1 0.12
17/04/2014 6 1 0.11
Dissolved Oxygen (Field) 6 - 25/06/2014 5 1 3.60
8 - 21/02/2014 5 1 7.91
Total Phosphorus - 0.03 21/02/2014 6 1 0.07
17/04/2014 6 1 0.04
APPENDIX B

Table 4.4.1.3.1 Orefinders Mirado Site Well Information
10-Dec-13 18-Feb-14 18-Apr-14 23-Jun-14
MW1-BR E 587465 N 5318520 30-Oct-13 296.423 297.275 293.525 293 292.708 290.878
MW1-OB E 587469 N 5318512 30-Oct-13 296.659 297.392 294.192 293.77 294.119 294.4
MW2-BR E 587519 N 5318267 06-Nov-13 289.506 290.441 276.411 275.92 275.341 276.629
MW2-OB E 587521 N 5318267 04-Nov-13 289.522 290.446 275.826 275.65 275.276 276.463
MW3-D E 587190 N 5317971 13-Nov-13 289.305 290.215 269.741 270.80 270.665 270.68
MW3-S E 587189 N 5317972 13-Nov-13 289.305 290.241 286.581 285.62 285.971 286.155
MW4-BR E 587074 N 5318358 15-Nov-13 290.648 291.650 282.696 282.21 281.935 282.594
MW4-OB-D E 587074 N 5318348 19-Nov-19 290.648 291.519 282.369 282.10 dry 282.514
MW4-OB-S E 587077 N 5318343 19-Nov-19 290.648 291.559 289.603 287.62 290.309 289.617
MW5 E 587825 N 5318699 20-Nov-13 288.312 289.240 284.025 283.67 283.691 284.118
MWT1-OB E 587597 N 5318861 20-Nov-13 291.203 292.128 290.52 289.53 289.787 290.048
MWT1-Sat E 587596 N 5318855 20-Nov-13 291.203 291.999 290.721 dry 290.385 290.189
MW-BG E 585929 N 5317754 21-Nov-13 281.049 281.895 278.698 278.46 278.510 278.525
Notes:dry - no groundwater present in monitoring well
masl - metres above sea level
Groundwater Elevations (masl)
Well ID UTM Coordinates for Well (NAD83, Zone 17) Date of Installation Grade Elevation (masl) Monitoring Well Elevation (masl)
APPENDIX B

Table 4.4.2.1 Groundwater Analytical Results
Max of Reported Value Sample Site
MW1-BR MW1-OB MW2-BR MW2-OB MW3-D
Dec Feb Apr Jun Dec Feb Apr Jun Dec Feb Apr Jun Dec Feb Apr Jun Dec
Parameter Units Table 2: Potable
GW Standards
Table 3: Non-
Potable GW
Standards
Minimum
RDL
Maximum
RDL 2013 2014 2014 2014 2013 2014 2014 2014 2013 2014 2014 2014 2013 2014 2014 2014 2013
Conductivity (Field) µS/cm 558.1 584.7 613.2 611.5 218.9 153.4 185.9 134.4 459.5 417.5 637.9 NA 446.1 449.4 461.3 419.5 454.7
Dissolved Oxygen (Field) mg/L 7.32 7.2 6.04 5.06 7.53 10.99 7.59 4.68 6.02 6.62 6.56 NA 6.45 6.47 8.49 4.88 7.03
pH (Field) s.u. 7.24 7.74 7.63 7.56 7.06 6.61 7.17 6.84 7.53 7.87 7.75 NA 7.33 7.44 7.47 7.28 7.69
Temperature (Field) °C 3.6 5.1 5.4 7.9 3.2 2.5 2 7 4.2 5.2 5.2 NA 5.7 6.1 5.9 7.3 3.2
Unionized Ammonia (Calculated) mg/L ND 0.000405 ND ND ND 0.000032 ND ND ND 0.00066 ND NA 0.000239 0.000374 0.000788 0.000279 0.000419
ORP mV 113.3 129 32.2 -2.1 188.4 260.2 140 169.7 17.9 181.5 16.4 NA 32.2 131.6 143.6 89.5 11.5
Acidity as CaC03 mg/L 10 10 ND 24 14 ND ND 12 19 30 ND ND ND 10 ND 13 30 10 52
Alkalinity (Total as CaCO3) mg/L 1 1 200 200 220 220 72 69 87 53 170 170 180 180 190 190 200 200 220
Dissolved Sulphate (SO4) mg/L 1 5 84 120 120 110 21 16 22 14 70 45 230 99 40 48 49 36 22
Free Cyanide mg/L 0.002 0.002 ND ND ND ND ND ND ND ND ND ND ND ND 0.0033 ND ND ND ND
Hardness (CaCO3) mg/L 1 1 230 250 290 310 75 67 100 56 200 180 200 190 230 210 250 230 230
Mercury (Hg) mg/L 0.001 0.0028 0.0001 0.0001 ND ND ND ND ND ND ND ND ND ND ND ND ND ND ND ND ND
Total Ammonia-N mg/L 0.05 0.05 ND 0.059 0.096 ND ND 0.078 0.11 ND ND 0.071 0.08 ND 0.085 0.1 0.2 0.098 0.08
Total Cyanide (CN) mg/L 0.066 0.066 0.005 0.05 ND ND ND ND ND ND ND ND ND ND ND ND ND ND ND ND ND
Total Dissolved Solids mg/L 10 10 334 404 464 406 124 154 234 160 280 268 550 282 258 266 324 274 258
Total Suspended Solids mg/L 10 1000 290 250 220 240 150000 160000 290000 12000 540 330 14 26 20000 11000 14000 11000 7800
Dissolved Calcium (Ca) mg/L 0.2 1 63 67 78 84 20 18 27 15 60 54 64 62 68 64 76 69 63
Dissolved Magnesium (Mg) mg/L 0.05 0.05 18 20 23 24 6.3 5 8.6 4.3 11 9.6 11 9.1 14 13 15 13 18
Dissolved Aluminum (Al) mg/L 0.005 0.005 0.0091 0.009 ND 0.01 0.17 0.072 0.074 0.043 0.0095 0.0075 0.005 ND ND ND 0.017 0.0063 0.012
Dissolved Arsenic (As) mg/L 0.025 1.9 0.001 0.001 ND 0.001 0.0011 ND ND ND ND ND ND ND ND ND ND ND ND ND ND
Dissolved Cadmium (Cd) mg/L 0.0027 0.0027 0.0001 0.0001 ND ND ND ND ND ND 0.00013 0.00021 ND ND ND ND ND ND ND ND ND
Dissolved Copper (Cu) mg/L 0.087 0.087 0.001 0.001 ND ND ND ND 0.0017 0.0012 0.0012 0.0011 ND ND ND ND 0.0011 0.007 0.0015 0.0023 0.0022
Dissolved Iron (Fe) mg/L 0.1 0.1 ND ND ND 0.15 0.12 ND ND ND 0.13 ND ND ND ND ND ND ND ND
Dissolved Lead (Pb) mg/L 0.01 0.025 0.0005 0.0005 ND ND ND ND ND ND ND ND ND ND ND ND ND ND ND ND ND
Dissolved Molybdenum (Mo) mg/L 0.07 9.2 0.0005 0.0005 0.0026 0.0023 0.002 0.0015 ND ND ND ND 0.0022 0.0024 0.007 0.0071 0.0044 0.0025 0.0025 0.0019 0.034
Dissolved Nickel (Ni) mg/L 0.1 0.49 0.001 0.002 0.001 ND ND ND 0.0057 0.0098 0.0098 0.005 0.0018 0.0013 ND 0.0014 0.016 0.012 0.0086 0.0055 0.027
Dissolved Zinc (Zn) mg/L 1.1 1.1 0.005 0.01 ND 0.018 ND ND 0.0072 0.0057 0.013 ND ND ND ND ND ND 0.0062 ND 0.006 ND
Dissolved Antimony (Sb) mg/L 0.006 20 0.0005 0.0005 ND ND ND ND ND ND ND ND ND ND ND ND ND ND ND ND ND
Dissolved Barium (Ba) mg/L 1 29 0.002 0.002 0.12 0.14 0.15 0.15 0.01 0.009 0.012 0.0097 0.18 0.13 0.15 0.13 0.035 0.034 0.037 0.035 0.1
Dissolved Beryllium (Be) mg/L 0.0005 0.0005 ND ND ND ND ND ND ND ND ND ND ND ND ND ND ND ND ND
Dissolved Bismuth (Bi) mg/L 0.001 0.001 ND ND ND ND ND ND ND ND ND ND ND ND ND ND ND ND ND
Dissolved Boron (B) mg/L 5 45 0.01 0.01 0.042 0.043 0.045 0.041 ND ND ND ND ND 0.014 0.034 0.036 ND 0.01 ND ND ND
Dissolved Chromium (Cr) mg/L 0.05 0.81 0.005 0.005 ND ND ND ND ND ND ND ND ND ND ND ND ND ND ND ND ND
Dissolved Cobalt (Co) mg/L 0.0038 0.066 0.0005 0.001 ND ND ND ND 0.00059 0.0018 0.0014 0.00052 0.0007 0.00069 0.00067 0.0016 0.0062 0.0024 0.0019 0.00089 0.0018
Dissolved Lithium (Li) mg/L 0.005 0.005 ND ND ND ND ND ND ND ND ND ND ND ND ND ND ND ND 0.007
Dissolved Manganese (Mn) mg/L 0.002 0.002 0.11 0.13 0.12 0.11 0.058 0.26 0.25 0.062 0.4 0.39 0.39 0.42 1.1 0.3 0.35 0.1 0.34
Dissolved Phosphorus (P) mg/L 0.1 0.1 ND ND ND ND ND ND ND ND ND ND ND ND ND ND ND ND ND
Dissolved Potassium (K) mg/L 0.2 0.2 1.9 1.9 2.2 2.3 ND ND ND ND 1.5 1.4 2.5 2.9 1.8 1.1 1.3 1.2 2.5
Dissolved Selenium (Se) mg/L 0.002 0.002 ND ND ND ND ND ND ND ND ND ND ND ND ND ND ND ND ND
Dissolved Silicon (Si) mg/L 0.05 0.1 5.6 5.7 6.5 6.8 11 11 12 12 7 5.9 6.5 6.2 5.4 4.9 5.3 5.4 4.2
Dissolved Silver (Ag) mg/L 0.0015 0.0015 0.0001 0.0001 ND ND ND ND ND 0.0002 ND ND ND 0.00049 ND ND ND ND ND ND ND
Dissolved Sodium (Na) mg/L 490 2300 0.1 0.1 19 21 24 18 4.9 4 4.9 5.6 10 6.7 110 120 5.4 4.8 5.7 3.5 4.8
Dissolved Strontium (Sr) mg/L 0.001 0.001 0.41 0.42 0.49 0.46 0.04 0.039 0.052 0.034 0.24 0.26 0.59 0.71 0.16 0.16 0.2 0.15 0.12
Dissolved Tellurium (Te) mg/L 0.001 0.001 ND ND ND ND ND ND ND ND ND ND ND ND ND ND ND ND ND
Dissolved Thallium (Tl) mg/L 0.00005 0.00005 ND ND ND ND ND ND ND ND ND ND ND ND ND ND ND ND ND
Dissolved Tin (Sn) mg/L 0.001 0.001 ND ND ND ND ND ND ND ND ND ND ND ND ND ND ND ND ND
Dissolved Titanium (Ti) mg/L 0.005 0.005 ND ND ND ND ND ND ND ND ND ND ND ND ND ND ND ND ND
Dissolved Tungsten (W) mg/L 0.001 0.01 0.05 0.032 0.025 0.013 ND ND ND ND 0.027 0.024 0.027 0.031 0.076 0.077 0.041 0.037 2.6
Dissolved Uranium (U) mg/L 0.02 0.42 0.0001 0.0001 0.0013 0.0018 0.0019 0.00095 ND ND ND ND 0.0013 0.0015 0.009 0.0092 0.00084 0.00062 0.00072 0.00056 0.0038
Dissolved Vanadium (V) mg/L 0.0062 0.25 0.0005 0.0005 0.00097 ND ND ND 0.0016 0.00054 0.00054 ND ND ND ND ND ND ND ND ND ND
Dissolved Zirconium (Zr) mg/L 0.001 0.001 ND ND ND ND ND ND ND ND ND ND ND ND ND ND ND ND ND
Notes:
1) ND: Not detected; RDL: reportable detection limit
R:\SEI\Orefinders\121-01_Environmental Monitoring for Baseline Studies\121-01-19-08-01 Closure Plan\Table 4.4.2.1 Orefinders GW Analytical Results.xlsx Appendix B

Table 4.4.2.1 Groundwater Analytical Results
Max of Reported Value
Parameter Units Table 2: Potable
GW Standards
Table 3: Non-
Potable GW
Standards
Minimum
RDL
Maximum
RDL
Conductivity (Field) µS/cm
Dissolved Oxygen (Field) mg/L
pH (Field) s.u.
Temperature (Field) °C
Unionized Ammonia (Calculated) mg/L
ORP mV
Acidity as CaC03 mg/L 10 10
Alkalinity (Total as CaCO3) mg/L 1 1
Dissolved Sulphate (SO4) mg/L 1 5
Free Cyanide mg/L 0.002 0.002
Hardness (CaCO3) mg/L 1 1
Mercury (Hg) mg/L 0.001 0.0028 0.0001 0.0001
Total Ammonia-N mg/L 0.05 0.05
Total Cyanide (CN) mg/L 0.066 0.066 0.005 0.05
Total Dissolved Solids mg/L 10 10
Total Suspended Solids mg/L 10 1000
Dissolved Calcium (Ca) mg/L 0.2 1
Dissolved Magnesium (Mg) mg/L 0.05 0.05
Dissolved Aluminum (Al) mg/L 0.005 0.005
Dissolved Arsenic (As) mg/L 0.025 1.9 0.001 0.001
Dissolved Cadmium (Cd) mg/L 0.0027 0.0027 0.0001 0.0001
Dissolved Copper (Cu) mg/L 0.087 0.087 0.001 0.001
Dissolved Iron (Fe) mg/L 0.1 0.1
Dissolved Lead (Pb) mg/L 0.01 0.025 0.0005 0.0005
Dissolved Molybdenum (Mo) mg/L 0.07 9.2 0.0005 0.0005
Dissolved Nickel (Ni) mg/L 0.1 0.49 0.001 0.002
Dissolved Zinc (Zn) mg/L 1.1 1.1 0.005 0.01
Dissolved Antimony (Sb) mg/L 0.006 20 0.0005 0.0005
Dissolved Barium (Ba) mg/L 1 29 0.002 0.002
Dissolved Beryllium (Be) mg/L 0.0005 0.0005
Dissolved Bismuth (Bi) mg/L 0.001 0.001
Dissolved Boron (B) mg/L 5 45 0.01 0.01
Dissolved Chromium (Cr) mg/L 0.05 0.81 0.005 0.005
Dissolved Cobalt (Co) mg/L 0.0038 0.066 0.0005 0.001
Dissolved Lithium (Li) mg/L 0.005 0.005
Dissolved Manganese (Mn) mg/L 0.002 0.002
Dissolved Phosphorus (P) mg/L 0.1 0.1
Dissolved Potassium (K) mg/L 0.2 0.2
Dissolved Selenium (Se) mg/L 0.002 0.002
Dissolved Silicon (Si) mg/L 0.05 0.1
Dissolved Silver (Ag) mg/L 0.0015 0.0015 0.0001 0.0001
Dissolved Sodium (Na) mg/L 490 2300 0.1 0.1
Dissolved Strontium (Sr) mg/L 0.001 0.001
Dissolved Tellurium (Te) mg/L 0.001 0.001
Dissolved Thallium (Tl) mg/L 0.00005 0.00005
Dissolved Tin (Sn) mg/L 0.001 0.001
Dissolved Titanium (Ti) mg/L 0.005 0.005
Dissolved Tungsten (W) mg/L 0.001 0.01
Dissolved Uranium (U) mg/L 0.02 0.42 0.0001 0.0001
Dissolved Vanadium (V) mg/L 0.0062 0.25 0.0005 0.0005
Dissolved Zirconium (Zr) mg/L 0.001 0.001
Notes:
1) ND: Not detected; RDL: reportable detection limit
MW3-S MW4-BR MW4-OB-S MW5
Feb Apr Jun Dec Feb Apr Jun Dec Feb Apr Jun Dec Feb Apr Jun Dec Apr
2014 2014 2014 2013 2014 2014 2014 2013 2014 2014 2014 2013 2014 2014 2014 2013 2014
476 495 497.6 552.2 643.1 677.4 684.6 672.4 596.4 731.2 754.7 698.7 706.4 692.2 693.7 288.2 249.1
5.72 4.97 4.54 9.22 11.51 4.89 4.45 6.99 5.46 5.06 3.53 8.2 8.43 9.46 4.07 20.96 12.35
7.75 7.64 7.71 6.47 7.69 7.43 7.41 7.41 7.46 7.45 7.31 7.27 7.27 7.34 7.18 7.37 7.23
3.6 3.7 6.3 2.1 2.9 4.8 6.2 4.3 4.8 4.8 6.2 5.3 5.4 4.2 5.5 2.4 2.4
0.000491 ND 0.000395 ND 0.000358 ND ND ND 0.000183 ND ND 0.000285 0.000407 ND ND ND ND
163.2 -31.6 -24.9 172.3 200.4 237.7 44.3 76.7 95.1 35.9 -10.3 63.7 172.2 148.5 68.7 204.8 173.5
12 10 ND ND ND ND ND 86 15 19 20 11 ND 19 42 11 ND
230 270 280 270 280 290 290 330 290 350 370 370 380 380 380 110 130
11 6 11 45 59 81 78 39 46 84 53 30 24 26 19 10 10
ND ND ND 0.0047 ND ND ND ND ND ND ND ND ND ND ND ND ND
230 250 280 290 280 300 320 320 280 320 360 370 330 360 380 110 130
ND ND ND ND ND ND ND ND ND ND ND ND ND ND ND ND ND
0.079 0.072 0.056 ND 0.07 0.1 ND ND 0.052 0.057 ND 0.12 0.17 0.16 ND ND 0.13
ND ND ND 0.0059 ND ND ND ND ND ND ND ND ND ND ND ND ND
254 294 274 318 378 444 414 376 404 542 482 392 418 428 404 188 258
6800 2300 1700 4300 3000 2100 1200 590 310 12 2700 9400 12000 5200 580 67000 15000
59 66 72 80 75 82 89 92 82 93 100 100 87 93 100 30 36
19 21 24 22 21 22 25 22 19 21 24 30 27 30 31 7.4 10
ND ND 0.04 0.01 0.0083 0.0063 0.0061 ND ND ND ND 0.015 0.011 0.012 ND 0.012 0.021
ND 0.0016 ND ND ND ND ND 0.001 ND 0.0022 0.0024 ND ND ND ND ND ND
ND ND 0.00022 ND ND ND 0.00022 0.00021 0.00021 0.00019 0.00013 ND ND ND ND ND ND
ND ND 0.0014 0.0017 0.0015 0.0012 0.0018 ND ND ND ND 0.0015 0.0012 0.0015 ND 0.0012 0.0013
ND ND ND ND ND ND ND ND ND ND 0.14 ND ND ND ND ND 0.1
ND ND ND ND ND ND ND ND ND ND ND ND ND ND ND ND ND
0.019 0.016 0.015 0.0017 0.0022 0.0026 0.0026 0.0041 0.0044 0.009 0.01 0.0011 0.0012 0.0011 ND ND ND
0.016 0.015 0.013 ND 0.002 ND ND 0.0025 0.0015 0.0027 0.0029 ND ND ND ND 0.0068 0.0096
0.0072 0.0058 0.0058 ND ND ND 0.016 0.014 ND 0.0054 0.0062 ND 0.0065 ND ND 0.0087 ND
ND ND ND ND ND ND ND ND ND ND ND ND ND ND ND ND ND
0.11 0.14 0.13 0.048 0.051 0.061 0.06 0.11 0.098 0.1 0.13 0.038 0.039 0.042 0.021 0.0067 0.0066
ND ND ND ND ND ND ND ND ND ND ND ND ND ND ND ND ND
ND ND ND ND ND ND ND ND ND ND ND ND ND ND ND ND ND
ND ND ND ND ND ND ND 0.02 0.026 0.04 0.03 ND ND ND ND ND ND
ND ND ND ND ND ND ND ND ND ND ND ND ND ND ND ND ND
0.0013 0.001 0.0012 ND ND ND ND ND ND ND ND ND ND ND ND 0.00069 0.0012
0.0055 0.0052 0.0062 ND ND ND 0.0056 ND ND 0.0078 0.0074 0.0069 0.0072 0.0092 0.0081 ND ND
0.39 0.34 0.26 0.19 0.064 0.049 0.037 0.13 0.11 0.12 0.12 0.024 0.019 0.019 0.074 0.19 0.51
ND ND ND ND ND ND ND ND ND ND ND ND ND ND ND ND ND
2.2 2.3 2.6 1.6 1.5 1.6 1.7 1.3 1.2 1.6 1.6 1.2 0.93 1.2 0.79 ND 0.23
ND ND ND ND ND ND ND ND ND ND ND ND ND ND ND ND ND
5.6 6.1 6.4 4.8 4.7 5 5.5 7.8 7.1 8.3 8.2 9.3 8.9 10 10 13 14
ND ND ND ND 0.00017 ND ND ND ND ND ND ND ND ND ND 0.00012 ND
4.9 6.3 6.4 14 20 27 31 22 27 87 51 20 18 29 15 3.9 4
0.11 0.12 0.12 0.13 0.097 0.11 0.1 0.46 0.48 0.6 0.61 0.12 0.09 0.1 0.099 0.07 0.066
ND ND ND ND ND ND ND ND ND ND ND ND ND ND ND ND ND
ND ND ND ND ND ND ND ND ND ND ND ND ND ND ND ND ND
ND ND ND ND ND ND ND ND ND ND ND ND ND ND ND ND ND
ND ND ND ND ND ND ND ND ND ND ND ND ND ND ND ND ND
0.73 0.33 0.34 0.0021 ND ND 0.0016 0.012 0.0083 0.013 0.0064 ND 0.0038 ND ND ND ND
0.0018 0.0014 0.0012 0.011 0.01 0.011 0.0093 0.0011 0.002 0.0067 0.0047 0.00097 0.00093 0.0011 0.00062 0.00016 ND
ND ND ND 0.0012 0.0008 0.0012 0.0014 ND ND ND ND 0.0012 0.0015 0.0025 0.0029 0.0014 0.0011
ND ND ND ND ND ND ND ND ND ND ND ND ND ND ND ND ND
R:\SEI\Orefinders\121-01_Environmental Monitoring for Baseline Studies\121-01-19-08-01 Closure Plan\Table 4.4.2.1 Orefinders GW Analytical Results.xlsx Appendix B

Table 4.4.2.1 Groundwater Analytical Results
Max of Reported Value
Parameter Units Table 2: Potable
GW Standards
Table 3: Non-
Potable GW
Standards
Minimum
RDL
Maximum
RDL
Conductivity (Field) µS/cm
Dissolved Oxygen (Field) mg/L
pH (Field) s.u.
Temperature (Field) °C
Unionized Ammonia (Calculated) mg/L
ORP mV
Acidity as CaC03 mg/L 10 10
Alkalinity (Total as CaCO3) mg/L 1 1
Dissolved Sulphate (SO4) mg/L 1 5
Free Cyanide mg/L 0.002 0.002
Hardness (CaCO3) mg/L 1 1
Mercury (Hg) mg/L 0.001 0.0028 0.0001 0.0001
Total Ammonia-N mg/L 0.05 0.05
Total Cyanide (CN) mg/L 0.066 0.066 0.005 0.05
Total Dissolved Solids mg/L 10 10
Total Suspended Solids mg/L 10 1000
Dissolved Calcium (Ca) mg/L 0.2 1
Dissolved Magnesium (Mg) mg/L 0.05 0.05
Dissolved Aluminum (Al) mg/L 0.005 0.005
Dissolved Arsenic (As) mg/L 0.025 1.9 0.001 0.001
Dissolved Cadmium (Cd) mg/L 0.0027 0.0027 0.0001 0.0001
Dissolved Copper (Cu) mg/L 0.087 0.087 0.001 0.001
Dissolved Iron (Fe) mg/L 0.1 0.1
Dissolved Lead (Pb) mg/L 0.01 0.025 0.0005 0.0005
Dissolved Molybdenum (Mo) mg/L 0.07 9.2 0.0005 0.0005
Dissolved Nickel (Ni) mg/L 0.1 0.49 0.001 0.002
Dissolved Zinc (Zn) mg/L 1.1 1.1 0.005 0.01
Dissolved Antimony (Sb) mg/L 0.006 20 0.0005 0.0005
Dissolved Barium (Ba) mg/L 1 29 0.002 0.002
Dissolved Beryllium (Be) mg/L 0.0005 0.0005
Dissolved Bismuth (Bi) mg/L 0.001 0.001
Dissolved Boron (B) mg/L 5 45 0.01 0.01
Dissolved Chromium (Cr) mg/L 0.05 0.81 0.005 0.005
Dissolved Cobalt (Co) mg/L 0.0038 0.066 0.0005 0.001
Dissolved Lithium (Li) mg/L 0.005 0.005
Dissolved Manganese (Mn) mg/L 0.002 0.002
Dissolved Phosphorus (P) mg/L 0.1 0.1
Dissolved Potassium (K) mg/L 0.2 0.2
Dissolved Selenium (Se) mg/L 0.002 0.002
Dissolved Silicon (Si) mg/L 0.05 0.1
Dissolved Silver (Ag) mg/L 0.0015 0.0015 0.0001 0.0001
Dissolved Sodium (Na) mg/L 490 2300 0.1 0.1
Dissolved Strontium (Sr) mg/L 0.001 0.001
Dissolved Tellurium (Te) mg/L 0.001 0.001
Dissolved Thallium (Tl) mg/L 0.00005 0.00005
Dissolved Tin (Sn) mg/L 0.001 0.001
Dissolved Titanium (Ti) mg/L 0.005 0.005
Dissolved Tungsten (W) mg/L 0.001 0.01
Dissolved Uranium (U) mg/L 0.02 0.42 0.0001 0.0001
Dissolved Vanadium (V) mg/L 0.0062 0.25 0.0005 0.0005
Dissolved Zirconium (Zr) mg/L 0.001 0.001
Notes:
1) ND: Not detected; RDL: reportable detection limit
MW-BG MWT1-OB MWT1-Sat
Jun Dec Feb Apr Jun Dec Feb Apr Jun Dec Apr Jun
2014 2013 2014 2014 2014 2013 2014 2014 2014 2013 2014 2014
144.4 133.6 115.7 116.7 124.7 1618 1634 1408 146.4 453.6 2598 2510
6.48 5.06 9.97 10.52 7.51 5.36 5.84 5.49 4.38 4.27 7.55 5.53
6 6.72 7.29 6.84 7.15 6.79 7.04 7.01 6.77 6.91 7.18 6.99
6.5 3.5 3.1 0.2 7 3.3 4 2.9 7.5 0.4 0.7 12.7
0.000007 0.000053 0.00016 ND ND 0.00147 0.002642 ND 0.002062 ND ND ND
139.9 171.8 198.7 283.6 121.4 68.2 113.5 12.4 4.6 179.7 62.3 -7.8
14 ND ND 10 11 26 58 54 63 217 27 NA
93 51 43 46 54 330 310 310 310 210 200 NA
10 18 16 17 13 720 650 550 540 1300 1400 NA
ND ND ND ND ND ND ND ND ND 0.015 0.0085 NA
67 49 38 47 48 970 870 890 920 1700 1600 NA
ND ND ND ND ND ND ND ND ND ND ND NA
0.051 0.092 0.077 0.089 ND 2.2 2.1 2.8 2.3 0.41 0.24 NA
ND 0.0071 ND ND ND 0.36 0.3 0.69 0.28 0.35 0.21 NA
132 394 200 266 254 1300 1330 1170 1200 2310 2420 NA
5400 50000 3500 2200 2800 4400 5700 14000 4500 14000 1700 NA
18 12 9.1 11 12 310 290 290 300 560 570 610
5.3 4.4 3.7 4.9 4.6 44 36 38 41 60 56 58
0.013 0.49 0.2 0.087 0.074 ND ND 0.008 0.0081 ND ND 0.021
ND ND ND ND ND 0.0012 ND 0.0014 0.0012 ND ND ND
0.00023 0.00016 ND ND 0.00015 ND ND ND 0.00025 0.0005 0.0092 0.0019
0.0011 0.006 0.0034 0.0025 0.0027 ND ND ND ND ND 0.0026 0.0012
ND 1.7 0.5 0.19 0.18 0.64 ND 1 0.93 0.28 0.4 0.38
ND 0.0014 ND ND ND ND ND ND ND ND ND ND
ND ND 0.0005 0.00054 0.00061 ND 0.0008 ND ND 0.0018 0.00061 0.00098
0.0054 0.016 0.011 0.0096 0.0076 0.0026 0.0016 0.0014 0.0021 0.0058 0.028 0.091
0.0062 0.031 0.0098 0.0062 0.007 0.3 0.6 0.27 0.23 2.3 5.7 3.6
ND ND ND ND ND ND ND ND ND ND ND ND
0.0077 0.036 0.026 0.026 0.027 0.04 0.032 0.025 0.033 0.015 0.011 0.015
ND ND ND ND ND ND ND ND ND ND ND ND
ND ND ND ND ND ND ND ND ND ND ND ND
ND ND ND ND ND 0.098 0.069 0.064 0.076 0.041 0.046 0.054
ND 0.0066 ND ND ND ND ND ND ND ND ND ND
0.00094 0.0058 0.0041 0.0038 0.0024 0.0045 0.0054 0.0023 0.0031 0.0032 0.014 0.01
ND ND ND ND ND ND ND ND ND 0.0056 0.0057 0.0076
0.12 0.38 0.34 0.35 0.19 4.7 3.3 3 3.6 8.7 7.7 7.7
ND ND ND ND ND ND ND ND ND ND ND ND
ND 0.8 0.75 0.75 0.91 1.7 1.6 1.6 1.8 4.3 3.1 4.4
ND ND ND ND ND ND ND ND ND ND ND ND
13 6.9 6.1 6.8 7.3 7.7 5.4 5.3 7.1 6.5 5.1 5.8
ND ND 0.00012 ND ND ND ND ND ND 0.00014 ND ND
4 8.9 6.8 6.7 6.8 15 6.8 5.6 8.9 2.9 5.1 14
0.035 0.054 0.04 0.048 0.045 0.69 0.51 0.53 0.54 1 1 1
ND ND ND ND ND ND ND ND ND ND ND ND
ND ND ND ND ND ND ND ND ND ND ND ND
ND ND ND ND ND ND ND ND ND ND ND ND
ND 0.046 0.014 0.0059 0.0058 ND ND ND ND ND ND ND
ND ND ND ND ND ND 0.0011 ND ND ND ND ND
ND 0.00016 ND ND ND 0.0028 0.0017 0.0011 0.0018 0.00037 0.00031 0.00035
ND 0.0036 0.0011 0.00051 0.00051 0.0013 ND ND 0.00064 0.00085 ND ND
ND ND ND ND ND ND ND ND ND ND ND ND
R:\SEI\Orefinders\121-01_Environmental Monitoring for Baseline Studies\121-01-19-08-01 Closure Plan\Table 4.4.2.1 Orefinders GW Analytical Results.xlsx Appendix B

Table 4.6.2.1: Benthic Invertebrate Analysis
South Pit
MOU2 MOU1 PIT
1 2 3 1 2 3 1 2 3 1 1 1
Substrateclay and
sand
clay and
sand
clay and
sand
sand and
clay
sand and
clay
sand and
clay
cobble
and
gravel
boulder
with
cobble
and
boulder
with
cobble
and
clay and
sand
sand and
gravel
clay and
sand
Depth (m) 4 5 4 5 5 4 1.5 0.25 0.75 0.6 0.5 0.6
Total Density (#/m2) 1163 890 1737 847 416 1335 53 91 143 76 404 812
Taxon Richness (species level) 22 17 16 17 8 21 29 29 48 31 37 32
Simpson's Diversity Index 0.87 0.78 0.81 0.91 0.68 0.86 0.93 0.94 0.93 0.95 0.91 0.90
Simpson's Evenness 0.34 0.27 0.32 0.65 0.39 0.33 0.53 0.59 0.32 0.63 0.29 0.30
Total EPT 488 459 574 431 287 431 15 20 109 7 73 139
% EPT 42% 52% 33% 51% 69% 32% 28% 22% 76% 10% 18% 17%
% Chironomids 41% 13% 33% 29% 24% 55% 35% 34% 10% 33% 65% 34%
Notes:
EPT: Total Ephemeroptera, Plecoptera, and Trichoptera
Taxon Richness: maximum number of species found at site
#/m2: number of organisms per square metre
MM1Station
Misema River Mousseau Creek
MM0 MM3
R:\SEI\Orefinders\121-01_Environmental Monitoring for Baseline Studies\121-01-10_Benthic Work\ss\Orefinders Benthic Results_for closure plan

Table 4.6.2.2: Benthic Invertebrate Analysis - Site Averages
South Pit
Station MM0 MM1 MM3 MOU2 MOU1 PIT
Substrateclay and
sand
sand and
clay
boulder with
cobble and
gravel
clay and
sand
sand and
gravel
clay and
sand
Depth (m) 4.3 4.7 0.8 0.6 0.5 0.6
Total Density (#/m2) 1263 866 96 76 404 812
Taxon Richness (species level) 18 15 35 31 37 32
Simpson's Diversity Index 0.82 0.81 0.94 0.95 0.91 0.90
Simpson's Evenness 0.31 0.46 0.48 0.63 0.29 0.30
Total EPT 507 383 48 7 73 139
% EPT 42% 51% 42% 10% 18% 17%
% Chironomids 29% 36% 26% 33% 65% 34%
Notes:
EPT: Total Ephemeroptera, Plecoptera, and Trichoptera
Taxon Richness: maximum number of species found at site
#/m2: number of organisms per square metre
Misema River Mousseau Creek
R:\SEI\Orefinders\121-01_Environmental Monitoring for Baseline Studies\121-01-10_Benthic Work\ss\Orefinders Benthic Results_for closure plan

TABLE 4.7.1.4 Orefinders Air Monitoring - Dustfall Results
Units RDL AAQCBoston
CreekMirado Background BLANK
Insoluble Particulate g/m2/30days 0.3 mg - 0.19 0.16 0.11 <0.04
Soluble Particulate g/m2/30days 2.0 mg - 0.96 0.91 0.69 0.64
Total Particulate g/m2/30days - 7 1.15 1.07 0.80 0.64
Insoluble Particulate g/m2/30days 0.3 mg - 0.05 0.06 0.06 <0.04
Soluble Particulate g/m2/30days 2.0 mg - 0.45 0.42 0.52 0.50
Total Particulate g/m2/30days - 7 0.50 0.48 0.58 0.50
Insoluble Particulate g/m2/30days 0.3 mg - <0.04 0.15 <0.04 <0.04
Soluble Particulate g/m2/30days 2.0 mg - 0.27 0.40 0.32 <0.24
Total Particulate g/m2/30days - 7 0.27 0.55 0.32 <0.28
Insoluble Particulate g/m2/30days 0.3 mg - 0.39 0.23 0.21 <0.04
Soluble Particulate g/m2/30days 2.0 mg - 0.26 0.28 <0.04 <0.24
Total Particulate g/m2/30days - 7 0.65 0.51 0.21 <0.28
Insoluble Particulate g/m2/30days 0.3 mg* - 0.71 0.49 12.73 <0.04
Soluble Particulate g/m2/30days 2.0 mg - 0.48 0.41 6.29 <0.24
Total Particulate g/m2/30days - 7 1.19 0.90 19.02 <0.28
Insoluble Particulate g/m2/30days 0.3 mg** - 3.00 0.77 0.82 <0.04
Soluble Particulate g/m2/30days 2.0 mg - 0.69 0.39 0.36 <0.24
Total Particulate g/m2/30days - 7 3.69 1.16 1.18 <0.28
Insoluble Particulate g/m2/30days 0.3 mg - 0.37 0.53 0.51 <0.04
Soluble Particulate g/m2/30days 2.0 mg - 0.28 0.44 0.62 <0.24
Total Particulate g/m2/30days - 7 0.66 0.96 1.13 <0.28
Notes:
Area used in calculations 0.00833 m2
(top of jar exposed to atmosphere)
Soluble particulate in blank caused by preservative lab uses in jars (copper sulphate)
Ontario's Ambient Air Quality Criteria, Standards Development Branch Ontario Ministry of the Environment, February 2008
*RDL increased to 2.7 mg for Background site (multiple filters used at lab due to increased amount of particulates)
**RDL increased to 0.6 µg for Boston Creek site (multiple filters used at lab due to increased amount of particulates)
Indicates exceedance of AAQC
June 2014
July 2014
January 2014
February 2014
March 2014
April 2014
May 2014
STORY ENVIRONMENTAL INC.
R:\SEI\Orefinders\121-01_Environmental Monitoring for Baseline Studies\121-01-08_Air, Noise, Weather\121-01-08_Air Quality Monitoring\ss_pdf\Orefinders_Dustfall Results_for CP

Table 4.7.1.2 Orefinders Air Monitoring - Mirado Site TSP and Metals Results
Flo
wR
ate
To
tal
Su
sp
en
ded
Part
icu
late
s
Alu
min
um
(Al)
An
tim
on
y
(Sb
)
Ars
en
ic(A
s)
Bari
um
(Ba)
Bery
lliu
m
(Be)
Bis
mu
th(B
i)
Bo
ron
(B)
Cad
miu
m
(Cd
)
Calc
ium
(Ca)
Ch
rom
ium
(Cr)
Co
balt
(Co
)
Co
pp
er
(Cu
)
Iro
n(F
e)
Lead
(Pb
)
Mag
nesiu
m
(Mg
)
Man
gan
ese
(Mn
)
Mo
lyb
den
um
(Mo
)
Nic
kel
(Ni)
Ph
osp
ho
rus
(P)
Po
tassiu
m
(K)
Sele
niu
m
(Se)
Sil
ico
n(S
i)
Sil
ver
(Ag
)
So
diu
m(N
a)
Str
on
tiu
m
(Sr)
Su
lph
ur
(S)
Th
all
ium
(Tl)
Tin
(Sn
)
Tit
an
ium
(Ti)
Van
ad
ium
(V)
Zin
c(Z
n)
L/min µg/m3
µg/m3
µg/m3
µg/m3
µg/m3
µg/m3
µg/m3
µg/m3
µg/m3
µg/m3
µg/m3
µg/m3
µg/m3
µg/m3
µg/m3
µg/m3
µg/m3
µg/m3
µg/m3
µg/m3
µg/m3
µg/m3
µg/m3
µg/m3
µg/m3
µg/m3
µg/m3
µg/m3
µg/m3
µg/m3
µg/m3
µg/m3
13-Dec-13 5.07 ND ND ND ND ND ND ND ND ND ND ND ND ND ND ND ND ND ND ND ND ND ND 3.34 ND ND ND 0.53 ND ND ND ND ND
19-Dec-13 5.22 ND ND ND ND ND ND ND ND ND 0.92 ND ND ND ND ND ND ND ND ND ND ND ND 3.05 ND ND ND 0.47 ND ND ND ND ND
25-Dec-13 - - - - - - - - - - - - - - - - - - - - - - - - - - - - - - - - -
31-Dec-13 - - - - - - - - - - - - - - - - - - - - - - - - - - - - - - - - -
6-Jan-14 5.18 ND ND ND ND ND ND ND ND ND 0.78 ND ND ND ND ND ND ND ND ND ND ND ND 3.44 ND 0.86 ND 0.82 ND ND ND ND ND
12-Jan-14 5.37 ND ND ND ND ND ND ND ND ND 0.83 0.66 ND ND 1.59 ND ND 0.04 ND 0.56 ND ND ND 3.44 ND ND ND 0.74 ND ND ND ND ND
18-Jan-14 5.21 80 ND ND ND ND ND ND ND ND ND ND ND ND ND ND ND ND ND ND ND ND ND 3.28 ND ND ND 0.67 ND ND ND ND ND
24-Jan-14 - - - - - - - - - - - - - - - - - - - - - - - - - - - - - - - - -
30-Jan-14 5.30 39.3 ND ND ND ND ND ND ND ND ND ND ND ND ND ND ND ND ND ND ND ND ND 2.83 ND ND ND 0.67 ND ND ND ND ND
5-Feb-14 5.13 ND ND ND ND ND ND ND ND ND ND ND ND ND ND ND ND ND ND ND ND ND ND 3.22 ND ND ND ND ND ND ND ND ND
11-Feb-14 5.19 ND ND ND ND ND ND ND ND ND ND ND ND ND ND ND ND ND ND ND ND ND ND 2.81 ND 0.68 ND 0.40 ND ND ND ND ND
17-Feb-14 5.19 40 ND ND ND ND ND ND ND ND ND ND ND ND ND ND ND ND ND ND ND ND ND 3.19 ND ND ND ND ND ND ND ND ND
23-Feb-14 5.28 52.6 ND ND ND ND ND ND ND ND ND ND ND ND ND ND ND ND ND ND ND ND ND 3.07 ND ND ND 0.51 ND ND ND ND ND
1-Mar-14 5.20 ND ND ND ND ND ND ND ND ND ND ND ND ND ND ND ND ND ND ND ND ND ND 2.22 ND ND ND 0.64 ND ND ND ND ND
7-Mar-14 - - - - - - - - - - - - - - - - - - - - - - - - - - - - - - - - -
13-Mar-14 5.28 ND ND ND ND ND ND ND ND ND ND ND ND ND ND ND ND ND ND ND ND ND ND 2.91 ND 0.76 ND 0.39 ND ND ND ND ND
19-Mar-14 - - - - - - - - - - - - - - - - - - - - - - - - - - - - - - - - -
25-Mar-14 5.24 ND ND ND ND ND ND ND ND ND ND ND ND ND ND ND ND ND ND ND ND ND ND 2.90 ND ND ND 0.64 ND ND ND ND ND
31-Mar-14 - - - - - - - - - - - - - - - - - - - - - - - - - - - - - - - - -
6-Apr-14 5.36 90.8 ND ND ND ND ND ND ND ND ND ND ND ND ND ND ND ND ND ND ND ND ND 1.84 ND 1.28 ND 0.71 ND ND ND ND 0.10
12-Apr-14 5.05 96.3 ND ND ND ND ND ND ND ND ND ND ND ND ND ND ND ND ND ND ND ND ND 1.73 ND ND ND 0.44 ND ND ND ND ND
18-Apr-14 5.08 95.8 ND ND ND ND ND ND ND ND ND ND ND ND ND ND ND ND ND ND ND ND ND 2.02 ND ND ND 0.83 ND ND ND ND ND
24-Apr-14 5.06 54.9 ND ND ND ND ND ND ND ND ND ND ND ND ND ND ND ND ND ND ND ND ND 1.98 ND ND ND 0.48 ND ND ND ND ND
30-Apr-14 5.11 ND ND ND ND ND ND ND ND ND ND ND ND ND ND ND ND ND ND ND ND ND ND 2.53 ND ND ND ND ND ND ND ND ND
6-May-14 5.09 54.5 0.7 ND ND ND ND ND ND ND ND ND ND ND ND ND ND ND ND ND ND ND ND 2.60 ND ND ND ND ND ND ND ND ND
12-May-14 5.11 ND ND ND ND ND ND ND ND ND ND ND ND ND ND ND ND ND ND ND ND ND ND 2.67 ND ND ND ND ND ND ND ND ND
18-May-14 5.14 ND ND ND ND ND ND ND ND ND ND ND ND ND ND ND ND ND ND ND ND ND ND 3.03 ND ND ND 0.61 ND ND ND ND ND
24-May-14 5.22 53.2 ND ND ND ND ND ND ND ND ND ND ND ND ND ND ND ND ND ND ND ND ND 2.85 ND ND ND ND ND ND ND ND ND
40.52 0.37 ND ND ND ND ND ND ND 0.40 0.063 ND ND 0.40 ND ND 0.009 ND 0.045 ND ND ND 2.77 ND 0.45 ND 0.42 ND ND ND ND 0.038
96.3 0.7 ND ND ND ND ND ND ND 0.92 0.66 ND ND 1.59 ND ND 0.04 ND 0.56 ND ND ND 3.44 ND 1.28 ND 0.83 ND ND ND ND 0.1
ND ND ND ND ND ND ND ND ND ND ND ND ND ND ND ND ND ND ND ND ND ND 1.73 ND ND ND ND ND ND ND ND ND
1202
1203
25 0.3 104
0.01 - 120 0.025 105
1.5 0.1 50 4 0.5 1206
2.5 120 2 - - 10 - 1 - 120 - - 10 120 2 120
0 0 0 0 0 0 0 0 0 0 0 0 0 0 0 0 0 0 0 0 0 0 0 0 0 0 0 0 0 0 0 0
22 22 22 22 22 22 22 22 22 22 22 22 22 22 22 22 22 22 22 22 22 22 22 22 22 22 22 22 22 22 22 22
28 28 28 28 28 28 28 28 28 28 28 28 28 28 28 28 28 28 28 28 28 28 28 28 28 28 28 28 28 28 28 28
300 5 1 0.6 0.1 0.1 0.6 0.6 0.2 5 0.5 0.2 0.5 5 0.3 5 0.1 0.3 0.3 2.5 10 1 1 0.5 5 0.1 2.5 1 1 0.1 0.5 0.5
150 2.5 0.5 0.3 0.05 0.05 0.3 0.3 0.1 2.5 0.25 0.1 0.25 2.5 0.15 2.5 0.05 0.15 0.15 1.25 5 0.5 0.5 0.25 2.5 0.05 1.25 0.5 0.5 0.05 0.25 0.25
39 0.69 0.14 0.083 0.014 0.014 0.083 0.083 0.028 0.69 0.069 0.028 0.069 0.69 0.042 0.69 0.014 0.042 0.042 0.35 1.39 0.14 0.14 0.069 0.69 0.014 0.35 0.14 0.14 0.014 0.069 0.069
19.50 0.35 0.069 0.042 0.0069 0.0069 0.042 0.042 0.014 0.35 0.035 0.014 0.035 0.35 0.021 0.35 0.0069 0.021 0.021 0.17 0.69 0.069 0.069 0.035 0.35 0.0069 0.17 0.069 0.069 0.0069 0.035 0.035
79% 79% 79% 79% 79% 79% 79% 79% 79% 79% 79% 79% 79% 79% 79% 79% 79% 79% 79% 79% 79% 79% 79% 79% 79% 79% 79% 79% 79% 79% 79% 79%
Notes:
1 - Ontario's Ambient Air Quality Criteria, Standards Development Branch Ontario Ministry of the Environment, February 2008
2 - Suspended particulate matter (<44 µm diameter)
3 - Aluminum oxide, included here in the absence of a specific elemental criteria
4 - Water soluble barium
5 - Calcium oxide, included here in the absence of a specific elemental criteria
6 - Magnesium oxide, included here in the absence of a specific elemental criteria
Mean calculated using 1/2 detection limit
"-" sampler did not run
No. of Valid Samples
No. of samples
Detection Limit (µg)
1/2 Detection Limit (µg)
% Valid Data
1/2 Detection Limit (µg/m3)
Detection Limit (µg/m3)
Mean
Max
Min
AAQC1
No. of samples > AAQC
STORY ENVIRONMENTAL INC.
R:\SEI\Orefinders\121-01_Environmental Monitoring for Baseline Studies\121-01-08_Air, Noise, Weather\121-01-08_Air Quality Monitoring\ss_pdf\Orefinders_TSP Results_for CP

TABLE 4.7.1.3 Orefinders Air Monitoring - Boston Creek Site TSP and Metals Results
Flo
wR
ate
To
tal
Su
sp
en
ded
Part
icu
late
s
Alu
min
um
(Al)
An
tim
on
y
(Sb
)
Ars
en
ic(A
s)
Bari
um
(Ba)
Bery
lliu
m
(Be)
Bis
mu
th(B
i)
Bo
ron
(B)
Cad
miu
m
(Cd
)
Calc
ium
(Ca)
Ch
rom
ium
(Cr)
Co
balt
(Co
)
Co
pp
er
(Cu
)
Iro
n(F
e)
Lead
(Pb
)
Mag
nesiu
m
(Mg
)
Man
gan
ese
(Mn
)
Mo
lyb
den
um
(Mo
)
Nic
kel
(Ni)
Ph
osp
ho
rus
(P)
Po
tassiu
m
(K)
Sele
niu
m
(Se)
Sil
ico
n(S
i)
Sil
ver
(Ag
)
So
diu
m(N
a)
Str
on
tiu
m
(Sr)
Su
lph
ur
(S)
Th
all
ium
(Tl)
Tin
(Sn
)
Tit
an
ium
(Ti)
Van
ad
ium
(V)
Zin
c(Z
n)
L/min µg/m3
µg/m3
µg/m3
µg/m3
µg/m3
µg/m3
µg/m3
µg/m3
µg/m3
µg/m3
µg/m3
µg/m3
µg/m3
µg/m3
µg/m3
µg/m3
µg/m3
µg/m3
µg/m3
µg/m3
µg/m3
µg/m3
µg/m3
µg/m3
µg/m3
µg/m3
µg/m3
µg/m3
µg/m3
µg/m3
µg/m3
µg/m3
13-Dec-13 5.07 ND ND ND ND ND ND ND ND ND ND ND ND ND ND ND ND ND ND ND ND ND ND 3.03 ND ND ND 0.48 ND ND ND ND ND
19-Dec-13 5.22 ND ND ND ND ND ND ND ND ND ND ND ND ND ND ND ND ND ND ND ND ND ND 2.95 ND ND ND 0.58 ND ND ND ND ND
25-Dec-13 - - - - - - - - - - - - - - - - - - - - - - - - - - - - - - - - -
31-Dec-13 - - - - - - - - - - - - - - - - - - - - - - - - - - - - - - - - -
6-Jan-14 5.18 ND ND ND ND ND ND ND ND ND ND ND ND ND ND ND ND ND ND ND ND ND ND 3.28 ND ND ND 0.58 ND ND ND ND ND
12-Jan-14 5.37 ND ND ND ND ND ND ND ND ND ND ND ND ND ND ND ND ND ND ND ND ND ND 3.45 ND ND ND 1.10 ND ND ND ND ND
18-Jan-14 5.21 ND ND ND ND ND ND ND ND ND ND ND ND ND ND ND ND ND ND ND ND ND ND 2.85 ND ND ND ND ND ND ND ND ND
24-Jan-14 - - - - - - - - - - - - - - - - - - - - - - - - - - - - - - - - -
30-Jan-14 5.30 40.65 ND ND ND ND ND ND ND ND ND ND ND ND ND ND ND ND ND ND ND ND ND 3.13 ND ND ND 0.70 ND ND ND ND ND
5-Feb-14 5.13 56.02 ND ND ND ND ND ND ND ND 0.77 ND ND ND 2.66 ND ND ND ND ND ND ND ND 3.35 ND ND ND 3.28 ND ND ND ND ND
11-Feb-14 - - - - - - - - - - - - - - - - - - - - - - - - - - - - - - - - -
17-Feb-14 5.19 57.64 ND ND ND ND ND ND ND ND ND ND ND ND ND ND ND ND ND ND ND ND ND 3.34 ND ND ND 0.40 ND ND ND ND ND
23-Feb-14 5.28 ND ND ND ND ND ND ND ND ND ND ND ND ND ND ND ND ND ND ND ND ND ND 2.90 ND ND ND 0.57 ND ND ND ND ND
1-Mar-14 5.20 68.78 ND ND ND 0.02 ND ND ND ND ND ND ND ND ND ND ND ND ND ND ND ND ND 2.86 ND ND ND 0.66 ND ND 0.02 ND ND
7-Mar-14 - - - - - - - - - - - - - - - - - - - - - - - - - - - - - - - - -
13-Mar-14 5.28 ND ND ND ND ND ND ND ND ND ND ND ND ND ND ND ND ND ND ND ND ND ND 2.99 ND 1.18 ND 0.60 ND ND ND ND ND
19-Mar-14 - - - - - - - - - - - - - - - - - - - - - - - - - - - - - - - - -
25-Mar-14 5.18 41.61 ND ND ND ND ND ND ND ND 0.83 ND ND ND ND ND ND ND ND ND ND ND ND 3.38 ND ND ND 0.72 ND ND 0.02 ND ND
31-Mar-14 - - - - - - - - - - - - - - - - - - - - - - - - - - - - - - - - -
6-Apr-14 5.18 40.21 ND ND ND ND ND ND ND ND ND ND ND ND ND ND ND ND ND ND ND ND ND 1.93 ND ND ND 0.68 ND ND ND ND ND
12-Apr-14 5.16 80.75 ND ND ND ND ND ND ND ND ND ND ND ND ND ND ND ND ND ND ND ND ND 2.19 ND ND ND 0.42 ND ND ND ND ND
18-Apr-14 5.19 66.93 ND ND ND ND ND ND ND ND ND ND ND ND ND ND ND ND ND ND ND ND ND 2.12 ND ND ND 0.87 ND ND ND ND ND
24-Apr-14 - - - - - - - - - - - - - - - - - - - - - - - - - - - - - - - - -
30-Apr-14 - - - - - - - - - - - - - - - - - - - - - - - - - - - - - - - - -
6-May-14 - - - - - - - - - - - - - - - - - - - - - - - - - - - - - - - - -
12-May-14 5.22 39.95 ND ND ND ND ND ND ND ND ND ND ND ND ND ND ND ND ND ND ND ND ND 2.81 ND ND ND ND ND ND ND ND ND
18-May-14 -* -* -* -* -* -* -* -* -* -* -* -* -* -* -* -* -* -* -* -* -* -* -* -* -* -* -* -* -* -* -* -* -*
24-May-14 -* -* -* -* -* -* -* -* -* -* -* -* -* -* -* -* -* -* -* -* -* -* -* -* -* -* -* -* -* -* -* -* -*
39.32 ND ND ND 0.048 ND ND ND ND 0.40 ND ND ND 0.49 ND ND ND ND ND ND ND ND 2.91 ND 0.40 ND 0.75 ND ND 0.0083 ND ND
80.75 ND ND ND 0.02 ND ND ND ND 0.83 ND ND ND 2.66 ND ND ND ND ND ND ND ND 3.45 ND 1.18 ND 3.28 ND ND ND ND ND
ND ND ND ND ND ND ND ND ND ND ND ND ND ND ND ND ND ND ND ND ND ND ND ND ND ND ND ND ND ND ND ND
1202
1203
25 0.3 104
0.01 - 120 0.025 105
1.5 0.1 50 4 0.5 1206
2.5 120 2 - - 10 - 1 - 120 - - 10 120 2 120
0 0 0 0 0 0 0 0 0 0 0 0 0 0 0 0 0 0 0 0 0 0 0 0 0 0 0 0 0 0 0 0
16 16 16 16 16 16 16 16 16 16 16 16 16 16 16 16 16 16 16 16 16 16 16 16 16 16 16 16 16 16 16 16
28 28 28 28 28 28 28 28 28 28 28 28 28 28 28 28 28 28 28 28 28 28 28 28 28 28 28 28 28 28 28 28
300 5 1 0.6 0.1 0.1 0.6 0.6 0.2 5 0.5 0.2 0.5 5 0.3 5 0.1 0.3 0.3 2.5 10 1 1 0.5 5 0.1 2.5 1 1 0.1 0.5 0.5
150 2.5 0.5 0.3 0.05 0.05 0.3 0.3 0.1 2.5 0.25 0.1 0.25 2.5 0.15 2.5 0.05 0.15 0.15 1.25 5 0.5 0.5 0.25 2.5 0.05 1.25 0.5 0.5 0.05 0.25 0.25
39 0.69 0.14 0.083 0.014 0.014 0.083 0.083 0.028 0.69 0.069 0.028 0.069 0.69 0.042 0.69 0.014 0.042 0.042 0.35 1.39 0.14 0.14 0.069 0.69 0.014 0.35 0.14 0.14 0.014 0.069 0.069
19.50 0.35 0.069 0.042 0.0069 0.0069 0.042 0.042 0.014 0.35 0.035 0.014 0.035 0.35 0.021 0.35 0.0069 0.021 0.021 0.17 0.69 0.069 0.069 0.035 0.35 0.0069 0.17 0.069 0.069 0.0069 0.035 0.035
57% 57% 57% 57% 57% 57% 57% 57% 57% 57% 57% 57% 57% 57% 57% 57% 57% 57% 57% 57% 57% 57% 57% 57% 57% 57% 57% 57% 57% 57% 57% 57%
Notes:
1 - Ontario's Ambient Air Quality Criteria, Standards Development Branch Ontario Ministry of the Environment, February 2008
2 - Suspended particulate matter (<44 µm diameter)
3 - Aluminum oxide, included here in the absence of a specific elemental criteria
4 - Water soluble barium
5 - Calcium oxide, included here in the absence of a specific elemental criteria
6 - Magnesium oxide, included here in the absence of a specific elemental criteria
Mean calculated using 1/2 detection limit
"-" sampler did not run
"-*" sampler did not run, was sent to manufacturure for repair
No. of samples
Detection Limit (µg)
1/2 Detection Limit (µg)
% Valid Data
1/2 Detection Limit (µg/m3)
Detection Limit (µg/m3)
No. of Valid Samples
Mean
Max
Min
AAQC1
No. of samples > AAQC
STORY ENVIRONMENTAL INC.
R:\SEI\Orefinders\121-01_Environmental Monitoring for Baseline Studies\121-01-08_Air, Noise, Weather\121-01-08_Air Quality Monitoring\ss_pdf\Orefinders_TSP Results_for CP

TABLE 4.7.1.4 Orefinders Air Monitoring - Dustfall Results
Units RDL AAQCBoston
CreekMirado Background BLANK
Insoluble Particulate g/m2/30days 0.3 µg - 0.19 0.16 0.11 <0.04
Soluble Particulate g/m2/30days 2.0 µg - 0.96 0.91 0.69 0.64
Total Particulate g/m2/30days - 7 1.15 1.07 0.80 0.64
Insoluble Particulate g/m2/30days 0.3 µg - 0.05 0.06 0.06 <0.04
Soluble Particulate g/m2/30days 2.0 µg - 0.45 0.42 0.52 0.50
Total Particulate g/m2/30days - 7 0.50 0.48 0.58 0.50
Insoluble Particulate g/m2/30days 0.3 µg - <0.04 0.15 <0.04 <0.04
Soluble Particulate g/m2/30days 2.0 µg - 0.27 0.40 0.32 <0.24
Total Particulate g/m2/30days - 7 0.27 0.55 0.32 <0.28
Notes:
Area used in calculations 0.00833 m2
(top of jar exposed to atmosphere)
Soluble particulate in blank caused by preservative lab uses in jars (copper sulphate)
Ontario's Ambient Air Quality Criteria, Standards Development Branch Ontario Ministry of the Environment, February 2008
Indicates exceedance of AAQC
January 2014
February 2014
March 2014
STORY ENVIRONMENTAL INC.
R:\SEI\Orefinders\121-01_Environmental Monitoring for Baseline Studies\121-01-08_Air, Noise, Weather\121-01-08_Air Quality Monitoring\ss_pdf\Orefinders_Dustfall Results.xlsx

TABLE 4.7.1.5 Orefinders Air Monitoring - PASS Results
Units RDL AAQCBoston
CreekMirado
Sulphur Dioxide ppb/30days 0.1 - 0.4 <0.1
Nitrogen Dioxide ppb/30days 0.1 - 0.6 0.7
Sulphur Dioxide ppb/30days 0.1 - 0.5 0.7
Nitrogen Dioxide ppb/30days 0.1 - <0.1 0.3
Sulphur Dioxide ppb/30days 0.1 - 0.4 0.4
Nitrogen Dioxide ppb/30days 0.1 - 0.3 <0.1
Sulphur Dioxide ppb/30days 0.1 - 0.2 0.3
Nitrogen Dioxide ppb/30days 0.1 - 0.1 <0.1
Sulphur Dioxide ppb/30days 0.1 - 0.2 0.2
Nitrogen Dioxide ppb/30days 0.1 - <0.1 0.2
Notes:
There are currently no AAQC for 30 days average time
ppb: parts per billion
May 2014
January 2014
February 2014
March 2014
April 2014
STORY ENVIRONMENTAL INC.
R:\SEI\Orefinders\121-01_Environmental Monitoring for Baseline Studies\121-01-08_Air, Noise, Weather\121-01-08_Air Quality
Monitoring\ss_pdf\Orefinders_PASS Results_for CP

Table 4.8.8: Whole-Rock Major Elemental Analysis Results
MWT1-1 MWT1-2A MWT1-2B
Si % 27.5 26.1 25.7Al % 6.99 7.41 6.35Fe % 2.80 2.68 3.60Mg % 1.85 1.79 1.86Ca % 2.45 2.72 3.06Na % 0.38 0.45 0.35K % 0.90 0.95 0.85Ti % 0.28 0.31 0.28P % 0.03 0.03 0.03Mn % 0.28 0.22 0.30Cr % 0.0068 0.0034 0.0068
LOI % 6.08 8.25 6.63
Sample IDParameter Units
R:\SEI\Orefinders\121-01_Environmental Monitoring for Baseline Studies\121-01-06_Geochemical Studies\ss\ARD_Tailings MW_Result Tables

Tables 4.8.9 and 4.8.10 ICP-OES/MS Strong Acid Digest Elemental Analyses Results
MWT1-1 MWT1-2A MWT1-2B MWT1-1 MWT1-2A MWT1-2B
Ag µg/g 0.51 0.54 0.65 Ag % 0.000051 0.000054 0.000065
Al µg/g 56000 62000 55000 Al % 5.6 6.2 5.5
As µg/g 4.0 3.6 8.3 As % 0.0004 0.00036 0.00083
Ba µg/g 590 630 610 Ba % 0.059 0.063 0.061
Be µg/g 0.45 0.71 0.46 Be % 0.000045 0.000071 0.000046
Bi µg/g 0.61 0.68 0.86 Bi % 0.000061 0.000068 0.000086
Ca µg/g 21000 24000 28000 Ca % 2.1 2.4 2.8
Cd µg/g 21 17 31 Cd % 0.0021 0.0017 0.0031
Co µg/g 20 19 35 Co % 0.002 0.0019 0.0035
Cr µg/g 93 100 81 Cr % 0.0093 0.01 0.0081
Cu µg/g 300 310 480 Cu % 0.03 0.031 0.048
Fe µg/g 50000 48000 65000 Fe % 5 4.8 6.5
K µg/g 19000 20000 19000 K % 1.9 2 1.9
Li µg/g 33 36 31 Li % 0.0033 0.0036 0.0031
Mg µg/g 15000 15000 16000 Mg % 1.5 1.5 1.6
Mn µg/g 2400 2000 2700 Mn % 0.24 0.2 0.27
Mo µg/g 1.4 1.4 2.1 Mo % 0.00014 0.00014 0.00021
Na µg/g 4800 6200 4200 Na % 0.48 0.62 0.42
Ni µg/g 66 64 82 Ni % 0.0066 0.0064 0.0082
P µg/g 530 610 520 P % 0.053 0.061 0.052
Pb µg/g 16 21 22 Pb % 0.0016 0.0021 0.0022
Sb µg/g < 0.8 < 0.8 < 0.8 Sb % NA NA NA
Se µg/g 1.7 1.1 1.2 Se % 0.00017 0.00011 0.00012
Sn µg/g 0.5 0.8 < 0.5 Sn % 0.00005 0.00008 NA
Sr µg/g 150 170 160 Sr % 0.015 0.017 0.016
Ti µg/g 400 970 340 Ti % 0.04 0.097 0.034
Tl µg/g 0.27 0.35 0.27 Tl % 0.000027 0.000035 0.000027
U µg/g 0.37 0.59 0.36 U % 0.000037 0.000059 0.000036
V µg/g 70 74 68 V % 0.007 0.0074 0.0068
Y µg/g 5.0 5.8 5.3 Y % 0.0005 0.00058 0.00053
Zn µg/g 4400 3900 6800 Zn % 0.44 0.39 0.68
Sample ID
Parameter Units
Sample ID
Parameter Units
R:\SEI\Orefinders\121-01_Environmental Monitoring for Baseline Studies\121-01-06_Geochemical Studies\ss\ARD_Tailings MW_Result Tables

Table 4.8.11 Percentage of Total Amount of Soluble Constituents
MWT1-1 MWT1-2A MWT1-2B
Ag % 0.0039 0.015 0.068As % 0.070 0.26 0.029Ba % 0.050 0.099 0.052Be % 0.0089 0.0056 0.0087Bi % 0.0033 0.0029 0.0023Ca % 7.01 1.43 1.19Cd % 0.58 0.0046 0.0034Co % 0.046 0.024 0.021Cr % 0.0011 0.0036 0.0012Cu % 0.0036 0.0039 0.0016Fe % 0.000012 0.00056 0.0000092K % 0.025 0.047 0.037Li % 0.024 0.0056 0.052Mg % 0.17 0.26 0.17Mn % 0.25 0.12 0.29Mo % 0.34 1.78 0.69Na % 0.50 0.82 0.68Ni % 0.067 0.026 0.038Pb % 0.0018 0.0017 0.0051Sb % 0.20 1.90 1.0Se % 0.12 0.18 0.17Sn % 0.032 0.01 0.032Sr % 0.88 0.50 0.50Ti % 0.000050 0.0018 0.00012Tl % 0.015 0.011 0.015U % 0.15 0.54 0.16V % 0.00057 0.016 0.000088Y % 0.0016 0.0034 0.00053Zn % 0.11 0.0013 0.00012
Sample ID
Parameter Units
R:\SEI\Orefinders\121-01_Environmental Monitoring for Baseline Studies\121-01-06_Geochemical Studies\ss\ARD_Tailings MW_Result Tables

Table 4.8.12 Distilled Water Extraction Results
monthly mean grab sample MWT1-1 MWT1-2A MWT1-2B
Sample
weight(g) 200 200 200
Volume mL D.I. H2O 800 800 800
Initial pH units 7.5 8.1 8.6
Final pH units 6.0-9.5 6.0-9.5 7.56 7.29 7.54
Ag mg/L <0.00001 0.00002 0.00011
As mg/L 0.5 1.0 0.0007 0.0023 0.0006
Ba mg/L 0.0732 0.1560 0.0793
B mg/L 0.061 0.426 0.118
Be mg/L <0.00002 <0.00002 <0.00002
Bi mg/L <0.00001 <0.00001 <0.00001
Ca mg/L 368 86 83.5
Cd mg/L 0.0305 0.000196 0.000263
Co mg/L 0.00228 0.00116 0.00184
Cr mg/L <0.0005 0.0009 <0.0005
Cu mg/L 0.3 0.6 0.0027 0.0030 0.0019
Fe mg/L <0.003 0.067 <0.003
K mg/L 1.21 2.37 1.78
Li mg/L 0.002 <0.001 0.004
Mg mg/L 6.53 9.64 6.87
Mn mg/L 1.48 0.616 1.99
Mo mg/L 0.00119 0.00623 0.00360
Na mg/L 6.02 12.7 7.14
Ni mg/L 0.5 1.0 0.0111 0.0042 0.0077
Pb mg/L 0.2 0.4 0.00007 0.00009 0.00028
Sb mg/L 0.0002 0.0019 0.0010
Se mg/L <0.001 <0.001 <0.001
Sn mg/L 0.00004 0.00002 0.00002
Sr mg/L 0.331 0.213 0.198
Ti mg/L <0.0001 0.0043 0.0001
Tl mg/L <0.00002 <0.00002 <0.00002
U mg/L 0.000136 0.000802 0.000146
V mg/L 0.00010 0.00297 <0.00003
W mg/L <0.00003 0.00030 <0.00003
Y mg/L 0.000020 0.000049 0.000007
Zn mg/L 0.5 1.0 1.24 0.013 0.002
Sample IDMMER*
*Department of Justice Canada. 2002. Metal Mining Effluent Regulations, Fisheries Act SOR-2002-222.
Parameter Units
R:\SEI\Orefinders\121-01_Environmental Monitoring for Baseline Studies\121-01-06_Geochemical Studies\ss\ARD_Tailings MW_Result Tables

Table 4.8.13 Modified Acid-Base Accounting Results
Fizz Rate Paste pH total-S Sulphide-S
Acid
Leachable
SO4-S
C CO3 AP TAP NP NNP TNNP NPR TNPR
% % % % %t CaCO3
/1000 t
t CaCO3
/1000 t
t CaCO3
/1000 t
t CaCO3
/1000 t
t CaCO3
/1000 tratio ratio
MWT1-1 2 7.59 2.08 1.41 0.67 1.31 5.2 44.10 65 91 47 26 2.1 1.4
MWT1-2A 2 7.49 1.92 1.58 0.34 2.00 4.7 49.4 60 80 31 20 1.6 1.33
MWT1-2B 2 7.86 4.32 2.90 1.42 1.57 6.41 90.6 135 111 21 -24 1.23 0.82
Maximum 2.0 7.86 4.320 2.900 1.420 2.000 6.410 90.600 135.000 111 46.700 26.000 2.060 1.400
Minimum 2.0 7.49 1.920 1.410 0.340 1.310 4.720 44.100 60.000 80 20.500 -24.000 1.230 0.822
Mean 2.0 7.65 2.773 1.963 0.810 1.627 5.433 61.367 86.667 94.000 32.600 7.333 1.637 1.185
Standard
Deviation0.0 0.2 1.3 0.8 0.6 0.3 0.9 25.5 41.9 15.7 13.2 27.3 0.4 0.3
10th Percentile 2.0 7.510 1.952 1.444 0.406 1.362 4.810 45.160 61.000 82.200 22.520 -15.200 1.308 0.924
Median 2.0 7.590 2.080 1.580 0.670 1.570 5.170 49.400 65.000 91.000 30.600 20.000 1.620 1.333
90th Percentile 2.0 7.806 3.872 2.636 1.270 1.914 6.162 82.360 121.000 107.000 43.480 24.800 1.972 1.387
Count 3 3 3 3 3 3 3 3 3 3 3 3 3 3
AP: Acid Potential
TAP: Total Acid Potential (TAP = total-S * 31.25)
NP: Neutralization Potential
NNP: Net Neutralization Potential
TNNP: Total Net Neutralization Potential ()
NPR: Net Potential Ratio
TNPR: Total Net Potential Ratio (TNPR = NP / TAP)
Sample ID
R:\SEI\Orefinders\121-01_Environmental Monitoring for Baseline Studies\121-01-06_Geochemical Studies\ss\ARD_Tailings MW_Result Tables

Table 4.8.14 Net Acid Generation Testing Results
MWT1-1 MWT1-2A MWT1-2B
Sample weight g 1.5 1.4 1.5
Vol H2O2 mL 150 150 150
Final pH units 7.50 7.64 6.58
NaOH Normality 0.10 0.10 0.10
Vol NaOH to PH 4.5 mL 0.00 0.00 0.00
Vol NaOH to PH 7.0 mL 0.00 0.00 0.33
NAG (pH 4.5) kg H2SO4/tonne 0.0 0.0 0.0
NAG (pH 7.0) kg H2SO4/tonne 0.0 0.0 0.3
Sample ID
Parameter Units
R:\SEI\Orefinders\121-01_Environmental Monitoring for Baseline Studies\121-01-06_Geochemical Studies\ss\ARD_Tailings MW_Result Tables

Table 4.9.1.1 Orefinders - 2013 Sediment Sampling Results
Parameter Units
Sediment
Quality
Objective
Lowest
Effect
Level
Sediment
Quality
Objective
Severe
Effect Level
RDL MOU2 MOU1 PIT1 MM0-3 MM0-2 MM0-1 MM1-3 MM1-2 MM1-1 MM3-3 MM3-2 MM3-1
Total Organic Carbon mg/kg 10000 100000 500 33000 15000 10000 9700 5300 8800 8700 12000 7500 28000 6400 6300
Available (CaCl2) pH s.u. - - - 4.69 5.26 6.71 6.60 6.40 6.44 6.47 5.95 6.04 5.94 5.84 6.32
Acid Extractable Aluminum (Al) µg/g - - 50 12000 13000 9300 6600 4500 5000 6800 6100 4800 12000 5000 4500
Acid Extractable Antimony (Sb) µg/g - - 0.20 ND ND ND ND ND ND ND ND ND ND ND ND
Acid Extractable Arsenic (As) µg/g 6 33 1.0 1.4 1.4 1.4 1.0 ND ND 1.3 1.1 ND 1.8 1.0 ND
Acid Extractable Barium (Ba) µg/g - - 0.50 45 82 41 41 27 32 38 39 28 96 32 27
Acid Extractable Beryllium (Be) µg/g - - 0.20 0.21 0.28 0.23 ND ND ND ND ND ND 0.35 ND ND
Acid Extractable Cadmium (Cd) µg/g 0.6 10 0.10 0.12 0.19 ND ND ND ND 0.12 0.10 ND 0.16 ND ND
Acid Extractable Calcium (Ca) µg/g - - 50 2200 3200 11000 5000 2100 3000 2900 3000 2900 5800 1900 2200
Acid Extractable Chromium (Cr) µg/g 26 110 1.0 39 49 55 27 20 22 27 27 21 52 21 19
Acid Extractable Cobalt (Co) µg/g - - 0.10 7.2 8.7 11 5.3 4.2 4.5 4.8 5.0 4.1 8.3 4.4 3.7
Acid Extractable Copper (Cu) µg/g 16 110 0.50 9.1 14 46 9.8 5.9 10 13 9.0 6.9 45 8.4 5.5
Acid Extractable Iron (Fe) µg/g 20000 40000 50 14000 15000 17000 9600 7000 7500 9500 9700 7300 15000 7300 6600
Acid Extractable Lead (Pb) µg/g 31 250 1.0 7.7 7.3 4.8 3.1 2.1 2.7 4.4 3.3 2.4 5.0 2.5 2.2
Acid Extractable Magnesium (Mg) µg/g - - 50 4300 5500 9100 4500 2800 3100 3400 3300 3000 5800 2600 2500
Acid Extractable Manganese (Mn) µg/g 460 1100 1.0 250 270 240 260 130 170 170 200 170 240 200 170
Acid Extractable Molybdenum (Mo) µg/g - - 0.50 ND ND ND ND ND ND ND ND ND 1.5 ND ND
Acid Extractable Nickel (Ni) µg/g 16 75 0.50 22 29 41 17 14 15 16 19 14 35 13 12
Acid Extractable Phosphorus (P) µg/g - - 50 300 430 540 360 270 360 320 410 360 380 210 280
Acid Extractable Potassium (K) µg/g - - 200 660 720 860 610 340 380 440 460 370 890 300 310
Acid Extractable Selenium (Se) µg/g - - 0.50 ND ND ND ND ND ND ND ND ND 0.60 ND ND
Acid Extractable Silver (Ag) µg/g - - 0.20 ND ND ND ND ND ND ND ND ND ND ND ND
Acid Extractable Sodium (Na) µg/g - - 100 110 180 220 120 ND ND 120 100 ND 170 ND ND
Acid Extractable Strontium (Sr) µg/g - - 1.0 11 17 18 13 9.1 9.6 12 11 10 24 8.4 8.2
Acid Extractable Thallium (Tl) µg/g - - 0.050 0.074 0.098 0.077 ND ND ND ND ND ND 0.11 ND ND
Acid Extractable Vanadium (V) µg/g - - 5.0 24 28 29 18 13 14 18 17 14 34 14 13
Acid Extractable Zinc (Zn) µg/g 120 820 5.0 37 60 33 26 18 21 25 27 19 41 17 17
Notes:
RDL: Reportable Detection Limit
ND: not detected
concentration exceeds Sediment Quality Objective Lowest Effect Level
concentration exceeds Sediment Quality Objective Severe Effect Level
STORY ENVIRONMENTAL INC.
R:\SEI\Orefinders\121-01_Environmental Monitoring for Baseline Studies\121-01-11_Sediment Sampling\ss\2013 Sediment Results.xlsx Appendix B

TABLE 12.1 Estimated Closure Costs
Line NoComponent Item
Length
(m)
Width
(m)Area (m
2) Quantity Unit Unit Rate Units Reclamation Cost Comments/Notes
1
2 Grading of disturbed areas 8265 UC 1.00$ $/m2 8,265$ Quote from Pederson Construction.
3 Surface covering with overburden - 0.1 m reserved overburden 8265 UC 1.00$ $/m2 8,265$ Quote from Pederson Construction.
4 Seeding - hydro seed 8265 UC 0.25$ $/m2 2,066$ Quote from Pederson Construction.
5 18,596$
6
7
8 Grading of disturbed areas 3300 UC 1.00$ $/m2 3,300$ Quote from Pederson Construction.
9 Surface covering with overburden - 0.1 m reserved overburden 3300 UC 1.00$ $/m2 3,300$ Quote from Pederson Construction.
10 Seeding - hydro seed 3300 UC 0.25$ $/m2 825$ Quote from Pederson Construction.
11 7,425$
12
13
14 Recontouring of disturbed areas 1000 UC 1.00$ $/m2 1,000$ Quote from Pederson Construction. Assuming 10% will be used up for rehabilitation activities and needs to be recontoured and seeded
15 Seeding - hydro seed 1000 UC 0.25$ $/m2 250$ Quote from Pederson Construction.
16 1,250$
17
18
20 Seeding - hydro seed 4000 UC 0.25$ $/m2 1,000$ Quote from Pederson Construction.
21 1,000$
22
23
24
25 Water quality sampling and analyses (twice annually for five years) 10 UC 2,000$ $/monitoring event 20,000$ Estimated $2000 per monitoring event, including manpower and analytical costs
26 Revegetation Efforts and Monitoring (for five years, once per year) 5 UC 1,500$ $/year 7,500$ Includes inspections, amendments, and seeding/planting as necessary
27 Environmental Reporting (once after 5 years) 1 LS 10,000$ $/report 10,000$ Includes lump sum for reporting on water sampling and revegatative efforts
28 37,500$
29
30
31 65,771$
32 10% 6,577$
33 72,348$
Total Component
North Stockpile Area (Area of Disturbed Land = 8265 m2)
Engineering/Certifications
Total
Reclamation Monitoring Program
Total Component
Sub Total
Total Component
Central Stockpile Area (Area of Disturbed Land = 3300 m2)
Overburden Stockpile Area (Area of Disturbed Land = 10000 m2)
Total Component
South Pit Bank (Area of Disturbed Land = 4000 m2)
Total Component
STORY ENVIRONMENTAL INC.
R:\SEI\Orefinders\121-01_Environmental Monitoring for Baseline Studies\121-01-19-08-01 Closure Plan\Orefinders_Closure_Costs_13Aug2014.xlsx
05/09/2014,9:28 AM
Page 1