oracle database performance & 12c performance … sharma database and...oracle database...
TRANSCRIPT
Oracle Database Performance & 12c Performance Features Vivek Sharma OTN Yathra
Introduction & Disclaimer… • Around 13+ Years using Oracle Database • Specializes in Performance Optimization • DB Technologist – JAPAC Sales Consulting • Member of Elite Engineering Exchange • Email : [email protected] • Blog : viveklsharma.wordpress.com
The technical observations & views are my own. These are purely based on my understanding, learning and resolution of various customer
issues.
Production Requirement…
• Optimal Performance – Always • Highly Scalable – Nearly Linear • Ensure High Availability
3
• Application Developers – Proactive • Development DBA’s – Proactive • Production DBA’s – Reactive
Responsible Team…
Critical to Know…(in the order of priority)
• your Database • your Development Tool • your Data
4
A Mantra for a Successful Development Project
“Don’t treat Database as a Block Box”
Database…(Developers & DBA’s)
• Understanding Architecture – SGA (the Shared Pool / the Buffer Cache) – Read Consistency – Locking and Concurrency
• Optimizer – Statistics – Query Transformation
• Database Objects – Tables & Indexes – Partitioning
5
Query Optimizer Evolution…(An Example)
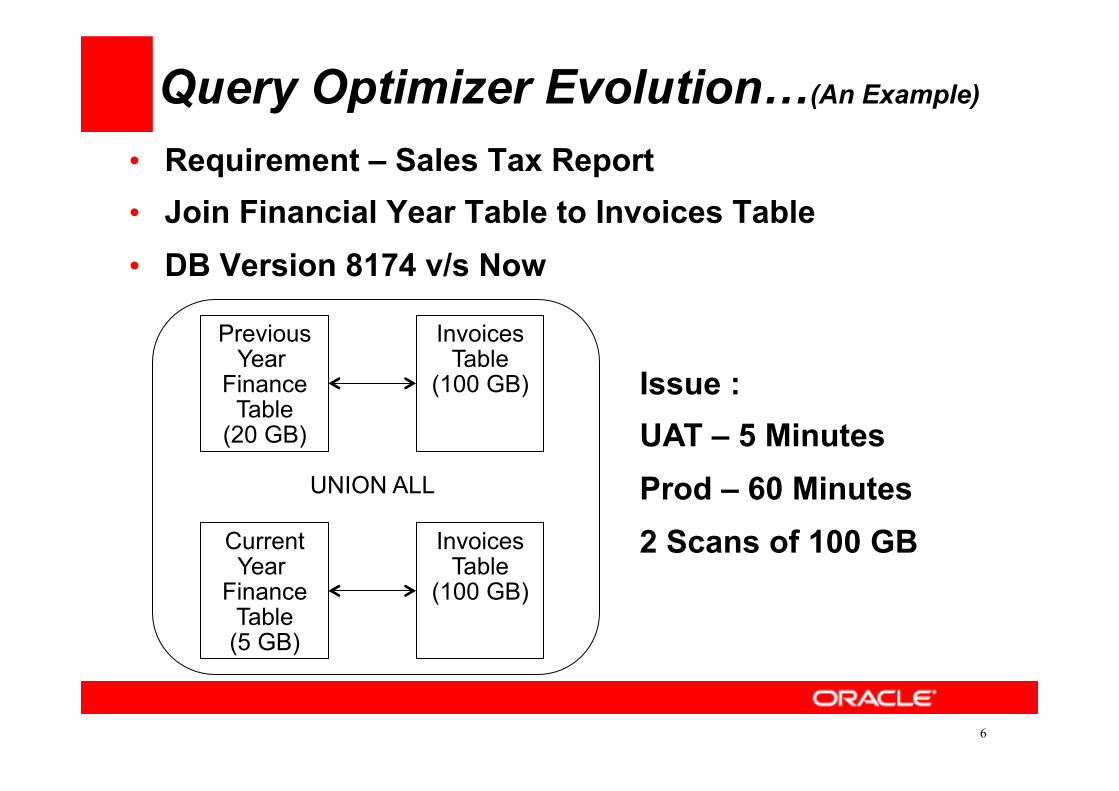
• Requirement – Sales Tax Report • Join Financial Year Table to Invoices Table • DB Version 8174 v/s Now
6
Previous Year
Finance Table
(20 GB)
Current Year
Finance Table (5 GB)
Invoices Table
(100 GB)
Invoices Table
(100 GB)
UNION ALL
Issue : UAT – 5 Minutes Prod – 60 Minutes 2 Scans of 100 GB
Query Optimizer Evolution…(An Example)
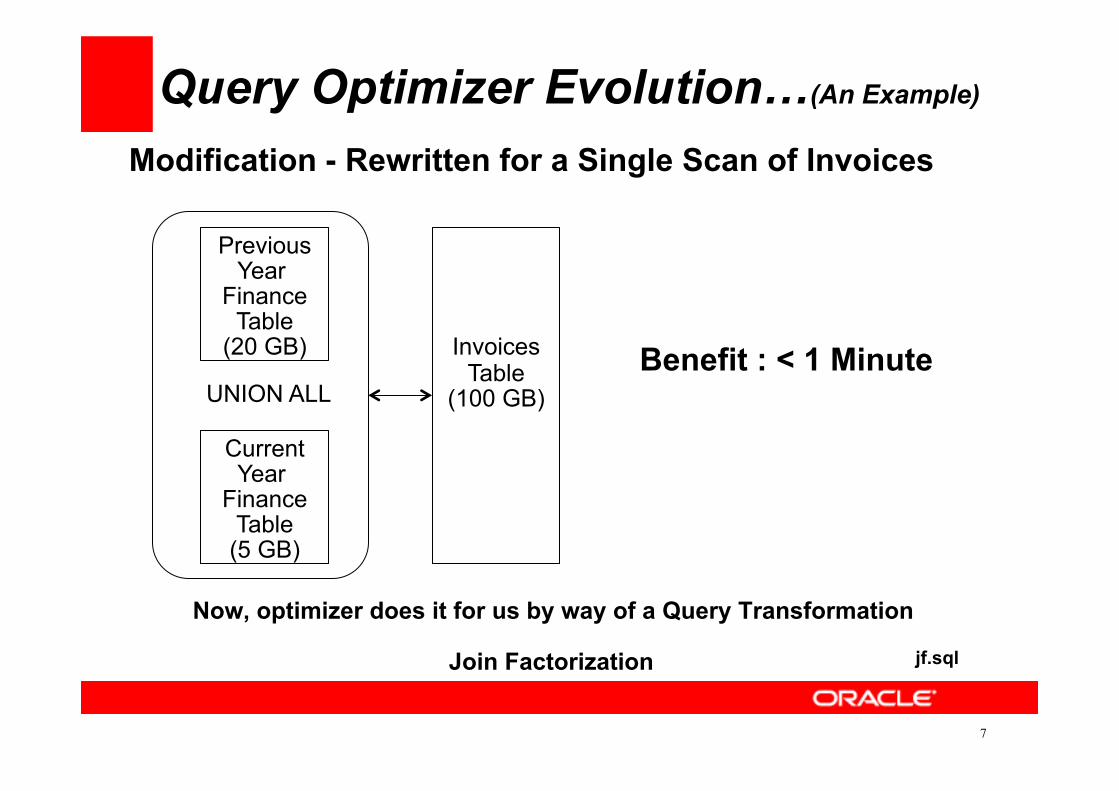
Modification - Rewritten for a Single Scan of Invoices
7
Now, optimizer does it for us by way of a Query Transformation
Join Factorization
Previous Year
Finance Table
(20 GB)
Current Year
Finance Table (5 GB)
Invoices Table
(100 GB) UNION ALL Benefit : < 1 Minute
jf.sql
SGA… the Shared Pool
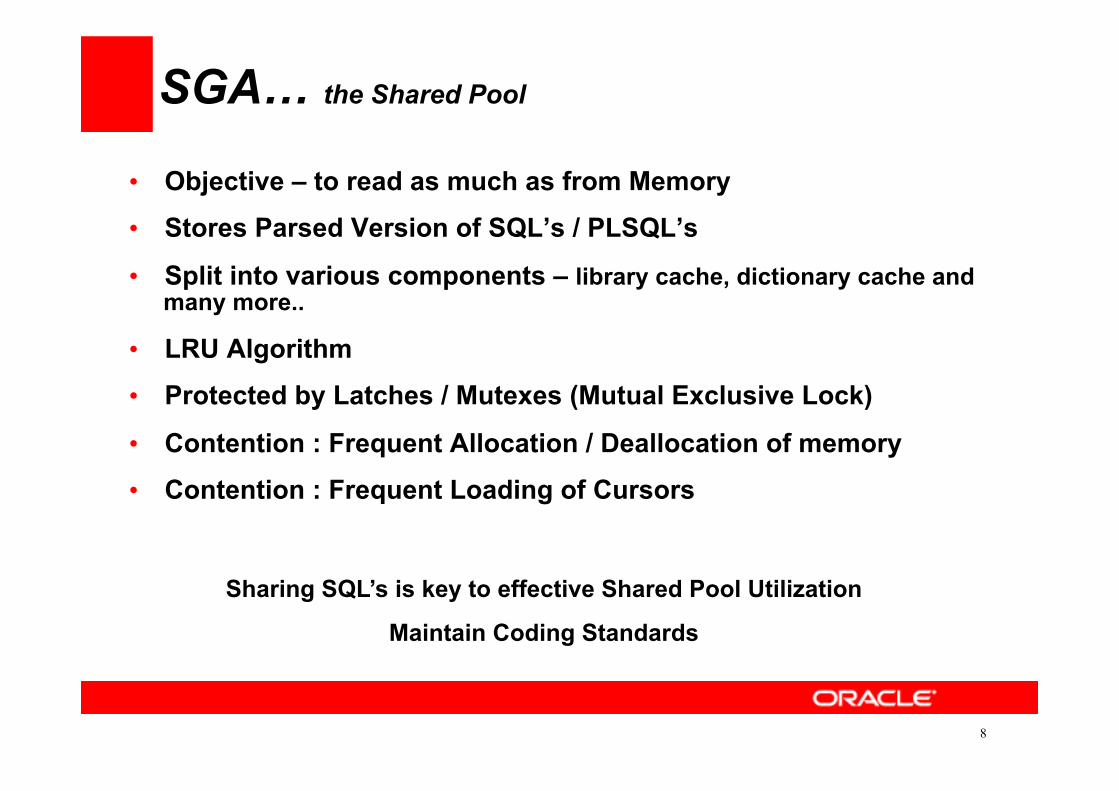
• Objective – to read as much as from Memory
• Stores Parsed Version of SQL’s / PLSQL’s
• Split into various components – library cache, dictionary cache and many more..
• LRU Algorithm
• Protected by Latches / Mutexes (Mutual Exclusive Lock)
• Contention : Frequent Allocation / Deallocation of memory
• Contention : Frequent Loading of Cursors
8
Sharing SQL’s is key to effective Shared Pool Utilization
Maintain Coding Standards
9
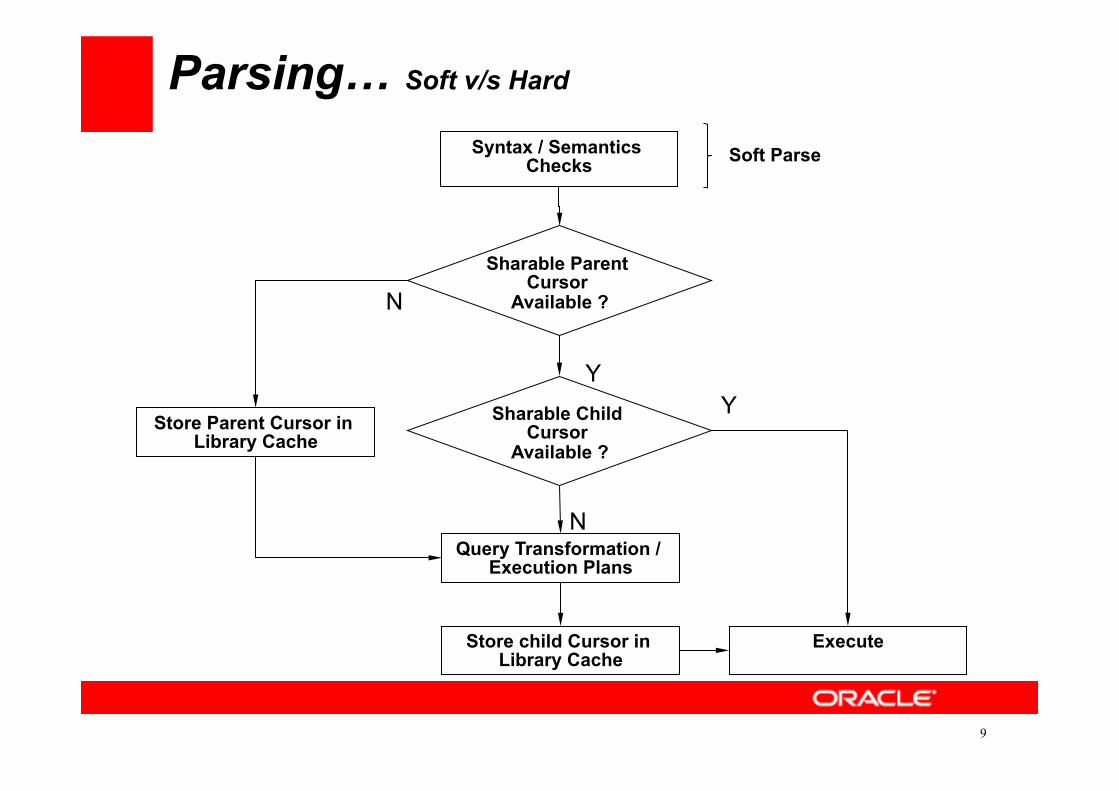
Syntax / Semantics Checks
Sharable Parent Cursor
Available ?
Execute
Store Parent Cursor in Library Cache
Query Transformation / Execution Plans
Store child Cursor in Library Cache
Sharable Child Cursor
Available ?
N
N
Y Y
Soft Parse
Parsing… Soft v/s Hard

Coding Standard…(Multiple Parent Cursors)
10
Parent (select * from emp)
Child
Parent (select * from dept)
Child
Parent (SELECT * FROM EMP)
Child
Parent (select * from emp e)
Child
A Parent requires at least one Child Cursor
Obvious Problem
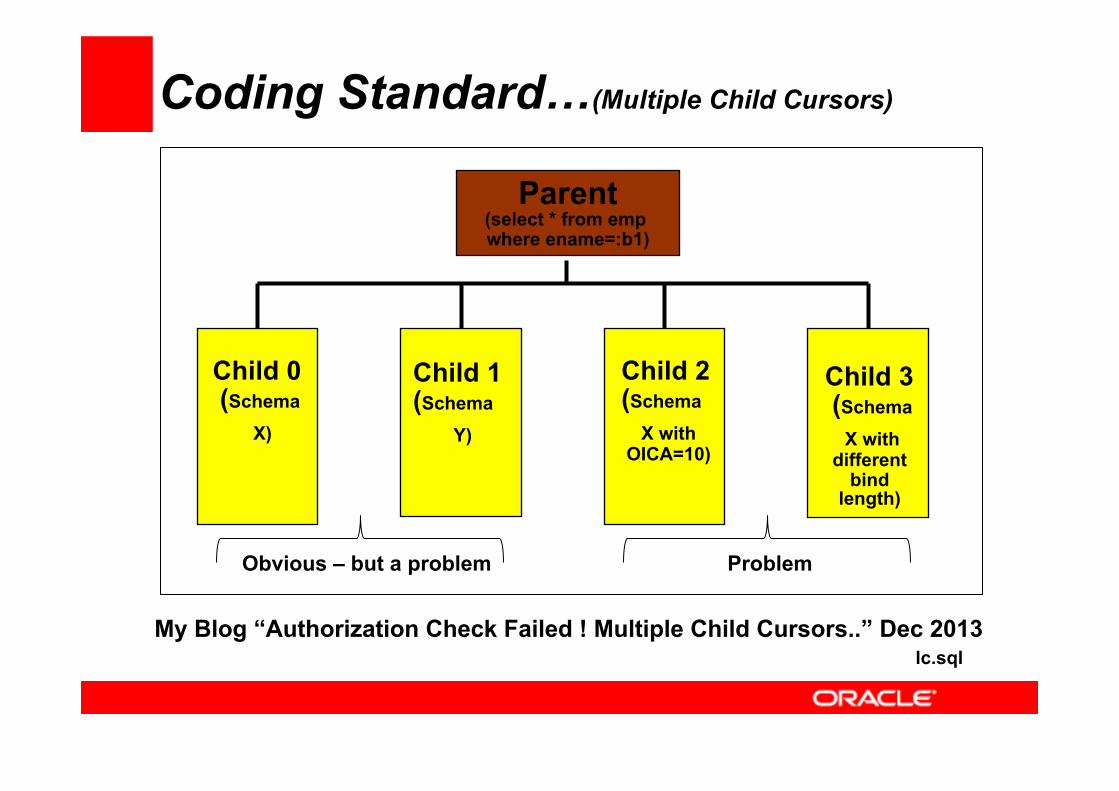
My Blog “Authorization Check Failed ! Multiple Child Cursors..” Dec 2013
Coding Standard…(Multiple Child Cursors)
Child 0 (Schema
X)
Child 1 (Schema
Y)
Child 2 (Schema
X with OICA=10)
Child 3 (Schema X with
different bind
length)
Parent (select * from emp where ename=:b1)
Obvious – but a problem Problem
lc.sql

12c Improvement
Coding Standard…(Multiple Child Cursors)
1 Child Cursor / Schema
Pre 12c Around 8000+ Child Cursors

With the Introduction of ACS, deprecated from 11g
Unsafe Peeked Bind Variables
Is the operator NEITHER of '=' or '!=' OR
Are there Column Histograms present on the column
Cursor_Sharing…(Multiple Cursors due to SIMILAR)
14
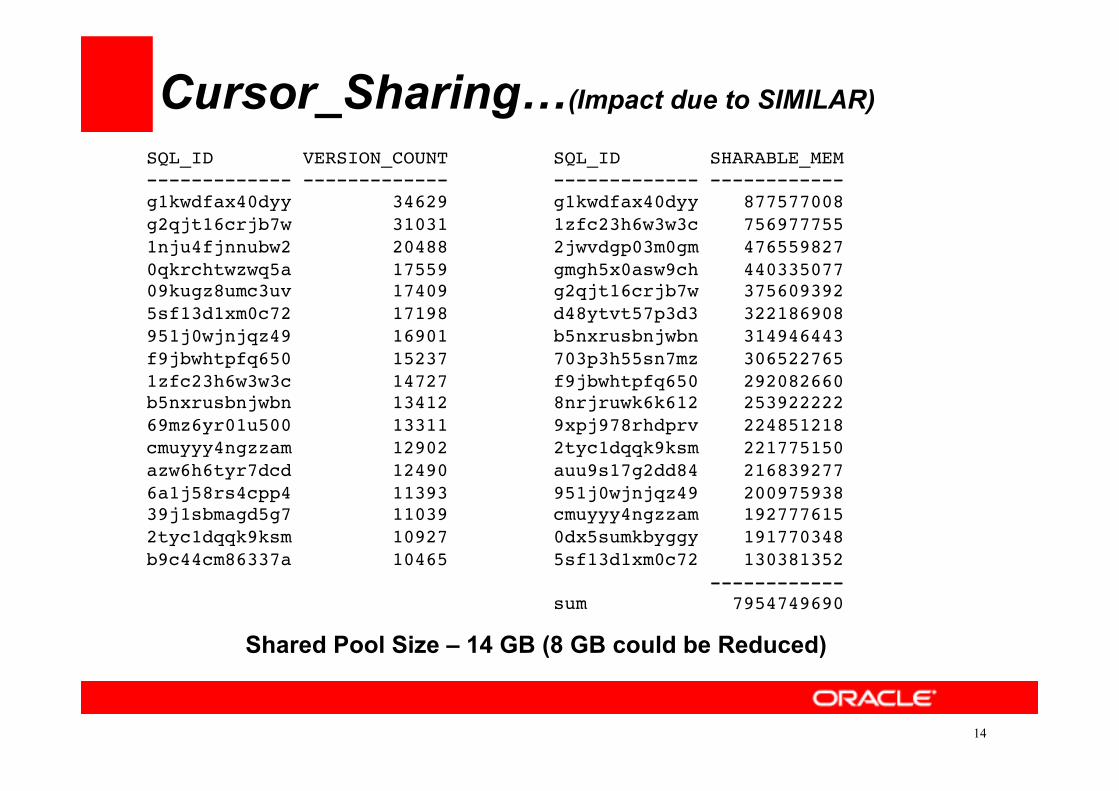
SQL_ID VERSION_COUNT------------- -------------g1kwdfax40dyy 34629g2qjt16crjb7w 310311nju4fjnnubw2 204880qkrchtwzwq5a 1755909kugz8umc3uv 174095sf13d1xm0c72 17198951j0wjnjqz49 16901f9jbwhtpfq650 152371zfc23h6w3w3c 14727b5nxrusbnjwbn 1341269mz6yr01u500 13311cmuyyy4ngzzam 12902azw6h6tyr7dcd 124906a1j58rs4cpp4 1139339j1sbmagd5g7 110392tyc1dqqk9ksm 10927b9c44cm86337a 10465
Cursor_Sharing…(Impact due to SIMILAR)
SQL_ID SHARABLE_MEM------------- ------------g1kwdfax40dyy 8775770081zfc23h6w3w3c 7569777552jwvdgp03m0gm 476559827gmgh5x0asw9ch 440335077g2qjt16crjb7w 375609392d48ytvt57p3d3 322186908b5nxrusbnjwbn 314946443703p3h55sn7mz 306522765f9jbwhtpfq650 2920826608nrjruwk6k612 2539222229xpj978rhdprv 2248512182tyc1dqqk9ksm 221775150auu9s17g2dd84 216839277951j0wjnjqz49 200975938cmuyyy4ngzzam 1927776150dx5sumkbyggy 1917703485sf13d1xm0c72 130381352 ------------sum 7954749690
Shared Pool Size – 14 GB (8 GB could be Reduced)
My Blog “Library Cache : Mutex X ! An Interesting Optimization ” May 2013
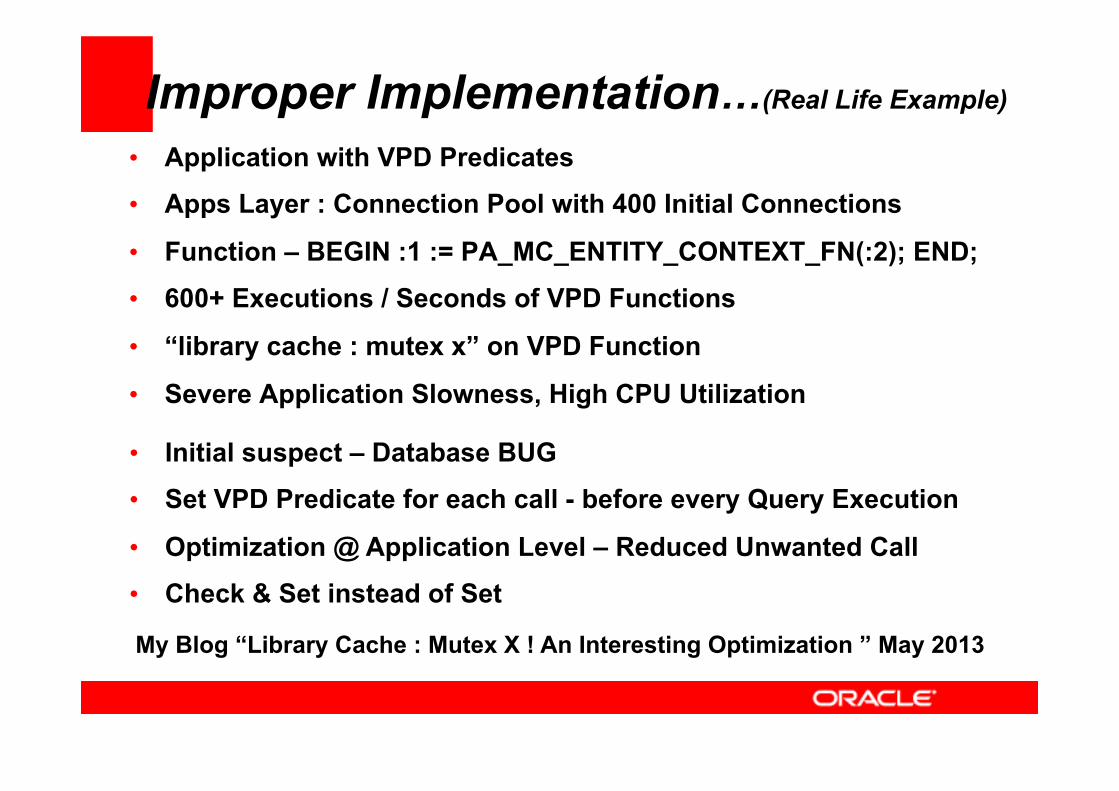
Improper Implementation…(Real Life Example)
• Application with VPD Predicates
• Apps Layer : Connection Pool with 400 Initial Connections
• Function – BEGIN :1 := PA_MC_ENTITY_CONTEXT_FN(:2); END;
• 600+ Executions / Seconds of VPD Functions
• “library cache : mutex x” on VPD Function
• Severe Application Slowness, High CPU Utilization
• Initial suspect – Database BUG
• Set VPD Predicate for each call - before every Query Execution
• Optimization @ Application Level – Reduced Unwanted Call
• Check & Set instead of Set
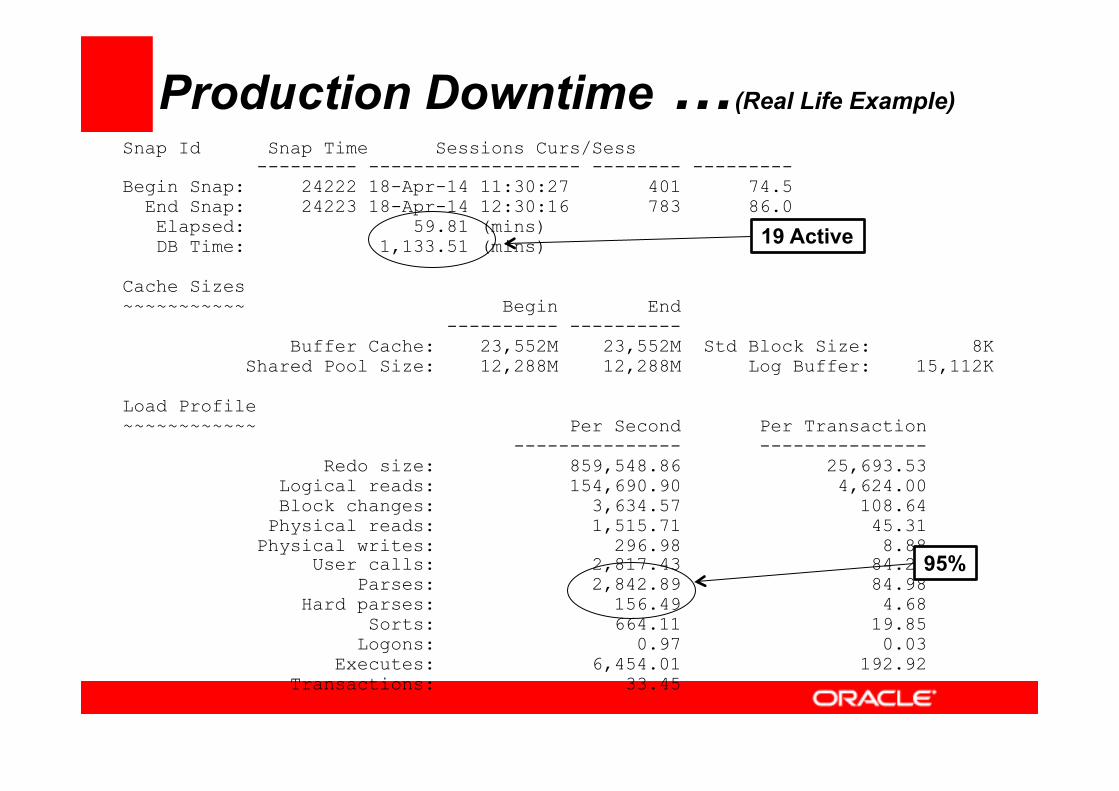
Production Downtime …(Real Life Example)
Snap Id Snap Time Sessions Curs/Sess --------- ------------------- -------- --------- Begin Snap: 24222 18-Apr-14 11:30:27 401 74.5 End Snap: 24223 18-Apr-14 12:30:16 783 86.0 Elapsed: 59.81 (mins) DB Time: 1,133.51 (mins) Cache Sizes ~~~~~~~~~~~ Begin End ---------- ---------- Buffer Cache: 23,552M 23,552M Std Block Size: 8K Shared Pool Size: 12,288M 12,288M Log Buffer: 15,112K Load Profile ~~~~~~~~~~~~ Per Second Per Transaction --------------- --------------- Redo size: 859,548.86 25,693.53 Logical reads: 154,690.90 4,624.00 Block changes: 3,634.57 108.64 Physical reads: 1,515.71 45.31 Physical writes: 296.98 8.88 User calls: 2,817.43 84.22 Parses: 2,842.89 84.98 Hard parses: 156.49 4.68 Sorts: 664.11 19.85 Logons: 0.97 0.03 Executes: 6,454.01 192.92 Transactions: 33.45
19 Active
95%
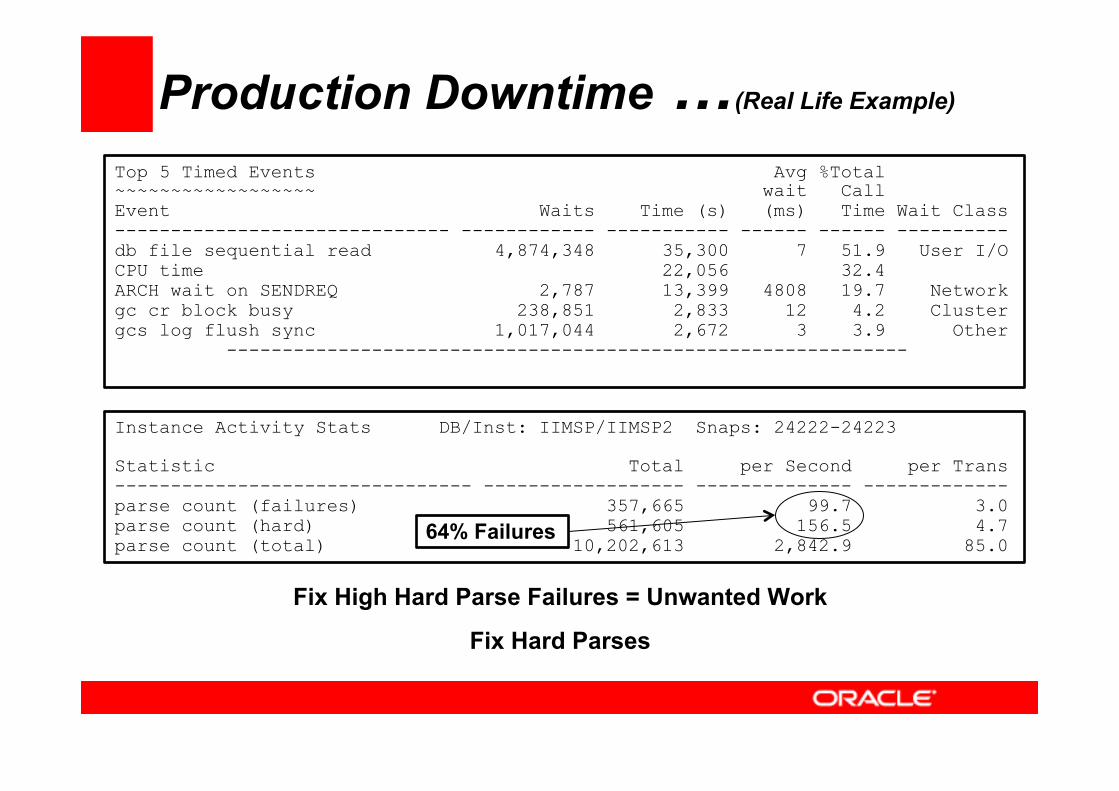
Production Downtime …(Real Life Example)
Top 5 Timed Events Avg %Total ~~~~~~~~~~~~~~~~~~ wait Call Event Waits Time (s) (ms) Time Wait Class ------------------------------ ------------ ----------- ------ ------ ---------- db file sequential read 4,874,348 35,300 7 51.9 User I/O CPU time 22,056 32.4 ARCH wait on SENDREQ 2,787 13,399 4808 19.7 Network gc cr block busy 238,851 2,833 12 4.2 Cluster gcs log flush sync 1,017,044 2,672 3 3.9 Other -------------------------------------------------------------
Instance Activity Stats DB/Inst: IIMSP/IIMSP2 Snaps: 24222-24223 Statistic Total per Second per Trans -------------------------------- ------------------ -------------- ------------- parse count (failures) 357,665 99.7 3.0 parse count (hard) 561,605 156.5 4.7 parse count (total) 10,202,613 2,842.9 85.0
64% Failures
Fix High Hard Parse Failures = Unwanted Work
Fix Hard Parses

SGA… the Buffer Cache
• Objective – to read as much as from Memory
• Caches Database Blocks to eliminate Disk I/O
• Blocks are either Dirty or Clean
• LRU Algorithm, in conjunction with, Touch Count (TCH)
• Protected by Latches to maintain LRU and TCH
• Contention : Unwanted I/O’s
• Contention : Concurrent Access to a Block
18
Logical Reads are faster than Disk Reads
Logical Reads consume CPU
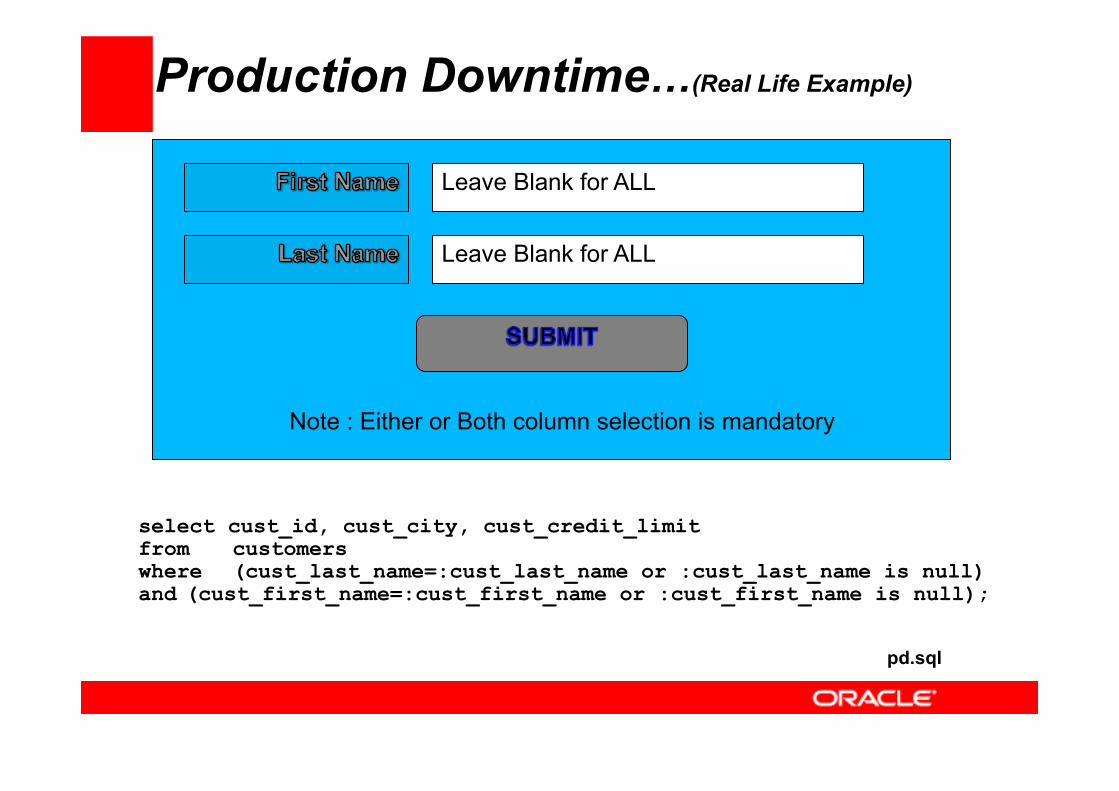
Production Downtime…(Real Life Example)
Leave Blank for ALL
Leave Blank for ALL
Note : Either or Both column selection is mandatory
select cust_id, cust_city, cust_credit_limit from customers where (cust_last_name=:cust_last_name or :cust_last_name is null) and (cust_first_name=:cust_first_name or :cust_first_name is null);
pd.sql
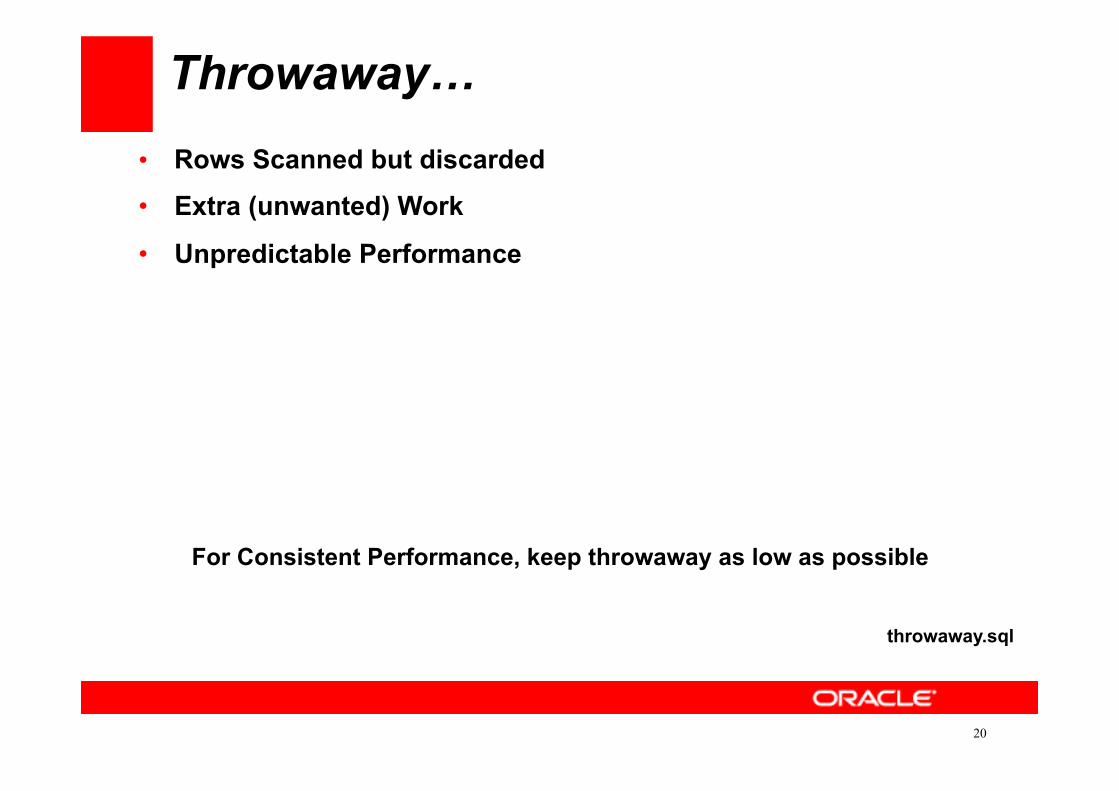
Throwaway…
20
throwaway.sql
For Consistent Performance, keep throwaway as low as possible
• Rows Scanned but discarded
• Extra (unwanted) Work
• Unpredictable Performance
Clustering Factor…(12c Enhancement)
21
cf12c.sql
TABLE_CACHED_BLOCK Preference (1 – Default to 255)
• Most Important Statistics
• Affects Optimizer Choice of Execution Plan
• Measure of I/O’s to read a Table via an Index
• Assumes, each Table Block read is a new Block
Know your Data…
• Mismatch in Column Data Type & Bind Variable
• Avoid masking an Indexed column with a Function
• Feed additional Statistics on Column Dependency
• User NULLS instead of using Too Higher or Lower Range
• Histograms, wherever required
• Reduce Throwaway – Better Indexing
22
ne.sql
Know your Data…(read life example)
23
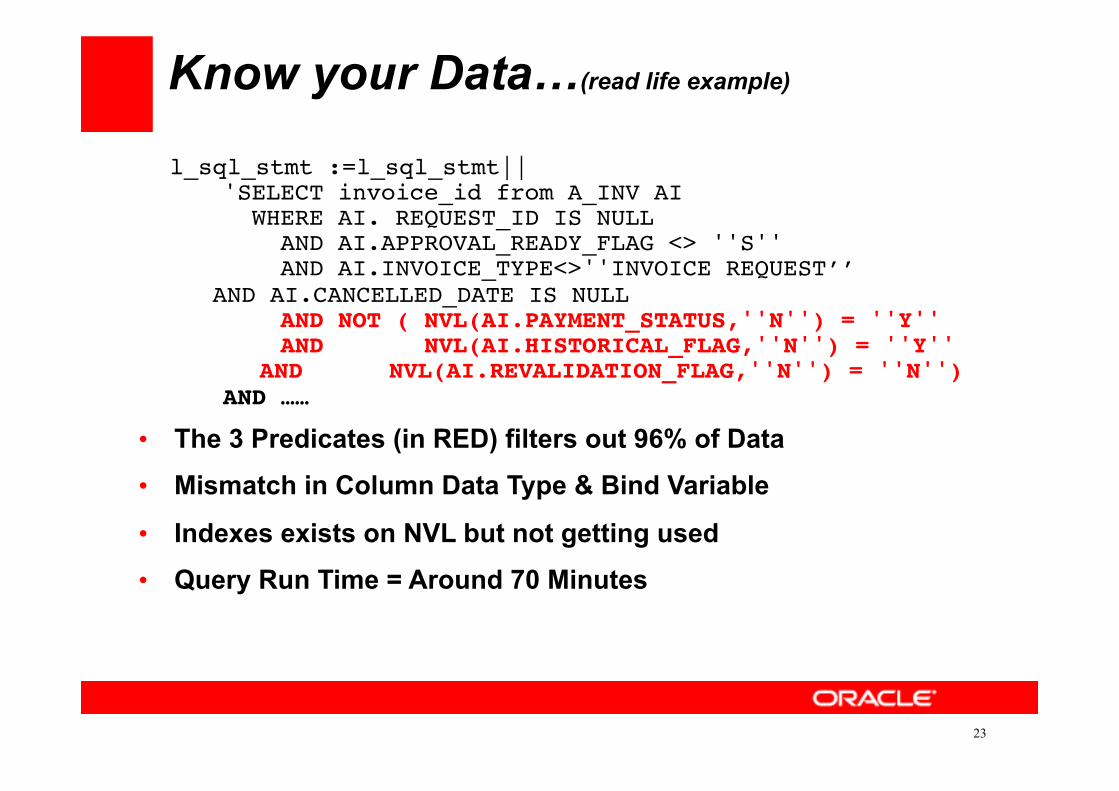
l_sql_stmt :=l_sql_stmt|| 'SELECT invoice_id from A_INV AI WHERE AI. REQUEST_ID IS NULL AND AI.APPROVAL_READY_FLAG <> ''S'' AND AI.INVOICE_TYPE<>''INVOICE REQUEST’’
AND AI.CANCELLED_DATE IS NULL AND NOT ( NVL(AI.PAYMENT_STATUS,''N'') = ''Y'' AND NVL(AI.HISTORICAL_FLAG,''N'') = ''Y''
AND NVL(AI.REVALIDATION_FLAG,''N'') = ''N'') AND ……
• The 3 Predicates (in RED) filters out 96% of Data
• Mismatch in Column Data Type & Bind Variable
• Indexes exists on NVL but not getting used
• Query Run Time = Around 70 Minutes
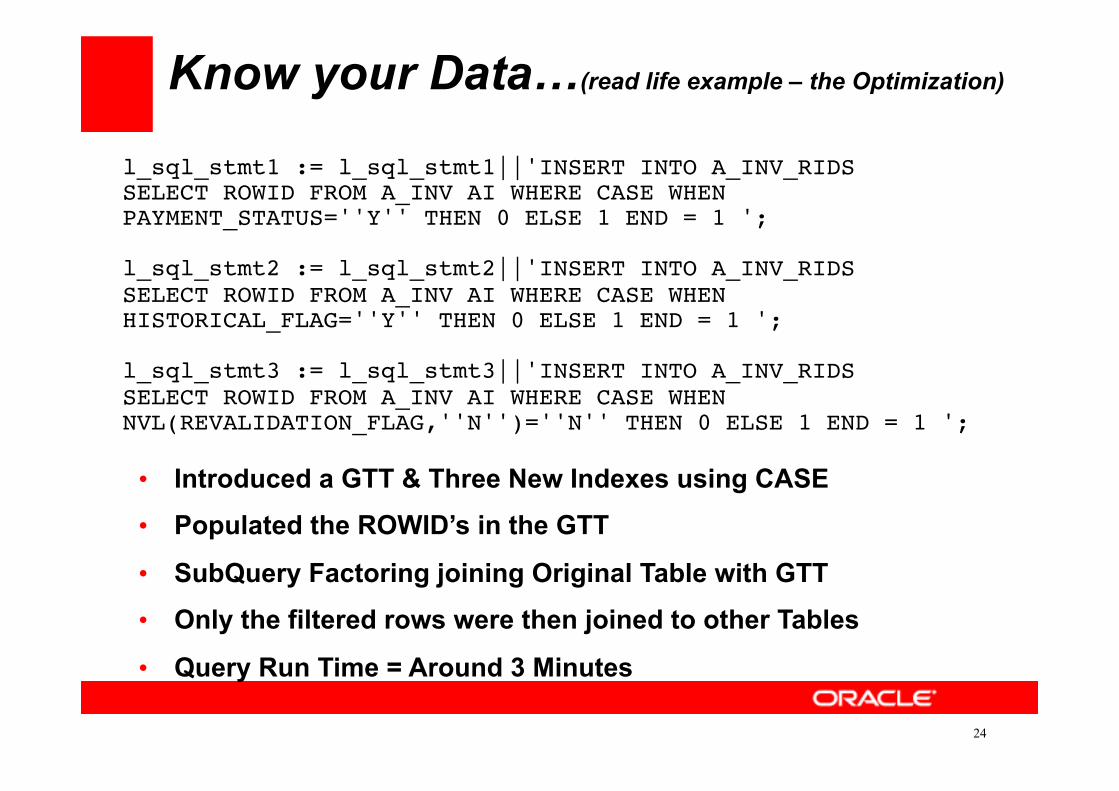
Know your Data…(read life example – the Optimization)
24
l_sql_stmt1 := l_sql_stmt1||'INSERT INTO A_INV_RIDS SELECT ROWID FROM A_INV AI WHERE CASE WHEN PAYMENT_STATUS=''Y'' THEN 0 ELSE 1 END = 1 ';
l_sql_stmt2 := l_sql_stmt2||'INSERT INTO A_INV_RIDS SELECT ROWID FROM A_INV AI WHERE CASE WHEN HISTORICAL_FLAG=''Y'' THEN 0 ELSE 1 END = 1 ';
l_sql_stmt3 := l_sql_stmt3||'INSERT INTO A_INV_RIDS SELECT ROWID FROM A_INV AI WHERE CASE WHEN NVL(REVALIDATION_FLAG,''N'')=''N'' THEN 0 ELSE 1 END = 1 ';
• Introduced a GTT & Three New Indexes using CASE
• Populated the ROWID’s in the GTT
• SubQuery Factoring joining Original Table with GTT
• Only the filtered rows were then joined to other Tables
• Query Run Time = Around 3 Minutes

Investigating Query Performance…
• Use dbms_xplan.display_cursor – Current Plan
• Use dbms_xplan.display_awr – History
• Divide & Rule – Smaller Query, Easier to work
• Test with Bind for Bind & Literal for Literal – v$sql_bind_capture
• Gather_Plan_Statistics / Statistics_level – allstats last
• Compare E-Rows & A-Rows – Issue if high discrepancy
25
qp.sql
Gather_Plan_Statistics / Statistics_Level Critical for Investigation

Explain Plan Trap…may or may not match runtime plan
• Use dbms_xplan.display_cursor – Cursor Cache • Use dbms_xplan.display_awr – From AWR • Use dbms_xplan.display – Explain Plan for • @utlxpls / @utlxplp – Explain Plan for • Set autot – Requires Query Execution
26
ep.sql
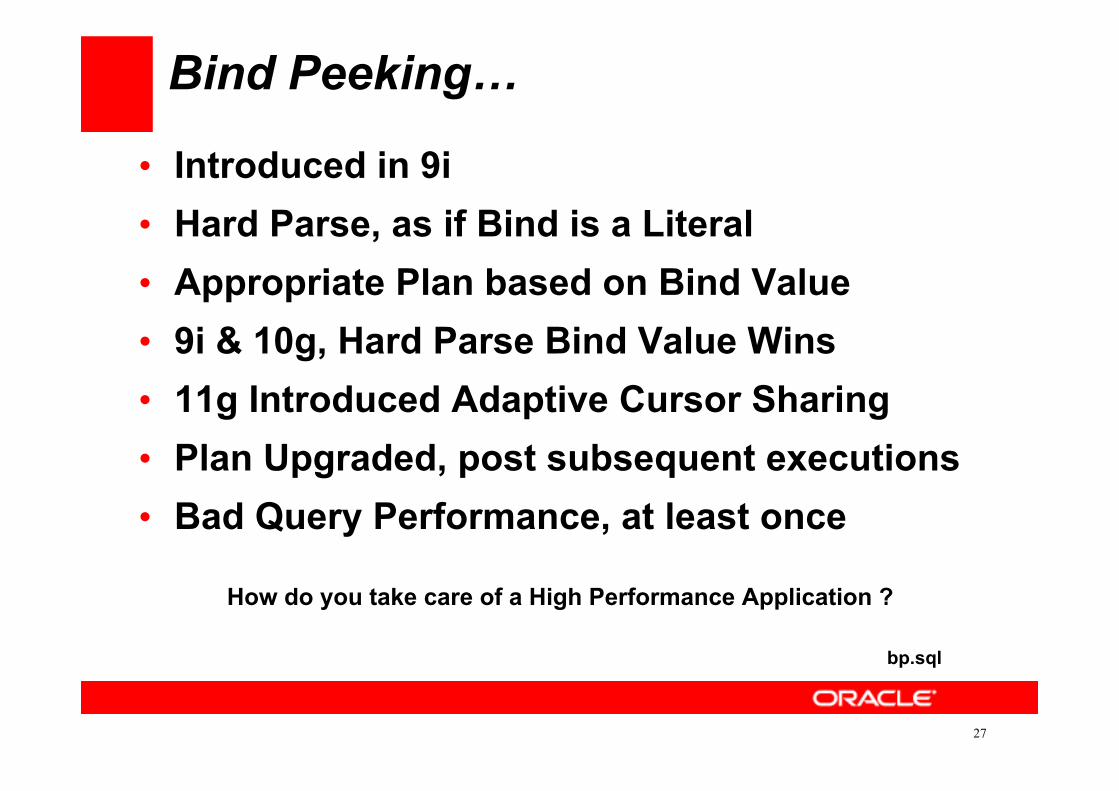
Bind Peeking…
• Introduced in 9i • Hard Parse, as if Bind is a Literal • Appropriate Plan based on Bind Value • 9i & 10g, Hard Parse Bind Value Wins • 11g Introduced Adaptive Cursor Sharing • Plan Upgraded, post subsequent executions • Bad Query Performance, at least once
27
bp.sql
How do you take care of a High Performance Application ?
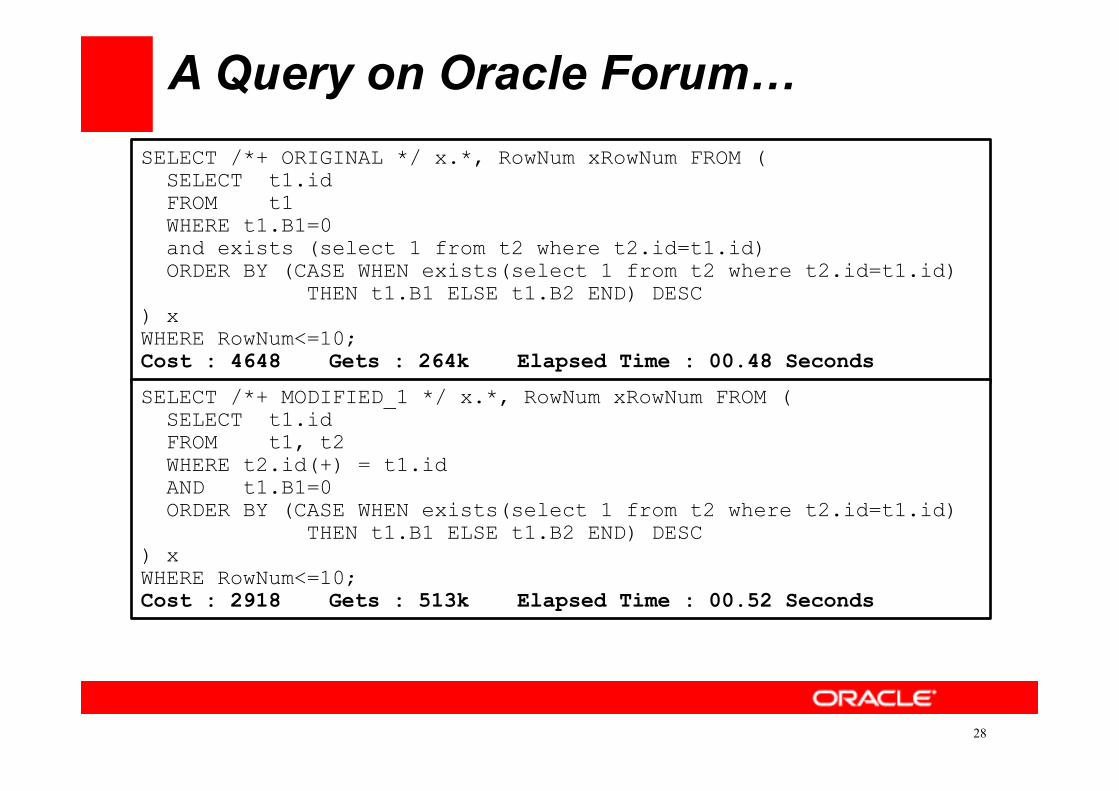
A Query on Oracle Forum…
28
SELECT /*+ ORIGINAL */ x.*, RowNum xRowNum FROM ( SELECT t1.id FROM t1 WHERE t1.B1=0 and exists (select 1 from t2 where t2.id=t1.id) ORDER BY (CASE WHEN exists(select 1 from t2 where t2.id=t1.id) THEN t1.B1 ELSE t1.B2 END) DESC ) x WHERE RowNum<=10; Cost : 4648 Gets : 264k Elapsed Time : 00.48 Seconds
SELECT /*+ MODIFIED_1 */ x.*, RowNum xRowNum FROM ( SELECT t1.id FROM t1, t2 WHERE t2.id(+) = t1.id AND t1.B1=0 ORDER BY (CASE WHEN exists(select 1 from t2 where t2.id=t1.id) THEN t1.B1 ELSE t1.B2 END) DESC ) x WHERE RowNum<=10; Cost : 2918 Gets : 513k Elapsed Time : 00.52 Seconds

A Query on Oracle Forum…
29
SELECT /*+ MODIFIED_2 */ x.*, RowNum xRowNum FROM ( SELECT t1.id FROM t1, t2 WHERE t2.id(+) = t1.id AND t1.B1=0 ORDER BY (CASE WHEN t2.id is not null THEN t1.B1 ELSE t1.B2 END) DESC ) x WHERE RowNum<=10; Cost : 4648 Gets : 3336 Elapsed Time : 00.28 Seconds
Queries raised on the Forum : 1. Are these Equivalent ? 2. Is there any reason, the CBO can’t transform the exists into outer join ? 3. Is there a hint to get the exists transformed ? 4. Is there something wrong with the costing model ? The Query with lower cost takes longer with more Gets
Answer to these Questions are easier with
Gather_Plan_Statistics / Statistics Level of.sql
30
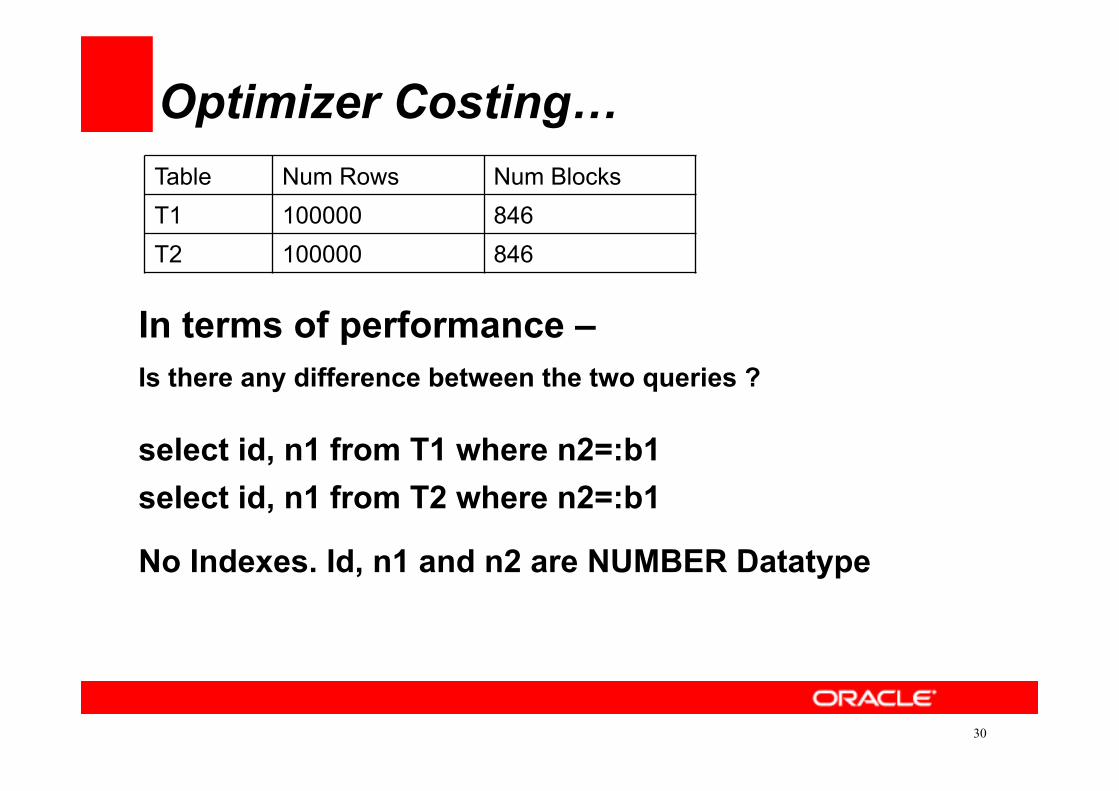
In terms of performance – Is there any difference between the two queries ?
select id, n1 from T1 where n2=:b1
Optimizer Costing…
Table Num Rows Num Blocks T1 100000 846 T2 100000 846
select id, n1 from T2 where n2=:b1
No Indexes. Id, n1 and n2 are NUMBER Datatype
31
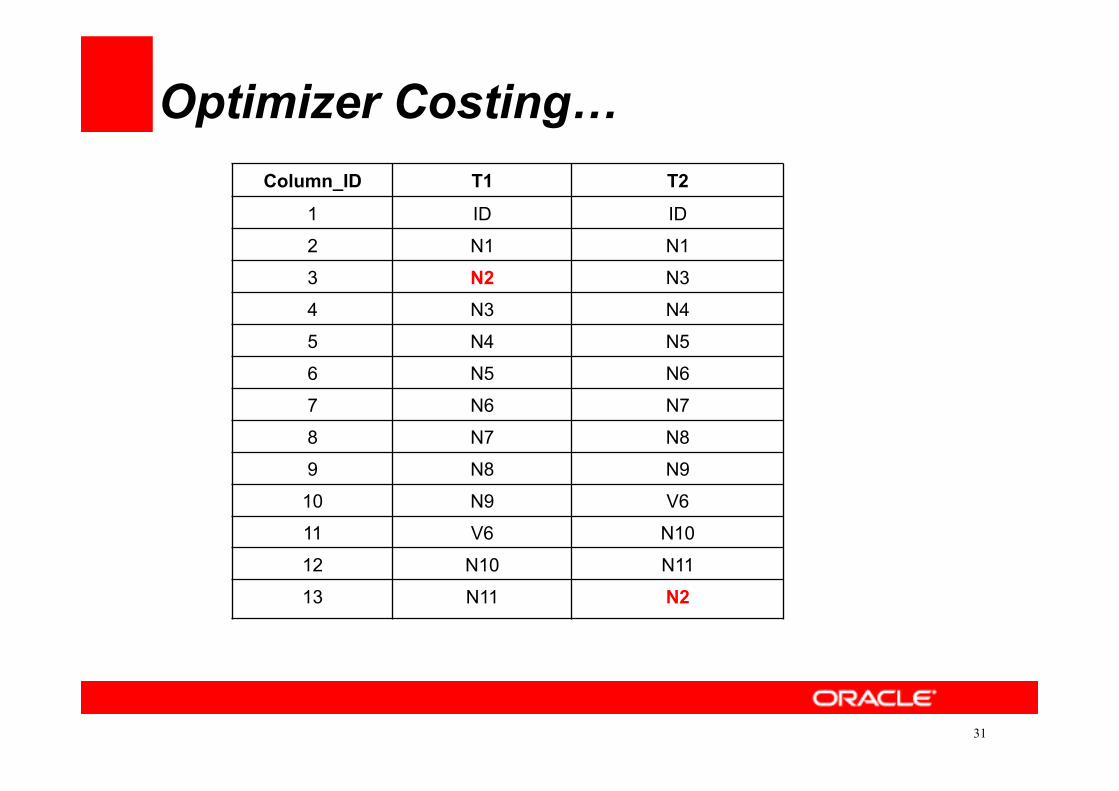
Optimizer Costing…
Column_ID T1 T2
1 ID ID
2 N1 N1
3 N2 N3
4 N3 N4
5 N4 N5
6 N5 N6
7 N6 N7
8 N7 N8
9 N8 N9
10 N9 V6
11 V6 N10
12 N10 N11
13 N11 N2
32
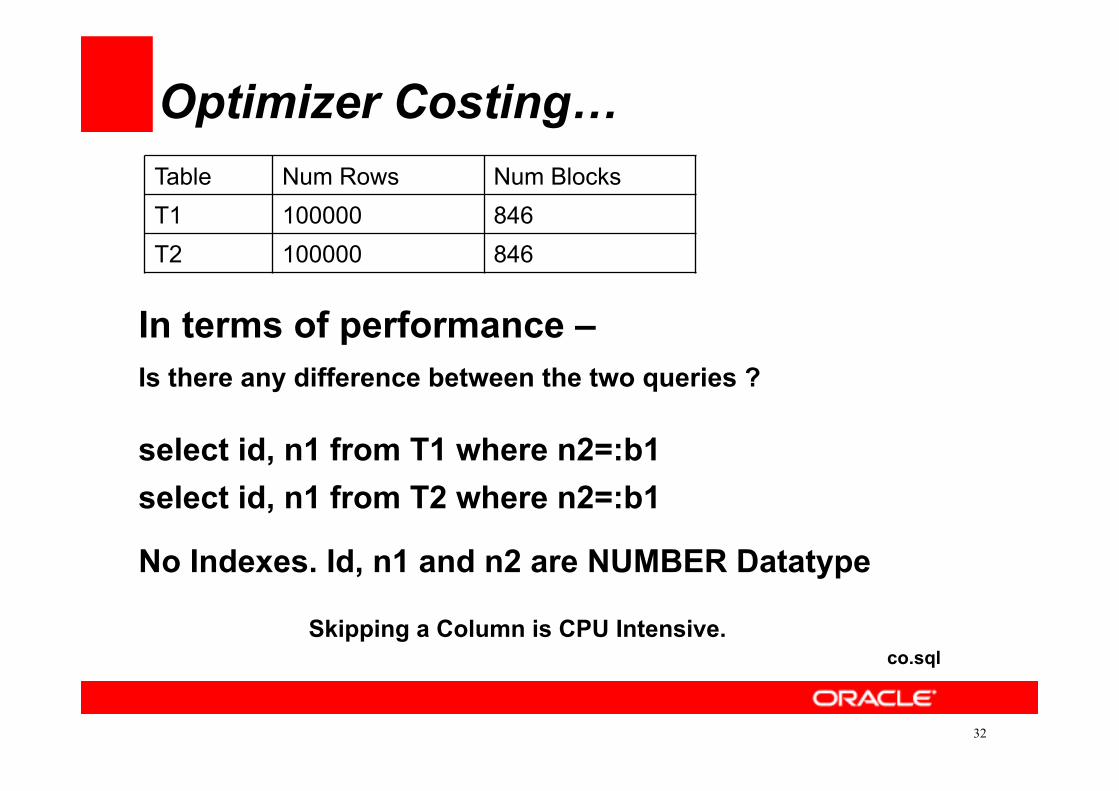
In terms of performance – Is there any difference between the two queries ?
select id, n1 from T1 where n2=:b1
Optimizer Costing…
Table Num Rows Num Blocks T1 100000 846 T2 100000 846
select id, n1 from T2 where n2=:b1
No Indexes. Id, n1 and n2 are NUMBER Datatype co.sql
Skipping a Column is CPU Intensive.

33
Optimizer Costing…
Column_ID T1 T2
1 ID ID
2 N1 N1
3 N2 N2
4 N3 N3
5 N4 N4
6 N5 N5
7 N6 N6
8 N7 N7
9 N8 N8
10 N9 N9
11 V6 V6
12 N10 N10
13 N11 N11
Invisible Column
co1.sql Invisible Column retain the immediate next id, when created

34
AQ&
03/03/15 3:34 PM