optimizing hadoop for mapreduce - packt publishing · optimizing hadoop for mapreduce . mapreduce...
TRANSCRIPT

Optimizing Hadoop for MapReduce
Khaled Tannir
Chapter No. 3
"Detecting System Bottlenecks"

In this package, you will find: A Biography of the author of the book
A preview chapter from the book, Chapter NO.3 "Detecting System Bottlenecks"
A synopsis of the book’s content
Information on where to buy this book
About the Author Khaled Tannir has been working with computers since 1980. He began programming
with the legendary Sinclair Zx81 and later with Commodore home computer products
(Vic 20, Commodore 64, Commodore 128D, and Amiga 500).
He has a Bachelor's degree in Electronics, a Master's degree in System Information
Architectures, in which he graduated with a professional thesis, and completed his
education with a Master of Research degree.
He is a Microsoft Certified Solution Developer (MCSD) and has more than 20 years of
technical experience leading the development and implementation of software solutions
and giving technical presentations. He now works as an independent IT consultant and
has worked as an infrastructure engineer, senior developer, and enterprise/solution
architect for many companies in France and Canada.
With significant experience in Microsoft .Net, Microsoft Server Systems, and Oracle Java
technologies, he has extensive skills in online/offline applications design, system
conversions, and multilingual applications in both domains: Internet and Desktops.
For More Information: www.packtpub.com/learn-to-implement-and-use-hadoop-mapreduce-
framework/book

He is always researching new technologies, learning about them, and looking for new
adventures in France, North America, and the Middle-east. He owns an IT and electronics
laboratory with many servers, monitors, open electronic boards such as Arduino,
Netduino, RaspBerry Pi, and .Net Gadgeteer, and some smartphone devices based on
Windows Phone, Android, and iOS operating systems.
In 2012, he contributed to the EGC 2012 (International Complex Data Mining forum at
Bordeaux University, France) and presented, in a workshop session, his work on "how to
optimize data distribution in a cloud computing environment". This work aims to define
an approach to optimize the use of data mining algorithms such as k-means and Apriori
in a cloud computing environment.
He is the author of RavenDB 2.x Beginner's Guide, Packt Publishing.
For More Information: www.packtpub.com/learn-to-implement-and-use-hadoop-mapreduce-
framework/book

Optimizing Hadoop for MapReduce MapReduce is an important parallel processing model for large-scale, data-intensive
applications such as data mining and web indexing. Hadoop, an open source
implementation of MapReduce, is widely applied to support cluster computing jobs that
require low response time.
Most of the MapReduce programs are written for data analysis and they usually take a
long time to finish. Many companies are embracing Hadoop for advanced data analytics
over large datasets that require time completion guarantees. Efficiency, especially the I/O
costs of MapReduce, still needs to be addressed for successful implications. The
experience shows that a misconfigured Hadoop cluster can noticeably reduce and
significantly downgrade the performance of MapReduce jobs.
In this book, we address the MapReduce optimization problem, how to identify
shortcomings, and what to do to get using all of the Hadoop cluster's resources to process
input data optimally. This book starts off with an introduction to MapReduce to learn
how it works internally, and discusses the factors that can affect its performance. Then it
moves forward to investigate Hadoop metrics and performance tools, and identifies
resource weaknesses such as CPU contention, memory usage, massive I/O storage, and
network traffic.
This book will teach you, in a step-by-step manner based on real-world experience, how
to eliminate your job bottlenecks and fully optimize your MapReduce jobs in a
production environment. Also, you will learn to calculate the right number of cluster
nodes to process your data, to define the right number of mapper and reducer tasks based
on your hardware resources, and how to optimize mapper and reducer task performances
using compression technique and combiners.
Finally, you will learn the best practices and recommendations to tune your Hadoop
cluster and learn what a MapReduce template class looks like.
What This Book Covers Chapter 1, Understanding Hadoop MapReduce, explains how MapReduce works
internally and the factors that affect MapReduce performance.
Chapter 2, An Overview of the Hadoop Parameters, introduces Hadoop configuration
files and MapReduce performance-related parameters. It also explains Hadoop metrics
and several performance monitoring tools that you can use to monitor Hadoop
MapReduce activities.
Chapter 3, Detecting System Bottlenecks, explores Hadoop MapReduce performance
tuning cycle and explains how to create a performance baseline. Then you will learn to
identify resource bottlenecks and weaknesses based on Hadoop counters.
For More Information: www.packtpub.com/learn-to-implement-and-use-hadoop-mapreduce-
framework/book

Chapter 4, Identifying Resource Weaknesses, explains how to check the Hadoop cluster's
health and identify CPU and memory usage, massive I/O storage, and network traffic.
Also, you will learn how to scale correctly when configuring your Hadoop cluster.
Chapter 5, Enhancing Map and Reduce Tasks, shows you how to enhance map and
reduce task execution. You will learn the impact of block size, how to reduce
spilling records, determine map and reduce throughput, and tune MapReduce
configuration parameters.
Chapter 6, Optimizing MapReduce Tasks, explains when you need to use combiners and
compression techniques to optimize map and reduce tasks and introduces several
techniques to optimize your application code.
Chapter 7, Best Practices and Recommendations, introduces miscellaneous hardware and
software checklists, recommendations, and tuning properties in order to use your Hadoop
cluster optimally.
For More Information: www.packtpub.com/learn-to-implement-and-use-hadoop-mapreduce-
framework/book

Detecting System Bottlenecks
How do you know whether your Hadoop MapReduce job is performing its work optimally? One of the most common performance-related requests we receive in our consulting practice is to fi nd out why a specifi c job took a long time to execute, and to troubleshoot bottleneck incidents.
In Chapter 1, Understanding Hadoop MapReduce, and Chapter 2, An Overview of the Hadoop Parameters, we learned about factors that may impact Hadoop MapReduce performance and Hadoop MapReduce common parameters' settings. In this chapter, we will continue our journey and learn how to detect potential system bottlenecks.
This chapter presents the performance tuning process, the importance of creating a baseline before any tuning job, and how to use this baseline to tune your cluster. You will also learn how to identify resource bottlenecks and what to do in order to break these bottlenecks.
In this chapter, we will cover the following:
• Introducing the performance tuning process• Creating a performance baseline• Hadoop cluster tuning approach• Identifying system-resource bottlenecks
For More Information: www.packtpub.com/learn-to-implement-and-use-hadoop-mapreduce-
framework/book

Detecting System Bottlenecks
[ 32 ]
Performance tuningThe fundamental goal of performance tuning is to ensure that all available resources (CPU, RAM, I/O, and network) in a given cluster confi guration are available to a particular job and are used in a balanced way.
Hadoop MapReduce resources are classifi ed into categories such as computation, memory, network bandwidth, and input/output storage. If any of these resources perform badly, this will impact Hadoop's performance, which may cause your jobs to run slowly. Therefore, tuning Hadoop MapReduce performance is getting balanced resources on your Hadoop cluster and not just tuning one or more variables.
In simple words, tuning a Hadoop MapReduce job process consists of multiple analyses that investigate the Hadoop metrics and indicators in order to learn about execution time, memory amount used, and the number of bytes to read or store in the local fi lesystem, and so on.
Hadoop performance tuning is an iterative process. You launch a job, then analyzes Hadoop counters, adjust them, and re-run the job. Then repeat this process until you reach the ultimate performance of your Hadoop cluster. The following steps describe this process:
1. Create a baseline, as you fi rst need to evaluate the overall system performance. You will run your job the fi rst time using the default confi guration settings of your Hadoop cluster. This will be your baseline.After you have this baseline, you will begin tuning the variable values to execute jobs optimally. So, we can say that performance tuning is the primary means of measuring and analyzing where time is consumed.
2. You analyze the Hadoop counters, modify and tune some confi guration settings, and then re-run the job. The result is compared to the baseline. When the analysis is complete, you can review the results and accept or reject the inferences.
3. Repeat step 2 until you get the shortest execution time for your job.
For More Information: www.packtpub.com/learn-to-implement-and-use-hadoop-mapreduce-
framework/book

Chapter 3
[ 33 ]
The following fi gure illustrates the Hadoop performance tuning process:
Create baseline Optimized output
Tuningcycle
Act onmetrics
Analyzemetrics
Launchjob
Creating a performance baselineLet's begin by creating a performance baseline for our system. When creating a baseline, you should keep the Hadoop default confi guration settings and use the TeraSort benchmark tool, which is a part of the example JAR fi les provided with the Hadoop distribution package. TeraSort is accepted as an industry standard benchmark to compare the performance of Hadoop. This benchmark tool tries to use the entire Hadoop cluster to sort 1 TB of data as quickly as possible and is divided into three main modules:
• TeraGen: This module is used to generate a fi le of the desired size as an input that usually ranges between 500 GB up to 3 TB. Once the input data is generated by TeraGen, it can be used in all the runs with the same fi le size.
• TeraSort: This module will sort the input fi le across the Hadoop cluster. TeraSort stresses the Hadoop cluster on both layers, MapReduce and HDFS, in terms of computation, network bandwidth, and I/O response. Once sorted, a single reduced task is created to check the output of the sort phase for validity.
• TeraValidate: This module is used for accuracy and to verify the sorted data.
In order to run the TeraSort benchmark tool and get a baseline, you fi rst need to generate the sample input data that will be sorted by TeraSort. Run TeraGen to generate a fi le with 10 GB size (depending on your cluster capacity, you may generate a larger fi le size up to 3 TB) using the following command line where you specify the fi le size (104857600 = 10 GB) and the output DFS directory (/data/input):
hadoop jar $HADOOP_PREFIX/hadoop-*examples*.jar teragen 104857600 /data/input
For More Information: www.packtpub.com/learn-to-implement-and-use-hadoop-mapreduce-
framework/book

Detecting System Bottlenecks
[ 34 ]
The /data/input HDFS directory must be empty, otherwise you will get a Java Exception error. If not already empty, you can clear this directory using the following command line:hadoop dfs -rmr /data/input
To check whether the sample data fi les have been generated correctly, open the Hadoop DFS home page (http://machinename:50070/dfshealth.jsp) and check the DFS Used row, which should refl ect the size of your generated data. You can also browse the /data/input directory in the DFS fi lesystem, which should contain all the generated fi les (part-0000 - part-00*).
Once the input data is generated, run TeraSort using the following command line, which specifi es the input and output data folders:
hadoop jar $HADOOP_PREFIX/hadoop-*examples*.jar terasort /data/input /d ata/output
The only true way to optimize and tune your cluster is to analyze the counters, change the settings' confi guration, re-run your MapReduce job, and then come back to change the settings and re-run the job until you lower the fi nishing time to the lowest possible value.
When the TeraSort job completes, you get a performance baseline. We can now move to the iterative step (discussed in the previous section) and then analyze these settings.
To illustrate how to use this performance baseline, let's assume we want to process a 10 GB fi le on a three-node Hadoop cluster (each node has one CPU with four cores, 4 GB RAM, and 40 GB HDD space). Based on the default settings (reported in the following table) this job took 4 minutes and 3 seconds.
This is a light Hadoop cluster with medium data size context. Therefore, the cluster can be confi gured as follows:
• The replication factor can be reduced to 2.• The block size can be increased up to 128 MB.• The io.sort.factor parameter depends on the available memory on the
node. Each node has 4 GB of memory; therefore, we can allow more memory to the intermediate map data.
• The io.sort.mb value should be io.sort.factor * 10 that is 35 * 10 = 350 MB, which is the size that will be allowed to map intermediate data.
For More Information: www.packtpub.com/learn-to-implement-and-use-hadoop-mapreduce-
framework/book
Chapter 3
[ 35 ]
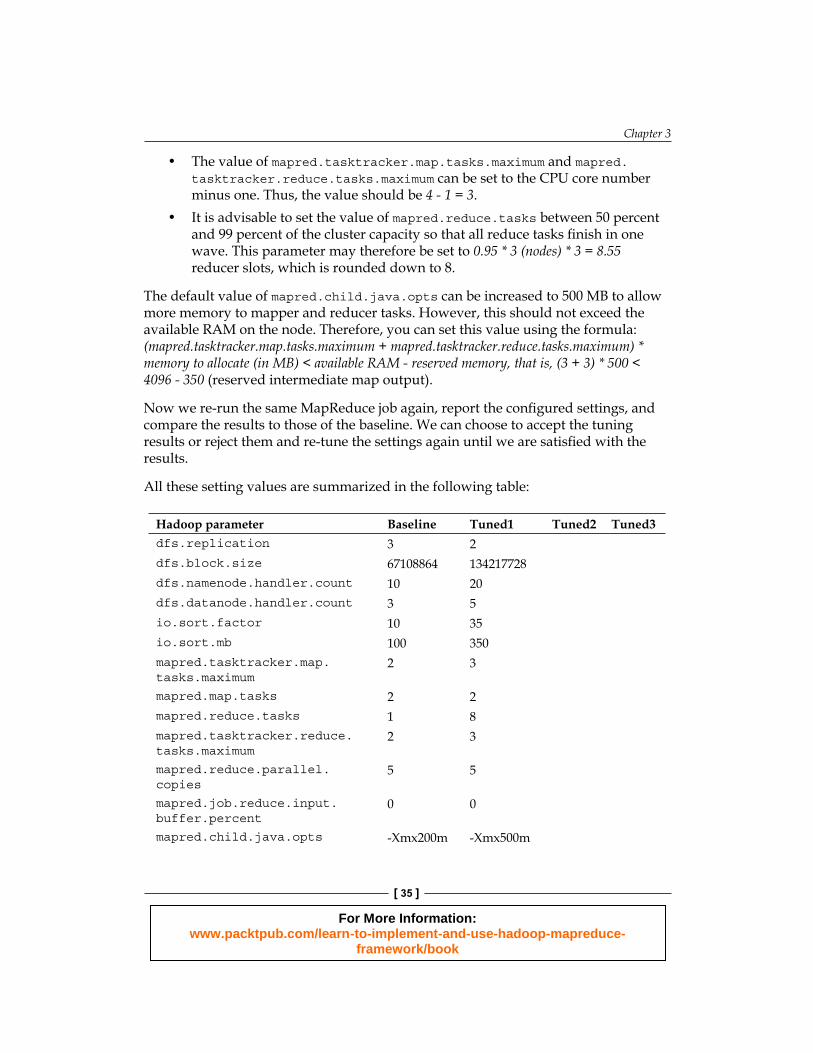
• The value of mapred.tasktracker.map.tasks.maximum and mapred.tasktracker.reduce.tasks.maximum can be set to the CPU core number minus one. Thus, the value should be 4 - 1 = 3.
• It is advisable to set the value of mapred.reduce.tasks between 50 percent and 99 percent of the cluster capacity so that all reduce tasks fi nish in one wave. This parameter may therefore be set to 0.95 * 3 (nodes) * 3 = 8.55 reducer slots, which is rounded down to 8.
The default value of mapred.child.java.opts can be increased to 500 MB to allow more memory to mapper and reducer tasks. However, this should not exceed the available RAM on the node. Therefore, you can set this value using the formula: (mapred.tasktracker.map.tasks.maximum + mapred.tasktracker.reduce.tasks.maximum) * memory to allocate (in MB) < available RAM - reserved memory, that is, (3 + 3) * 500 < 4096 - 350 (reserved intermediate map output).
Now we re-run the same MapReduce job again, report the confi gured settings, and compare the results to those of the baseline. We can choose to accept the tuning results or reject them and re-tune the settings again until we are satisfi ed with the results.
All these setting values are summarized in the following table:
Hadoop parameter Baseline Tuned1 Tuned2 Tuned3dfs.replication 3 2dfs.block.size 67108864 134217728dfs.namenode.handler.count 10 20dfs.datanode.handler.count 3 5io.sort.factor 10 35io.sort.mb 100 350mapred.tasktracker.map.tasks.maximum
2 3
mapred.map.tasks 2 2mapred.reduce.tasks 1 8mapred.tasktracker.reduce.tasks.maximum
2 3
mapred.reduce.parallel.copies
5 5
mapred.job.reduce.input.buffer.percent
0 0
mapred.child.java.opts -Xmx200m -Xmx500m
For More Information: www.packtpub.com/learn-to-implement-and-use-hadoop-mapreduce-
framework/book

Detecting System Bottlenecks
[ 36 ]
Hadoop parameter Baseline Tuned1 Tuned2 Tuned3…Input data size 10 GB 10 GBCluster's node number 3 3Job execution time (sec) 243 185Improvement over baseline (percent) 23.86%
Identifying resource bottlenecksTypically, a bottleneck occurs when one resource of the system consumes more time than required to fi nish its tasks and forces other resources to wait, which decreases the overall system performance.
Prior to any deep-dive action into tuning your Hadoop cluster, it is a good practice to ensure that your cluster is stable and your MapReduce jobs are operational. We suggest you verify that the hardware components of your cluster are confi gured correctly and if necessary, upgrade any software components of the Hadoop stack to the latest stable version. You may also perform a MapReduce job such as TeraSort or PI Estimator to stress your cluster. This is a very important step to get a healthy and optimized Hadoop cluster.
Once your cluster hardware and software components are well confi gured and updated, you need to create a baseline performance stress-test. In order to stress your Hadoop cluster, you can use the Hadoop microbenchmarks such as TeraSort, TestDFSIO, NNBench, or MRBench. All these benchmarks are part of the Hadoop distribution package.
However, remember that a MapReduce job is in fact a pipeline with many stages, and each stage requires different types of resources. The following illustration describes the major resources (CPU, RAM, I/O, and network bandwidth) that are required by Hadoop to complete a MapReduce job and may create a potential resource bottleneck.
Map phase
Reduce phase
InputComputationPartition and sortOutput
Copying Map outputComputationOutput
RAM CPU Storage I/O Network
For More Information: www.packtpub.com/learn-to-implement-and-use-hadoop-mapreduce-
framework/book

Chapter 3
[ 37 ]
Identifying RAM bottlenecksThe RAM (memory) is a potential bottleneck source that may have signifi cant effects on your MapReduce job performance. The amount of memory available on each node should be enough to handle the needs of the job to process. You need to ensure that the memory of the cluster nodes is properly confi gured and set. Otherwise, in an intensive workload context, the Map and Reduce tasks might be initiated but immediately fail. Also, when Hadoop does not have enough memory to handle data, it will use the system storage to store its data and these swaps between memory and storage may be time consuming and will slow down the system.
In order to identify a potential memory bottleneck, you should highlight, using a monitoring tool (such as Ganglia, vmstat), the usage of the swap memory. This will help you to identify whether your map and reduce tasks have enough memory to accomplish their job or not. Otherwise, you should probably extend the node's physical memory or adjust the number of mappers and reducers.
The following screenshot shows the vmstat output report, which shows the amount of memory swapped to disk (so column) and the amount of memory swapped from disk (si column):
In Chapter 4, Identifying Resource Weaknesses, you will learn how to confi gure the number of map and reduce tasks depending on the physical memory you have on each node.
Identifying CPU bottlenecksCPU is the key resource when processing data in both Map and Reduce computation stages. An intensive CPU activity may be the result of an intensive computation in map and/or reduce user function's code. This high CPU utilization may be a potential bottleneck. Also, a CPU may often be idle if it needs to wait for other resources to feed data before it can be processed. This is generally caused by a misconfi guration of the map and reduce tasks and the Hadoop framework underutilizing the CPU resource. The symptoms of a CPU bottleneck aren't diffi cult to recognize. Usually, a processor load (time) often exceeds 90 percent; and on multiprocessor systems, the total processor load (time) exceeds 50 percent. But, these symptoms don't always indicate a processor problem.
For More Information: www.packtpub.com/learn-to-implement-and-use-hadoop-mapreduce-
framework/book

Detecting System Bottlenecks
[ 38 ]
To identify whether your node deals with very high CPU activity, you should examine all processes and threads actually run by the processor using your monitoring tool. Then you should identify whether there is a particular process that monopolizes the CPU and understand why it does so. Tuning map and reduce tasks' numbers may resolve the bottleneck, and as a last resort you may need to upgrade to a faster processor or add additional processors, which is a benefi t for the overall MapReduce job.
Identifying storage bottlenecksStorage I/O is the second most common bottleneck source and unfortunately, this resource is needed by the Hadoop in many stages of the MapReduce pipeline process. Storage resource can decrease MapReduce job performance and become a bottleneck at every stage of the execution pipeline. Prior to any storage tuning action, it is recommended to benchmark your storage to learn about its I/O throughput capabilities. You can do this by running the Hadoop HDFS benchmark TestDFSIO which is a read/write test for HDFS. Also, to run a distributed benchmark, you can use DFSCIOTest, which is an I/O distributed benchmark of libhdfs.
Storage bottlenecks appear as sustained rates of disk activity above 85 percent. But this symptom may also be the result of a memory or CPU bottleneck, which looks like a disk bottleneck. This is why you should fi rst check if there is any memory or a CPU bottleneck before trying to identify a disk bottleneck.
Using the TestDFSIO benchmark tool will help you to know how fast your cluster's NameNode and DataNode storage are. The following fi gure shows a typical TestDFSIO output log:
For More Information: www.packtpub.com/learn-to-implement-and-use-hadoop-mapreduce-
framework/book

Chapter 3
[ 39 ]
To launch a read/write benchmark test using TestDFSIO, you can use the following command line, which writes/reads 10 fi les of 1000 MB each.
hadoop jar hadoop-test.jar TestDFSIO -write -nrFiles 10 -fileSize 1000
hadoop jar hadoop-test.jar TestDFSIO -read -nrFiles 10 -fileSize 1000
Therefore, using log information output of TestDFSIO, you can calculate the storage throughput using the following formula:
Total read throughput and total write throughput = number of fi les * throughput (mb/sec).
In Chapter 4, Identifying Resource Weaknesses, you will learn how to determine the storage capacity for a given node.
Identifying network bandwidth bottlenecksThe network bandwidth may also be a possible bottleneck source. Usually, this bottleneck occurs when you have to transfer a large amount of data over the network. In the Hadoop context, this bottleneck occurs when a large amount of data is present. High network utilization happens when reduce tasks pull data from map tasks in the shuffl e phase, and also when the job outputs the fi nal results into HDFS.
For the storage system, it is recommended to stress your Hadoop cluster in order to learn about your network bandwidth capabilities and ensure that the network utilization will not become a bottleneck when used in a particular job. The network bandwidth needs to be constantly monitored to be able to fi gure out whether your data can be transferred effi ciently between your cluster's nodes.
To analyze your system's performance, you can also use the Linux OS utilities such as dstat, top, htop, iotop, vmstat, iostat, sar, or netstat, which are helpful in capturing system-level performance statistics. Then you use the collected data to study how different resources of the cluster are being utilized by the Hadoop jobs, and which resources create a bottleneck or may be under contention.
To identify and conduct a deep-dive analysis on potential performance bottlenecks induced by software and/or hardware events, you can also use Linux profi lers such as perf or strace.
For More Information: www.packtpub.com/learn-to-implement-and-use-hadoop-mapreduce-
framework/book

Detecting System Bottlenecks
[ 40 ]
The network performance analysis is a follow-up to other monitoring efforts. In general, you should start by checking your networking hardware including external elements such as cables, hubs, switches, among others. Then, ensure that you are using the most current network adapters and latest device driver's version for your network components. You should also check the confi guration of your network and ensure that it is set to the highest and widest bandwidth possible.
To identify potential network bandwidth bottlenecks, you should monitor and check your network data and interrupt rates (the amount of sent and received bytes over your network interface card). If the data rate is close to or equal to one-eighth of the available bandwidth, it can be inferred that this may be the sign of an overloaded network. Also, a high rate of interrupts means your system is being overloaded by interrupts due to network traffi c.
You can check your network traffi c data and interrupt rates using dstat as dstat --nf to display data rates, and dstat -i or dstat -if to display interrupt rates.
SummaryIn this chapter, we introduced the performance tuning process cycle and learned about Hadoop counters. We covered the TeraSort benchmark with its TeraGen module and learned to generate a performance baseline that will be used as a reference when tuning the Hadoop cluster. We also learned the approach to tune a Hadoop cluster illustrated by a three-node Hadoop cluster example and suggested tuning some setting parameters to improve the cluster's performance.
Then we moved ahead and discussed resource bottlenecks and what component is involved at each MapReduce stage or may potentially be the source of a bottleneck. For each component (CPU, RAM, storage, and network bandwidth), we learned how to identify system bottlenecks with suggestions to try to eliminate them.
In the next chapter, we will learn how to identify Hadoop cluster resource weaknesses and how to confi gure a Hadoop cluster correctly. Keep reading!
For More Information: www.packtpub.com/learn-to-implement-and-use-hadoop-mapreduce-
framework/book

Where to buy this book You can buy Optimizing Hadoop for MapReduce from the Packt Publishing website:
.
Free shipping to the US, UK, Europe and selected Asian countries. For more information, please
read our shipping policy.
Alternatively, you can buy the book from Amazon, BN.com, Computer Manuals and
most internet book retailers.
www.PacktPub.com
For More Information: www.packtpub.com/learn-to-implement-and-use-hadoop-mapreduce-
framework/book