optimization of reversed-phase hplc separations of biomolecules · • proteins were fraction...
TRANSCRIPT
Optimization of Reversed-Phase HPLC Separations of Biomolecules
Stephanie A. Schuster, Barry E. Boyes, Brian M. Wagner, and Joseph J. Kirkland
Advanced Materials Technology, Inc., 3521 Silverside Rd., Wilmington, DE 19810
Superficially porous particles were originally created with pore sizes and particle sizes suited for small molecule analytical separations. To improve reversed phase HPLC separations of biomolecules, known to have slower mass transfer kinetics and broader peak shapes, modification of the particles is required. To resolve these limitations, we introduce superficially porous silica particles with properties specifically designed for larger biomolecules. New particle designs with specially selected bonded phases for peptide and protein separations are discussed. Fast, high resolution separations of a variety of peptides and proteins demonstrate the advantage of the superficially porous particle design. The high temperature stability of the columns of these new particles and bonded phase characteristics are ideally suited for the conditions that are often used for analytical and small scale preparative biomolecule separations. Examples of high molecular weight protein separations highlight the advantages of using columns of superficially porous particles with 400 Å pores.
Abstract

0.2 µm
3.0 µm 3.4 µm
Shell with 400 Å pores
Solid Core
HALO Protein HALO-5 Peptide
0.6 µm
3.3 µm 4.6 µm
Shell with 160 Å pores
Solid Core
HALO® Wide-Pore Fused-Core Particles

Peak identities: 1. cytochrome c (12.4 kDa) 2. lysozyme (14.3 kDa) 3. apomyoglobin (17 kDa) 4. catalase (250 kDa total; tetramer of ~60 kDa each) 5. enolase (93 kDa total; dimer of 46.7 kDa each)
Black trace = injection 1 Red trace = injection 385 or after 14,620 column volumes
Column: 2.1 x 100 mm Instrument: Shimadzu Nexera Injection Volume: 1.0 µL Detection: 215 nm Temperature: 90 oC
Flow rate: 0.5 mL/min Mobile Phase A: water/0.1% TFA Mobile Phase B: acetonitrile/0.1% TFA Gradient: 25-40% B in 10 min
0 1 2 3 4 5 6 7 8 9 10
1
2 3
4
5
Time, min
• The HALO Protein C4 bonded phase is stable up to 90 oC, showing very little loss of retention and no changes in peak shapes after almost 15,000 column volumes of mobile phase.
HALO Protein C4 Stability

0 1 2 3 4 5 6 7 8 9 10
Time, min
30 oC 151 bar
60 oC 95 bar
90 oC 68 bar
lysozyme BSA α-chymotrypsinogen A
enolase ovalbumin
Column: 2.1 x 100 mm HALO Protein C4 Instrument: Agilent 1200 SL Injection Volume: 2 µL Detection: 215 nm Temperature: as indicated
Mobile Phase A: water/0.1% TFA Mobile Phase B: acetonitrile/0.1% TFA Gradient: 28-58% B in 10 min. Flow rate: 0.45 mL/min
Peak Identities (in order): 1. Lysozyme 14.3 kDa 2. BSA 66.4 kDa 3. α-Chymotrypsinogen A 25.0 kDa 4. Enolase 46.7 kDa 5. Ovalbumin 44.0 kDa
Protein Separations: Effect of Temperature
• Protein peak shape and recovery improve with increased temperature of separation.

Sample: In order 1. Cytochrome c, 12.4 kDa 2. Lysozyme, 14.3 kDa 3. α-chymotrypsin, 25 kDa 4. Catalase, 250 kDa (4 x 60 kDa) 5. Carbonic anhydrase, 29 kDa 6. Enolase, 46.7 kDa 7. β-amylase, 200 kDa (4 x 50 kDa)
Column: 2.1 x 100 mm Instrument: Shimadzu Nexera Injection Volume: 1 µL Detection: PDA @ 280 nm Temperature: 60 oC Flow rate: 0.5 mL/min Pressure: 109 bar
Mobile Phase A: water/0.1% TFA Mobile Phase B: 80/20 ACN/water/0.1% TFA Gradient: Time Mobile Phase Composition 0 min. 35% B 0-2 min. 35-47.5% B 2-8 min. 47.5-60% B
Fast Protein Separation
0 1 2 3 4 5 6 7 8
HALO Protein C4 3.4 µm 400 Å
1 2
3
4
5
6 7
Time, min.
• A very wide range of molecular weights of small to large proteins is separated in less than 7 minutes using HALO Protein C4.

-2
2
6
10
14
18
22
26
30
0.0 0.5 1.0 1.5 2.0 2.5
Column: 2.1 x 100 mm Instrument: Agilent 1200 SL Injection Volume: 1 µL Detection: 215 nm Temperature: 60 oC
Flow rate: as indicated Mobile Phase A: water/0.1% TFA Mobile Phase B: acetonitrile/0.1% TFA Gradient: as indicated
Peak Identities: 1. Ribonuclease A 2. Cytochrome c 3. Lysozyme 4. α-Lactalbumin 5. Catalase 6. Enolase HALO Protein C4, 3.4 µm, 400 Å
Pressure: 455 bar 2.2 mL/min; 23-52% B in 2.5 min
0.011
0.010
0.011
0.010
Abs
orba
nce,
mA
U
Abs
orba
nce,
mA
U
Time, min
Time, min
0.014
0.012
Totally Porous C4, 1.7 µm, 300 Å Pressure: 570 bar 1.1 mL/min; 23-52% B in 5 min
0.019
0.018
0.022
0.018
0.030
0.026
Protein Separations: 3.4µm Fused-Core vs. 1.7µm Totally Porous
Given the low back pressure of the HALO Protein column, the flow rate can be doubled while the gradient time is cut in half. This yields a separation in half of the time as the one run on the sub-2-µm totally porous column. Numbers above peaks are widths in minutes.
-2
2
6
10
14
18
22
26
30
0.0 0.5 1.0 1.5 2.0 2.5 3.0 3.5 4.0 4.5 5.0
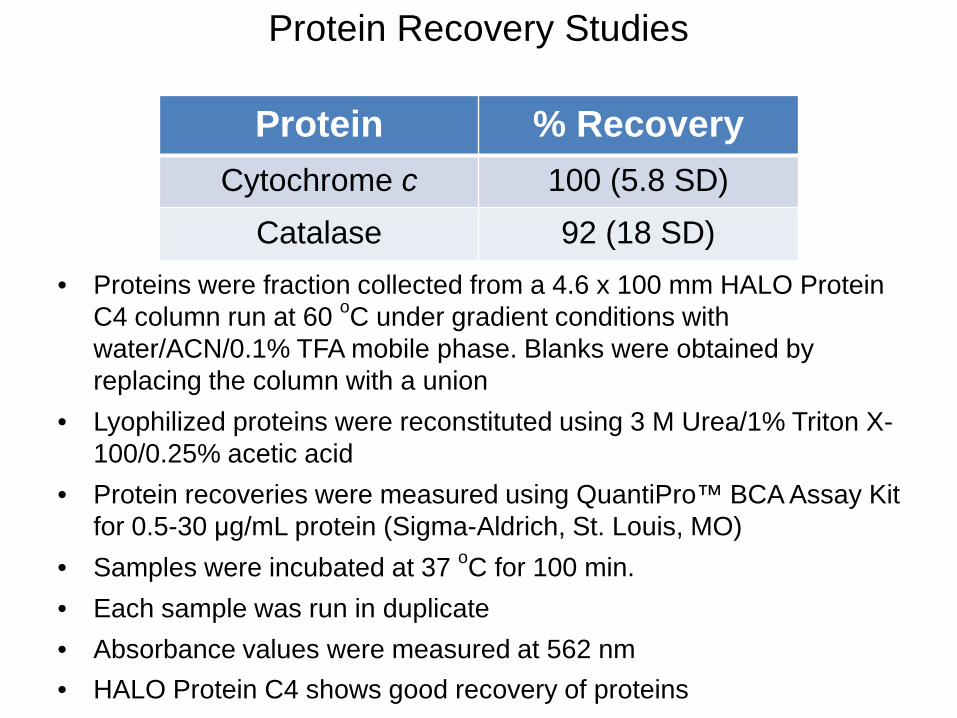
• Proteins were fraction collected from a 4.6 x 100 mm HALO Protein C4 column run at 60 oC under gradient conditions with water/ACN/0.1% TFA mobile phase. Blanks were obtained by replacing the column with a union
• Lyophilized proteins were reconstituted using 3 M Urea/1% Triton X-100/0.25% acetic acid
• Protein recoveries were measured using QuantiPro™ BCA Assay Kit for 0.5-30 μg/mL protein (Sigma-Aldrich, St. Louis, MO)
• Samples were incubated at 37 oC for 100 min. • Each sample was run in duplicate • Absorbance values were measured at 562 nm • HALO Protein C4 shows good recovery of proteins
Protein % Recovery Cytochrome c 100 (5.8 SD)
Catalase 92 (18 SD)
Protein Recovery Studies

Columns: 2.1 x 100 mm Instrument: Shimadzu Nexera Injection Volume: 1 µL Detection: 280 nm Temperature: 60 oC
Mobile Phase A: water/0.1% TFA Mobile Phase B: 80/20 ACN/water/0.1% TFA Gradient: 40-47% ACN in 10 min. Flow rate: 0.3 mL/min
Peak Identities: 1. Catalase 250 kDa [~60 kDa subunit] 2. α-Chymotrypsinogen A 25.0 kDa 3. β-Galactosidase 465 kDa [116 kDa subunit] 4. β-Amylase 200 kDa [~50 kDa subunit]
Protein Separations: Effect of Pore Size
Time, min 0 1 2 3 4 5 6 7 8 9 10
HALO Protein, C4 400 Å
Competitor SPP, C4 200 Å
1
3
2
4
1 3
2
4
• The 400 Å pores of HALO Protein enable sharp peaks for high MW biomolecules.

Time, min
-1
0
1
2
3
4
5
6
7
8
9
10
0 5 10 15 20 25 30
Light chain subunits @ 17-25 kDa
Heavy chain subunits @ ~220 kDa
Abs
orba
nce,
mA
U
Large Protein Separation using 3.4 µm Fused-Core Column: 2.1 x 100 mm HALO Protein C4 Instrument: Agilent 1200 SL Injection Volume: 1 µL Sample: myosin Detection: 215 nm
Flow rate: 0.45 mL/min Mobile Phase A: water/0.1% TFA Mobile Phase B: acetonitrile/0.09% TFA Gradient: 35-55% B in 30 min Temperature: 80 oC
High resolution is obtained for the separation of this denatured contractile protein (purified rabbit skeletal muscle whole myosin (Cytoskeleton, Inc.) using HALO Protein C4.
0
1
2
3
4
5
6
7
8
6.5 7.5 8.5 9.5
Expanded view

-5
45
95
145
195
245
0 5 10 15 20 25 30
Abso
rban
ce (m
AU)
Time (min)
Columns: 4.6 x 150 mm Instrument: Agilent 1100 Injection Volume: 10 µL Detection: 215 nm Temperature: 40 oC
Flow rate: 1.0 mL/min Mobile Phase A: water/0.1% TFA Mobile Phase B: ACN/0.1% TFA Gradient: 5-50% ACN in 30 min
Peak Identities: 1. Asp-Phe 2. Angiotensin (1-7) amide 3. Tyr-Tyr-Tyr 4. Bradykinin 5. Leu-Enk 6. Angiotensin II 7. Neurotensin 8. β-endorphin 9. Sauvagine 10. Mellitin
-5
45
95
145
195
245
0 5 10 15 20 25 30
Abso
rban
ce (m
AU)
Time (min)
1
2
3
4 5
6
7 8 9 10
1 2
3
4 5 6
7 8 9 10
HALO-5 Peptide ES-CN
HALO-5 Peptide ES-C18
10 Peptides: Selectivity changes with different stationary phases
The selectivity between peak pairs 2 & 3 and 5 & 6 is different on the ES-CN phase compared to the ES-C18 phase.
-5
45
95
145
195
245
295
0 5 10 15 20 25 30 35 40 45
Abso
rban
ce @
215
nm
Time, min
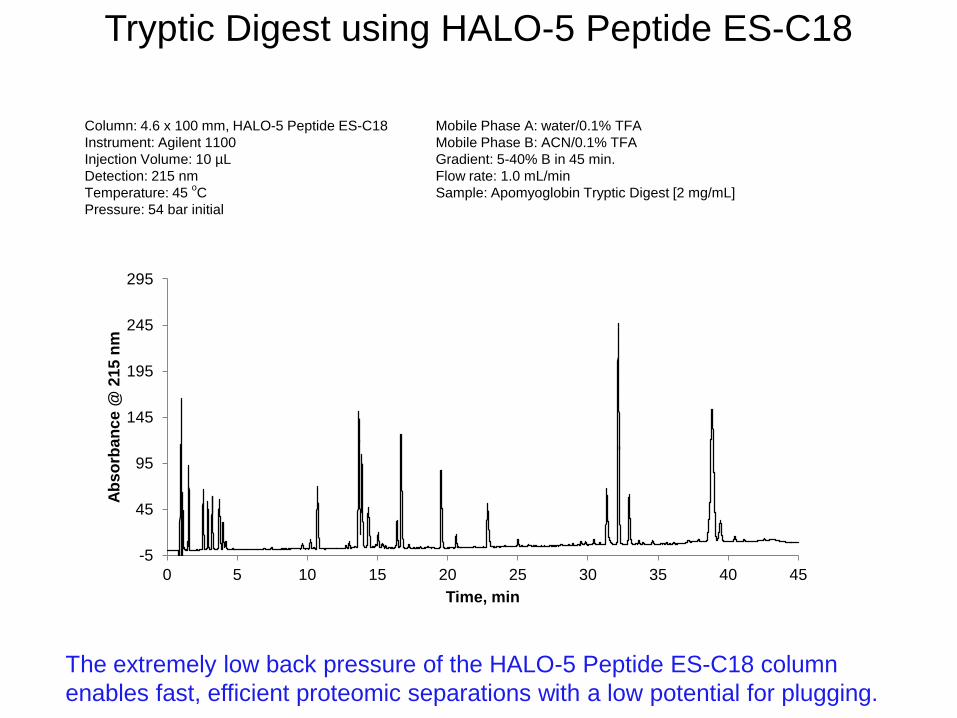
Column: 4.6 x 100 mm, HALO-5 Peptide ES-C18 Instrument: Agilent 1100 Injection Volume: 10 µL Detection: 215 nm Temperature: 45 oC Pressure: 54 bar initial
Mobile Phase A: water/0.1% TFA Mobile Phase B: ACN/0.1% TFA Gradient: 5-40% B in 45 min. Flow rate: 1.0 mL/min Sample: Apomyoglobin Tryptic Digest [2 mg/mL]
The extremely low back pressure of the HALO-5 Peptide ES-C18 column enables fast, efficient proteomic separations with a low potential for plugging.
Tryptic Digest using HALO-5 Peptide ES-C18

Peptide Separations: Fused-Core compared to Totally Porous Columns: 4.6 x 150 mm
Instrument: Agilent 1100 Injection Volume: 5 µL Detection: 215 nm Temperature: 40 oC
Flow rate: 4.0 mL/min Mobile Phase A: water/0.1% TFA Mobile Phase B: acetonitrile/0.1% TFA Gradient: 5-60% B in 5 min
Peak Identities (in order): 1. Asp-Phe 2. Tyr-Tyr-Tyr 3. Bradykinin 4. Angiotensin II 5. Neurotensin 6. β-endorphin 7. Sauvagine 8. Mellitin
-10
0
10
20
30
40
50
60
70
0.0 0.5 1.0 1.5 2.0 2.5 3.0 3.5 4.0 4.5 5.0
-10
0
10
20
30
40
50
60
70
0.0 0.5 1.0 1.5 2.0 2.5 3.0 3.5 4.0 4.5 5.0
HALO-5 Peptide ES-C18 Pressure: 313 bar Peak capacity: 94
Totally Porous 5 µm C18 Pressure: 331 bar Peak capacity: 37
Time, min
Time, min
Abs
orba
nce,
mA
U
Abs
orba
nce,
mA
U
1
2 Pw = 0.015
3
4
5 6
Pw = 0.022 7
8 Pw = 0.022
1
2 Pw = 0.028
3 4
5 6 Pw = 0.051 7
8 Pw = 0.064
Broad peaks are exhibited by totally porous particles at high flows due to long diffusion paths compared to the thin shells of SPP. The peak capacity is 2.5 times greater with the SPP column compared to the totally porous particle column. Pw is peak width in minutes.
-5000
0
5000
10000
15000
20000
25000
30000
35000
0 1 2 3 4 5 6 7 8 9 10
Abs
orba
nce
@ 2
80 n
m
Time (min.)
-500
0
500
1000
1500
2000
2500
6.5 7 7.5 8 8.5 9
Time (min.)
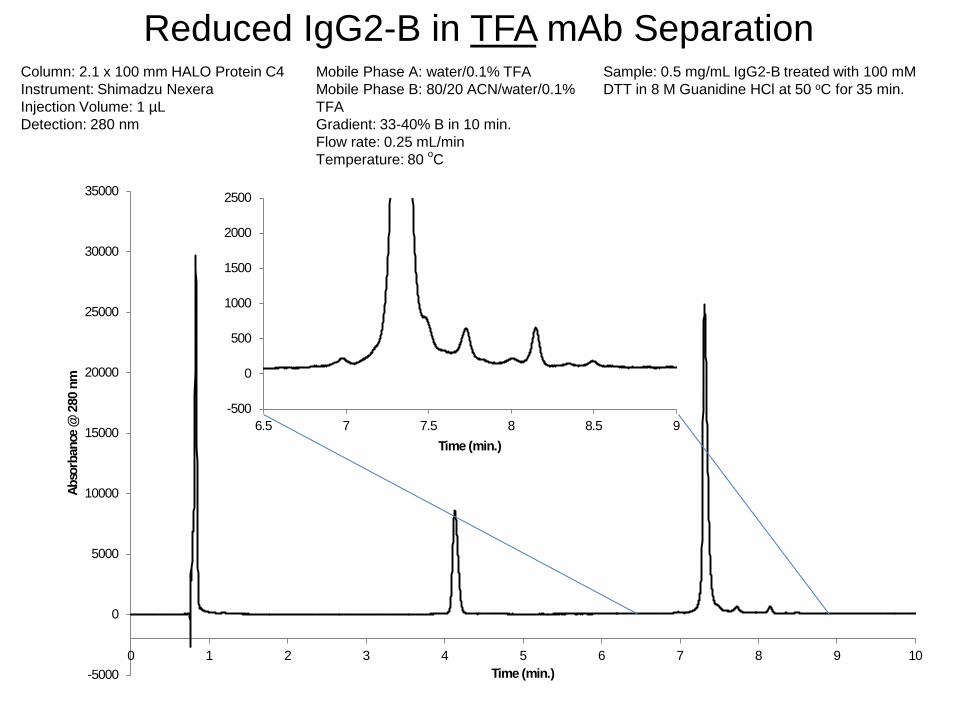
Column: 2.1 x 100 mm HALO Protein C4 Instrument: Shimadzu Nexera Injection Volume: 1 µL Detection: 280 nm
Mobile Phase A: water/0.1% TFA Mobile Phase B: 80/20 ACN/water/0.1% TFA Gradient: 33-40% B in 10 min. Flow rate: 0.25 mL/min Temperature: 80 oC
Sample: 0.5 mg/mL IgG2-B treated with 100 mM DTT in 8 M Guanidine HCl at 50 oC for 35 min.
Reduced IgG2-B in TFA mAb Separation

High Resolution LC/MS Analysis of IgG1 mAb Polypeptide Chains Using HALO Protein C4
0.0 2.5 5.0 7.5 10.0 12.5 15.0 17.5 min
0.0
1.0
2.0
3.0
4.0
5.0
6.0
7.0
LC1
23,2
04
LC2;
23,
192
LC3;
23,
203
HC
1; 5
0,53
9
HC
2; 5
0424
H
C3;
50,
668
HC
4; 5
0,68
0
HC
5; 2
8,86
2
Column: 2.1 mm ID x 100 mm HALO Protein C4 Flow rate: 0.4 mL/min. A: 0.5 % formic acid with 20 mM Ammonium Formate B: 45% AcN/45% IPA/ 0.5 % formic acid with 20 mM Ammonium Formate Gradient: 29-32% B in 20 min. Temperature: 80 oC Detection: 280 nm MS Conditions: Shimadzu LCMS-2020, ESI +4.5 kV, 2 pps, 500-2000 m/z
500 750 1000 1250 1500 1750 m/z 0.00
0.25
0.50
0.75
1.00
1.25
1.50
1.75
2.00
2.25
2.50
2.75
3.00
3.25
3.50
Inten. (x100,000)
1366.0
1290.0
1221.9
1161.4
1105.9 1451.6
1655.6 1546.7
1010.1 1783.1
1931.5 930.2
859.4 1604.6 773.6 1859.1
LC = light chain HC = heavy chain
Masses deconvoluted using MagTran
Abs
orba
nce
@ 2
80 n
m IgGs were reduced and alkylated
by sequential treatment with 10 mM DTT, 15 mM iodoacetamide, then quenched with an additional 10 mM DTT, all in 6 M guanidine HCl/20 mM Tris-HCl buffer at pH 7.8. Reduced and alkylated IgG solutions were buffer exchanged into 0.1% TFA using VivaSpin (Sartorius Stedim Biotech, Goettigen, Germany) centrifugal concentrators with 5 kDa cut-off HY polymeric membranes. The reduced and alkylated IgGs were adjusted to 2 mg/mL protein in 0.1% TFA and stored at -25 oC until use.
Sample Preparation

• Fused-core particles with 400 Å pores are effective for efficiently
separating proteins without restricted diffusion • Protein separations can be run approximately 2 times faster and with
lower backpressure on columns of Fused-core particles compared to columns of sub-2-um particles
• Fused-core particles have performance advantages over totally porous particles for separating peptides and proteins
• Columns of Fused-core particles with 400 Å pores are both efficient and stable up to 90 oC
• With the low back pressure afforded by 5-µm 160 Å Fused-core particles and the use of 2-µm frits, columns of these particles are less prone to plugging and longer columns can be run for high resolution separations of proteomic samples.
• With the correct choice of mobile phase, high resolution LC-MS data can be obtained for mAb separations using 400 Å Fused-core particles
Conclusions

Special thanks to Robert Moran for assistance with chromatographic measurements.
Acknowledgment