optimization of nonionic/anionic surfactant blends for enhanced oily soil removal
TRANSCRIPT
SURFACTANTS & DETERGENTS E
Optimization of Nonionic/Anionic Surfactant Blends for Enhanced Oily Soil Removal Klrk H. Raney Shell Development Company, Westho~low Research Center, Houston, Texas 77251-1380
525
Previously reported results for alcohol ethoxylate surfac- tants have shown that optimum removal of both nonpolar and sebum-like liquid soils from polyester/cotton fabric occurs at the phase inversion temperature (PIT) of the surfactant-water-soil system. A similar correlation be- tween phase inversion and optimum detergency has been identified for detergent systems containing mixtures of nonionic and anionic surfactants such as alcohol ethox- ylates and alcohol ethoxysulfates. Experimental tech- niques other than direct detergency studies are described which allow determination of the optimum nonionie/ anionic surfactant ratio for removal of a particular soil at a specified temperature. In addition, implications of these results for development of temperature-insensitive detergent formulations containing alcohol ethoxylates are discussed.
KEY WORDS: Anionic, detergency, inversion, nonionic, optimum, phase, surfactant.
Anionic and nonionic surfactants are the two most com- mon surfactant types used in cleaning products. The following are some typical performance characteristics of the two classes of surfactants: Anionic [e.g., linear alkyl- benzene sulfonate (LAS), alcohol ethoxysulfate (AES)], high foaming, low temperature sensitivity, low water hard- ness tolerance (especially LAS), and good particulate soil detergency; Nonionic [e.g., alcohol ethoxylate (AE), nonylphenol ethoxylate/NPE)], low foaming, high temper- ature sensitivity, high water hardness tolerance, and good oily soil detergency. Because of their complimentary nature, nonionic and anionic surfactants are often utiliz- ed together to take advantage of the beneficial properties of each. Of particular importance is the use of no- nionic/anionic surfactant blends such as AE/AES and AE/LAS mixtures in household detergent products.
For both formulatability and performance reasons, such combinations of anionic and nonionic surfactants are quite commonly found in heavy duty liquid detergents (1,2}. In addition, the use of AE/AES blends in dry-blended deter- gent powders should increase with the recent development of liquid, high active matter AE/AES systems contain- ing no solubilizing alcohol and very little water 13). Of in- terest, therefore" is a fundamental understanding of the mechanisms by which these surfactant mixtures remove soils from fabric and whether correlations between phase behavior and detergency such as those found for nonionic- only systems can be used to optimize nonionic/anionic sur- factant systems.
Address correspondence to: Shell Development Co., Westhollow Research Center, P.O. Box 1380, Houston, TX 77251-1380.
REVIEW OF PREVIOUS RESULTS
Phase inversion and detergency--s ingle-component non- ionic surfactants. Previous studies of ternary alcohol ethoxylateJwater/hydrocarbon systems have shown a direct correlation between microemulsion phase behavior and detergency {4,5}. Of key importance is the phase in- version temperature {PIT} of a nonionic surfactant/ water/oil system where the surfactant properties are well- balanced for both water and oil (6). With regards to a system containing approximately equal quantities of oil and water and less than about 10% surfactant, an oil-in- water microemulsion in equilibrium with an excess oil phase forms well below the PIT, while a water-in-oil microemulsion in equilibrium with water forms well above the PIT. Near the PIT, a three-phase system is present consisting of a water phase, an oil phase, and a middle- phase microemulsion containing significant amounts of both oil and water.
Table 1 shows that optimum removal of cetane (hexa- decane) from 65:35 polyester/cotton fabric by specific, i.e., single-component, alcohol ethoxylates occurs at the PIT with the more hydrophilic surfactants exhibiting higher optimum detergency temperatures (ODT) ~4,5). In this case. the surfactants were based on n-dodecanol and con- tained exactly 3, 4, or 5 moles of ethylene oxide. The high detergent activity at the PIT is attributable to the ultra- low soil-water interfacial tensions (----10 -3 dyne/cm), which facilitate emulsification of oil into the water, as well as to high levels of oil solubilization, which occur at the PIT (4,5). In the systems shown in Table 1, the PIT occurs about 20 degrees above the surfactant cloud point in the temperature regime where the washing solution is a dis- persion of a lamellar liquid crystalline phase (7).
Similar results have been found for removal of liquid triglycerides, e.g., triolein, and hydrocarbon/long-chain alcohol (or acid} blends from 65:35 polyester/cotton fabric /8,9}. In the former case. the PIT and ODT for triolein are equivalent, but higher than found for cetane soil (8). For example, C12E5 provides optimum removal of triolein at 65~ which is 35 ~ above the surfactant cloud point. In contrast, optimum removal of sebum-like hydrocarbon/ polar oil blends is found in the temperature range between
TABLE 1
Correlation of PIT to Optimum Detergency Temperature a Cetaae Removal from 65:35 Polyester/Cotton; 0.05% Surfactant
Specific ethoxylate PIT (~ ODT (~
C12E s 52 50 C12E 4 31 30 C12E 3 <20 <20
aReferences 4 and 5.
JAOCS, Vol. 68, no. 7 (July 1991)

526
SURFACTANTS & DETERGENTS
the PIT and cloud point, with the PIT being well below the cloud point (9). This range of optimum temperatures for the nonpolar/polar soil systems was attributed to the unequal removal rates of the nonpolar and polar soil com- ponents that changes the soil composition during the course of the washing cycle. Kinetic detergency studies reveal, however, that the fastest soil removal occurs directly at the PIT corresponding to the original soft com- position (9).
Phase inversion and detergency--commercial ethox- ylates. Practical detergency applications utilize commer- cial alcohol ethoxylate surfactants that contain a broad range of species having varying levels of ethylene oxide. In these systems, unlike those containing single surfac- tants, the PIT increases with increasing oil/surfactant ratio due to the enhanced partitioning of low-EO species and alcohol into the oil phase. This selective partitioning varies with temperature which, in turn, changes the com- position of the surfactant film residing at the interfaces between the oil and water domains in the microemulsion {10,11). For commercial surfactant systems, Kunieda and co-workers (12) have shown that an approximately linear relationship typically holds between PIT and oil/surfac- tant weight ratio, Ro~, which can be written as:
Ro~ = A(PIT - (PIT)Ro~-0) [1]
where A is a positive constant for a particular surfactant system and (PIT)Ro~_0 is the extrapolated PIT at very low levels of oil.
Because many detergency processes have quite low soil/surfactant ratios, e.g., less than one, surfactant par- titioning is minimal, and (PIT)Ro,_ 0 is essentially equivalent to the optimum detergency temperature. Use of this concept, which relates the detergency process to phase behavior studies, has been previously shown to be applicable to removal of hydrocarbon soils from polyester/ cotton fabric by two-component alcohol ethoxylate sys- tems (13}. Of more practical importance is that one can predict optimum detergency conditions for a given com- mercial nonionic surfactant or blend of commercial prod- ucts. Conversely, one can determine the commercial sur- factant systems that are active in a desired temperature range, e.g., low temperatures, without actually perform- ing detergency studies (14).
Extension to nonionic/anionic surfactant mixtures. A previous study has shown that the removal of mineral oil from fabric by nonionic/anionic mixtures can be related to the aqueous phase behavior of the surfactant system (15). As found for nonionic-only systems, optimum soil removal was found to occur at compositions where the aqueous surfactant solution contained lamellar liquid crystals. Als(~ these compositions could be easily iden- tified through measurement of the turbidity of the sur- factant solution. However, no attempt to extend the screening study to other types of soil was attempted.
In the presence of oil, a nonionic/anionic surfactant blend exhibits a higher PIT than the corresponding nonionic-only system (16). This behavior can be attributed to the hydrophilic nature of anionic surfactants. In addi- tion, because of the greatly differing solubilities of the two types of surfactant in both oil and water, the PIT of a no- nionic/anionic system is even more highly dependent on the oil/surfactant ratio than a commercial nonionic
system. As a result, rather than measuring the PIT at various oil]surfactant ratios to determine the extrapolated PIT at Ros approaching zero, a more convenient and ac- curate approach for nonionic/anionic fnixtures is to deter- mine the composition of the surfactant film which is optimized for very low interfacial tension at a given temperature.
A technique for determining this optimum film com- position for two-component nonionic/anionic blends has been previously reported (17). Through measurement of the surfactant compositions yielding phase inversion at different ofl/surfactant ratios a linear plot can be obtained that is described by the following equation:
So(l - S,)Ro~ W = S~ + [2]
( 1 - So)
where W is the total weight fraction of nonionic surfac- tant in the system, S~ is the weight fraction of nonionic surfactant in the surfactant film at the oil-water interface, and So is the weight fraction of nonionic surfactant in the oil phase At a given temperature, the slope of the line is constant, while in the limit of very little oil, Ros-~0 and W --- Sf. Equation [2] is based on the findings that negligible anionic surfactant is found in the excess oil and water phases so that essentially all of it resides at the oil- water interface {11,17).
Shown schematically in Figure 1 is a phase inversion plot typical of those found for a nonionic/anionic surfac- tant blend. As is evident from Equation [2], the y- intercept is equivalent to the composition of the optimized surfactant film (S~), i.e., that surfactant film composition providing the lowest oil-water interfacial tension, at a given temperatur~ The slope of the phase inversion plot increases as the solubility of nonionic surfactant in the oil, So, increases, such as occurs when temperature is increased.
Below the optimum fraction of nonionic surfactant, the system is hydrophilic and tends to form an oil-in-water emulsion. In contrast, a water'in-oil emulsion forms at compositions above the phase inversion line As a result, a convenient technique for determining phase inversion
' / "= W/O Emulsion
Conductivity / ~ Phase Low / Invers!o.n
~ Compositions
.c_ ~ Optimum
.o_ Detergent -oE . Composition z
O/W Emulsion -~ High Conductivity
0 I 0 10 20
Oil/Total Surfactant Wt. Ratio
FIG. 1. Phase inversion in emulsions containing nonionic/anionic sur factant mixtures.
JAOCS, Vol, 68, na 7 (July 1991)
SURFACTANTS & DETERGENTS
527
compositions is through the use of electrical conductiv- ity measurements, which identify the transition from a water-continuous emulsion exhibiting high conductivity to an off-continuous emulsion exhibiting low conductiv- ity. This technique has previously been utilized to deter- mine conditions of phase inversion and ultralow interfacial tensions in systems containing nonionic surfactants {18).
EXPERIMENTAL PROCEDURES
Determination of phase plots for nonionic]anionic surfac- rant systems like that shown schematically in Figure 1 was accomplished through use of electrical conductivity measurements. The procedure used involved mixing 75 grams of oil with 3 grams of an oil-soluble alcohol ethox- ylate in a water-jacketed glass beaker placed on a magnetic stirring plate. A necessary requirement for the ethoxylate was that it had a PIT with the oil below the minimum experimental temperature Then 75 grams of an aqueous electrolyte solution were added, and the system was allowed to come to the desired temperature A 1% NaC1 solution was used in this study for comparison to previous phase behavior results. However, lower levels of any electrolyte commonly used in detergents, eg., sodium sulfate or sodium carbonate, could also be used although the changes in conductivity would be less pronounce& The conductivity of the stirred sample was monitored through use of a YSI Model 34 conductivity meter equipped with a glass micro conductivity cell (YSI Model 3403) with a cell constant of 1.0 cm -1 {Yellow Springs Instrument Ca, Yellow Springs, OH).
Because a water-in-oil emulsion forms first, a very low conductivity was initially obtained. An aqueous solution of an anionic surfactant (approximately 20% by weight) was added slowly until a rise in conductivity was noted. Additional anionic surfactant was added in very small in- crements, causing step-wise increases in conductivity, until no additional increase in conductivity was observed. In the presence of 1% NaC1, the total change in conduc- tivity was 3-to-4 orders of magnitude, allowing easy discrimination of phase inversion that typically occurs in a narrow range of added anionic surfactant. In these studies, the anionic content yielding half of the total con- ductivity increase was taken to be the phase inversion composition.
Additional nonionic surfactant was then added to lower the conductivity to a very small value by inverting the emulsion, and the addition of anionic surfactant was repeated. In this manner, additional data points could be obtained at lower oil/surfactant ratios while using the same sample Formation of viscous gels generally limited the total amount of surfactant that could be added to a particular system. To confirm the accuracy of this type of conductivity study for determining the parameters in Equation [2], gas chromatography analyses of some separated oil phases obtained at phase inversion were per- formed to determine the amount of nonionic surfactant in the oil, i.e., So in Equation [2].
Kinetic interracial tension measurements were made at various temperatures with a University of Texas Model 500 spinning drop tensiometer. Details of this technique, which is most suitable for systems exhibiting very low interfacial tensions, may be found elsewhere (19). After the surfactant solution reached the desired temperature,
a 3-~L oil drop was injected into the sample tube through the septum at the capped end of the tube and spinning was initiated. The experiments were recorded by a high resolution video camera. The videotapes were later analyz- ed at the desired time intervals by means of a digital im- age processing system, which could freeze and digitally enhance the image to allow accurate measurement of drop dimensions.
Terg-O-Tometer detergency tests were performed by Shell's standard radiolabeled soils detergency procedure {20). Removal of cetane soil I3H-tagged) was measured from one 65:35 polyester/cotton fabric swatch containing 28 mg of soil. This loading corresponds to a soil-to-fabric weight ratio of 0.025. Absolute soil removal levels were obtained by liquid scintillation counting of radioactivity in the wash water. The total surfactant concentration was kept constant at 0.05% wt., so that the surfactant-to-soil weight ratio was approximately 9. The wash water con- tained 1% NaC1 for comparison of the detergency results to the corresponding phase behavior and conductivity studies. It also contained 50 ppm triethanolamine to raise the pH of the solution to 7-8. The washing time was 10 min for all experiments. The reported results are all averages of duplicate runs.
Surfactants studied included the specific, single-com- ponent alcohol ethoxylates C12E2, C12E 8, and C12E 5, which were used as received from Nikko Chemical Com- pany (Toky~ Japan). The anionic surfactants studied in- cluded the sodium salt of C~2 linear alkylbenzene sul- fonate (LAS) obtained in 60% active form from Witco (New York, NY). Also, 20% active aqueous solutions of a variety of sodium alcohol ethoxysulfates were used, in- cluding N23-3S, N23-6.5S, and N23-12S. These were prepared by SOs sulfation of alcohol ethoxylates from Shell Chemical Company {Houston, TX) based on a predominantly linear C~2-C13 alcohol blend and contain- ing an average of 3, 6.5, and 12 ethylene oxide units, respectively. Hydrocarbons used in the conductivity studies included decane, hexadecane, and squalane and were all greater than 99% in purity. Oleyl alcohol and oleic acid of greater than 99% purity were obtained from Sigma Chemical (St. Louis, MO} and used as received.
RESULTS
Correlation of phase behavior and detergency. Figure 2 shows the phase inversion compositions for the C12E3/ N23-3S system at both 29 ~ and 50~ This system was chosen for study since C12E 3 alone is too hydrophobic for optimum cetane removal at t37pical washing temperatures, i.e., its PIT is well below room temperature, as is shown in Table 1. As a result, addition of hydrophilic N23-3S was expected to yield optimized systems in the temperature range of interest. Straight lines are shown in Figure 2 indi- cating that the analysis, which was developed with single- component anionic surfactant systems, also holds for mul- ticomponent commercial anionic systems (17). Also, the data at 29~ match the results obtained previously by visual studies of microemulsion phase behavior, indicat- ing that the conductivity technique and the criteria chosen for determining the optimum systems are accurate (21).
As explained previously, the slopes of the lines in Fig- ure 2 are essentially proportional to the weight fraction of nonionic surfactant in the oil phase, So, and indicate,
JAOCS, Vol. 68, na 7 (July 1991)

528
SURFACTANTS & DETERGENTS
1.0
0.9
G 0.8
0.7
0.6
S / S
I I I I 0 5 10 15 20 25
Cetane/Surfactant Wt. Rat io
FIG. 2. Phase inversion compositions for C12E3/N23-38 system.
0.90
0.85
~3 ~ o.8o ~ d g o.75
ft. 0.70
0.65
0.60 I I I l I 20 25 30 35 40 45 50
T e m p e r a t u r e , ~
FIG. 3. Predicted optimum detergent compositions for cetane removal by ClzE3/N23-3S system (ref. 20).
as expected, higher partitioning of C12E3 into the oil at 8o higher temperatures. From the slope and intercept of the line for 29~ a value of 0.027 is obtained for So which
7O matches exactly the weight fraction found in the excess oil phase at that temperature by GC analysis. A value of 0.049 is calculated for So from the 50~ plot indicating ~ 6o almost twice as much nonionic surfactant is solubilized into cetane at the higher temperature.
Of more practical importance are the intercepts of the E 50 plots with the y-axis, which are the optimized surfactant film compositions for the temperatures and which are ex- ~ 4o pected to be the optimum detergent compositions for these temperatures as well. From Figure 2, the optimum weight fractions of C12E3 at 29 ~ and 50~ are predicted 3o to be 0.78 and 0.67, respectively. The higher relative pro- portion of N23-3S required to optimize the system at 50~ is not surprising because the nonionic surfactant is more 20 hydrophobic at that temperature. The effect of tempera- ture is shown more explicitly in Figure 3 where the op- timized film composition for the C12E3/N23-3S system is plotted as a function of temperature (21).
Figure 4 shows the results of detergency experiments with the optimized systems as predicted from Figure 2. 10 When used alone, the off-soluble C12E3 provides less than 30% cetane removal above 20~ However, the addition of relatively small quantities of N23-3S are sufficient to
1 increase the detergency significantly. More specifically, those systems predicted to be optimized at 29~ and 50~ did provide their highest cetane removal at those temper- E atures. The system optimized for 29~ therefore simulates ~ 0~ an all-nonionic C~2E4 system (see Table 1) while the 67-33 C12E3/N23-3S system performs similarly to C12E5, which ~- exhibits a PIT of 52~ with cetane. The temperature- sensitivity of the C~2EJN23-3S system is evident in 0.~ Figure 4, which indicates that insufficient anionic surfac- tant is present in those blends to effectively counteract the solubility properties of the nonionic surfactant.
To help explain the varying levels of soil removal found o.ool at the different temperatures, dynamic interracial tension (IFT} studies were performed. The results shown in Figure 5 were obtained at various temperatures for a 78:22 C~2E3/N23-3S blend. These studies were performed with
I I I I I 10 20 30 40 50 60 ;
Temperature, ~
FIG. 4. Cetane removal by C12E31N23-3S blends.
0.5% Surfactant 3/1 Su#actant/Cetane Wt. Rat io
25 ~ "~
30oc -~"
I I I I I I I | | 10 20 30 40 50 60 70 80 90
l~rne, rain
FIG. 5. Effect of temperature on IFTs of 78122 C12E31N23-3S system.
JAOCS, Vol. 68, no. 7 (July 1991)
SURFACTANTS & D E T E R G E N T S
529
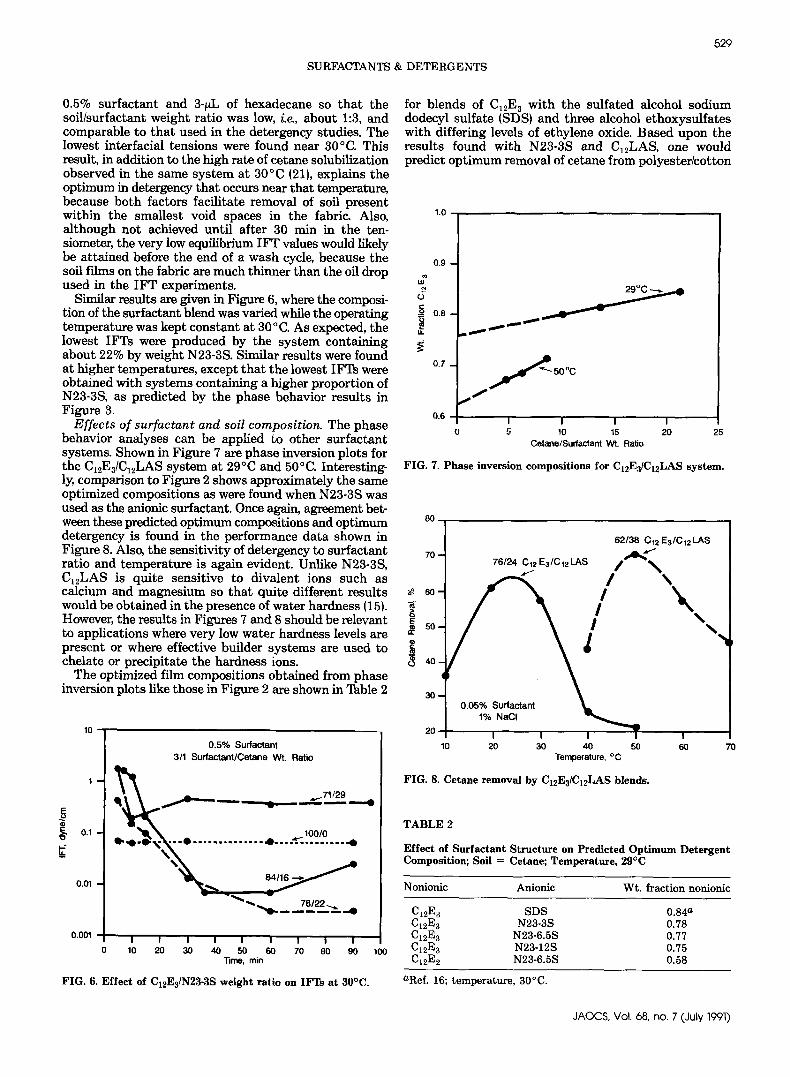
0.5% surfactant and 3-~L of hexadecane so that the soil/surfactant weight ratio was low, i.e., about 1:3, and comparable to that used in the detergency studies. The lowest interfacial tensions were found near 30~ This result, in addition to the high rate of cetane solubilization observed in the same system at 30~ (21), explains the optimum in detergency that occurs near that temperature, because both factors facilitate removal of soil present within the smallest void spaces in the fabric Also, 1"0 1 although not achieved until after 30 min in the ten- siometer, the very low equilibrium IFT values would likely be attained before the end of a wash cycle, because the 09 soil films on the fabric are much thinner than the oil drop used in the IFT experiments.
Similar results are given in Figure 6, where the composi- tion of the surfactant blend was varied while the operating temperature was kept constant at 30 ~ As expected, the lowest IFTs were produced by the system containing about 22% by weight N23-3S. Similar results were found at higher temperatures, except that the lowest IFTs were obtained with systems containing a higher proportion of N23-3S, as predicted by the phase behavior results in Figure 3.
Effects of surfactant and soil composition. The phase behavior analyses can be applied to other surfactant systems. Shown in Figure 7 are phase inversion plots for the C12E3/C12LAS system at 29~ and 50~ Interesting- ly, comparison to Figure 2 shows approximately the same optimized compositions as were found when N23-3S was used as the anionic surfactant. Once again, agreement bet-
80 ween these predicted optimum compositions and optimum / detergency is found in the performance data shown in Figure 8. Also, the sensitivity of detergency to surfactant T0 ratio and temperature is again evident. Unlike N23-3S, C12LAS is quite sensitive to divalent ions such as calcium and magnesium so that quite different results $ so- would be obtained in the presence of water hardness (15). However, the results in Figures 7 and 8 should be relevant so to applications where very low water hardness levels are present or where effective builder systems are used to chelate or precipitate the hardness ions. ~ 4o_
The optimized film compositions obtained from phase inversion plots like those in Figure 2 are shown in Table 2
tO
1
e
0.1
0.01
0.001
0.5% Surfactant 311 Surfactant/Cotane Wt. Ratio
= ~ =. ._~ .,. . . . ,,~71/29
.............. o .....
- "
I I I I I i I I I 0 10 20 30 40 50 60 70 80 90
~me, rain
FIG. 6. Effect of C12E3/N23-3S weight ratio on IFTs a t 30~
100
for blends of C12E3 with the sulfated alcohol sodium dodecyl sulfate {SDS) and three alcohol ethoxysulfates with differing levels of ethylene oxide. Based upon the results found with N23-3S and C12LAS, one would predict optimum removal of cetane from polyester/cotton
0.8
07| s0O c
0.6
0 5 10 15 20 25 Cetane/Surfactant Wt. Ratio
FIG. 7. Phase inversion compositions for C12E3/CI2LAS system.
30 .
62138 C12 E3/C12 LAS
76 /24 C12 E3/C121-AS ~ - ~
/
0.05% Surfactant ~lm 1% NaCI
I I I | 20 30 40 5O
Temperature, ~
\ \
xx,
20 I
10 60 70
FIG. 8. Cetane removal by C12E3/C12LAS blends.
TABLE 2
Effect of Surfactant Structure on Predicted Optimum Detergent Composition; Soil = Cetane; Temperature, 29~
Nonionic Anionic Wt. fraction nonionic
C12E3 SDS 0.84 a C12E 3 N23-3S 0.78 C12E 3 N23-6.5S 0.77 C12E 3 N23-12S 0.75 C12E 2 N23-6.5S 0.58
aReL 16; temperature, 30~
JAOCS, Vol. 68, no. 7 (July 1991)

530
SURFACTANTS & DETERGENTS
TABLE 3
Effect of Soil Composition on Predicted Optimum Detergent Composition; Anionic -- N23-3S; Temperature, 29~
Nonionic Soil Wt. fraction nonionic
C12E3 1:1 Cetane/squalane 0.84 C12E3 Cetane 0.78 C12E3 Decane 0.66 C12E 5 9:1 Cetane/oleic acid 0.71 C~2E5 9:1 Cetane/ohyl alcohol 0.68
to occur with these compositions. A slight t rend toward decreasing nonionic weight fraction is found as the ethylene oxide content of the anionic surfactant compo- nent is increased, although the reverse trend is found when the results are based on mole fraction. Nevertheless, no great differences are observed at these conditions as the anionic surfactant is varied from an alcohol sulfate to a high-EO alcohol ethoxysulfate, indicating tha t the effect of the sulfate portion of the hydrophile is dominant. Also shown in Table 2 is the result for a Cl~E2/N23-6.5S system. Not unexpectedly, more AES is required to balance this system than the C12E3/N23-6.5S system due to the increased hydrophobicity of the C12E 2 as compared to C12E3.
Soils other than cetane can be studied by the above techniques. Table 3 shows the predicted opt imum surfac- tan t compositions for removal of three hydrocarbons as well as two nonpolar/polar soil mixtures. For the C12E3/ N23-3S system, the required weight fraction of anionic surfactant increases as the average molecular weight of the soil decreases because a more hydrophilic surfactant system is required {22}. For example, approximately twice the quant i ty of N23-3S is required for opt imum decane removal at 29~ as compared to tha t required for op- t imum removal of the much higher molecular weight 1:1 cetane/squalane mixture, which simulates the properties of a lubricating oil.
For nonpolar/polar soil blends containing 9:1 by weight cetane/oleyl alcohol and cetane]oleic acid, C~2E 5 was chosen as the nonionic surfactant since previous work had shown tha t its phase inversion temperatures with those soils are well below 20~ (9). Therefore, some anionic sur- factant is required to optimize the system for these sebum- like soils. As found for the nonpolar hydrocarbon soils, linear phase inversion plots were obtained, allowing deter- mination of the compositions yielding low interfacial ten- sions and high levels of soil removal. The results are shown in the last two entries in Table 3 and indicate how a C12Es/N23-3S system could be formulated to perform similarly to the optimum nonionic surfactants for removal of sebum at typical washing conditions, i.a, alcohol ethox- ylates containing an average of six to eight ethylene ox- ide groups {1}. Although not measured, the required amount of N23-3S in combination with C~2E 3 would be much higher for the hydrocarbon/polar soil mixtures than for the nonpolar hydrocarbons shown in Table 3.
Impl ica t ions for deve lopment o f temperature- insensi t ive formula t ions . The experimental techniques described in the preceding sectior/s provide information concerning the mechanisms by which nonionic/anionic surfactant blends
remove oily soils from 65:35 polyester/cotton fabria Of more practical importance is tha t use of the techniques allows optimization of nonionic]anionic surfactant systems for specific soils and washing temperatures.
A major goal of formulators has been to develop temperatureinsensit ive detergents. For nonionic-only for- mulations, which generally are the best for removal of oily soils, quite large changes in performance with temperature are common, part icularly with nonpolar soils like cetane. This tendency should be reduced through incorporation of anionic surfactants which, in contrast to nonionic sur- factants, become more water-soluble with increasing temperature. However, as evidence in Figures 4 and 8, the ability of various nonionic/anionic surfactant blends to remove soils can also be quite dependent on temperature In fact, optimized systems tha t contain a higher propor- tion of anionic surfactant than those determined in this s tudy would likely be required to lessen this dependence to a significant degree.
The experimental techniques described here allow one to evaluate whether a certain surfactant system will pro- vide optimized cleaning efficacy over a wide range of temperature. This behavior would manifest itself as a horizontal line in Figure 3. Such a sys tem has been reported and consists of a cationic surfactant, dodecyl tr imethyl ammonium chloride, and a nonionic surfactant, C8E1, with iso-octane as the oil {17}. Of course, the effec- tiveness of an optimized, temperature-insensitive blend for detergency will be dependent on the IFT values achieved by the blend. In other words, a temperature- insensitive system may not necessarily provide high levels of soil removal. Als~ as i l lustrated in Table 3, a system optimized for one soil will likely not be optimized for any other. Therefor~ the uti l i ty of developing a temperature- insensitive formulation will be greatest for applications where one soil predominates, ag., in industrial laundry or other industrial cleaning processes.
ACKNOWLEDGMENTS The author thanks P. G. Shpakoff for performing the conductivity and IFT studies and D. K. Huelster for performing the detergency studies. Also appreciated are useful suggestions from Professor C. A. Miller and his students in the Chemical Engineering Department at Rice University in Houston, Texas, and the assistance of D. W. Matalamaki in operating the spinning drop tensiometer system.
REFERENCES 1. Kravetz, L., Chemical Times & Trends 8:29 (1985). 2. Brenner, T.E., J. Am. Oil Chem. Soa 64:251 (1987). 3. Kravetz, L., and H.L. Benson, Ibid. 66:1647 (1989}. 4. Raney, K.H., and C.A. Miller, J. Colloid Interface Sci. 117:282
11987). 5. Benson, H.L., Presented at the 77th Annual Meeting of the
American Oil Chemists' Society, Honolulu, May 14-18, 1986. 6. Shinoda, K., and H. Sait~ J. Colloid Interface Sci. 26:70 {1968}. 7. Benton, W.J., K.H. Raney and C.A. Miller, Ibid. 110:363 (1986}. 8. Mori, F., J.C. Lira, O.G. Raney, C.M. Elsik and C.A. Miller, Col-
loids and Surfaces 40.323 {1989}. 9. Raney, K.H., and H.L. Benson, J. Am. Oil Chem. Soc. 67.'722
(1990}. 10. Graciaa, A., J. Lachaise, J.G. Sayous, P. Grenier, S. Yiv, R.S.
Schechter, and W.H. Wade, J. Colloid Interface Scs 9&474 {1983). 11. Graciaa, A., J. Lachaise, M. Bourrel, I. Osborne-Lee, R.~
Schechter and W.H. Wade, SPE Reservoir Engineering, August, 305 {1987).
JAOCS, Vol. 68, no. 7 (July 1991)
SURFACTANTS & DETERGENTS
531
12. Ktmieda, H., and N. Ishikawa, J. Colloid Interface Sci. 107:122 (1985).
13. Raney, K.H., and C.A. Miller, Ibid~ 112539 {1987). 14. Bercovici, R., and H. Krussmann, Tenside Surfactants Deter.
25:430 {1988). 15. Kok, R., Presented at the 80th Annual Meeting of the American
Oil Chemists' Society, Cincinnati, May 3-7, 1989. 16. Kunieda, H., and K. Igarashi, Yukagaku 31:949 (1982}. 17. Kuniedeq H., K. Hann~ S. Yamaguchi and K. Shinoda, J. Col-
loid Interface Sci. 107:129 (1985}. 18. Aveyard, R., B.P. Binks, T.A. Lawless and J. Mead, J. Chem. Soa,
Faraday Trans. 1 81:2155 11985). 19. Cayias, J.L., R.S. Schechter and W.H. Wade, Adsorption at In-
terfaces, ACS Symposium Series 8, 1975. 20. Gordon, B.E., and w:r. Shebs, J. Am. Oil Chem. Soc 46.'537 (1969}. 21. Mori, F., J.C. Lim and C.A. Miller, Progr. Colloid Polym. Sci.
82:114 (1990). 22. Kunieda, H., and K. Shinoda, J. Colloid Interface Sci. 107".107
(1985~.
[Received July 8, 1990; accepted May 22, 1991]
JAOCS, Vol. 68, no. 7 (July 1991)