optimal management of soil quality stocks and long-term consequences of land degradation for...
TRANSCRIPT

Environ Resource Econ (2012) 52:415–433DOI 10.1007/s10640-011-9536-0
Optimal Management of Soil Quality Stocksand Long-Term Consequences of Land Degradationfor Smallholder Farmers in Malawi
Teddie O. Nakhumwa · Rashid M. Hassan
Accepted: 11 December 2011 / Published online: 11 January 2012© Springer Science+Business Media B.V. 2012
Abstract While soil degradation has long-term consequences, static models which formthe bulk of studies on this topic in Africa, do not account for the inter-temporal dimensionsof optimal resource management. This paper used an inter-temporal optimisation frame-work, which considered soil in a time-dependent resource extraction perspective. We havedemonstrated that soil degradation is causing an enormous reduction in productive value ofsmallholder land in Malawi. Current user cost of soil quality among smallholder farmers,which represents annual loss in productive value of land, was estimated to be US$21 per hect-are. Based on this value and land area under smallholder agriculture in Malawi, economiccosts of soil degradation among smallholder farmers were estimated to amount to 14% ofthe agricultural GDP for Malawi. Although smallholder farmers’ current practices are sub-optimal to Steady State solutions, they are above static solutions. This demonstrates thatsmallholder farmers have some private incentives to invest in the soil quality stock. Small-holder farmers internalise some of the dynamic costs of soil degradation under the currentpractices. However, a sensitivity analysis on a slightly higher discount rate indicates that SSsolutions closely resemble the prevailing smallholder farming practices. This suggests thatsmallholder farmers may be overexploiting soil quality stock because they have a high timepreference. That is, they value the current consumption more than their future consumptionand wellbeing. High levels of poverty in Malawi and serious lack of viable alternatives tosubsistence farming may be influencing such behaviour. Promoting more viable land usealternatives than subsistence farming and formuling policies that help transform smallholderagriculture into a profitable enterprise will not only increase the cost of degrading the soil,but also encourage farmers to invest in the soil quality stock.
T. O. Nakhumwa (B)UK Aid, Department for International Development Aid (DFID-Malawi), C/O British High Commission,Off Convention Drive, Box 30042, Lilongwe 3, Malawie-mail: [email protected]
R. M. HassanDepartment of Agricultural Economics, University of Pretoria, Pretoria 0002, Republic of South Africa
123

416 T. O. Nakhumwa, R. M. Hassan
Keywords Dynamic optimisation · User costs · Smallholder agriculture ·Soil quality stock · Steady state
1 Introduction
Declining soil fertility is identified as one of the major causes of declining per capita foodproduction in Africa (Henao and Baanante 2006; Sinebo and Yirga 2002). Soil erosion andsoil nutrient mining through continuous cultivation of crops coupled with low applicationof external sources of nutrients is singled out as the major cause of nutrient depletion in theregion (Henao and Baanante 2006). Malawi has been categorized as one of those countrieswith the highest level of soil erosion in sub-Saharan Africa (Henao and Baanante 2006;Bojo 1996). Also, there is low use and adoption of soil conservation technologies amongsmallholder farmers in Malawi (Nakhumwa and Hassan 2003; Mangisoni 1999). Since 2005the Government of Malawi has embarked on the farm input subsidy programme, providing1.6 million poor smallholder households with affordable fertilisers and high quality seeds(Dorward et al. 2008). This programme aims at gradually reversing the soil nutrient depletion,which is estimated at 72 kg /ha/year (Henao and Baanante 2006), and thereby improving soilproductivity. Better understanding of the economics of nutrient mining and of the factors thatexplain why farmers deplete the soil is necessary for design of effective policy and investmentstrategies to reverse the current trends (Henao and Baanante 2006).
Earlier work on economic analysis of soil erosion mainly concentrated on conservationand adoption. Since the 1970s, more formal modelling gained importance and appeal toanalysing the economic costs of soil erosion (Brekke et al. 1999; Pagiola 1993; McConnell1983). Static models for valuing impacts of soil degradation include direct valuation methodssuch as the replacement costs method (RCM) and productivity loss method, and static opti-misation models such as linear programming (LP). The RCM has been widely used due toits ease (Norse and Saigal 1992; Solorzano et al. 1991; Stocking 1986). This approach doesnot take into account the thresh-hold beyond which the effects of erosion are irreversible andcannot be rectified. Soil erosion affects several yield determining parameters, such as soildepth and nutrient availability. When soil erosion has destroyed the soil physical structureslike rooting depth, nutrient replenishment approach may under-state the true value of theeffects of soil erosion (Hailu and Runge-Metzger 1992).
Productivity loss approaches have been widely used to measure economic losses due toerosion. Most common among those are the empirical predictive models that attempt to relatemeasured soil properties to crop yield. The Universal Soil Loss Equation (USLE) and the SoilLoss Equation for Southern Africa (SLEMSA) are examples of regression type parametricmodels that have been used widely to predict long-term erosion impacts on soil productivity(Brekke et al. 1999; Bishop 1992; Stocking 1986). Although USLE is one of the most exten-sively used erosion predictive models in the USA and other parts of the world (Aune andLal 1995; Grohs 1994; Bishop 1992), it does not explicitly represent fundamental hydrologicand erosion processes, among other limitations (Aune and Lal 1995).
Another method, the hedonic pricing, is the indirect approach to valuing soil degradation.It compares the sale of or rental price of plots that differ only in the extent of physical degra-dation. In principle, the difference in productive capacity will be reflected in prices, which inturn reflect the present value of net returns over time. Hedonic pricing has been used to valueeffects of soil degradation on agricultural land in North America with mixed results (Bishop1995; Hertzler et al. 1985). Hedonic pricing is generally not applicable where land markets
123

Optimal Management of Soil Quality Stocks 417
are poorly developed such as in SSA, or when land markets are distorted by speculation orpublic policy (Bishop 1995).
Static optimisation models such as linear programming (LP) have also been used in landdegradation studies (Barbier 1998). Although Shiferaw and Holden (1999) work was able toexamine long-term effects on resource use and conservation behaviour of smallholder farm-ers, their analysis does not give guidance on the optimal control path for the extraction ofthe soil stock. Soil degradation has long-term consequences and static models, which formthe bulk of studies on this topic in Africa, do not account for the inter-temporal dimensionsof optimal resource management. Yet policy makers need to understand the long-term con-sequences of soil degradation on agricultural productivity, if they are to treat this problemwith the attention it deserves. This dilemma is the motivation for this study.
Overcoming the inherent weakness of the static models, dynamic optimisation modelsconsider soil in a time-dependent resource extraction perspective. Current output levels inthe inter-temporal framework (dynamic optimisation) do not only affect current returns,but also future output and future net returns. Current extraction level will influence futureextraction levels and net benefits (Chiang 1992). Therefore, the problem faced by the deci-sion maker in dynamic optimisation is to extract given levels of resource at each period oftime that will maximize the total net returns over time. Following Chiang, the solution of adynamic optimisation problem would thus take the form of an optimal time path for everychoice variable. One of the early influential models in dynamic optimisation for economiccosts of soil erosion was the one developed by Burt (1981). However, this model was basedon dynamic programming models, which though mathematically complex do not often yieldanalytical solutions (Chiang 1992).
Despite its robustness, only a limited number of studies have applied the optimal controlmethod to tackle the question of optimal resource management (Oueslati 2005; Hediger 2003;Shively 2003; Brekke et al. 1999). These studies have applied this method to model the effectof soil erosion on soil productivity based on rooting depth, which is an important physicalfactor in soil productivity because it determines soil reserves of water and nutrients (Auneand Lal 1995). However, Barbier (1986) argues that soil degradation can be categorised eitheras a slowly renewable resource or as an exhaustible resource problem. Severe soil erosioncan cause a permanent destruction to the soil physical structure resulting into an exhaustibleresource problem. Rooting depth is one of the soil physical structures most affected by soilerosion. Accordingly, rooting depth is modelled as an exhaustible soil resource problem.
The central characteristic of renewable resources is that they are capable of natural regen-eration within a time span relevant to man (Jayasuriya 2003). Ciciacy-Wantrup in definedtopsoil as a renewable resource with a threshold level below which resource use renders it non-renewable. Also, Barbier (1986) argued that soil nutrients stock can be slowly rebuilt usingthe external sources such as inorganic and organic fertilisers. As such, depletion of soil nutri-ent is regarded as a slowly renewable soil resource problem. But rarely do researchers modelsoil nutrient stock as a renewable resource problem. This paper uniquely applies the dynamicoptimisation method, based on the maximum principle, to calculate the economic costs ofdepleting the soil quality stock among smallholder farmers in Malawi in order to evaluatetrade-offs between the short-term production gains achieved at the expense of the long-termproductive value of soil quality. In treating soil quality management as a renewable resourceproblem, we will attempt to determine the sustainable extraction path (steady state) and assessthe extent to which the current farmers’ practices follow or deviate from the social optimum.
The following Sect. 2 presents the inter-temporal optimisation framework. Section 3applies a socially optimal management of soil quality stock for smallholder farmers in Malawiand Sect. 4 is data collection and sources, and Sect. 5 performs parameter and empirical
123

418 T. O. Nakhumwa, R. M. Hassan
estimation of the specified model. Section 6 presents discussion of results and Sect. 7 is theconclusion.
2 Methodology
2.1 Modelling the Dynamics of Optimal Soil Fertility Management for SmallholderFarmers in Malawi
In Malawi, about 84% of smallholder agricultural land is exclusively under customary tenuresystem where land belongs to the government and traditional chiefs are the appointed custodi-ans (Government of Malawi 2002, in Lunduka 2009; Mkandawire et al. 1990). Customary ten-ure system is complex, diverse and elusive, creating different constraints for agriculture pro-duction through insecurity of tenure (Place and Otsuka 2001). Secure land tenure has been ar-gued to increase investment incentives in agriculture (Braselle et al. 2002 in Lunduka 2009). Inprinciple, smallholder farmers do not have formal private property rights under the customarytenure system but rather only have use rights. One incentive for investment is when a farmerfeels more secure in maintaining the long term use of land (Braselle et al. 2002). Various au-thors have argued that traditional communities develop communal management systems thatcontrol access to and use of resources that induce a socially efficient exploitation (Dasguptaand Maler 1990; Larson and Bromley 1990). In other words, traditional systems would some-how internalise the potential externalities arising from lack of individual resource ownership.
This paper uses an optimal control framework to maximise the sum of discounted netbenefits from use of soil nutrients in the production of agricultural output Q. Accordingly,the dynamic optimisation decision problem of the landowner is specified as:
Max(Qt )
(∏t
)=
∞∫
0
e−δt (PtQt − Ct(Qt ))dt (1)
where∏
t is profit at time t, Qt is output level, P is per unit output price, Ct is the cost ofproducing Q. The output and input prices faced by individual decision makers are assumedto be exogenously determined,1 and δ is the social discount rate.
We focus on the severity of nutrient depletion in Malawian smallholder agriculture mainlyas a result of imbalanced nutrient replenishment through external sources, nutrient extractionby crop harvest and nutrient loss due to soil erosion process. Low input application by small-holder farmers in Malawi entails that more soil nutrients are being lost than are replenishedthrough external sources such as organic and inorganic fertilisers. Land productivity in thesoil-nutrient depletion (soil-mining) model is assumed to be exclusively a function of soilnutrient stock S.2
The process of generating agricultural output is modelled in this paper based on the produc-tion decision environment predominating smallholder semi-subsistence farming in Malawiwhere labour and soil nutrients are the main inputs in agricultural production with limitedcapital inputs.
1 If one considers a central agency acting on behalf of all individual farmers to find a social optimum, thenprices may become endogenous to the decision making problem as the case of monopolistic decision (Dasguptaand Maler 1990).2 This formulation assumes that the effect of soil physical properties (destruction of soil structure, i.e. root-ing depth) is less of a threat to productivity compared to the effect of nutrient depletion, which is the mainconstraint on land productivity in sub-Saharan Africa (Stoorvogel and Smaling 1990; Brekke et al. 1999).
123

Optimal Management of Soil Quality Stocks 419
Qt = f (St , LQt) (2)
where agricultural output Qt depends on the stock of soil nutrients St and labour employedin production LQt . The production process described in equation 2 differs from the wayagricultural production technology is typically specified in that the stock of soil nutrients St
and not the level of fertiliser application influences production. This is based on the fact thatactual uptake of nutrients by the growing plant, which depends on available nutrient stock,is the factor determining agricultural production. However, fertiliser application influencesoutput indirectly through its augmenting effect on the stock of soil nutrients as described inthe equation of motion given below.
•S = H(Qt , LSt ,KSt ) − D(Qt) + G(Ft ) (3)
According to equation 3, the stock of soil nutrients is reduced through growth and harvestingof agricultural output according to the depletion (or damage) function D(Qt). Soil nutrientsare replenished by addition of inorganic and organic fertilisers Ft , where the function G
converts externally applied fertiliser inputs into soil nutrients.The stock of soil nutrients is also augmented and depleted through a natural regeneration
and decay process described by the aggregate function H, which can be thought of as acombination of the following processes:
H(Qt , LSt ,KSt ) = h − M(Qt, LSt ,KSt ) (4)
where h is a constant measuring the natural inflow of nutrients from other sites that is indepen-dent of stock levels in the importing plot site but determined by natural factors transportingsoil from one site to another, i.e., all erosion forces. However, practically measuring re-depo-sition of nutrients eroded from other sites is difficult as models widely used to measure soilerosion, such as SLEMSA, do not have this capacity. All plots also lose soil through theprocess of erosion, which is modelled as function M (the decay function of H ) in equa-tion 4. The decay process depends on the level of output Q (canopy) and conservation effortsthrough the use of labour LSt and capital KSt resources and other management practices.Accordingly, the sign of H could be negative or positive depending on the net effect of naturalaugmentation and decay processes at any given period t .3 Farmers also use land to managefertility and conserve soil resources when land is not limiting. This is the typical situationwhere farmers practice shifting cultivation or fallow rotations. However, this is not the casefor smallholder farmers in Malawi as land is limiting and no such opportunity is available toexploit at the extensive margin.
The production function Qt = f (St , LQt) given in equation 2 is assumed to satisfy allregularity conditions and properties of admissible technology structure (continuous, twicedifferentiable and strictly concave (Chambers 1991). Properties of the other functions H, D
and G given in equation 3 are specified in the empirical sections of the paper.From the above it follows that the objective of the decision maker (the farmer) is to max-
imise the discounted sum of the stream of net benefits from the use of soil quality stockto produce agricultural output Q. Incorporating the structure of the production technology(equation 2) subject to the equation of motion of the state variable (soil quality stock), spec-ified in equation 3 the optimal control problem over an infinite time horizon is given by:
3 Note that while LS and KS reduce decay(
∂M∂LS
& ∂M∂KS
≤ 0)
higher stock levels may contribute to increased
decay or erosion implying(
∂M∂S
≥ 0)
and hence(
∂H∂S
≤ 0)
, if one wishes to model M as a function of stock
S, an effect this study did not consider. On the other hand, more dense canopy (Q) reduces decay (less erosion),i.e. ∂M
∂Q≤ 0 and hence ∂H
∂Q≥ 0
123

420 T. O. Nakhumwa, R. M. Hassan
Max∏
t(KSt ,LQt ,LSt ,Ft )
=∞∫
0
e−δt [Ptf (St , LQt) − wF Ft − wKKSt − wL(LQt + LSt )] dt (5)
Subject to:
•St = H(Qt , LSt ,KSt ) − D(Qt) + G(Ft )
S0 is given
∂f
∂S&
∂f
∂LQ≥ 0,
∂H
∂LS&
∂H
∂KS≥ 0; ∂D
∂Q≥ 0; ∂G
∂F≥ 0
�t is discounted stream of net benefits over time, which in general is considered to be thecorrect measure of value of the land in production. P,wF , wK , and wL are output, fertiliser,capital, and labour input prices, respectively.4 The Hamiltonian function N associated withthe above dynamic choice problem is formulated as:
N(F,LQ,LS,KS, λ) = e−δt [Pf (St , LQt) − wF Ft − wKKSt − wL(LQt + LSt )]
+λt [H (Qt , LSt ,KSt ) − D(Q) + G(Ft )] (6)
3 Socially Optimal Use (Steady State) of Soil Nutrient Stock
A socially optimal program for management of soil nutrient stock can be obtained from adesirable steady state (SS) solution of the above optimal control model. The SS solution to theCurrent Value Hamiltonian formulation of equation 6 requires satisfaction of the followingfundamental equations of renewable resources optimality condition:
PfSGF
wF
= δ + (DS − HS) (7)
PfSHLS
wL
= δ + (DS − HS) (8)
PfSHKS
wK
= δ + (DS − HS) (9)
PfS
(DLQ − HLQ
)
NPLQ
= δ + (DS − HS) (10)
SS optimality conditions provided in equations 7–10 have interesting economic interpre-tations. The terms on LHS of the system 7–10 measure the ratio of the marginal benefits(value of marginal product of inputs) and costs (wi) of using fertiliser, labour and capitalin production of Q and soil conservation (HKS&HLS). Value of marginal product of inputsis the product of the value of marginal product of soil nutrient stock PfS and the marginalcontribution of inputs to soil quality (GF &Hi). Use of an extra unit of fertiliser contributes tosoil quality via the soil nutrient augmenting function G, whereas use of extra units of capitaland labour5 contributes to soil quality through gains from soil conservation efforts that slowdown the decay process (Hi). The first term on RHS is the social discount rate. The second
4 Note that the time subscript t has been dropped from input prices for simplicity of presentation.5 This argument holds only for small-scale labour intensive physical soil conservation techniques such asmarker ridges and contour bands. It is not true for other more recent and less labour intensive practices suchas conservation agriculture (zero till) being currently promoted among smallholder.
123

Optimal Management of Soil Quality Stocks 421
term on RHS is the net marginal growth rate of soil nutrient stock S and comprises marginalrate of natural stock regeneration HS and soil nutrient stock degradation through the damagefunction DS . The optimality conditions presented in equations 7–10 indicate that the valueof the marginal products of inputs (marginal benefits from using one unit of input i) relativeto their respective prices must equal the rate of social discount plus the net marginal growthrate of the soil nutrient stock (stock externality effects).
However, the value of marginal product (LHS) in equation 10 is slightly different. Itcomprises the marginal value product of soil nutrient stock PfS and the marginal dynamiccost and benefit of using an extra unit of labour in the production of Q. As mentioned earlier,use of extra unit of labour in production of Q has future costs since higher Q extracts andreduces soil nutrients through damage function D. At the same time higher Q slows downthe decay process (erosion) through H and therefore leads to social benefit. The term onLHS is therefore, a ratio of the value of net marginal contribution of production labour LQ
to soil quality through Q relative to the marginal returns to labour.6
Since production costs C(Q) included in the∏
function 4 are entirely private, farmersare likely to fully consider these costs in their production decision. On the other hand, whenprivate and social objectives diverge in absence of private property, farmers are not expectedto take into account the full extent of dynamic costs (externality effects) of degrading soilquality λ(·), unless they are forced by regulation or taxation. In this case the decision problemreduces to the static optimisation problem. This can be seen from setting λ = 0 in objec-tive function equation N and the normal static optimisation solutions obtain where marginalvalue product (private benefits) are simply equated to input prices [Pfi = V MPi = wi].This study will compare current practices with static and dynamic optimisation solutionsto evaluate whether or not smallholder farmers take into account the dynamic costs in theirdecisions and determine by how much current practices deviate from the social optimum.
4 Data Collection and Sources
The data used for analysis in this study were based on farm-household survey administeredto 263 smallholder farmers in Nkhatabay and Mangochi districts. These two districts werepurposefully picked due to availability of reliable data on soil erosion. Proportional samplingwas done and Mangochi contributed 55% of the sample size while Nkhatabay district con-tributed the remainder. Due to the problem of incomplete data for some questionnaires, only260 households were used in the analysis. The household survey was used to collect dataon maize production and soil conservation practices. Data collected included yield levels,total land size, fertiliser use, labour and capital use for production and soil conservation. Thisfarm household survey data was also used to estimate a Cobb-Douglas production functionfor smallholder maize farmers.
A soil survey (soil profile) was done to analyse physical characteristics of soil based on30 cm of the top soils in Mangochi and Nkhatabay districts. Core sample was also done todetermine the bulk density. A chemical analysis was conducted to determine the chemicalcharacteristics of the major soils in these districts. Soil survey was complemented by sec-ondary data from the department of land resources. Soil characteristics information includedphysical (soil particle size, soil depth, bulk density) and chemical properties. The soils were
6 Note that in the absence of soil stock externalities (HS = DS = 0) or if the marginal rate of natural soilnutrient regeneration is equal to marginal rate of soil nutrient degradation (HS = DS), then the ratio of mar-ginal benefits and costs of using labour, fertiliser and capital in production of Q and soil conservation on LHS
will be equated to the social discount rate on RHS at the SS (equations 7–10).
123

422 T. O. Nakhumwa, R. M. Hassan
also categorised according to agro-ecological zones. Using the Geographical InformationSystem (GIS), soil erosion national average figures were computed. As observed by Tchale(2005), it is important to note that use of national average figures usually masks farm levelvariations.
Secondary data from other sources was also used for the specification of other param-eters when local data was not reliable or unavailable. However, this was done only wherethere was supporting evidence to justify such use. Particularly for this study, soil slope andrainfall intensity parameters on SLEMSA model, but calibrated based on Zimbabwe data,were adapted for this study due to local data limitations. Similar approaches have been donein other published work by Aune and Lal (1995) on Zambia and Brekke et al. (1999) onTanzania and Stocking (1986) on Zimbabwe. These authors have argued that countries inSouthern Africa share common soils and climatic conditions (including rainfall).
5 Parameter Estimation and Empirical Specification of the Optimal Control Model
The analytical optimal control model developed in the Sect. 2 is empirically specified andsolved in this Section. The key components of the analytical model that need to be empiricallyspecified are the production function in equation 2, the aggregate function H that describesthe natural regeneration and decay process in equation 4, the depletion (or damage) functionD(Q) and the function G(F) externally supplying nitrogen that augments soil nitrogen inequation 3.
A Cobb Douglas (CD) form was specified for the agricultural production function inequation 2 (Q = A ∗ LQαLSαS ).7 The aggregate function H in equation 4 has two maincomponents and these are the natural regeneration h and the decay process M(Q,LS,KS).The natural regeneration h measures the natural inflow of nutrients from external sources(other sites) and is empirically specified as a constant in this study. However, the decayfunction M (Q,LS,KS) is a function of agricultural output Q (canopy) and farmers’ soilmanagement efforts in soil conservation practices through use of labour LS and capital KS.Q and soil conservation efforts reduce the rate of the decay process (erosion) and thereforeincrease H .
Following Brekke et al. (1999), rate of soil erosion and Q are linked through the followingequation:
Et = φe−bQ (11)
As Et measures tonnage of soil lost through erosion, one needs a conversion factor β to con-vert soil loss into equivalent soil nitrogen lost. Hence soil nitrogen lost through soil erosionis measured as βE(Q) = βφe−bQ. β is a constant measuring soil nitrogen in kilograms perunit soil depth (cm), while φ and b are parameters (constants) for slope and rainfall intensity,respectively.
Contribution of soil conservation to the decay process is specified in this study as CobbDouglas function (c = LSβ1KSβ2). Accordingly, the decay function M is specified as anadditive function below:
M =(βφe−bQ − LSβ1KSβ2
)= (βE(Q) − C) (12)
Note that use of labour and capital for soil conservation reduce decay and hence the negativesign on the additive term. The aggregate natural regeneration and decay process function H
is therefore empirically specified as below:
7 LQ and S are labour and soil nitrogen used in production, respectively. A is technology parameter.
123

Optimal Management of Soil Quality Stocks 423
Table 1 Parameter estimation of the CD function for smallholder maize in Malawi (2001/2002)
Variable name Coefficient values t ratios p value
Constant α0 1.5 (0.98) 1.5 0.12
ln L αL 0.53 (0.16) 3.34*** 0.001
ln F αF 0.18 (0.07) 2.55** 0.01
Adj R2 0.2
F statistic 2.01 0.08
Figures in parentheses are standard errors; *** statistical significance at 1% level and ** at 5%
H = h − M = h −(βφe−bQ − LSβ1KSβ2
)(13)
The depletion (or damage) function D(Q) in equation 3 measures nitrogen extraction as aresult of harvesting agricultural output Q is empirically specified as a linear function of Q:
D(Q) = nQ (14)
where n is a constant measuring the amount of soil nitrogen removed per ton of maizeharvested.
It has been assumed in this study that fertiliser only influences output Q indirectly byaugmenting soil nutrient stock via G(F) in the equation of motion (equation 3). The nitrogenaugmenting function G(F) is specified as a linear function of fertiliser F as below:
G(F) = gF (15)
where g is a conversion factor, which can take the value of one implying that one unit offertiliser add one unit of nutrient stock S(i.e., F is a perfect substitute of S). The assumptionof perfect substitution between F and S is adapted from Brekke et al. (1999).
Production parameters for smallholder maize producers were computed through a CobbDouglas (CD) production function. CD function was estimated using smallholder maize pro-duction farm survey data for 2003 agricultural season. The White’s estimator (Greene 1997,2000) was used to correct for possible heteroscedasticity in estimation of the CD productionfunction parameters.
As shown in Table 1, parameters (elasticities) for labour and fertiliser inputs have the rightsigns and are both statistically significant at 5%. Since the analysis is based on cross sectiondata, the low R2 is acceptable (Pindyck and Rubinfeld 1998; Mitchell and Carson 1993). Itis worth noting that soil nitrogen is a highly labile property and no single soil analysis isadequate to predict its supply to crop over the growing season (Aune and Lal 1995). As such,although output Q has been formulated in this study to be a function of soil nutrient stockS, the estimated nitrogen coefficient (elasticity) is based on crop response to N - fertiliserapplication. In a similar approach, Brekke et al. (1999) in measuring soil wealth for Tanza-nia, adapted nitrogen coefficient (αN = 0.3) computed by Aune and Lal (1995) based on a17-year soil experimental data of crop response to N -fertiliser from Kasama in Zambia.Malawi and Zambia share similar soil characteristics and climatic conditions. As such, adapt-ing crop response to nitrogen parameter by Aune and Lal (1995) strengthen the analysis inabsence of any reliable local long-term data.
The lower fertiliser coefficient for smallholder farmers in Malawi (Table 1), as opposedto that computed by Aune and Lal (1995) could mean that soils in Malawi are more degradedand therefore obscures true potential gains from the use of fertiliser. This finding is similar
123

424 T. O. Nakhumwa, R. M. Hassan
to Hardy (1998). Sensitivity analysis was conducted on parameter for crop response to nitro-gen. Amount of capital use in maize production is quite insignificant among the smallholderfarmers in Malawi. As such, we did not include capital in the estimation of the productionfunction. We could not also reliably estimate the amount of seeds used by smallholder farm-ers per unit area planted. Majority of smallholder farmers combine subsidised hybrid seeds(usually not enough for their plots) and recycle seeds. However, rarely do farmers quantifythe amount of recycled seed used. Though another important determinant of productivity,seed rate/and or type of seed was not used in the regression analysis.
In the model linking erosion and Q (equation 11), parameters ϕ and b depend on theslope and rainfall intensity. Stocking (1986) specified these parameters for Zimbabwe andare also applicable for most countries in Southern Africa including Malawi. Rate of soilerosion was estimated in tons per hectare using the Soil Loss Estimation Model for SouthernAfrica (SLEMSA). A geographic information system (GIS) approach was used to estimatesoil erosion rates. National average erosion rate of 20 tons/ha was estimated under the currentproduction practices in Malawi. However, weakness of using national average data is that itusually masks farm level variations (Tchale 2005). Loss of 100 tons of topsoil is equivalent toone centimetre of soil depth lost (Shiferaw and Holden 1999; Brekke et al. 1999). Therefore,20 tons/ha are equivalent to 0.2 cm of soil depth lost.
The level of nitrogen per unit soil depth “β”, was estimated through a soil survey carried outas part of the study in Machinga and Nkhatabay districts in 2003/2004. This study focussedon the effects of nitrogen levels on soil productivity since it is the most important soil elementfor maize production in Malawi (International Fertiliser Development Center (IFDC) 1999;Stoorvogel and Smaling 1990; Aune and Lal 1995). A soil chemical analysis was conductedat Bunda College of Agriculture to determine levels of some key elements of these soils. Thechemical analysis revealed that on average, most soils in Malawi contain nitrogen levels ofabout 70 kg per cm soil. The top 20 cm of soil is considered crucial for maize production(Aune and Lal 1995). If based on the 20 cm soil depth required for maize, estimated 70 kg/cmtranslates to 1,400 kg N as the initial soil nutrient stock (S0). However, it should be notedthat this value is based on already degraded soils and may therefore underestimate the truelevel of initial soil nutrient stock (soil quality stock).
To calculate total amount of nitrogen lost through soil erosion, the nitrogen estimate perunit soil depth β is multiplied by the estimated rate of soil erosion taking place i.e., actualsoil depth lost through soil erosion associated with level of output Q. Parameter ‘n’ in thedamage function nQ (equation 14) measures amount of nitrogen removed through crop har-vesting (kilograms of nitrogen per ton of maize harvested). The study adapted “n” valuesestimated for Malawi (International Fertiliser Development Center (IFDC) 1999). This is themost recent data we found available for Malawi. A total of 28 kg nitrogen is extracted perton of maize harvested and is distributed in the crop as follows; 16.1 kg/ton in the productand 11.9 kg/ton in residues (International Fertiliser Development Center (IFDC) 1999).
Contribution of soil conservation to the decay process has been specified as a Cobb Doug-las function estimated based on data collected from farmers’ surveys on levels of labour andcapital used on farm to conserve soil.8 Labour use was captured as person days by house-hold on conservation activities while capital was captured as investments in conservationstructures, in our case marker ridges. As shown in Table 2 below, labour and capital inputcoefficients for soil conservation have expected signs and are both statistically significant at5%. The negative sign indicates that soil conservation and soil erosion are negatively related.
8 Ridge construction is the most common practice of field preparation among smallholder farmers in Malawi.Crop residues are usually buried except in the central region of the country, where they are burned.
123

Optimal Management of Soil Quality Stocks 425
Table 2 Parameter estimates of the CD function of soil conservation
Variable name Coefficient values t ratio p value
ln LS β1 −0.17 (0.2) 7.48 0.000***
ln KS β2 −0.10 (0.03) 2.49 0.014**
Adj. R2 0.12
Figures in parentheses are standard errors; *** statistical significance at 1% level and ** at 5%
Erosion for individual farm plots was estimated using the link between soil erosion and yieldas formulated in equation 12 (decay function).
The nitrogen augmenting function G(F) (equation 15) was specified as a linear func-tion of fertiliser [G(F) = gF ] where g is a conversion factor. It is acknowledged that theassumption on perfect substitution between synthetic and natural nitrogen has limitations.While use of a range of values could strengthen this argument, guessing the values withoutbeing guided by proper theory behind it would not help either. We leave this as potential areato further improve this argument and strengthen the analysis.
Measuring h in equation 13 is not easy given the limitations of most soil erosion esti-mation models including SLEMSA,9 which has been used in this study. Instead, and fol-lowing McConnell (1983), a soil’s growth function was introduced and assumed to be aconstant. McConnell (1983)10 indicated that rate of natural regeneration contributes 2–5 tonsof soil per acre per year depending on soil type and weather conditions. Therefore, on perhectare basis, the natural regeneration contributes between 5 and 12.34 tons per hectareper year.
From above, the amount of nitrogen found per unit soil depth β, is estimated to be 70 kg/cmand the natural regeneration process (h) contributes between 5 and 12.34 tons of soil per hect-are per year. Based on the above conversion rate, natural regeneration adds between 0.05 and0.12 cm of soil depth per year. Multiplying the soil depth added per year by the amount ofnitrogen found per unit depth of soil, natural regeneration therefore contributes between 3.5to 8 kg N to the soil nutrient stock per hectare/year. In absence of any external supply sourcefor soil nutrient N to augment the natural regeneration process, extraction of N that exceeds8 kg/ha would be regarded to be above the natural regeneration rate and therefore above thethreshold. Such extraction levels would be reducing the soil quality stock. Estimates of modelparameters discussed above are presented in Table 3.
The estimated model was used to solve for SS optimal levels of the control variables ofthe smallholder maize farmer decision problem LQ,F, LS, KS and consequently, the SSoptimal stock of soil nutrient S and dynamic price (user cost of soil quality) λ (see Appen-dix 1). Levels of decision variables were also derived under static optimisation formulatione.g., assuming that farmers do not consider the dynamic costs of soil degradation. Dynamicoptima at SS were then compared to the static solutions and actual farmers’ practices toevaluate the optimality of farmers’ decisions with respect to sustainable use of their soilresources.
9 One major limitation of most of the soil erosion estimation models such as SLEMSA is their inability tocalculate re-deposition (Lal 1990).10 The pioneering work by McConnell (1983) in dynamic optimisation is arguably the most influential inthe theoretical literature and relevant as it is among the few with application to a developing country context(Eaton 1996).
123

426 T. O. Nakhumwa, R. M. Hassan
Table 3 Other model parameter estimates
Parameter Estimated value
n (constant for nitrogen extraction through maize harvest) 28 kgN/ton
β(constant for nitrogen level per cm soil depth level) 70 kgN/cm soil depth
h (constant for natural regeneration contribution to S stock) 8 kgN/ha
SLEMSA parameter for slope φ 1
parameter for rainfall intensity b −1.204
So (Initial soil nitrogen stock) 1,400 kgN/ 20 cm soil depth
6 Results and Discussion
The dynamic optimal model for soil quality stock management by smallholder maize farmersin Malawi produced some interesting results. Smallholder fertiliser application rate for maizeproduction and labour and capital for soil conservation at period of the study were belowthe steady state (SS) optimum implying that the smallholder practices were sub-optimal(Table 4). The smallholder fertiliser application rate was one-third of the required amountat SS, while capital use was about one-quarter of the requirement at SS. If based on theestimated extraction rate of 28 kg N per ton of harvested maize and the actual smallholdernational maize average yield of 750 kg/ha at the period of the study, the nitrogen lost throughcrop harvest alone, (nQ), would be 21 kg N. As such, the smallholder national average fertil-iser application rate of 15 kg N /ha before the fertiliser subsidy programme in 2005 was farbelow the minimum requirement to offset nitrogen lost through crop harvest alone. This gapwould widen further if soil nitrogen lost through loss of top soil due to soil erosion and leach-ing were factored in. Investing in soil fertility enhancing technologies such as promoting theuse of inorganic and organic fertilisers among the smallholder farmers is crucial to graduallyreverse the soil mining problem. However, such interventions need to be complemented byserious investments in the promotion of small-scale soil conservation technologies to ensurethat the rich top soils are protected.
Increasing smallholder maize yields to SS level of 1.5 ton /ha from the national average of0.75 ton /ha would reduce rate of soil erosion to 0.15 cm from estimated national average fig-ure of 0.2 cm soil depth (equivalent of 20 tons/ha). This means that although increasing maizeyields has counteracting effects of increasing soil extraction through crop harvest and slowing
Table 4 Comparative empirical analysesresults
Variable Stead state (SS) Current practice Static optimisation
Production labour (LQ) (labour-day/ha) 128 90 71
Nitrogen stock (S) ton/ha 1.6 1.4
Fertiliser (F) kg/ha 49 15 14
Output level (Q) ton/ha 1.5 0.75 0.5
Change in Soil stock (S) 0 −20
Conservation labour (LS) labour-day/ha 33 27
Conservation capital (KS) US$/ha 18 4 0.2
Erosion level cm-soil depth/ha 0.15 0.2 0.2Total user cost of soil quality US$/ha 21 0
123

Optimal Management of Soil Quality Stocks 427
down the rate of soil erosion through dense canopy, the balance tilt in favour of building soilquality stock i.e., there is a positive net flow of nutrients in favour of building soil nutrients.In other words, agricultural policies that promote smallholder agricultural productivity havethe potential to also build the soil quality stock. However, this relies heavily on promotingsustainable agricultural productivity i.e., agricultural productivity that also puts the right priceon soil quality stock and therefore make degradation of the soil quality quite expensive.
Comparison between the current smallholder practices and static optimisation solutionspresented some interesting results. Static solutions for the control variables, output andproduction labour, were below the prevailing smallholder practices (Table 4). This suggeststhat although the prevailing smallholder practices are at sub-social optimal level comparedto SS solutions, they do not exactly resemble static optimisation solutions. In other words,smallholder maize farmers in Malawi appear to have some private incentive to conserve thesoil quality stock. To certain extent smallholder farmers internalise some of the dynamiccosts of soil degradation. This supports argument by various authors including Dasguptaand Maler (1990) and Larson and Bromley (1990) that traditional systems would somehowinternalise some of the potential externalities.
The shadow price of soil quality among smallholder farmers was also computed in thisstudy. This represents annual loss in productive value of land and was estimated to be US$21per hectare. This shadow price of soil quality was multiplied by the total estimated land areaunder smallholder maize production (1.2 million hectares). The amount was calculated as apercentage of the agricultural GDP for the study year in order to demonstrate the severityof the soil degradation problem among the smallholder farmers in Malawi. This representsdepreciation of natural capital which is not captured in the national accounts systems. It hasbeen estimated in this study that land degradation (due to soil erosion and soil mining) amongsmallholder maize producers alone amounts to 14% of the agricultural GDP.
Estimated initial level of soil nitrogen stock (S0) of 1.4 ton/ha, for the study sites wasslightly below the computed 1.6 ton/ha required for the SS. The fertiliser application rate andcapital use for soil conservation by smallholders under the prevailing practices was also farbelow the SS requirements. Therefore, it can be concluded that although smallholder farmersseem to internalise some dynamic costs of soil degradation, they still deviate from the SSoptimal path of soil resource use. Under the current smallholder practices during the periodof study, soil nitrogen stock (S) has been declining by 20 kg N/ha/year and therefore driftingfurther away from the SS optimum.
Sensitivity analysis of some critical parameters of the above model was done to assess therobustness of the model results (Table 5). The model was quite sensitive to the levels of fertil-iser prices and production parameters (elasticities) used. For example, a 17% price reductionon a kilogramme of fertilizer would induce an increased application rate of fertiliser. Underthis regime a slightly higher nitrogen rate of 57 kg N and yield level of 2 tons/ha would berequired to maintain indefinitely a SS level of soil nitrogen stock of 2.6 tons/ha (Table 5).The policy to reduce price of fertiliser generates similar results to the current fertiliser sub-sidy programme being implemented by the Government of Malawi. Making fertiliser pricesaffordable either through a subsidy or by encouraging competitive fertiliser industry (inor-ganic or organic) will act as an incentive to induce increased rates of fertiliser applicationand also increased yields to maintain indefinitely a high SS level of soil quality stock.
Sensitivity analysis on production parameter N showed that increasing crop response toN, (i.e., apply coefficient 0.311 instead of study estimated coefficient of 0.17) would double
11 Production coefficient based on long-term (17 years) N maize response trials at Kasama in Zambia (Auneand Lal 1995).
123

428 T. O. Nakhumwa, R. M. Hassan
Tabl
e5
Sens
itivi
tyan
alys
eson
som
ecr
itica
lval
ues
Var
iabl
eSS B
ase
run
δ=
2%
17%
Fert
ilise
rpr
ice
redu
ctio
nC
hang
ein
Nel
astic
ityN
elas
ticity
=0.
3H
ighe
rdi
scou
ntra
teδ
=5%
Incr
ease
dso
ilco
nser
vatio
n
Prod
uctio
nla
bour
(per
son
days
/ha)
128
173
191
8917
8
N-f
ertil
iser
(kg/
ha)
49.0
57.0
89.0
29.0
53.0
Mai
zeyi
eld
(ton
/ha)
1.5
2.0
3.0
0.8
2.0
Nitr
ogen
reso
urce
stoc
k(S
)(t
on/h
a)1.
62.
65.
90.
42.
0
Rat
eof
eros
ion
(cm
soil
dept
h/ha
)15
.013
.0
123

Optimal Management of Soil Quality Stocks 429
the SS maize yield to 3 tons/ha from SS base run of 1.5 tons/ha. Under this regime, higherfertiliser and yield levels, 89 kg N/ha and 3 tons/ha maize yield, respectively will thereforebe required to maintain indefinitely at SS the soil quality stock of 5.9 tons/ha. It should benoted that smallholder maize productivity would increase significantly if production inputmix shifted in favour of increased use of N. Steady state soil quality stock levels would bemaintained indefinitely at quite a higher level and would be maintained at that level by higherlevels of fertiliser and maize output. It should also be pointed out that a higher soil nutrientstock or soil quality means an increased soils’ worth. Therefore, cost of soil degradationwould significantly increase if proper policies that encouraged smallholder farmers to placea higher value on soil quality were promoted. As such, farmers would be encouraged toconserve their soil quality stock.
Also, SS solutions were highly sensitive to choice of discount rate used (Table 5). Withslightly higher discount rate, 5% instead of 2%, SS solutions closely resembled the prevail-ing smallholder practices. This result suggests that smallholder farmers in Malawi maybeoverexploiting soil quality stock because they have high time preference12 i.e., they valuethe current consumption more than the future consumption. As such, although these farmershave some private incentive to conserve soil quality stock, they are still forced to over-exploit the soil quality stock as they maximise current incomes at the expense of futurewellbeing. This result confirms similar results by Hausman (1979), Holden et al. (1998) andGunatilake et al. (2007) indicating that poverty (income) is an important determinant of themarginal rate of substitution between current and future consumption. Up to three-quartersof Malawi’s 13.1 population live below the international poverty line of $1.25 dollars a day(World Development Indicators 2011). However, it should be pointed out that poverty levelsbased on national poverty line has significantly reduced since 2004 due to the farm inputsubsidy programme currently being implemented by the Government of Malawi.
Reducing prices of labour and capital use for soil conservation would induce smallholderfarmers to invest more in soil conservation. Soil erosion reduced to 13 cm compared to baserun estimates of 15 cm soil depth per hectare. Under increased investment in soil conserva-tion, slightly higher levels of fertiliser 53 kg N/ha and 2 tons of maize would be required tomaintain indefinitely a slightly higher level of soil quality stock (Table 5). This demonstratesthat increased investment in soil conservation has potential to improve soil quality stock andtherefore increase soil’s worth.
7 Conclusion
Dynamic optimisation framework was used to derive the optimal conditions for soil resourceextraction and use in Malawi. One important finding from this study is that smallholderfarmers in Malawi do not operate on the steady state optimal path regarding soil qualitystock management based on the current farming practices. However, model results showedthat smallholder solutions based on current practices were above static optimisation solu-tions. This suggests that smallholder maize farmers in Malawi have some private incentiveto conserve the soil quality stock. Therefore these farmers somehow internalise some of thedynamic costs of soil degradation under the current farming practices. This finding meansthat there is no strong evidence to support the common belief suggesting that institutional
12 Time preference is defined as the marginal rate of substitution between current and future consumption(Becker and Mulligan 1997; in Gunatilake et al. 2007).
123
430 T. O. Nakhumwa, R. M. Hassan
failure, for example lack of private property rights among smallholder farmers, is the mainreason why smallholder farmers do not invest in soil conservation.
However, results from a sensitivity analysis using a slightly higher discount rate indicatethat SS solutions closely resemble the prevailing smallholder farming practices. This sug-gests that smallholder farmers in Malawi maybe overexploiting soil quality stock becausethey have a high time preference. That is, smallholder farmers value the current consump-tion more than the future consumption and wellbeing. High levels of poverty in Malawi andlack of viable alternatives to subsistence farming may be promoting such behaviour amongsmallholder farmers. Therefore, promotion of viable alternatives to subsistence farming inrural areas and formulating policies that make smallholder agriculture a profitable enterprisewill not only increase the cost of degrading a piece of land, but also encourage smallholderfarmers to invest towards soil quality stock improvement.
User cost of US$21 per hectare was estimated to be the annual loss in productivity value ofsmallholder land. Based on this value and the total smallholder land area under maize produc-tion, the economic costs of soil degradation (declining soil quality stock) among smallholderfarmers in Malawi has been estimated to amount to 14 % of the agricultural GDP. Pre-vious study on Malawi by Bishop (1992), based on static optimisation model, estimatedthis cost at 11% of agricultural GDP. However, static models usually ignore the dynamiccosts of soil use. Although input subsidy policies put huge financial burdens on govern-ments in developing countries, if properly managed i.e., well targeted and implemented ina more accountable and transparent manner, would help replenish the soil nutrient base inthe short-term. Justification for such seemingly expensive interventions should be based onweighing the counterfactual, i.e., the future cost to the economy and wellbeing of future gen-eration for doing nothing today to help reduce degradation of this natural capital. However,fertiliser subsidies should be supported with more long-term strategies such as conserva-tion agriculture and other soil fertility enhancing technologies to build more climate changeresilient soils. If soil degradation (soil nutrient stock) is left unabated, it seriously threatens notonly the future of smallholder agriculture in Malawi, but also limits economic growth as well.
Appendix 1
Steady State (SS) Solutions
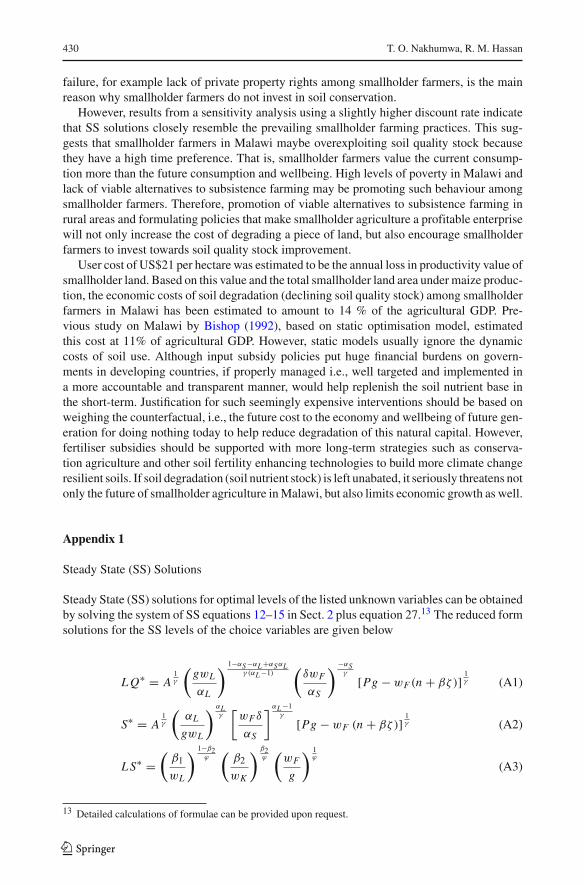
Steady State (SS) solutions for optimal levels of the listed unknown variables can be obtainedby solving the system of SS equations 12–15 in Sect. 2 plus equation 27.13 The reduced formsolutions for the SS levels of the choice variables are given below
LQ∗ = A1γ
(gwL
αL
) 1−αS−αL+αSαLγ (αL−1)
(δwF
αS
)−αSγ
[Pg − wF (n + βζ)]1γ (A1)
S∗ = A1γ
(αL
gwL
) αLγ
[wF δ
αS
] αL−1γ
[Pg − wF (n + βζ)]1γ (A2)
LS∗ =(
β1
wL
) 1−β2ϕ
(β2
wK
) β2ϕ
(wF
g
) 1ϕ
(A3)
13 Detailed calculations of formulae can be provided upon request.
123

Optimal Management of Soil Quality Stocks 431
KS∗ =(
β1
wL
) β1ϕ
(β2
wK
) 1−β1ϕ
(wF
g
) 1ϕ
(A4)
where ζ = E(Q) = bφe−bQ
Equations A1 and A3 give the reduced form equations for computing the SS optimallevel of labour and soil nitrogen stock S for production of Q. Similarly, equations A2 and A4give the reduced form equations for calculating the SS optimal levels of labour and capital,respectively, for soil conservation.
However, SS optimal level of fertilizer F can be calculated from equation A5( •S = H − D + G
). At steady state (SS),
•S = 0, therefore G = D − H :
F =
⎛⎜⎜⎜⎝
nA1γ
(wF δαS
)−αSγ
(αS
wL
) αSα2L
+αL−α2L
γ[Pg − wF (n + βζ)]
αS+αLγ + βe−bQ +[(
β1wL
) β1φ
(wK
β2
)−β2φ
(wF
g
) β2+β1φ
]− h
⎞⎟⎟⎟⎠
/g
(A5)
Appendix 2
See Table 6.
Table 6 Soil physical and chemical characteristics and fertility rating of the study areas (Nkhatabay andMangochi districts)
Crop trial Depth pH Soil pH rating Text OM N Rating of N(H2O) class (%) (%)
Nkhatabay district maize 0–20 5.0 Moderately acid SL 0.52 0.03 Very low
20–40 4.5 Acid C 0.62 0.03 Very low
Tobacco 0–20 4.9 Acid C 0.58 0.03 Very low
20–40 4.5 Acid C 0.38 0.02 Very low
Cassava 0–20 5.4 Moderately acid C 0.89 0.04 Very low
20–40 5.7 Slightly acid C 0.65 0.03 Very low
Control 0–20 4.6 Acid C 0.84 0.04 Very low
20–40 5.0 Moderately acid C 0.41 0.02 Very low
Mangochi district maize 0–20 6.1 Almost neutral SCL 0.96 0.05 Very low
20–40 6.1 Almost neutral CL 1.82 0.09 Low
Tobacco 0–20 5.7 Slightly acid CL 1.13 0.06 Very low
20–40 6.0 Almost neutral C 1.62 0.08 Low
Tobac/maize 0–20 5.5 Slightly acid CL 0.89 0.04 Very low
20–40 5.9 Slightly acid C 1.24 0.06 Very low
Control 0–20 5.8 Slightly acid C 1.72 0.09 Low
20–40 6.0 Almost neutral SCL 1.17 0.06 Very low
Survey data (2004): OM organic, SC sand clay, C clay, SCL sand clay loam, CL clay loam, SL sand loam
123

432 T. O. Nakhumwa, R. M. Hassan
References
Aune JB, Lal R (1995) The tropical soil productivity calculator. A model for assessing effects of soil manage-ment on productivity. In: Lal R, Stewart BA (eds) Soil management: experimental basis for sustainabilityand environmental quality. Advances in Soil Science. CRC Press, Lewis publishers, Boca Raton, pp499–520
Barbier R (1986) An assessment of the dominant soil degradation processes in the Ethiopian highlands: theirimpacts and consequences’. EHRS working paper 23, FAO/MoA. The economics of farm-level adoptionof soil conservation measures in uplands of java. Environment Department Working Paper No. 11. WorldBank, Washington, DC
Barbier EB (1998) Induced innovation and land degradation: results from bioeconomic model of a village inWest Africa. Agric Econ 19:15–25
Becker GS, Mulligan CB (1997) The endogenous determination of time preference. Quart J Econ 112(3):729–758
Bishop J (1992) The cost of soil erosion in Malawi. Report to Malawi Country Operation Department, WorldBank, Washington, DC
Bishop J (1995) The economics of soil degradation: an illustration of the change in productivity approach tovaluation in Mali and Malawi. International Institute for Environment and Development (IIED), London
Bojo J (1996) The costs of land degradation in Sub-Saharan Africa. Ecol Econ 16:161–173Braselle A, Gasper S, Platteau (2002) Land tenure security and investments incentives: puzzling evidence
from Burkina Faso. J Dev Econ 67(2):373–418Brekke KR, Iversen V, Aune JB (1999) Tanzania’s soil wealth. Environ Dev Econ 4:333–356Burt OR (1981) Farm level economics of soil conservation in the Palouse Northwest. Am J Agric Econ
63(1):83–92Chambers RG (1991) Applied production analysis: a dual approach. Cambridge University Press, Cambridge.
The Pitt Building Trumpington Street, Cambridge CB2 1RP 40 West 20th Street, New Yolk NY 10011,USA
Chiang AC (1992) Elements of dynamic optimisation. McGraw-Hill, New YorkDasgupta P, Maler K (1990) The environment and emerging developing issues. In: World Bank Annual Con-
ference on Development, World Bank Occasion Paper, Washington, DCDorward A, Chirwa E, Jayne T (2008) Evaluation of the 2006/2007 agricultural input supply programme,
Malawi: Final Report. London, School of Oriental and African Studies; March 2008. School of Orientaland African Studies (SOAS), Wadonda Consult, Overseas Development Institute and Michigan StateUniversity (2008)
Eaton D (1996) The economics of soil erosion: a model of farm decision-making. Environmental Econom-ics Programme. Discussion paper DP 96-01 (December 1996) International Institute for EnvironmentalDevelopment (IIED)
Government of Malawi (2002) Malawi National Policy p.p.a.S. Ministry of Lands. Lilongwe Malawi, Gov-ernment Priniters
Greene WH (1997) LIMDEP version 7.0, User’s manual revised edn. Econometric Software Inc., PlainviewGreene WH (2000) Econometric analysis fourth editionGrohs F (1994) Economics of soil degradation, erosion and conservation: a case study of Zimbwabwe. Wis-
senschaftsverlag Vauk Kiel KG, KielGunatilake HM, Wickramasinghe WAR, Abeygunawardena P (2007) Time preference and natural resource
use by local communities: the case of Sinharaja Forest in Sri Lanka. Asian Development Bank WorkingPaper No 100
Hailu Z, Runge-Metzger A (1992) Sustainability of land use systems. The potential of indigenous measuresfor the maintenance of soil productivity in Sub-Saharan agriculture. A review of methodologies andresearch results. Tropical agro-ecology (GTZ)
Hardy P (1998) Malawi soil fertility issues and options. Discussion PaperHausman JA (1979) Individual discount rates and the purchase and utilization of energy-using durables. Bell
J Econ 10(1):33–54Hediger W (2003) Sustainable farm income in presence of soil erosion: an agricultural-Hartwick rule. Ecol
Econ 00:1–16Henao J, Baanante C (2006) Agricultural production and soil nutrient mining in Africa. Implications for
resource conservation and policy development. An international centre for soil fertility and agriculturaldevelopment. P O Box 2040, Muscle Shoals, Alabama 35662, USA
Hertzler G, Ibanez-Meier CA, Jolly RW (1985) User costs of soil erosion and their effect on land agriculturalPrices. Costate variables and capitalised hamiltonian. Am J Agric Econ 67(5):948–1009
123

Optimal Management of Soil Quality Stocks 433
Holden S, Shiferaw B, Wik M (1998) Poverty, market imperfections and time preferences: of relevance forenvironmental policy?. Environ Dev Econ 3:105–130
International Fertiliser Development Center (IFDC) (1999) Estimating rates of nutrient depletion in soils ofagricultural lands of Africa. International Fertiliser Development Center. PO Box 2040 Muscle Shoals,Alabama 35662, USA
Jayasuriya RT (2003) Measurement of the scarcity of soil in agriculture. Resour Policy 29:119–129Lal R (1990) Soil erosion and land degradation: the global risks. In: Lal R, Stewart BA (eds) Soil degradation.
Adv Agron 11:129–172Larson B, Bromley D (1990) Property rights, externalities, and resource degradation. J Dev Econ 33:235–262Lunduka R (2009) Land rental markets, investment and productivity under customary land tenure systems in
Malawi. Norwegian University of Life Sciences, Department of Economics and Resource Management.PhD thesis 2009
Mangisoni JH (1999) Land degradation, profitability and diffusion of erosion control technologies in Malawi.PhD thesis submitted to the faculty of graduate school of the University of Minnesota
McConnell KE (1983) An economic model of soil conservation. Am J Agric Econ 65(1):83–89Mitchell RC, Carson RT (1993) Using surveys to value public goods: the contingent valuation methods:
resources for the futureMkandawire R, Jaffee S, Bertoli S (1990) Beyond dualism: the changing face of leasehold estate sub-sec-
tor of Malawi. Lilongwe, Bunda College of Agriculture and Institute of Development Anthropology,Binghamton
Nakhumwa TO, Hassan RM (2003) Adoption of soil conservation technologies by smallholder farmers inMalawi: a selective tobit analysis. South Afr J Agric Econ (Agrekon) 42(3):271–284
Norse D, Saigal R (1992) National economic cost of soil erosion: The case of Zimbabwe. Paper preparedfor the CIDIE workshop on environmental economics and natural resource management in developingcountries, World Bank, Washington DC, 22–24 January, 1992. FAO, Rome
Oueslati Walid (2005) Optimal soil management and environmental policy. Paper prepared for presentationat the XIth congress of european association for agricultural economists (EAAE). The ‘Future for RuralEurope in the Global Agri-Food Systems’, Copenhagen, Denmark, August 24–27, 2005
Pagiola S (1993) Soil conservation and the sustainability of agricultural production. PhD dissertation sub-mitted to the Food Research Institute and the Committee on Graduate Studies of Stanford University(Unpublished)
Pindyck RS, Rubinfeld DL (1998) Econometric models and economic forecasts, 4th edn. Mcgraw Hill Inter-national Editions, New York
Place F, Otsuka K (2001) Tenure, agriculture investment and productivity in customary tenure sector ofMalawi. Econ Dev Cult Change 50(1):77–99
Shiferaw B, Holden S (1999) Soil erosion and smallholders’ conservation decisions in the highlands of Ethi-opia. World Dev 27(4):739–752
Shively GE (2003) Externalities and labour market linkages in a dynamic two-sector model of tropical agri-culture. Paper presented at the Cornell University Worshop “Reconciling Rural Poverty and ResourceConservation: Identifying Relationships and Remedies”, May 2–3 2003
Sinebo Y, Yirga C (2002) Participatory Client-orientation of research in low input cropping systems of ethi-opia: a view point. In: Gemechu K, Yohannes G, Kiflu B, Chilot Y, Asgelil D (eds) Towards farmersparticipatory research: attempts and achievements. Proceedings of client oriented research evaluationworkshop 16–18 October 2001. Holetta Agriculture Research Centre, Holetta, Ethiopia
Solorzano R, de Camino R, Woodward R (1991) Accounts overdue: natural resource depreciation in CostaRica. World Resource Institute, Washington, DC
Stocking M (1986) The cost of soil erosion in Zimbabwe in terms of the loss of three major nutrients. Workingpaper No.3, Soil Conservation Programme, Land Water Division, Food and Agriculture Organization,Rome
Stoorvogel JJ, Smaling EMA (1990) Assessment of soil nutrient depletion in the sub-Saharan Africa. 1983–2000. Volume 1: Main report. The Winard staring centre. Wagenigen, 137 pp
Tchale H (2005) Agricultural policy and policy fertility management in the maize-based smallholder farmingsystem in Malawi. Development Economics and Policy. Peter Lang
World Development Indicators (2011) April 2011
123