optimal javelin release 1. - semantic scholar · optimal javelin release russell ... (hubbard &...
TRANSCRIPT

ORIGINAL INVESTIGATIONS
JOURNAL OF APPLIED BIOMECHANICS, 1995,11, 371-394 Q 1995 by Human Kinetics Publishers, Inc.
Optimal Javelin Release
Russell 1. Best, Roger M. Bartlett, and Richard A. Sawyer
This paper reports a study of the optimal release of men's and women's new and old rule javelins involving modeling, simulation, optimization (including sensitivity analysis), and simulation evaluation. Because of the lack of repro- ducibility in earlier results of two-dimensional flight simulation research, the paper presents a continuation of the two-dimensional model used pre- viously. As expected, each javelin was found to have a different optimal release for a given individual, and the optimal release varied with the thrower's nominal release speed. A limited degree of simulation evaluation was achieved by comparison of the model and simulation results with mea- sured throws. Within the constraints of measurement error, this tended to support both the adequacy of the two-dimensional model and the results of the simulations for such high standard throws. However, further experimental studies to quantify the angle of yaw (sideslip) in measured wind conditions are recommended to assess any changes needed to the two-dimensional model of javelin throwing and to determine the advisability of including this three- dimensional aspect of javelin release in future simulations.
In elite sport, where athletes often push themselves to the limits of their physical capability, it is reasonable to assume that peak performance will involve riding close to the edge of inhibitory injury constraints. This makes the trial- and-error method of technique analysis and theory building somewhat hazardous. A less hazardous method is to use the dynamics of the event and computer simulation to search for the optimal control necessary to maximize or minimize a predetermined performance index. Throwing events pose an interesting optimi- zation problem because the flight path cannot be affected by the thrower once the implement has been released, the airborne phase being entirely defined by gravitational and aerodynamic forces (Hubbard & Rust, 1984). In control theory this is a classic initial (release) condition problem. In javelin throwing, the performance index to be maximized is the distance thrown, and the simplest
Russell J. Best is with the Department of PE and Recreation and the Centre for Rehabilitation, Exercise and Sport Science, Victoria University of Technology, Melbourne, Victoria 3000, Australia. Roger M. Bartlett is with the Division of Sport Science, The Manchester Metropolitan University, Alsager, ST7 2HL, UK. Richard A. Sawyer is with the Department of Aeronautical and Mechanical Engineering, University of Salford, Man- chester, M5 4WT, UK.

3 72 Best, Bartleff, and Sawyer
Nomenclature
The nomenclature in this paper is derived, with alterations where appropriate, from Hopkin (1966) and Royal Aeronautical Society (1967). Local notation will be defined within the text. Some of the following are shown on Figure 1.
a a" Y 0 P (0) 0 dot bold face
planform area of javelin drag: lift, and moment coefficients (e.g., CD = D/[1/2 . p . V2 . A]) center of mass center of pressure (aerodynamic center) aerodynamic drag force javelin mass center to foul line distance CP position relative to CM (H = M/N = ltip to CM distance1 - ltip to CP
distancel) CP position relative to tip transverse moment of inertia modified drag, lift, and moment coefficients (e.g., KD = D/V2 = CD . 112 .
P . A) aerodynamic lift force aerodynamic pitching moment (positive anticlockwise for two-dimensional
flight from left to right) normal aerodynamic force pitch rate (angular velocity about javelin horizontal, short axis, y-axis; q =
O for two-dimensional flight) range (distance thrown) maximum range critical Reynolds number (using maximum javelin diameter) time magnitude of javelin's center of mass velocity vector relative to air and earth nominal release speed; maximum release speed of a thrower at y(0) = 35" wind speed relative to earth z-component of velocity relative to earth horizontal axis and displacement (forward positive) vertical axis and displacement (upward positive); height of javelin mass
center true aerodynamic angle of attack angle of attack relative to earth (aK = O - y) angle of climb or flight path angle relative to earth; y(0) = release angle inclination (attitude) angle air density as in q(0); value at instant of javelin release, t(0) as in H(a), H is a function of a as in q; differentiation with respect to time vector representation
optimization application is to find the optimum set of release conditions. This optimal set then serves as a reference from which variations can be assessed quantitatively and rectified.
Such a process has three distinct phases, namely system modeling, simula- tion, and optimization. A fourth element, simulation evaluation, should be more systematically included in such studies, although its implementation is often

Optimal Javelin Release
pitch
1"" --- - - wind speed
release angle
I distance to foul line
I Figure la - Release conditions for two-dimensional model.
/ relative air velocity
Figure l b - Aerodynamic force and moment system acting on the javelin.
fraught with difficulties. Of equal importance in most sporting contexts is the related sensitivity analysis, which evaluates, through modeling and simulation, how a system performs under a wide variety of nonoptimal conditions.
On April 1, 1986, the International Amateur Athletic Federation (IAAF) implemented a rule change in the men's javelin event including revisions to the javelin design specification that moved the javelin center of mass 0.04 m toward the tip and increased the minimum allowable diameter of the tail section (pre- 1986 and post-1986 men's javelins will be referred to hereafter as old and new rule men's javelins, respectively). These modifications were implemented in an

3 74 Best, Bartlett, and Sawyer
attempt to reduce the distance thrown, increase the likelihood of javelins sticking into the ground, and overcome "yawing instability," thus making the event safer and making it more likely that the "best throw," independent of environmental conditions and officiating errors, would win an event. In the years following the 1986 rule change, the design of men's javelins developed radically, culminating in the introduction of designs that manipulated the air flow over the javelin via strategically placed areas of surface roughness. The first javelin of this type, the Nemeth javelin, was not banned by the IAAF and produced apparent improve- ments in an individual's range capability of greater than 3 m and corresponding increases in the men's world record. On April 1, 1991, for similar reasons, the IAAF implemented a rule change in the women's javelin event, including re- visions to the javelin design specification that increased the minimum allowable diameter of the tail section (pre-1991 and post-1991 women's javelins will be referred to hereafter as old and new rule women's javelins, respectively).
These rule and design changes altered the dynamic characteristics of javelins and meant that new optimal release conditions would ensue. A survey of literature reporting in~esti~atibns of javelin aerodynamics (including Best & Bartlett, 1988a, 1989; Cai, 1983; Jia, 1987, 1989; Terauds, 1972, 1985) revealed differ- ences in measurements of pitching moment and the associated position of the aerodynamic center of the javelin as a function of the angle of attack (see Figure 2, from Bartlett & Best, 1988; also Jia, 1989). This variability has led to diverse predictions in the simulation studies that have used these aerodynamic data (e.g., Best & Bartlett, 1988b, 1989; Best, Bartlett, & Sawyer, 1989; Hubbard, 1984; Hubbard & Alaways, 1987; Qian, 1989; Soong, 1982). Some of this variability is, of course, because javelins from different manufacturers do differ, especially in the relationship between pitching moment and angle of attack. However, the
Figure 2 - Center of pressure variation with angle of attack (adapted from Bartlett & Best, 1988). - - - Held Old Rules (Terauds, 1972). ........ Held New Rules (Terauds,
. - Apollo Olympic New Rules . .--a Apollo Ladies
25 20 15 10 5 0 -5 CP Distance From Mass Centrelcm

Optimal Javelin Release 3 75
methods used to measure the aerodynamic characteristics of javelins have not always been sufficiently sensitive or rigorous. For example, it is important to note that new rules "javelin aerodynamic data" of Terauds (1985) were not the outcome of experimental wind tunnel tests but were estimates based on old rules javelin aerodynamic data and observations of Javagun throws (Bartlett & Best, 1988). The use of such speculative aerodynamic data led Hubbard and Alaways (1987) to predict potential ranges for the new rules javelin 10-15% greater than those calculated, from wind tunnel measurements, by Best and Bartlett (1988b).
Because of the variability in previous results of two-dimensional flight simulation research, this paper will present an optimization of javelin release that continues with the two-dimensional model. The aim of the paper is to determine optimum javelin release parameters for the following javelins, includ- ing modeling, simulation, optimization (incorporating sensitivity analysis), and simulation evaluation. The javelins were three men's javelins-the Nemeth New Rules (N86) (now illegal), the Apollo Gold New Rules (A86), and the Apollo Gold Old (pre-1986) Rules (A85)-and two women's javelins-the Old (pre- 1991) Rules Apollo Laser (A90) and the New Rules Apollo Gold (A91).
Modeling
The equations of motion for two-dimensional javelin flight are well known (e.g., Hubbard & Rust, 1984) and need not be restated here. An important feature of the modeling process of this study involved the establishment of accurate javelin parameter values.
javelin Moment of Inertia
In order to solve the equations of motion for flight simulation it was necessary to obtain values for the javelin moment of inertia about its short, transverse axis (I,). Nonoscillatory methods (e.g., shape modeling or dissection) were deemed inappropriate owing to inaccuracies in the manufacturing process and cost. Of the remaining methods, the pendulum method in the form of a trifilar suspension was adopted because of its simplicity, accuracy, and availability. This enabled us to calculate the moment of inertia of the javelin by measuring the natural frequencies of the suspension table alone and the table plus javelin, together with the relevant masses and dimensions of the javelin, table, and suspension cords. The time for a minimum of 20 oscillations was taken when calculating frequencies, and this was repeated five times to obtain a best estimate mean value. This procedure was evaluated using an object of known mass and geometry. Values of the moment of inertia for the table plus object (and, therefore, I, for the javelin) were found to be accurate to the fourth decimal place. Uncertainties in times for 20 oscillations of the javelin-table system were used to calculate a standard error of measurement in I, of 0.001 kg . m2. The I, results obtained for the javelins used in this study are presented in Table 1.
Table 1 shows that the variation in I, for both the men's and women's javelins was about 3%. The values of I, for the men's javelins were almost double those for women's javelins. This was simply a function of the differences in javelin mass and geometry defined by IAAF rules. Variations (up to 1.3%) in

376 Best, Bartlett, and Sawyer
Table 1 Characteristics of Men's and Women's New and Old Rules Javelins
Javelin Mass (kg) Frequency (Hz) IY (kg . mZ)
Two A91 models were tested to assess within model variations in I,.
the mass of men's and women's javelins were surprising, especially considering that a thrower can produce greater release speeds with less massive implements (Kunz, 1974). Javelin mass must be greater than 0.6 kg and 0.8 kg for women's and men's javelins, respectively. The variation in mass and I, is largely brought about in the manufacturing process of "leading the tip." During the final stages of production, fine adjustments are made to the mass center position (for which the rules are very stringent) by adding lead to the tip of the javelin.
The I, results for the men's javelins in this study (mean rt SD 0.423 kg . m2 rt 0.007) compared favorably with the only other data available in the literature (0.421 kg - m2 rt 0.040, n = 11; Terauds, 1972). There was a much larger standard deviation in Terauds' study owing to the larger variety of construction materials used at that time. Indeed, the majority of Terauds' variance was caused by wooden javelins. A86, advertised as a high I, implement, had the lowest I, value of the men's javelins tested. The computer flight simulation results of Best and Bartlett (1988a) showed that, keeping all other factors constant, a high I, javelin would travel slightly further, and Hubbard (1984) concluded that even a 10% change in moment of inertia gave no significant increase in range. We have found that top athletes interpret the high I, javelin as being "heavier," probably because it requires a greater torque to produce the same angular acceleration. This psychological effect has not been quantified.
la velin Aerodynamics
To effectively simulate javelin flight, the forces and moments acting on the javelin during flight must be represented as functions of air velocity relative to the javelin and angle of attack. This required the modeling of L,D,M(V,a) for the full range of V and a associated with elite javelin throwing. Owing to the large discrepancies between previously reported javelin aerodynamic data, we took great care in this aspect of the study.
Apparatus and Procedures. Wind tunnel tests were carried out in a modified section (0.7 m wide by 1.53 m high by 3 m long) in the University of Salford large environmental wind tunnel. The modified section had the following capabilities: 5 m . s-I I V I 30 m . s-I, and 0" I a I 43" and 0" I a I 33" for women's and men's javelins, respectively. Air speed was measured using a digital

Optimal Javelin Release 377
vane anemometer and was verified using a pitot static water gauge anemometer. Angle of attack ranges, anemometer positioning, javelin positioning and attach- ments, and curved walls at each end of the test section were designed to minimize air flow interference and to avoid wall effects. The javelin was supported such that its long axis was in the same vertical plane as the relative velocity vector of the air. As the direction of the latter was horizontal, then a = @. The angle of attack, a, was measured using an industrial clinometer placed on the grip with a correction factor calculated (because there was no guarantee that the grip was flat) by equalizing the distance above the floor (which was flat) of the javelin tip and tail, this representing the a = 0" condition. Forces and moments acting on the javelin were transmitted via two metal struts connected to a three- component (lift, drag, and pitching moment) balance system situated on top of the wind tunnel. All items situated in the wind tunnel were streamlined to facilitate undisturbed air flow.
The aerodynamic force and moment system acting on the javelin is de- scribed in Figure lb. Every effort was made to model the geometry of the balance- javelin system (a seven-bar chain in this study) and to make the joints between the javelin and balance frictionless. The former was found to be extremely important when calculating the true moments acting about the javelin center of mass. The latter was checked by regular calibration of the three balances. Since all three balances were part of the main balance frame, they were free to interact. A 3 x 3 calibration matrix was therefore derived and its inverse used to calculate true forces and moments. The balance comprised a system of levers that allowed the javelin to move vertically (owing to lift) and horizontally (owing to drag) and to rotate (< 0.5") in the xz-plane (owing to the pitching moment; this small rotation was accounted for in balance geometry calculations). These movements were monitored by linear displacement transducers (LDTs), the outputs from which, along with the vane anemometer output, were fed into a 4096 bit analogue to digital (AD) converter. The sensitivities of the balances were altered so that the forces and moments for a particular condition registered near full-scale deflection on the LDTs. Balances were recalibrated each time their sensitivities were altered. Tare and javelin plus tare results were calculated separately. A separate tare rig was built that consisted of all protruding elements that were present in the air flow with the javelin in position. All aerodynamic data were converted to standard temperature and pressure (dry) on-line.
Data Sampling. No Reynolds number effects were found for the range of air speeds (5 to 30 m . s-I) used for the wind tunnel tests. This showed the coefficients KD,L,M to be essentially constant for a given angle of attack a (i.e., independent of V). Lift, drag, and pitching moments were measured for a range of a and regression analysis used to find n in the functions L,D,M(Vn). The value of n was found to be 2.0 (accurate to at least the second decimal place) with values of the coefficient of determination of 0.99, 0.97, and 0.94 for D(V2), L(V2), and M(V2), respectively. Hence, in obtaining K , , , , it was acceptable to limit lift, drag, and moment readings to a representative selection of air speeds for any given a setting. The protocol adopted was such that eight K , , , readings were taken per a setting (at varying V), and the mean of the central quartile was used to calculate the best estimate of K, , , . Each of the eight K,,, values was calculated from the stream of continuous information from the LDTs. These data were taken as a steady stream at regular time intervals (a .035 s).
378 Best, Bartlett, and Sawyer
The javelin plus tare tunnel-on results showed that, rather than being con- stant, the data oscillated about a mean value with an underlying frequency of about 0.25 Hz. This variation is typical of the problems associated with measuring small forces and moments and may have been caused by several factors. These were principally friction in moving joints; small movements outside the vertical plane containing the relative velocity vector of the air; asymmetric flow caused by shape irregularities in the tare rig, javelin grip, nose, and sheath; and the sensitivity of the balance. The balance was very sensitive, such that people walking in close proximity to the tunnel affected the LDT output, and this was therefore avoided. The amplitude or frequency of the signal was not related to the make of javelin, and there were no observable javelin vibrations, similar to the findings of Terauds (1972). All tunnel-off data, used for zeroing the LDTs, were highly repeatable.
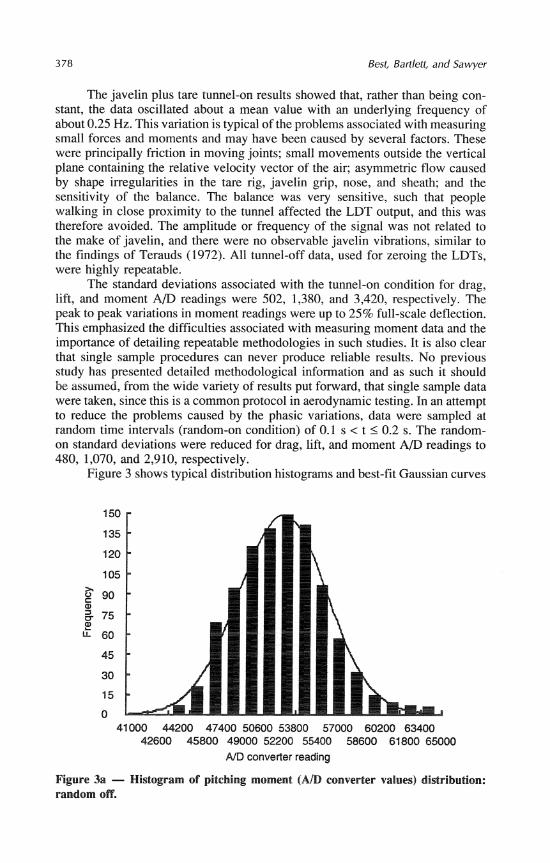
The standard deviations associated with the tunnel-on condition for drag, lift, and moment A D readings were 502, 1,380, and 3,420, respectively. The peak to peak variations in moment readings were up to 25% full-scale deflection. This emphasized the difficulties associated with measuring moment data and the importance of detailing repeatable methodologies in such studies. It is also clear that single sample procedures can never produce reliable results. No previous study has presented detailed methodological information and as such it should be assumed, from the wide variety of results put forward, that single sample data were taken, since this is a common protocol in aerodynamic testing. In an attempt to reduce the problems caused by the phasic variations, data were sampled at random time intervals (random-on condition) of 0.1 s < t I 0.2 s. The random- on standard deviations were reduced for drag, lift, and moment A D readings to 480, 1,070, and 2,910, respectively.
Figure 3 shows typical distribution histograms and best-fit Gaussian curves
41000 44200 47400 50600 53800 57000 60200 63400 42600 45800 49000 52200 55400 58600 61800 65000
AID converter reading
Figure 3a - Histogram of pitching moment (A/D converter values) distribution: random off.

Optimal Javelin Release
AID converter reading
Figure 3b - Histogram of pitching moment (AID converter values) distribution: random on.
Normal distribution probability/%
Figure 3c - Pitching moment (AID converter values) probability data with normal distribution fitted.
for the moment A D readings. Although the random-off data of Figure 3a appear, by eye, to be more favorable than the random-on data in Figure 3b, the opposite is true. Analysis of the data revealed skew coefficients of 0.39 and 0.06 (positive representing extension of the more positive side) for the random-off and random- on conditions, respectively. This implied that the random-on condition displayed

380 Best, Bartleft, and Sawyer
more symmetry and, importantly, that the random-on mean was much more representative of the central tendency in the data. Indeed, the skew coefficient cutoff for acceptance of normality as a good model for the data was quoted as <10.31 by Clarke (1987). The relative platykurticity of the random-on data compared to mesokurtic random-off data is irrelevant because it is the symmetry and not the peakedness of the data that is important in this example. Figure 3c further emphasizes the Gaussian nature of the sample. Here the data were ranked from smallest to largest, and each was given a probability worked out by the Gringorten formula:
where p(y) is the probability of each y value ( A D reading), m is the rank of each y value, and n is the sample size. If a straight line is obtained for the p(y) versus y plot then the distribution is Gaussian. Figure 3c emphasizes the Gaussian nature of both sets of data, especially in the region of central tendency, although the end-point deviations, 10% > p(y) > 90%, were considerable. To counter this problem it was found, through trial and error, that the location of the central tendency was best described by taking the mean of the sorted data that lay in the central hexadecile. Similar distributions of results to those described for moment AD readings were found for lift and drag readings. The raw KD,,,,(a) data were subjected to a discrete least squares polynomial curve-fitting program. The "best-fit" polynomial degree was quantified using the technique outlined by Hayes (1970).
Results and Discussion. The best-fit polynomial coefficients (ao to a3) calculated for KD,L,M(a) are presented in Table 2, along with the coefficient of
Table 2 Best-Fit Polynomial Coefficients for KD,LM(a)

Optimal Javelin Release 381
Figure 4 - Modified lift coefficient (KL) variation with angle of attack (a) for men's and women's javelins.
determination, COD, and p, where p is the probability that the (n + 1)th degree is a better fit than the nth degree (see Hayes, 1970). Within the range of a used in this study, the best-fit polynomial functions KL(a) were second order for men's javelins and third order for women's javelins (Figure 4). The limitation of wind tunnel size meant that a third order curve was not established for men's javelins, although it would be expected. The general shape of the KL(a) curves agreed with the previous literature for this shaped implement (e.g., Goldstein, 1965). The differences between men's and women's curves in the range a < 30" were almost entirely owing to differences in planform area (A). In this respect, similar differences were seen for drag curves (Figure 5), and for all javelins tested, &(a) were described by second order polynomials.
Small but important differences were found between the lift (Figure 4) and drag profiles (Figure 5) of different javelins. Since the tare results, subtracted from the javelin plus tare results, were the same for all of the men's javelins and for all of the women's javelins, the differences in lift and drag profiles were a function only of the different javelins. Differences in KD(a = 30") between A85 and A86, between A86 and N86, between N86 and A85, and between A90 and A91 were approximately 6, 4, 2, and 1.5 times greater, respectively, than the standard error of estimation as calculated from the raw, single sample LDT data (which was an overestimate of the error and twice as large as the greatest lyi(xi) - P(xi)l found from polynomial curve fitting for any javelin, where P(xi) is the polynomial predicted value of y at xi). Similar results were found for K,(a = 30°), except for A90 and A91 (the profiles of which were almost identical).
The more positive lift and drag profiles for A86 compared to A85 were mostly a consequence of the 1986 rule change (which increased the minimum allowable diameter of the tail section) and of changes in nose design since 1986. The nose sections of new rule men's javelins are considerably broader than for

Best, Bartleft, and Sawyer
Figure 5 - Modified drag coefficient (K,) variation with angle of attack (a) for men's and women's javelins.
old rule javelins. This was an attempt by manufacturers to maximize surface area forward of the center of mass and, hence, move the center of frontal area (the area seen when looking along the direction of the relative wind vector) and the center of pressure closer to the tip. This will be shown later to be the overriding aim of javelin design.
The more positive lift and drag profiles for A86 compared to the controver- sial N86 were a consequence of an area of surface roughness on N86 about 0.5 m long, situated with its leading edge approximately 0.5 m aft of the grip. The reduced force coefficient profiles on N86 most probably occurred because of a reduction of cross-flow forces in the area of surface roughness either by delaying flow separation or inducing turbulent flow in that region. No Reynolds number effects were seen for N86, which suggests that the latter explanation was unlikely (the effect of roughness is to reduce R g , but not by the amount required for the latter to be true). Reynolds numbers of less than 80,000 were used in this study, which compares with Re, E 500,000 for similar-shaped imple- ments (but much lower fineness ratio) reported by Goldstein (1965).
Reducing the forces solely in the region of roughness behind the grip should move the center of pressure closer to the tip in N86 compared to A86. This was the case (Figure 6). In fact, the surface roughness on N86 almost entirely negated the aerodynamic effects of the 1986 rule change, except for the center of mass change (see Figure 7). The possibilities for this phenomenon were emphasized by the later production of a Sandvik javelin with concentric circumferential surface roughness throughout the whole of the rear of the javelin behind the grip. This javelin increased the world record by a further 5 m above the N86 value. Figure 7 shows the center of pressure position relative to the center of mass, where the extra difference between N86 and A85 was due to the center of mass being a further 0.04 m aft of the tip on A85. Positive values of H refer to the

Optimal Javelin Release
a?' Figure 6 - Center of pressure position relative to tip (H,) as function of angle of attack (a) for men's javelins.
cd"
Figure 7 - Center of pressure position relative to center of mass (H) as function of angle of attack (a) for men's and women's javelins.
center of pressure being in front of the center of mass (relative to the tip), which is an unstable configuration. In flight, a will tend to the equilibrium angle of attack, at which there is no pitching moment. A more positive H(a) profile meant that the javelin could fly for longer periods at an angle of attack with a more beneficial ratio of lift to drag. This is a very important consideration in determining how far one javelin will fly compared to another.

384 Best, Bartlett, and Sawyer
Differences within men's and women's javelin characteristics can be ex- pressed almost entirely as a function of the H(a) profile. The general shape of the curves in Figure 7 agrees with the results of Jia (1987), who looked at old rule men's javelins only. Our data do not agree with other aerodynamic data in the literature (Best & Bartlett, 1988a, 1989; Cai, 1983; Terauds, 1972). This can be seen, for some of these earlier studies, by comparing Figures 2 and 7. The main delimitations of previous studies compared to the present study were probably the use of single sample data and no accounting for balance interactions (not enough methodological information was given in previous studies to be certain of this). These factors almost entirely accounted for the differences between this study and the results of Best and Bartlett (1988a, 1989).
For women's javelins, A91 showed more negative K,(a) and KL(a) profiles than A90, although the latter difference was slight (Figures 4 and 5). These differences were the opposite to those expected, since the 1991 rule change included an increase in the minimum allowable diameter of the tail section. However, closer inspection of the geometry of the two javelins revealed that A91 had a much thinner profile toward the extreme tail and immediately behind the grip. Further evidence that this was indeed the case is provided in Figure 7, where the reduced planform area aft of the center of mass on A91 meant that its H(a) profile was more positive. This implied that the 1991 rule change may have had the opposite effect to that intended. This anomaly may have been because the women's javelin design had not been altered for over a decade prior to the rule change. The 1991 rule change may have inspired manufacturers to improve the geometry of women's javelins in a similar way to the design improvements inspired by the 1986 men's rule change. A more positive H(a) profile is associated with flat landings (discussed later). Thus, if surface manipula- tions and other recent design improvements were applied to new rule women's javelins, flat landings would be an even greater problem than pre- 199 1. The rule change presented to the 1991 World Championships in Tokyo, which restricts surface manipulation designs, partly limits the possibilities in this respect for both women's and men's javelins.
Worthy of note is the finding of Gad-el-Hak and Ho (1986) that vortex asymmetry occurred at all angles of attack on a pitching ogive cylinder (a shape similar to the nosepiece of a javelin). They also found that vortex unsteadiness varied for a given angle of attack depending on the pitching direction. A hysteresis effect occurred, with greater separation for negative than for positive pitching velocities. While this hysteresis effect will be partly negated by the tail of the javelin, the extreme nose and tail sections have very different geometries and thus a significant effect on moment profiles.
Owing to the difficulties in accurately measuring the small forces and moments acting on the javelin, especially for the women's javelin, it is recom- mended that further aerodynamic studies are given priority in future work in order to establish the reliability of such data. Similarly, it is not clear whether the variability in wind tunnel readings was caused by javelin shape irregularities and vortex instabilities (e.g., Gad-el-Hak & Ho, 1986) or by tare rig and balance problems. If the first two are even partly the causes, then the variations depicted are real and should be incorporated into the aerodynamic model equations. How- ever, the frequency of Von Karrnan vortex shedding is much higher than 0.25 Hz and can, therefore, probably be ruled out as a cause of the variability.

Optimal Javelin Release
Simulation and Optimization
Simulation
Solution of the two-dimensional equations of motion was a straightforward task that has been covered extensively in the previous literature (e.g., Best & Bartlett, 1988a, 1989; Best, Bartlett, & Sawyer, 1990; Hubbard & Rust, 1984; Soong, 1982). With the dynamic model described earlier, javelin flight simulation was possible once the initial conditions were specified, and the resulting throw distance can be expressed in terms of five release parameters: release speed, VK(0); release height, z(0); release angle, y(0); release angle of attack, aK(0); and release pitch rate, q(0). The wind speed, VW, should also be specified, although it is neither a release parameter nor under the control of the thrower.
Because of the interrelationship between release speed and release angle, the release speed was replaced by the nominal release speed, V, defined as the maximum speed at which the thrower can release the javelin at a release angle of 35". The relationship between release speed, nominal release speed, and release angle is based on data from Red and Zogaib (1977) and Viitasalo and Korjus (1988). Both studies reported a linear decrease in release speed with increasing angle of release for the range of release angles found in javelin throwing. The relationship used was (with speeds in meters per second and angles in degrees)
Then, if wind speed is assumed to be constant throughout flight,
A number of procedures were used as numerical methods in solving the equations of motion including Runge-Kutta fourth and Runge-Kutta-Fehlberg fifth order algorithms (e.g., Burden & Faires, 1989). All fourth order procedures and above produced identical results to greater than the desired accuracy of the simulation, which was preset at a safe global tmncation error in x of 10.001 m (error propagation, by step doubling, was monitored for all differential equation solutions). Adaptive stepsize procedures were also utilized (e.g., Press, Flannery, Teukolsky, & Vetterling, 1989), using the above preset error limit, and were found to produce stepsizes of greater than 1 s, which made the point of landing difficult to determine. We eventually used the Runge-Kutta fourth order method with an iteration stepsize of 0.05 s (producing a global truncation error in x of
m) for the main body of flight. This stepsize was reduced to 0.0005 s for end-point landing accuracy when the combined constraints z < 3 m and wK < 0 m - s-' for the javelin mass center were met. Any stepsize value causes overshooting on landing (the vertical coordinate of the tip z,, c O), but a small stepsize minimizes this and makes the back calculation to zti, = 0 m a simple geometric approximation. The above stepsizes produced results that were well within preset error limits, allowed easy computation of the point of landing, gave enough flight information for our graphical flight analysis software, and made real time flight graphics easy to compute (see Best et al., 1990). We recommend for future work that fourth order procedures be used as a minimum requirement and that other methods, such as predictor-corrector and Bulircsh-Stoer algorithms (e.g., Press et al., 1989), be used only where extreme precision is required.

386 Best, Bartlett, and Sawyer
Optimization
Of the five release parameters in Equation 3, nominal release speed is generally accepted as constant for a given individual. Release height can also be treated as constant for an individual since small changes in this parameter away from the optimum are likely to have detrimental effects on other more important parameters (such as release speed). In normal javelin throwing, the release height varies only slightly for any given thrower (see Bartlett & Best, 1988). The three remaining release parameters of pitch rate, release angle, and angle of attack relative to the earth are optimizable. If each of these three parameters was allowed to vary independently (keeping all other parameters constant), then an optimal set of initial conditions could be found which would maximize range and satisfy
There are many mathematical procedures that can find a peak on an n- dimensional hill (n is the number of optimizable independent variables plus the dependent variable). The above problem, in modem-day javelin throwing, can be solved via unconstrained optimization (Best et al., 1990). The direct search algorithm of Davies, Swann, and Campey (DSC) (Box, Davies, & Swann, 1969), described and justified for the javelin throwing problem by Best et al. (1990), was utilized in this study. This algorithm is slower than the more commonly used Powell's method but does not have the problems that can arise using Powell's method for complex surfaces, as detailed by Box et al. (1969). The DSC method can prove more efficient than other methods because it uses ongoing information to continually redefine mutually orthonormal direction vectors (to find the direc- tion of steepest slope) which helps in overcoming ridges and skews that can appear on the n-dimensional surface.
Sensitivity Analysis. Sensitivity analysis via contour mapping (e.g, Fig- ure 8) essentially serves two roles. First, Equation 5 is not only true for the global maximum but is also true for every loch minimum or maximum that may appear on the n-dimensional surface. There is no mathematical algorithm that can bypass local minima or maxima to find a global minimum or maximum. All optimization techniques converge at a local value that may or may not be global. Using different starting points may give different answers for the local value and may still miss the global one completely, especially if it is surrounded by smaller peaks. The only way to see if there is more than one peak is to look at the full control surface, R = f(x) (where x represents the vector of optimizable independent variables), remembering that for any peak or trough d R / x = 0. This procedure is usually difficult since only two independent variables can be viewed at any one time, for example, using contour maps as in Figure 8, while the remaining optimizable variables have to be preset at some constant value, for example, q(0) = 0" . s-' in Figure 8. This causes problems for n :, 3. However, contour mapping does serve a useful purpose in verifying results obtained from the optimization algorithm.
The second aspect of sensitivity analysis involves a more detailed evaluation of relationships between independent and dependent variables as shown on a contour map, which is not possible using mathematical optimization routines. Sensitivity analysis enables assessment, for example, of whether the global

Optimal Javelin Release 387
Contour key No. Rlm 1 90.9 3 91.1 5 91.2 7 91.3 9 91.5 11 91.6 13 91.7 15 91.9 17 92.0 19 92.1 21 92.3 23 92.4 25 92.5 27 92.7 29 92.9
() dashed contour no.
Figure 8 - Contour map showing dual peak phenomenon in range as a function of release angle (%O)) and release angle of attack (aK(0)) for N86 javelin (nominal release speed set to 30 mls, release height at 1.8 m, and wind speed at zero).
maximum or minimum is essentially a plateau or a sharp peak for each optimizable variable. This type of analysis can also give insight into the most efficient way to reach the peak, effectively defining positive directions to training regimes. Obviously n-dimensional graphs would be useful for observing the complete control surface but impractical for n > 3. Contour surface plots of a function of three variables do exist (e.g., Sewell, 1988) but are not easily interpreted. Mapping of a function of two variables was chosen in this study in the form of contour mapping. Contour maps were required for the combinations R = R[y(O),q(O)], R = R[q(0),aK(O)], and R = R[y(0),aK(O)]. Wind speed was set to zero and release height was fixed at 1.8 m, and a range of nominal release speeds was investigated (20 m . s-' I VN I 32 m . s-I). All mapping programs were interactive and allowed the user a choice of javelin, VN, and mesh resolution within the constraints of the data arrays and NAG library routines.
Results and Discussion. Figures 9 to 11 show the simulated optimal javelin release conditions for female and male athletes of varying ability (varying V,) using the javelins modeled in this study and with z(0) = 1.8 m and VW = 0 m - s-'. Note that when VW = 0 m s-', a = aK, and R,, is the maximum predicted range capability associated with the global maximum condition of Equation 4. A sample of solutions was checked using contour maps of the whole n-dimensional mesh, for example, by observing contour maps for fixed values

388 Best, Bartlett, and Sawyer
-16 Nominal Release Speed (mls)
Figure 9 - Optimal release angle of attack (aK(0)) variation with speed (VN).
Figure WN).
nominal release
Nominal Release Speed (mls)
10 - Optimal release pitch rate (q(0)) variation with nominal release speed
of q(0) while the contour map displayed R[y(0),aK(O)]. Further checks were carried out by "zooming in" on the global peak, which occasionally, as in Figure 8, showed double peaks, similar to those presented by Hubbard and Alaways (1987).
It was initially thought that the double peaks were a function of the contour mapping routine and the resolution of the mesh. However, that the peaks were real was verified by plotting optimal aK(0) as a function of VN (Figure 9). This
Optimal Javelin Release
P
33 -- / / /
/ 0 sd- - - -
/ /
L 32 -- ---/- - - - -7 al /
/-
I- /-
23 - Nominal Release Speed (mls)
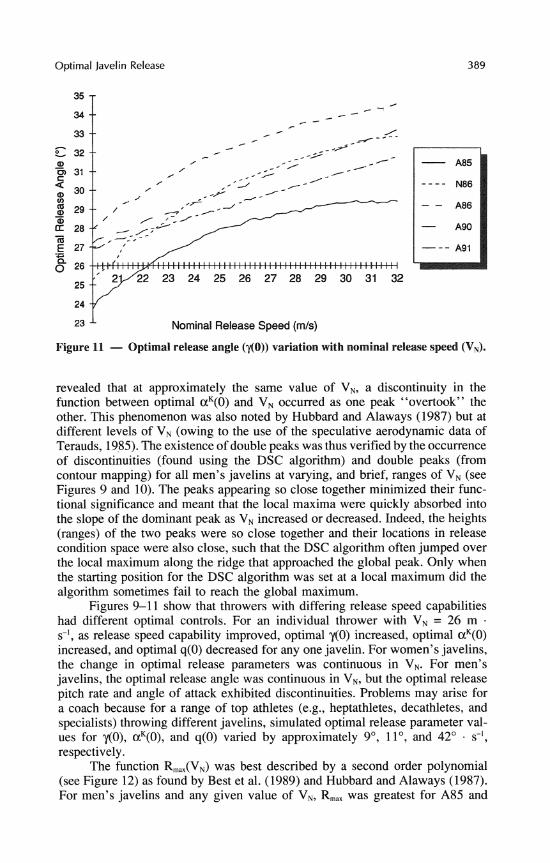
Figure 11 - Optimal release angle (y(0)) variation with nominal release speed (V,).
revealed that at approximately the same value of VN, a discontinuity in the function between optimal aK(0) and VN occurred as one peak "overtook" the other. This phenomenon was also noted by Hubbard and Alaways (1987) but at different levels of VN (owing to the use of the speculative aerodynamic data of Terauds, 1985). The existence of double peaks was thus verified by the occurrence of discontinuities (found using the DSC algorithm) and double peaks (from contour mapping) for all men's javelins at varying, and brief, ranges of VN (see Figures 9 and 10). The peaks appearing so close together minimized their func- tional significance and meant that the local maxima were quickly absorbed into the slope of the dominant peak as VN increased or decreased. Indeed, the heights (ranges) of the two peaks were so close together and their locations in release condition space were also close, such that the DSC algorithm often jumped over the local maximum along the ridge that approached the global peak. Only when the starting position for the DSC algorithm was set at a local maximum did the algorithm sometimes fail to reach the global maximum.
Figures 9-1 1 show that throwers with differing release speed capabilities had different optimal controls. For an individual thrower with VN = 26 m . s-', as release speed capability improved, optimal y(0) increased, optimal aK(0) increased, and optimal q(0) decreased for any one javelin. For women's javelins, the change in optimal release parameters was continuous in VN. For men's javelins, the optimal release angle was continuous in VN, but the optimal release pitch rate and angle of attack exhibited discontinuities. Problems may arise for a coach because for a range of top athletes (e.g., heptathletes, decathletes, and specialists) throwing different javelins, simulated optimal release parameter val- ues for y(O), aK(0), and q(0) varied by approximately 9", 1 lo , and 42" . s-I, respectively.
The function Rmax(VN) was best described by a second order polynomial (see Figure 12) as found by Best et al. (1989) and Hubbard and Alaways (1987). For men's javelins and any given value of VN, Rmax was greatest for A85 and

Best, Bartlcft, and Sawyer
40 Nominal Release Speed (mls)
Figure 12 - Maximum range variation with nominal release speed (VN).
smallest for A86. Indeed, simulations showed that N86 could be thrown around 3.5 m further than A86, and A85 was capable of traveling about 11 m further than A86 for a top thrower with VN = 30 m . S-I. The increase in R,,, capability was accompanied by flat landings associated with the center of pressure position relative to the center of mass, H(a). Similar results were found for the women's javelins. A91 was simulated to travel about 2 m farther and land flatter than A90 at VN = 28 m . s-I. This was also directly related to H(a) and was in direct conflict with the IAAF's desired outcome from the 1991 rule change. A more positive H(a) profile for any given javelin (within the range of implements used here) was associated with a greater range potential and flat landings.
Probably the most important variable in javelin throwing is the nominal release speed, VN. A thrower with a higher VN always has the capability of throwing a given javelin farther than throwers with lower nominal release speeds. This is evident in Figure 12, which shows the variation in maximum range (for optimal release conditions) with nominal release speed. The sensitivity of maximum range to nominal release speed (aR,,/aVN) is approximately 5.5 ml m . s-' at VN values around the 30 m . s-' achieved by elite male throwers.
Figure 8 showed that the shape of the hill top was essentially quadratic and tended toward a plateau rather than a sharp peak as Equation 4 equality was approached. Analysis of the hill allows great insight into the complexity of coaching. For a thrower with near-optimal release parameters, the sensitivity of R to small changes in release parameter values is small (i.e., dR/dx E 0). However, as the conditions move away from the optimal, at least one variable (xi) will have a ~R/axi that is relatively large; note that for any given value of, for example, aK(0) there will be values of q(0) and $0) where dR/aq(O) = aR/wO) = 0. For example, a thrower with q(0) = 0" . s-', aK(0) = -go, and y(0) = 33.5" (see Figure 8) would find that small variations in $0) had little effect on R (aR/ay<O) n 0 m/", even though y(0) is not optimal), while small variations in aK(0) have larger effects on R (aR/aaK(0) = 0.25 mI0). A thrower with optimal aK(0) but

Optimal Javelin Release 391
nonoptimaly(0) (e.g., aK(0) = -4.8" and $0) > 35"; see Figure 8), may find that both aRlay(0) and aR/aaK(0) are relatively large (for example, around 1 m/" and 0.5 m/", respectively, at y(0) = 40"; outside the scope of Figure 8). Only by looking at the contour map would a coach or scientist know that only $0) was nonoptimal. Further complexity arises when considering various sets of release parameters, each of which produce the same range. For example, for a thrower with VN = 30 m - s-I, z(0) = 1.8 m, q(0) = 0" . s-', and the Nemeth javelin all of the following parameter sets produced a range close to 86 m: $0) = 30°, aK(0) = -20"; $0) = 30°, aK(0) = 22"; $0) = 24", aK(0) = -7"; $0) = 40°, aK(0) = 6".
The difference in maximum range (for optimal release) between throwers with nominal release speeds of 28 and 30 m . s-' is about 11 m. This is an important, if somewhat obvious, confirmation that throwers with very different maximum range capabilities can, in some circumstances, throw the same distance.
The differences between the results of this study and those of Hubbard (1984), Hubbard and Alaways (1987), Best and Bartlett (1988a, 1989), and Best et al. (1989) are probably due to the use of erroneous or speculative aerodynamic data in those studies (see Figures 2 and 7). The differences between the results of this study and those of Soong (1982) and Qian (1989) are additionally influ- enced by their failure to account for the function VK(0) = f[VN, $0)]. This meant that both of those authors assumed throwers were capable of throwing at the same maximum speed at all $0) (i.e., speedlangle sensitivity of 0 m . s-'P instead of -0.13 m - s-'/" as used in this study) and presented optimal $0) values approaching 40".
The preceding discussion has implications for sport biomechanics research since most activities incorporate a performance index to be optimized, with a large number of interacting independent variables. Much sport biomechanics research reports information that details "how the subject performed." It is speculative to infer from this information how a performer should change his or her technique, when nothing is known about the location of the analyzed perfor- mance on the n-dimensional surface which represents that performer. Only via sensitivity analysis can objective directions to improving performance be defined. The preceding analysis is still limited by the lack of information about independent variable interactions except VK(0) = f[VN, y(O)], which is probably the most important. It is recommended that research be conducted to establish other inter- and intraindividual functional relationships between other release parameters. Further research is needed to assess whether a three-dimensional model of javelin flight is needed and to optimize the application of computer simulations for use in the field, as developed by Hubbard and Alaways (1989).
Simulation Evaluation
Simulation evaluation was considered especially relevant to this study because of the large discrepancies between the simulation results presented here and those in the previous literature. Simulation evaluation is needed to verify simulation results and to evaluate the importance of factors not included in the model (for example, nonzero angles of yaw). After all, the ultimate justification for accepting the results of computer simulations is their accurate representation of the real

392 Best, Bartlett, and Sawyer
world. Further evaluation of other aspects of the modeling and simulation would appear necessary because of the use of aerodynamic data from a nonspinning, nonvibrating javelin. To ensure experimental control of the release conditions, we intended to build a javelin firing device (ballista) that was capable of repeated throws with the same measurable release parameters, capable of controlling all two-dimensional release parameters used in javelin flight simulation, and capable of manipulating each release parameter within the range of values associated with the event. Although this device was fully designed, factors of cost and time meant that its construction had to be abandoned.
Instead, a limited simulation evaluation was performed using the results of the study of the best throws at the World Student Games in Sheffield in 1991 (Best, Bartlett, & Morriss, 1993). The results, for example Table 3, showed the release angle of yaw, PK(0), to generally have a small, negative value. For all but one of the nine throws analyzed (for the men in particular, these were mostly of very high standard), the velocity vector of the javelin grip was directed to the left of the horizontal plane projection of the javelin; that is, the throwers were throwing somewhat across, not along, the javelin's long axis (see Best et al., 1993). This observation was neither noted nor commented upon in the earlier literature on the event, and its importance with respect to the aerodynamics of javelin flight is worthy of further investigation. The nonzero values of the angle of yaw will probably also be related to the vibration of the javelin. Also, owing to the spin about the long axis of the javelin imparted at release, nonzero yaw angles will also cause Robbins-Magnus effects during flight. Again, these factors are worthy of further investigation.
The wind conditions were not measured by Best et al. (1993), and thus the velocity vector of the javelin relative to the air could not be determined. If similar, nonzero angles of yaw existed with respect to the velocity vector of the javelin relative to the air, then a further evaluation would be needed of the use of the two-dimensional model for simulations of throws such as the ones reported here. However, as pointed out earlier, it could not be concluded simply from measured nonzero angles of yaw at release that these were optimal.
Further simulation evaluation was undertaken by comparing the predictions of simulations using measured values of the release parameters for thrower M1
Table 3 Some Important Release Parameter Values and Comparisons of Simulated Distances With Those Thrown
Range Sim. dist. Throw/(D= VK(0) y(0) aK(0) PK(0) (sim) d(0) (m) Ds= Difference distancelm) ( m d ) (degrees) (degrees) (degrees) R/m (m) R-d(0) D-Ds
Note. Release values from Best et al. (1993) and Bartlett and Momss (1991).

Optimal Javelin Release 393
(for whom the type of javelin thrown was known) with the throws recorded. The comparisons are also summarized in Table 3. A major problem with this approach relates, of course, to measurement errors in the release parameters. Nonetheless, it can be seen that discrepancies between the measured throw distances and the simulated throw distances based on measured release parameters and allowing for the distance of the javelin from the foul line at release, d(O), are within k 2.5 m. That the discrepancies are both negative and positive might support their being caused by uncertainties in measured release parameter values (see, for example, Bartlett & Payton, 1991). Systematic differences would be more prob- able for model errors, such as the 10 to 15% higher simulated ranges reported by Hubbard and Alaways (1987) (compared with Best & Bartlett, 1988b) when using the speculative aerodynamic data of Terauds (1985) in their simulation model. Although the range values from three throws are insufficient to fully evaluate the simulations presented in this paper, they do provide encouraging support to the accuracy of the simulations and wind tunnel measurements.
References
Bartlett, R.M., & Best, R.J. (1988). The biomechanics of javelin throwing: A review. Journal of Sports Sciences, 6, 1-38.
Bartlett, R.M., & Momss, C.J. (1991). Biomechanical analysis of the javelin throw. In R.M. Bartlett (Ed.), Report on the AAAIWAAA National Championships. Alsager, UK: Amateur Athletic Association (AAA)/Women's Amateur Athletic Association (WAAA).
Bartlett, R.M., & Payton, C.J. (1991). Evaluating and reporting errors in biomechanical data and their possible effects. Journal of Sports Sciences, 9, 393-394.
Best, R.J., & Bartlett, R.M. (1988a). Aerodynamic characteristics of new rules javelins. In Biomechanics in sport (pp. 33-40). London: Mechanical Engineering Publications.
Best, R.J., & Bartlett, R.M. (1988b). Computer flight simulation of the men's new rules javelin. In G. de Groot, A.P. Hollander, P.A. Huijing, & G.J. van Ingen Schenau (Ms.), Biomechanics XI-B (pp. 588-594). Amsterdam: Free University Press.
Best, R.J., & Bartlett, R.M. (1989). Ladies javelin: Aerodynamics, flight simulation and biomechanical considerations. In E. Tsarouchas, J. Terauds, B.A. Gowitzke, & L.E. Holt (Eds.), Biomechanics in sports V (pp. 88-103). Athens: Hellenic Sports Re- search Institute.
Best, R.J., Bartlett, R.M., & Momss, C.J. (1993). A three-dimensional analysis of javelin throwing technique at the 1991 World Student Games. Journal of Sports Sciences, 11, 315-328.
Best, R.J., Bartlett, R.M., & Sawyer, R.A. (1989). Computer predicted optimal release characteristics for varying ability female javelin throwers. In R.J. Gregor, R.F. Zernicke, & W.C. Whiting (Ms.), Proceedings of the XII International Congress of Biomechanics (p. 270). Los Angeles: UCLA.
Best, R.J., Bartlett, R.M., & Sawyer, R.A. (1990). Javelin flight simulation-interactive software for research and coaches. In M. Nosek, D. Sojka, W.E. Morrison, & P.
' Susanka (Eds.), Proceedings of the VIII International Symposium of the Sociery of Biomechanics in Sports (pp. 279-286). Prague: Conex.
Box, M.J., Davies, D., & Swann, W.H. (1969). Non-linear optimization techniques. Edin- burgh: Oliver and Boyd.

394 Best, Bartlett, and Sawyer
Burden, R.L., & Faires, J.D. (1989). Numerical analysis. Boston: PWS-Kent. Cai, Q. (1983). Measured aerodynamic forces and geometric parameters of javelins.
Beijing: Institute of Aerodynamics, TN. Clarke, D. (1987). Scigraf and regress: Graph plotting and curve fitting programs for
the BBC microcomputer. Chichester, UK: Wiley. Gad-el-Hak, M., & Ho, C.-M. (1986). Unsteady flow around an ogive cylinder. Journal
of Aircraft, 23, 520-528. Goldstein, S. (1965). Modern developments in fluid dynamics. New York: Dover. Hayes, G.J. (1970). Numerical approximation tofunctions and data. London: The Athlone
Press. Hopkin, H.R. (1966). A scheme of notation and nomenclature for aircraft dynamics and
associated aerodynamics (RAE [Royal Aircraft Establishment] Technical Report 66200). Farnborough, UK: RAE.
Hubbard, M. (1984). Optimal javelin trajectories. Journal of Biomechanics, 17, 777-787. Hubbard, M., & Alaways, L.W. (1987). Optimal release conditions for the new rules
javelin. International Journal of Sport Biomechanics, 3, 207-221. Hubbard, M., & Alaways, L.W. (1989). Rapid and accurate estimation of release conditions
in the javelin throw. Journal of Biomechanics, 22, 583-595. Hubbard, M., & Rust, H.J. (1984). Simulation of javelin flight using experimental aero-
dynamic data. Journal of Biomechanics, 17, 769-776. Jia, Q. (1987). Experimental research on centre of pressure of the slender body with two
pointed ends. Acta Aerodynamics Sinica (Chinese), 5, 82-87. Jia, Q. (1989). Aerodynamics and throwing analysis of javelin. In Proceedings of the
Fourth Asian Congress of Fluid Mechanics, Hong Kong, August 19-23. Kunz, H.R. (1974). Effects of ball mass and movement pattern on release velocity in
throwing. In R.C. Nelson & C.A. Morehouse (Eds.), Biomechanics IV (pp. 163- 168). Baltimore: University Park Press.
Press, W.H., Flannery, B.P., Teukolsky, S.A., & Vetterling, W.T. (1989). Numerical recipes: The art of scientific computing. Cambridge, UK. University Press.
Qian, W. (1989). A study of optimal initial conditions for javelin performance under new rules. Journal of the Chinese Sports Science Society (Chinese), 9, 30-35.
Red, W.E., & Zogaib, A.J. (1977). Javelin dynamics including body interaction. Journal of Applied Mechanics, 44, 496-497.
Royal Aeronautical Society. (1967). Engineering sciences data unit (ESDU) aeronautical series (Item numbers 67001,67002,67003 and 67037). London: Royal Aeronautical Society.
Sewell, G. (1988). Plotting contour surfaces of a function of three variables. ACM Trans- actions on Mathematical Software, 14, 33-41.
Soong, T-C. (1982). Biomechanical analyses and applications of shot put and discus and javelin throws. In D.N. Ghista (Ed.), Human body dynamics: Impact, occupational and athletic aspects (pp. 462-497). Oxford, UK: Clarendon Press.
Terauds, J. (1972). A comparative analysis of the aerodynamic and ballistic characteristics of competition javelins. Unpublished doctoral dissertation, University of Maryland, Baltimore.
Terauds, J. (1985). Biomechanics of the javelin throw. Del Mar, CA: Academic Publishers. Viitasalo, J.T., & Korjus, T. (1988). On-line measurement of kinematic characteristics in
javelin throwing. In G. de Groot, A.P. Hollander, P.A. Huijing, & G.J. van Ingen Schenau (Eds.), Biomechanics XI-B (pp. 583-587). Amsterdam: Free University Press.