optimal hedging under price, quantity and exchange rate uncertainty
TRANSCRIPT
Optimal Hedging Under Price, Quantity and Exchange Rate Uncertainty
Moyo C. Kamgaing *
Abstract: This paper derives an optimal hedging strategy for a primary pro- ducer under price, quantity and exchange rate uncertainty. In this model, it is assumed that the producer is a mean-variance maximizer with an exponential utility function. The derived optimal hedge ratio for the commodity is pro- portional to the coefficient of the commodity futures prices bias in a linear regression where revenue uncertainty is the dependent variable. This ratio differs from the result that would have been obtained under price-quantity uncertainty when revenues are significantly correlated with the exchange rate variability, thereby suggesting that the foreign exchange risk is relevant only when the commodity exposure is unhedged.
The model is empirically tested using C6te-d'1voire7 Ghana and Nigeria as cocoa producers and the US Dollar and the French Franc as currencies of numeraire to hedge UK Pound revenues. The resulting cocoa hedge ratios range from 78 to 57 percent. For Ghana and the C6te-d'Ivoire7 there is little corre- lation between revenue and exchange rate variability. Therefore, the cocoa ratio is not significantly affected by the introduction of this additional source of uncertainty and the currency ratio in the joint hedge is trivial for both the dollar and the franc. Nigeria's revenues are correlated to the dollar and the cocoa ratio is de facto lowered by the currency effect in a joint cocoa-dollar hedge.
Rkmmk: Cet article presente un modele de couverture optimale a terme contre les risques conjoints de prix, de quantite et de change pour un producteur de matieres premieres dont l'objectif est de maximiser ses revenus. Le taux de couverture optimal est proportionnel au coeficent obtenu dans une regression simple des revenus ou le biais des prix a terme est la variable independente. Ce taux ne direre de celui obtenu dans un modele d'incertitude prix-quantite que lorsque l'incertitude de quantite est correlee a celle de change. Ceci suggere a contrario qu'une couverture optimale du risque des prix de matieres premieres permet en meme temps de parer au risque de change.
Un test empirique du modele est applique au cacao, avec la CBte-d'Ivoire, le Ghana et le Nigeria comme producteurs et le franc francais et le dollar US
* The author, a graduate from the Sloan School of Management at the Massuchusetts Institute of Technology, is Associate in the Africa Merchant Banking Group with Ban- kers Trust Company. The author wishes to thank the editor and the referees for their useful comments. This paper is a revised version of the author's Masters' Thesis at MIT (1986).
0 1989 by African Development Bank / Banque africaine de developpement
REVUE AFRICAINE DE D~VELOPPEMENT 109
comme monnaie en risque par rapport a la livre UK. Les taux de couverture obtenus sont de 78 a 57 %. La faible relation entre les incertitudes de change et de revenus pour le Ghana et la C6te-d'Ivoire affectent relativement peu le taux de couverture du cacao par rapport au modele oh les seuls risques sont le prix et la quantite et le taux de couverture de la devise est trivial. I1 n'en est pas de meme pour le Nigeria a cause d'une correlation plus forte entre ses revenus et le dollar.
Introduction
The economic dependence of many Developing Countries (DC's) on a single major export and their limited control over the value-added chain for their exports is probably the most important source of external shock as highlighted by the debt crisis of the eighties. The purpose of this paper is to focus on one aspect of this issue namely the management of commodities price risk toward repayment of foreign currency denominated liabilities.
Whereas a large number of hedging decisions are made in a context where the only source of uncertainty is the price, in many other cases, uncertainty extends to quantity. The hedging pattern changes dramatically for a primary producer. Should the producer sell all his expected output forward at the then prevailing futures prices and production come below expectations, his end-of-period wealth may be greater or lower depending on how spot prices have moved relative to the initial futures prices. If they are higher, the producer will incur a loss on the settlement of the futures contract. The foreign exchange is an additional dimension in the analysis when the producer's currency of numeraire (i.e. reflecting the real economic exposure) is different from that of the proceeds of the forward sale of the commodity.
Earlier studies on the benefits of hedging focused on macro-economic factors such as income stabilization. McKinnon (1 980) concluded that futures prices impacted on optimal hedge ratios in so far as their year to year variations did not exceed that of cash prices l . However, there is an economic rationale for erratic cash and futures prices: unexpected increases in production can depress spot relative to futures prices because it is this dynamic which will allow merchants to sustain holding buffer stocks. Also, and even more importantly, the main determinant of the hedge ratio is not the total variability in prices but rather that part of the observed uncertainty that deviates from the producer's anticipa- tions. Subsequent papers introduced this contribution of modern porfolio analysis in models in which either price only as in Peck (1975) or both price and quantity as in Rolfo ( 1980) were the sources of uncertainty. The latter derived and empirically tested two models in a domestic context and obtained ratios that were substantially lower than unity for the world's four largest cocoa producers. The most important finding of this work is the analytic support to
* See McKinnon ( 1 967).
110 AFRICAN DEVELOPMENT REVIEW
the intuition that with uncertain output, the producer is likely not to hedge the total amount of his expected output in order to protect himself in the unfavor- able state of the world where his crop falls short of expectations and spot prices are high 2.
The focus of the hedging decision on a country’s perspective and the link between commodity revenues and debt service add some specificity to the analysis. First, the foreign exchange dimension is extremely important because futures prices are quoted in a different currency than those of most DCs. Also, the approach taken supposes a more comprehensive appraisal of the producer’s economic exposure. Namely, declining dollar coffee prices reduce the produc- er’s ability to keep real domestic prices constant. However, the constraint would be less severe if the country trades mostly with France and the French Franc has depreciated enough against the dollar to more than offset the decline in coffee revenues.
This paper advocates hedging via forward sales as a strategy for a DC to handle uncertainty on commodity revenues. The hedging horizon is limited to the short-term where futures prices essentially serve two purposes. First, they provide the producer with valuable information on the future course of com- modity prices and form a basis for forecasts 3. Second, they provide an efficient and rather inexpensive mechanism for risk transfer from merchants to specu- lators. The first section of this paper indicates the methodology and sets up a model for a primary producer who faces output, price and exchange rate uncertainty. In the second and third sections, the model is empirically tested using data from the cocoa markets and the test results are analyzed in the last section. Cocoa has been chosen because it has one of the highest price and quantity volatilities among primary commodities ; it is largely produced by DCs and cocoa prices are to a large extent determined by market forces. Since African cocoa is mostly sold in reference to the UK pound, the currencies selected to test the model are the French Franc and the US Dollar because the latter has allegedly been pointed at as the major source of the DC‘s problem while the currency of one of the countries involved in this analysis (C6te- d‘Ivoire) is directly pegged to the former.
Model
This paper derives an optimal hedge ratio for a primary producer subject to price, quantity and exchange rate uncertainty. In order to set up the model, a few assumptions must be made regarding the producer’s risk behaviour. The quadratic chosen is a mean-variance function obtained by combining an expon-
See Rolfo (1 980). At a certain level of the producer’s risk parameter, reverse hedging
See Black (1 976) and Parsons ( 1985). becomes optimal.
REVUE AFRICAINE DE D~VELOPPEMENT 1 1 1
ential utility function and normally distributed returns 4. The producer faces total output uncertainty from such unexpected factors as tree diseases or bad climatic conditions arising between the time the production decision is made and the beginning of the marketing season. For this uncertainty to take full effect, we assume that there is no buffer stock - or that the yearly variations in stocks over the covered period are not significant, which is not too strict an assumption since cocoa is a perishable commodity. As a simplifiing paradigm, the production cycle is divided into two periods. Before harvest, all three variables are uncertain. The uncertainty is resolved at the harvest.
We make a distinction is between the price distribution on the physical market @, and the price distribution on the futures market pl. Hedging n, commodity futures contracts and n2 futures contracts on a give_n_currency will enable the producer to change his revenue distribution from PQ to:
where Q is the output distribution,fi the futures cocoa price prevailing before harvest, f2 the futures exchange rate and fi2 the price distribution on the cur- rency futures market.
The rationale is that the producer sells short a fraction nl of its output at a futures pricefi, virtually becoming long the currency (pound) in which the forward sale is denominated and then simultaneously buys n2 units of currency X at the futures ratef2. In this definition of the random end-of-period income, nl has the dimension of expected output Q while n2 has the dimension of expected revenues FQ. The difference betweenx and Pi has a positive sign because the producer benefits if the futures price that he agreed upon turns out to exceed the price distribution at maturity. The expected utility as a function of expected income and variance of income can be defined as :
E[ U( W)] = E( W) - m [var( W)] (2)
where E (.) denotes the expected value operator and m the risk aversion para- meter. Ifwe combine equation (1) and (2) and following the two usual first-order conditions dEIU(W)]/dnl = 0 and dE[U(W)]/dn2 = 0, we have:
and
An exponential utility function assumes that the trade-off between income and variance of income is independent from expected income and that the risk parameter is proportional to the producer’s risk aversion.
112 AFRICAN DEVELOPMENT REVIEW
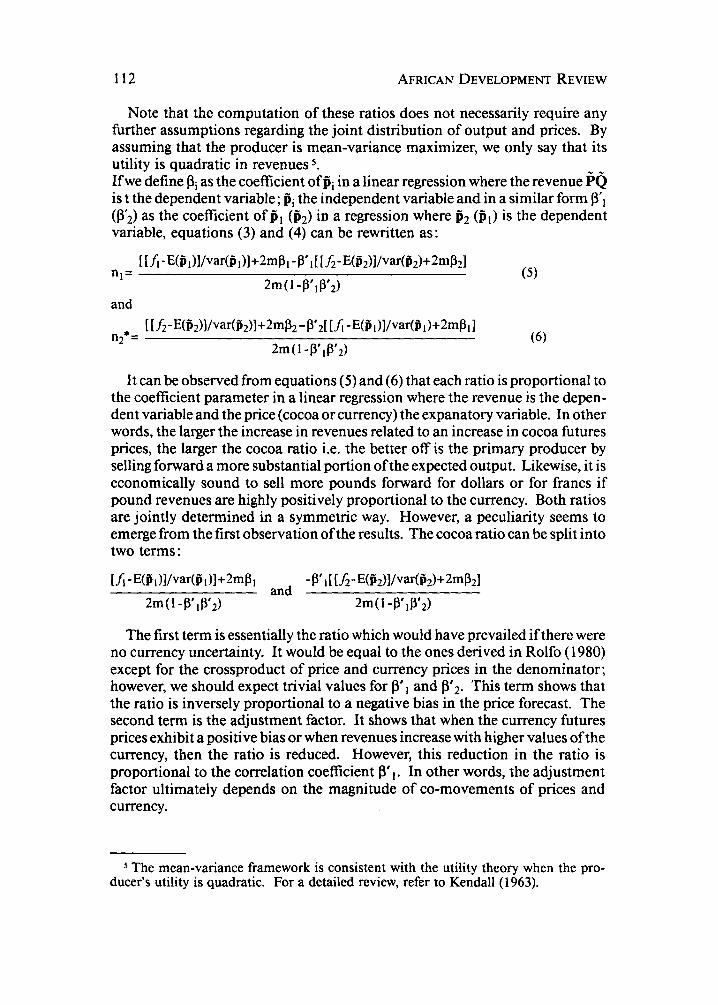
Note that the computation of these ratios does not necessarily require any further assumptions regarding the joint distribution of output and prices. By assuming that the producer is mean-variance maximizer, we only say that its utility is quadratic in revenues 5.
If we define pi as the coefficient of Di in a linear regression where the revenue @Q is t the dependent variable; Dj the independent variable and in a similar form p', (p;) as the coefficient of a, (B2) in a regression where fi2 (bl) is the dependent variable, equations (3) and (4) can be rewritten as:
n l = ( 5 ) I r fi -E(al)l/var(B1)1+2mP1- P' 1 [ [fi-E(P2)l/var(l2)+2mP21
2m(l -P'd3'2) and
I [fi -E(Bz)l/var(a2)1+2mP2 -P'2[ [h -E(Pl)l/var(B1)+2mPIl
2m(l 'P'IP'2) n2*= (6)
It can be observed from equations (5) and (6) that each ratio is proportional to the coefficient parameter in a linear regression where the revenue is the depen- dent variable and the price (cocoa or currency) the expanatory variable. In other words, the larger the increase in revenues related to an increase in cocoa futures prices, the larger the cocoa ratio i.e. the better off is the primary producer by selling forward a more substantial portion of the expected output. Likewise, it is economically sound to sell more pounds forward for dollars or for francs if pound revenues are highly positively proportional to the currency. Both ratios are jointly determined in a symmetric way. However, a peculiarity seems to emerge from the first observation of the results. The cocoa ratio can be split into two terms:
r f i -WB1 )l/var(P1)1+2mP1 -P'd [fi-E(B2)I/var(B2)+2mP21 and
2m(l-P81P'2) 2m(l-P',P'2)
The first term is essentially the ratio which would have prevailed if there were no currency uncertainty. It would be equal to the ones derived in Rolfo (1980) except for the crossproduct of price and currency prices in the denominator; however, we should expect trivial values for p'] and p'2. This term shows that the ratio is inversely proportional to a negative bias in the price forecast. The second term is the adjustment factor. It shows that when the currency futures prices exhibit a positive bias or when revenues increase with higher values ofthe currency, then the ratio is reduced. However, this reduction in the ratio is proportional to the correlation coefficient p',. In other words, the adjustment factor ultimately depends on the magnitude of co-movements of prices and currency.
The mean-variance framework is consistent with the utility theory when the pro- ducer's utility is quadratic. For a detailed review, refer to Kendall ( 1 963).
REVUE AFRICAINE DE DEVELOPPEMENT 113
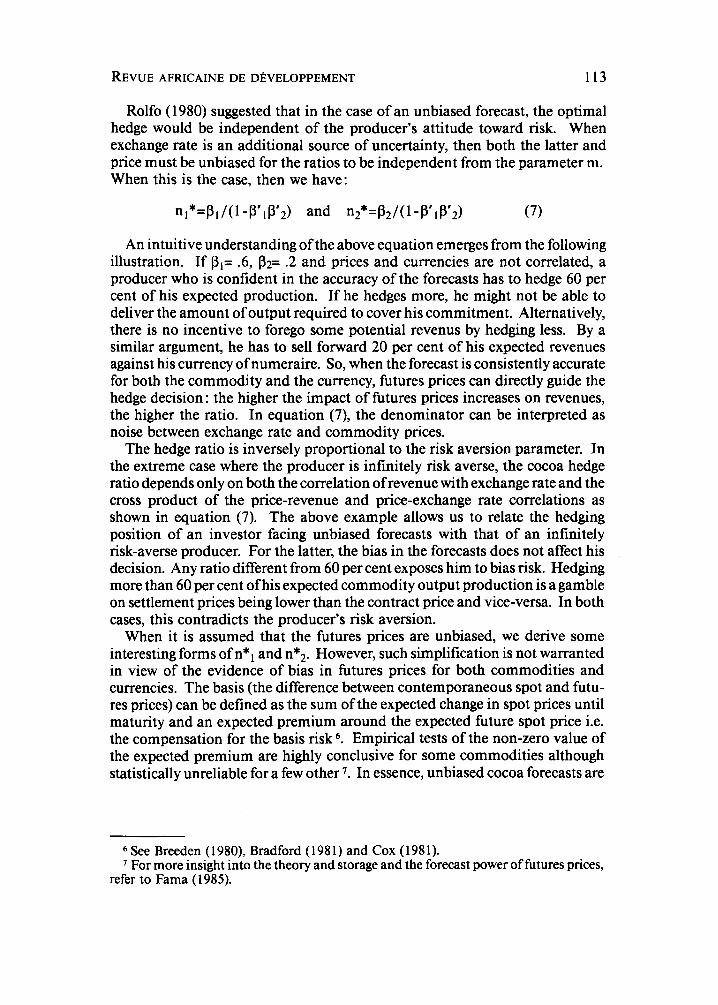
Rolfo (1 980) suggested that in the case of an unbiased forecast, the optimal hedge would be independent of the producer's attitude toward risk. When exchange rate is an additional source of uncertainty, then both the latter and price must be unbiased for the ratios to be independent from the parameter m. When this is the case, then we have:
An intuitive understanding of the above equation emerges from the following illustration. If pl= A, p2= .2 and prices and currencies are not correlated, a producer who is confident in the accuracy of the forecasts has to hedge 60 per cent of his expected production. If he hedges more, he might not be able to deliver the amount of output required to cover his commitment. Alternatively, there is no incentive to forego some potential revenus by hedging less. By a similar argument, he has to sell forward 20 per cent of his expected revenues against his currency of numeraire. So, when the forecast is consistently accurate for both the commodity and the currency, futures prices can directly guide the hedge decision : the higher the impact of futures prices increases on revenues, the higher the ratio. In equation (7), the denominator can be interpreted as noise between exchange rate and commodity prices.
The hedge ratio is inversely proportional to the risk aversion parameter. In the extreme case where the producer is infinitely risk averse, the cocoa hedge ratio depends only on both the correlation of revenue with exchange rate and the cross product of the price-revenue and price-exchange rate correlations as shown in equation (7). The above example allows us to relate the hedging position of an investor facing unbiased forecasts with that of an infinitely risk-averse producer. For the latter, the bias in the forecasts does not affect his decision. Any ratio different from 60 per cent exposes him to bias risk. Hedging more than 60 per cent of his expected commodity output production is a gamble on settlement prices being lower than the contract price and vice-versa. In both cases, this contradicts the producer's risk aversion.
When it is assumed that the futures prices are unbiased, we derive some interesting forms of n*l and n*2. However, such simplification is not warranted in view of the evidence of bias in futures prices for both commodities and currencies. The basis (the difference between contemporaneous spot and futu- res prices) can be defined as the sum of the expected change in spot prices until maturity and an expected premium around the expected future spot price i.e. the compensation for the basis risk 6. Empirical tests of the non-zero value of the expected premium are highly conclusive for some commodities although statistically unreliable for a few other 7. In essence, unbiased cocoa forecasts are
See Breeden ( 1980), Bradford (1 98 1 ) and Cox ( 1 98 1). For more insight into the theory and storage and the forecast power of futures prices,
refer to Fama (1985).
114 AFRICAN DEVELOPMENT REVIEW
most unlikely on an expected basis. As far as currency is concerned, substantial evidence based on empirical testing of the Unbiased Expectations Hypothesis shows that currency futures prices are biased; for Korajczyk (1985), the pre- mium generally included in the basis is equal to the expected real return dif- ferential across different currencies. Nevertheless, equations (7) suggest that, if the covariance of the producer’s revenue with the exchange rate is large, but the exchange rate is very volatile relative to the pound, then the ratio of cocoa hedged would be substantially reduced, as compared to the results obtained in Rolfo ( 1980).
Empirical Data
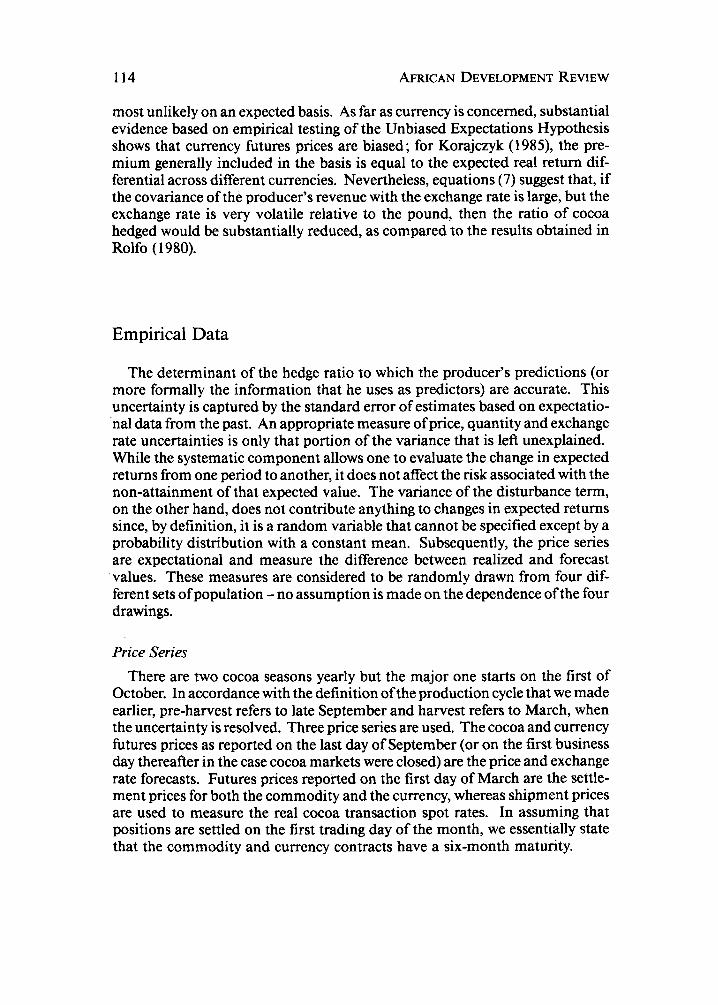
The determinant of the hedge ratio to which the producer’s predictions (or more formally the information that he uses as predictors) are accurate. This uncertainty is captured by the standard error of estimates based on expectatio- nal data from the past. An appropriate measure of price, quantity and exchange rate uncertainties is only that portion of the variance that is left unexplained. While the systematic component allows one to evaluate the change in expected returns from one period to another, it does not affect the risk associated with the non-attainment of that expected value. The variance of the disturbance term, on the other hand, does not contribute anything to changes in expected returns since, by definition, it is a random variable that cannot be specified except by a probability distribution with a constant mean. Subsequently, the price series are expectational and measure the difference between realized and forecast values. These measures are considered to be randomly drawn from four dif- ferent sets of population - no assumption is made on the dependence of the four drawings.
Price Series There are two cocoa seasons yearly but the major one starts on the first of
October. In accordance with the definition of the production cycle that we made earlier, pre-harvest refers to late September and harvest refers to March, when the uncertainty is resolved. Three price series are used. The cocoa and currency futures prices as reported on the last day of September (or on the first business day thereafter in the case cocoa markets were closed) are the price and exchange rate forecasts. Futures prices reported on the first day of March are the settle- ment prices for both the commodity and the currency, whereas shipment prices are used to measure the real cocoa transaction spot rates. In assuming that positions are settled on the first trading day of the month, we essentially state that the commodity and currency contracts have a six-month maturity.
REVUE AFRICAINE DE DEVELOPPEMENT 115
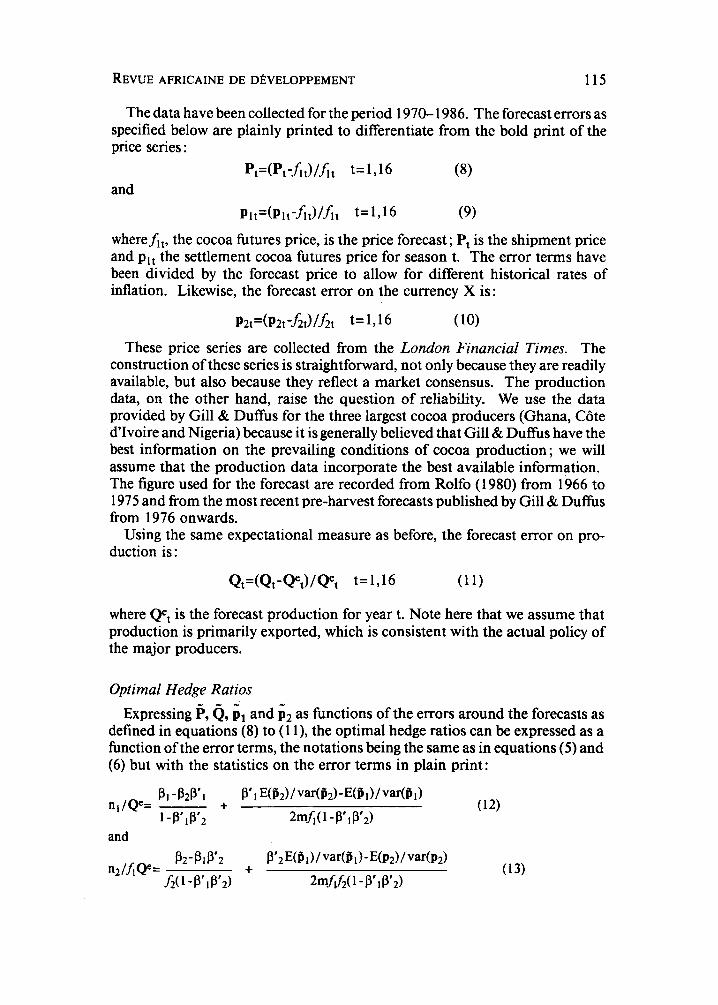
The data have been collected for the period 1970- 1986. The forecast errors as specified below are plainly printed to differentiate from the bold print of the price series :
and Pt=(Pt -A t) lh t t = 1 3 1 6 (8)
PI t=(P I t -h t)/h t t= 1316 (9)
wheref,,, the cocoa futures price, is the price forecast ; Pt is the shipment price and plt the settlement cocoa futures price for season t. The error terms have been divided by the forecast price to allow for different historical rates of inflation. Likewise, the forecast error on the currency X is:
P2t=(P2t-ht)lht t=1,16 (10)
These price series are collected from the London Financial Times. The construction of these series is straightforward, not only because they are readily available, but also because they reflect a market consensus. The production data, on the other hand, raise the question of reliability. We use the data provided by Gill & Duffus for the three largest cocoa producers (Ghana, C6te d'Ivoire and Nigeria) because it is generally believed that Gill & Duffus have the best information on the prevailing conditions of cocoa production ; we will assume that the production data incorporate the best available information. The figure used for the forecast are recorded from Rolfo (1980) from 1966 to 1975 and from the most recent pre-harvest forecasts published by Gill & Duffus from 1976 onwards.
Using the same expectational measure as before, the forecast error on pro- duction is :
where Qet is the forecast production for year t. Note here that we assume that production is primarily exported, which is consistent with the actual policy of the major producers.
Optimal Hedge Ratios Expressing fi, Q, PI and p2 as functions of the errors around the forecasts as
defined in equations (8) to (1 l), the optimal hedge ratios can be expressed as a function of the error terms, the notations being the same as in equations (5) and (6) but with the statistics on the error terms in plain print:
and
116 AFRICAN DEVELOPMENT REVIEW
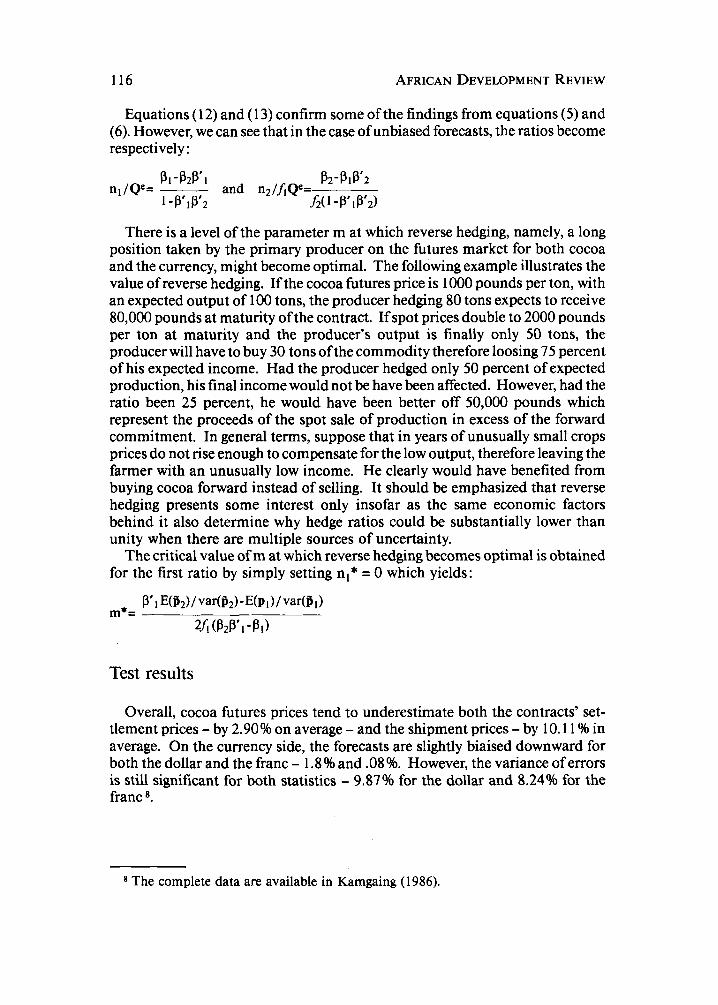
Equations (1 2) and (1 3) confirm some of the findings from equations (5) and (6). However, we can see that in the case ofunbiased forecasts, the ratios become respectively :
P2-P1p'2
fic 1 - P' 1 P'2) and n2/JQe=
P I -P2V 1
1 -P'1P'2 ni/Qe=
There is a level of the parameter m at which reverse hedging, namely, a long position taken by the primary producer on the futures market for both cocoa and the currency, might become optimal. The following example illustrates the value of reverse hedging. If the cocoa futures price is 1000 pounds per ton, with an expected output of 100 tons, the producer hedging 80 tons expects to receive 80,000 pounds at maturity of the contract. If spot prices double to 2000 pounds per ton at maturity and the producer's output is finally only 50 tons, the producer will have to buy 30 tons ofthe commodity therefore loosing 75 percent of his expected income. Had the producer hedged only 50 percent of expected production, his final income would not be have been affected. However, had the ratio been 25 percent, he would have been better off 50,000 pounds which represent the proceeds of the spot sale of production in excess of the forward commitment. In general terms, suppose that in years of unusually small crops prices do not rise enough to compensate for the low output, therefore leaving the farmer with an unusually low income. He clearly would have benefited from buying cocoa forward instead of selling. It should be emphasized that reverse hedging presents some interest only insofar as the same economic factors behind it also determine why hedge ratios could be substantially lower than unity when there are multiple sources of uncertainty.
The critical value of m at which reverse hedging becomes optimal is obtained for the first ratio by simply setting nl* = 0 which yields:
Test results
Overall, cocoa futures prices tend to underestimate both the contracts' set- tlement prices - by 2.90 % on average - and the shipment prices - by 10.1 1 % in average. On the currency side, the forecasts are slightly biaised downward for both the dollar and the franc - 1.8 % and .08 %. However, the variance of errors is still significant for both statistics - 9.87% for the dollar and 8.24% for the franc 8.
The complete data are available in Karngaing (1986).
REVUE AFRICAINE DE DBVELOPPEMENT 117
Production
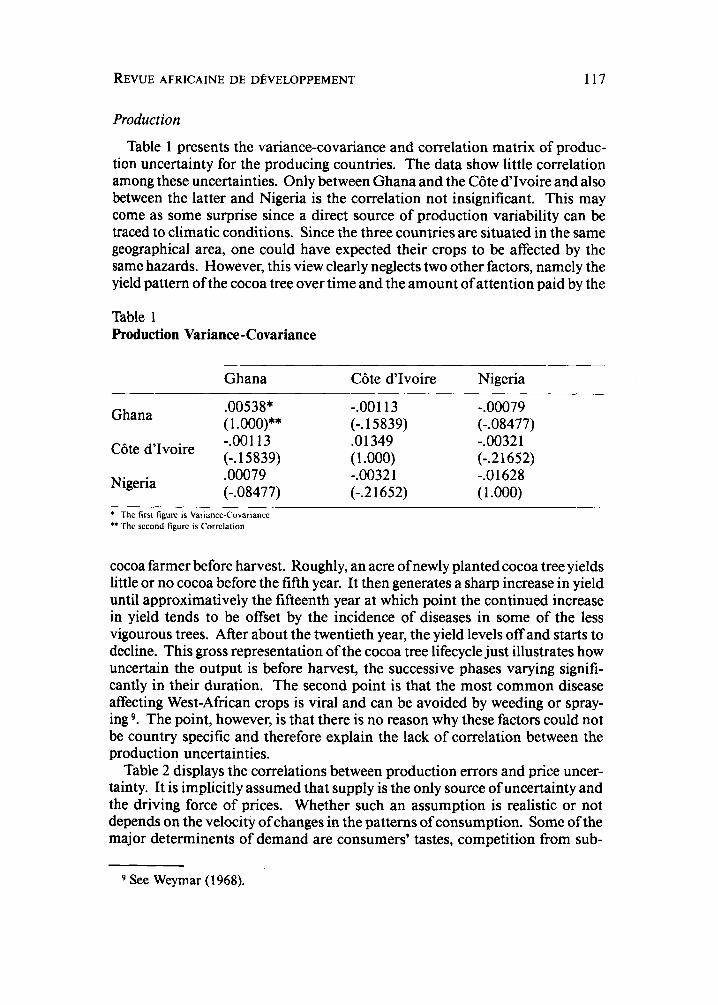
Table 1 presents the variance-covariance and correlation matrix of produc- tion uncertainty for the producing countries. The data show little correlation among these uncertainties. Only between Ghana and the C6te d'Ivoire and also between the latter and Nigeria is the correlation not insignificant. This may come as some surprise since a direct source of production variability can be traced to climatic conditions. Since the three countries are situated in the same geographical area, one could have expected their crops to be affected by the same hazards. However, this view clearly neglects two other factors, namely the yield pattern of the cocoa tree over time and the amount of attention paid by the
Table 1 Production Variance-Covariance
Ghana C6te d'Ivoire Nigeria
.00538* -.00113 -.00079 (1 .OOO)** (-. 15839) (-.08477) -.OO 1 1 3 .01349 -.0032 1 (-. 15839) (1 .OOO) (-.2 1652) .00079 -.0032 1 -.O 1628
Ghana
C6te d'Ivoire
Nigeria (-.08477) (-.2 1652) ( 1 .OOO) * ** The second figurc is Correlation
The Rrsc figurc is Variance-Covariance
cocoa farmer before harvest. Roughly, an acre of newly planted cocoa tree yields little or no cocoa before the fifth year. It then generates a sharp increase in yield until approximatively the fifteenth year at which point the continued increase in yield tends to be offset by the incidence of diseases in some of the less vigourous trees. After about the twentieth year, the yield levels off and starts to decline. This gross representation of the cocoa tree lifecycle just illustrates how uncertain the output is before harvest, the successive phases varying signifi- cantly in their duration. The second point is that the most common disease affecting West-African crops is viral and can be avoided by weeding or spray- ing g. The point, however, is that there is no reason why these factors could not be country specific and therefore explain the lack of correlation between the production uncertainties.
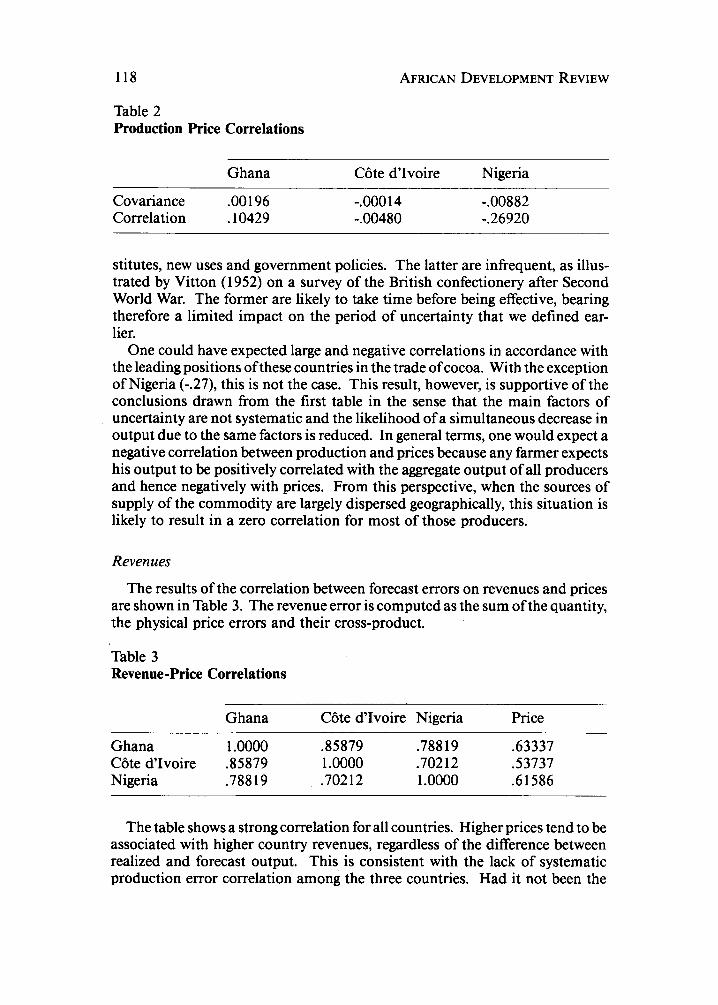
Table 2 displays the correlations between production errors and price uncer- tainty. It is implicitly assumed that supply is the only source of uncertainty and the driving force of prices. Whether such an assumption is realistic or not depends on the velocity of changes in the patterns of consumption. Some of the major determinents of demand are consumers' tastes, competition from sub-
See Weymar (1 968).
118 AFRICAN DEVELOPMENT REVIEW
Table 2 Production Price Correlations
Ghana C6te d'lvoire Nigeria
Covariance .00196 -.OOO 14 -.00882 Correlation .lo429 -.00480 -.26920
stitutes, new uses and government policies. The latter are infrequent, as illus- trated by Vitton (1 952) on a survey of the British confectionery after Second World War. The former are likely to take time before being effective, bearing therefore a limited impact on the period of uncertainty that we defined ear- lier.
One could have expected large and negative correlations in accordance with the leading positions of these countries in the trade of cocoa. With the exception of Nigeria (-.27), this is not the case. This result, however, is supportive of the conclusions drawn from the first table in the sense that the main factors of uncertainty are not systematic and the likelihood of a simultaneous decrease in output due to the same factors is reduced. In general terms, one would expect a negative correlation between production and prices because any farmer expects his output to be positively correlated with the aggregate output of all producers and hence negatively with prices. From this perspective, when the sources of supply of the commodity are largely dispersed geographically, this situation is likely to result in a zero correlation for most of those producers.
Revenues
The results of the correlation between forecast errors on revenues and prices are shown in Table 3. The revenue error is computed as the sum of the quantity, the physical price errors and their cross-product.
Table 3 Revenue-Price Correlations
Ghana C6te d'Ivoire Nigeria Price
Ghana 1 .oooo .85879 .78819 .63337 C6te d'Ivoire .85879 1 .oooo .70212 .53737 Nigeria .78819 .70212 1 .oooo .61586
The table shows a strong correlation for all countries. Higher prices tend to be associated with higher country revenues, regardless of the difference between realized and forecast output. This is consistent with the lack of systematic production error correlation among the three countries. Had it not been the
REVUE AFRICAINE DE D~VELOPPEMENT 119
case, the co-movements of production would have had an impact on prices because the three countries account for most of the world production. This effect in turn would have signified a lower correlation between revenues and price uncertainties. The regional revenues are also strongly correlated, the highest correlation existing between the two countries sharing a common border (A6 for the CBte d’Ivoire and Ghana).
Exchange rates
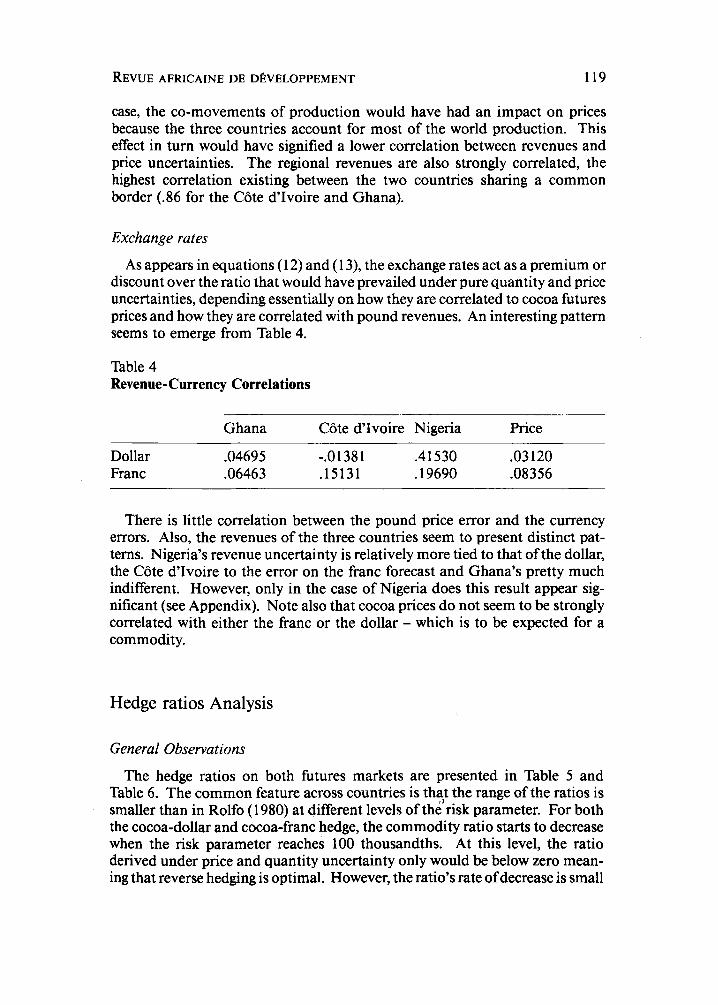
As appears in equations (1 2) and ( 13), the exchange rates act as a premium or discount over the ratio that would have prevailed under pure quantity and price uncertainties, depending essentially on how they are correlated to cocoa futures prices and how they are correlated with pound revenues. An interesting pattern seems to emerge from Table 4.
Table 4 Revenue-Currency Correlations
~~~ ~ ~ ~~
Ghana CBte d‘Ivoire Nigeria Price
Dollar -04695 -.01381 .41530 .03 120 Franc .06463 .15131 .19690 .08356
There is little correlation between the pound price error and the currency errors. Also, the revenues of the three countries seem to present distinct pat- terns. Nigeria’s revenue uncertainty is relatively more tied to that of the dollar, the CBte d‘Ivoire to the error on the franc forecast and Ghana’s pretty much indifferent. However, only in the case of Nigeria does this result appear sig- nificant (see Appendix). Note also that cocoa prices do not seem to be strongly correlated with either the franc or the dollar - which is to be expected for a commodity.
Hedge ratios Analysis
General Observations
The hedge ratios on both futures markets are presented in Table 5 and Table 6. The common feature across countries is that the range of the ratios is smaller than in Rolfo (1 980) at different levels of the’risk parameter. For both the cocoa-dollar and cocoa-franc hedge, the commodity ratio starts to decrease when the risk parameter reaches 100 thousandths. At this level, the ratio derived under price and quantity uncertainty only would be below zero mean- ing that reverse hedging is optimal. However, the ratio’s rate of decrease is small
120 AFRICAN DEVELOPMENT REVIEW
Table 5 Ratios for Cocoa-Dollar Hedge
m Ghana C6te d'Ivoire Nigeria
.oooooo 10 .7591
.00000005 .7477
.00000002 .7 136
.ooooooo 1 .6567
(.0223)
(.O)
(-.0671)
(-. 1789)
.72 18
.7161
.699 1
.6707
(-.0669)
(-.078 1)
(-.1116)
(-. 1675)
.6495 (-5587) .6346 (.5293) .5898 (.4412) .5151 (.2943)
* First figure IS Cocoa Ratio ** second figure IS Dollar Ratio
Table 6 Ratios for Cocoa-Franc Hedge
m Ghana C6te d'Ivoire Nigeria
.00000010 .7584 .708 1 .6490
.00000005 .7465 .7022 .6334
.ooooooo 1 -6514 .6546 .5083
(.0032) (.0323) (.0360)
(.0032) (.0323) (.0360)
(.0032) (.0323) (.0360) First figure is Cocoa Ratio
** Second figure LS Franc Ratio
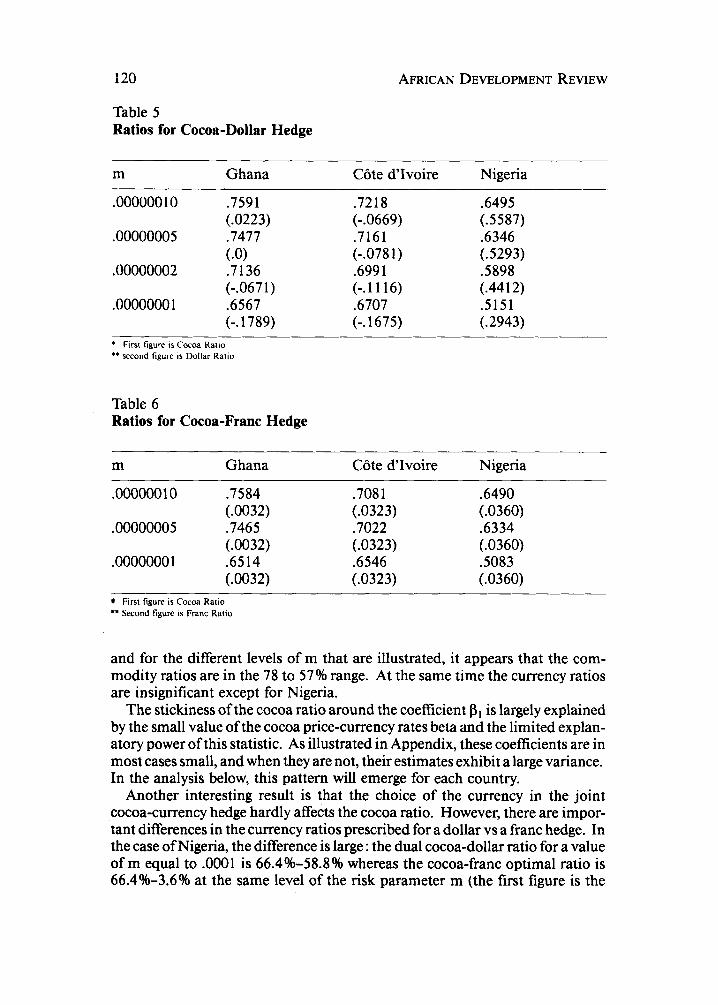
and for the different levels of m that are illustrated, it appears that the com- modity ratios are in the 78 to 57% range. At the same time the currency ratios are insignificant except for Nigeria.
The stickiness of the cocoa ratio around the coefficient f.3, is largely explained by the small value of the cocoa price-currency rates beta and the limited explan- atory power of this statistic. As illustrated in Appendix, these coefficients are in most cases small, and when they are not, their estimates exhibit a large variance. In the analysis below, this pattern will emerge for each country.
Another interesting result is that the choice of the currency in the joint cocoa-currency hedge hardly affects the cocoa ratio. However, there are impor- tant differences in the currency ratios prescribed for a dollar vs a franc hedge. In the case of Nigeria, the difference is large : the dual cocoa-dollar ratio for a value of m equal to .0001 is 66.4%-58.8% whereas the cocoa-franc optimal ratio is 66.4%-3.6% at the same level of the risk parameter m (the first figure is the
REVUE AFRICAINE DE DEVELOPPEMENT 121
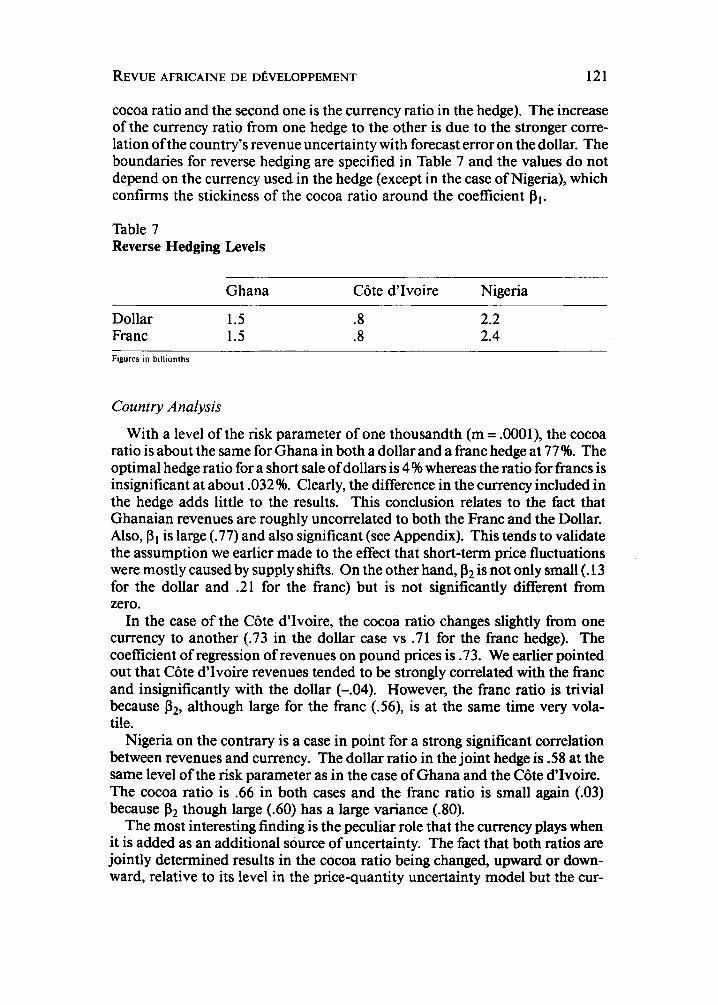
cocoa ratio and the second one is the currency ratio in the hedge). The increase of the currency ratio from one hedge to the other is due to the stronger corre- lation ofthe country's revenue uncertainty with forecast error on the dollar. The boundaries for reverse hedging are specified in Table 7 and the values do not depend on the currency used in the hedge (except in the case of Nigeria), which confirms the stickiness of the cocoa ratio around the coefficient PI.
Table 7 Reverse Hedging Levels
Ghana C6te d'Ivoire Nigeria
Dollar 1.5 .8 2.2 Franc 1.5 .8 2.4 Figures in billionths
Country Analysis
With a level of the risk parameter of one thousandth (m = .0001), the cocoa ratio is about the same for Ghana in both a dollar and a franc hedge at 77%. The optimal hedge ratio for a short sale of dollars is 4 % whereas the ratio for francs is insignificant at about .032%. Clearly, the difference in the currency included in the hedge adds little to the results. This conclusion relates to the fact that Ghanaian revenues are roughly uncorrelated to both the Franc and the Dollar. Also, P I is large (.77) and also significant (see Appendix). This tends to validate the assumption we earlier made to the effect that short-term price fluctuations were mostly caused by supply shifts. On the other hand, p2 is not only small (. 13 for the dollar and .21 for the franc) but is not significantly different from zero.
In the case of the C6te d'Ivoire, the cocoa ratio changes slightly from one currency to another (.73 in the dollar case vs .71 for the franc hedge). The coefficient of regression of revenues on pound prices is .73. We earlier pointed out that CGte d'Ivoire revenues tended to be strongly correlated with the franc and insignificantly with the dollar (-.04). However, the franc ratio is trivial because p2, although large for the franc (.56), is at the same time very vola- tile.
Nigeria on the contrary is a case in point for a strong significant correlation between revenues and currency. The dollar ratio in the joint hedge is -58 at the same level of the risk parameter as in the case of Ghana and the Ciite d'Ivoire. The cocoa ratio is .66 in both cases and the franc ratio is small again (.03) because P2 though large (.60) has a large variance (.80).
The most interesting finding is the peculiar role that the currency plays when it is added as an additional source of uncertainty. The fact that both ratios are jointly determined results in the cocoa ratio being changed, upward or down- ward, relative to its level in the price-quantity uncertainty model but the cur-
122 AFRICAN DEVELOPMENT REVIEW
rency ratio is almost equal to zero. In essence, it seems that the cocoa ratio alone captures the impact of the currency of the hedging strategy (except in the case of Nigeria).
Conclusion
The optimal cocoa hedge ratios derived for the three countries chosen for the empirical test of the model show little difference with the values that they would have taken under price and quantity uncertainty only. Furthermore, this cocoa ratio does not change with the currency assigned in the joint hedge (US. dollar or French Franc). This characteristic can be explained by the relative impor- tance of the correlation between revenues and futures prices over the correlation of revenues with exchange rates. As a matter of fact, with the exception of Nigeria, the latter correlation has been weak or insignificant. This lack of correlation between revenues and exchange rates has led to trivial values of the currency ratio in the hedge in both cases. Only Nigeria exhibits a strong currency ratio in a cocoa-dollar hedge.
The ratios are extremely dependent on the quality of the data used to derive them. Market sources were relied upon as future prices predictors when they were available. Production forecasts were obtained from the most largely recognized specialist of the cocoa market. But the difference in the cocoa ratios as compared to prior derivations highlights another important issue, namely the sensitivity of the results to the sample from which the empirical data is constructed. The lower sensitivity of the cocoa ratio to changes in the level of the risk parameter are explained by the lower value of the forecast bias in our sample the effect ofwhich is to reduce the impact ofthe adjustment factor on the final value of the hedge ratio.
Overall, the results of the analysis are limited by the constraints of the model itself. With a one period model, futures prices are assumed to guide the hedging decision. It follows that if they are to be used in order for commodity revenues to back debt service, then the debt issuance decision should be endogeneous to the hedging scheme. However, a country’s borrowing needs cannot depend only on their one-period expected income. With the exception of revolving facilities and other types of short-term financing the existence of which are contingent on some form of immediate performance, borrowing generally implies a scheduled stream of future payments, stretching far after the maturity ofthe longest futures contracts traded today. Since there are no long horizon commodity futures contracts currently traded in an organized and centralized fashion, which could be used as price predictors 10, it appears that hedging with today’s contracts only will be of limited value when it comes to long-term debt management and that alternative approaches and analytical tools must be developed for this problem te be fully addressed.
lo Parsons (1 985) argues that one of the implicit benefits of countertrade is the price- setting mechanisms on long-term contracts when futures prices are not available for reference.
AFRICAN DEVELOPMENT REVIEW 123
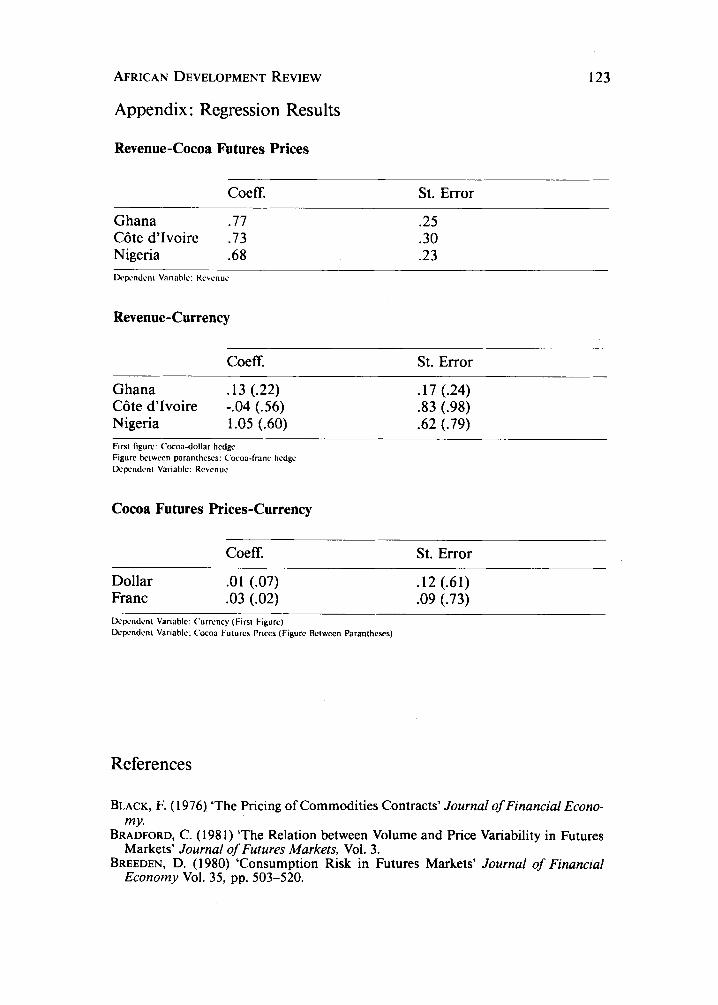
Appendix : Regression Results
Revenue-Cocoa Futures Prices
~ ~~~
Coeff. St. Error
Ghana .77 .25 C6te d’Ivoire .73 .30 Nigeria .68 .23 Ikpcndcnl Vai iahlc: Kcvcnuc
Revenue-Currency
Coeff. St. Error
Ghana .13 (.22) .17 (.24) CBte d’Ivoire -.04 (.56) .83 (.98) Nigeria 1.05 (.60) -62 (.79) First figure Cocoa-dollar hcdgc Figurc bcrwccn paranthcscs: Cocoa-franc hcdgc Ikpcndcnl Variable: Kcvcnuc
Cocoa Futures Prices-Currency
Coeff. St. Error
Dollar .01 (.07) .12 (.61) Franc .03 (.02) .09 (.73) Dcpcndrnt Variable: Currency (Firs1 Flgurc) Dcpcndcni Variahlc: Cocoa Futures Prices (Figurc Bctwccn Paranthcses)
References
BLACK, F. ( 1 976) ‘The Pricing of Commodities Contracts’ Journal of Financial Econo-
BRADFORD, C. ( 1 98 1) ‘The Relation between Volume and Price Variability in Futures
BREEDEN, D. ( 1 980) ‘Consumption Risk in Futures Markets’ Journal of Financial
my.
Markets’ Journal of Futures Markets, Vol. 3.
Economy Vol. 35, pp. 503-520.
124 AFRICAN DEVELOPMENT REVIEW
Cox, J. ; INGERSOLL, J. ; Ross, S. (1 98 1) ‘Relation between Forward prices and Futures Prices’ Journal of Financial Economy Vol. 9, pp. 321-346.
FAMA, E. ; FRENCH, K, (1 985) ‘Commodity Futures Prices : Some Evidence on Forecast Power, Premium and the Theory of Storage’ Wl? No. 128 University of Chicago.
KAMGAING, M. (1986) ‘Optimal Hedging Under Price, Quantity and Exchange Rate Uncertainty’ MIT Press Sloan School of Management. KENDALL, M.; STUART A. (1963) ‘The Advanced Theory of Statistics, Vol. 1’ Hafner Publishing Co.
KORAJCZYK, K. (1985) ‘The Pricing of Forward Contracts for Foreign Exchange’ Journal of Political Economy, vol. 93.
MCKINNON, R. (1 967) ‘Futures Markets, Buffer stocks and Income instability for Pri- mary Producers’ Journal of Political Economy, pp. 844-86 1 .
PARSONS J. (1 985) ‘A Theory of Countertrade Financing of International Business’ Wl?
PECK, A. (1975) ‘Hedging and Income Stability: Concepts, Implications and an Exam-
ROLFO, J. (1980) ‘Optimal Hedging under Price and Quantity Uncertainty’ Journal of
VITTON, A. (1952) ‘Economic Aspects of Cocoa Consumption’ FA0 Studies in Agricul-
WEYMAR, F. (1968) ‘The Dynamics of World Cocoa Markets’ MZT Press.
NO. 1632-85, MIT
ple’ Journal of Agricultural Economics pp. 4 10-4 19.
Political Economy, vol. 88.
tural Economics and Statistics.