optical fingerprinting in medical microbiology; fransisca maria willemse – erix geboren te...
TRANSCRIPT
1
Optical fingerprinting in medical microbiology;
Raman spectroscopy as a bacterial typing tool
Diana Willemse - Erix
2
ISBN: 978-94-6169-134-7 ©H.F.M. Willemse–Erix, 2011 All rights reserved. No part of this thesis may be reproduced or transmitted in any form or by means without prior permission of the author, or where appropriate, the publisher ot the articles. Cover design: Diana Willemse-Erix Layout and printing: Optima Grafische Comminicatie, Rotterdam, The Netherlands
3
Optical fingerprinting in medical microbiology; Raman spectroscopy as a bacterial typing tool
Het gebruik van optische vingerafdukken in de medische microbiologie;
Raman spectroscopie als bacteriële typerings methode
Proefschrift
Ter verkrijging van de graad van doctor aan de Erasmus Universiteit Rotterdam
op gezag van de rector magnificus Prof.dr. H.G. Schmidt
en volgens besluit van het College van Promoties.
De openbare verdediging zal plaatsvinden op
donderdag 10 november 2011 om 11.30 uur
door
Hendrina Fransisca Maria Willemse – Erix
Geboren te Oosterhout
4
Promotiecommissie Promotor: Prof.dr.dr. A. van Belkum Overige leden: Prof.dr. H. P. Endtz Prof.dr. E. P. Prens Prof.dr. J. A. J. W. Kluytmans Copromotor: Dr. K. Maquelin

5
Daar komt Eduard Beer aan. Boem boem boem, komt hij op zijn kop de trap af, achter Christoffer Robin aan. Voor zover hij weet is dat de enige manier om naar beneden te komen, ook al heeft hij af en toe het gevoel dat het vast ook wel anders kan. Maar ja, dan zou hij even met dat geboem-boem moeten ophouden en er over nadenken. Maar dan denkt hij toch weer, dat het niet anders kan. In elk geval is hij nu beneden. Uit: Winnie de Poeh, A.A. Milne
6
Contents Chapter 1 General introduction and outline of the thesis Chapter 2 A novel approach to correct variations in Raman spectra due to photo- bleachable cellular components Chapter 3 Towards Raman-based epidemiological typing of Pseudomonas aeruginosa Chapter 4 Rapid identification of Mycobacteria by Raman spectroscopy Chapter 5 Optical fingerprinting in bacterial epidemiology: Raman spectroscopy as a real-time typing method. Chapter 6 Proof of principle for successful characterization of methicillin- resistant coagulase-negative Staphylococci isolated from skin by use of Raman spectroscopy and Pulsed-Field Gel Electrophoresis Chapter 7 Reliable and easy typing scheme for Enterococcus faecium isolates based on Raman spectroscopy. Chapter 8 Rapid typing of multidrug resistant Escherichia coli and Klebsiella pneumoniae isolates using SpectraCell RA®
Chapter 9 Summarizing discussion Chapter 10 Nederlandse samenvatting Appendices Dankwoord Curriculum Vitae List of publications PhD portfolio
7
Chapter 1 General introduction
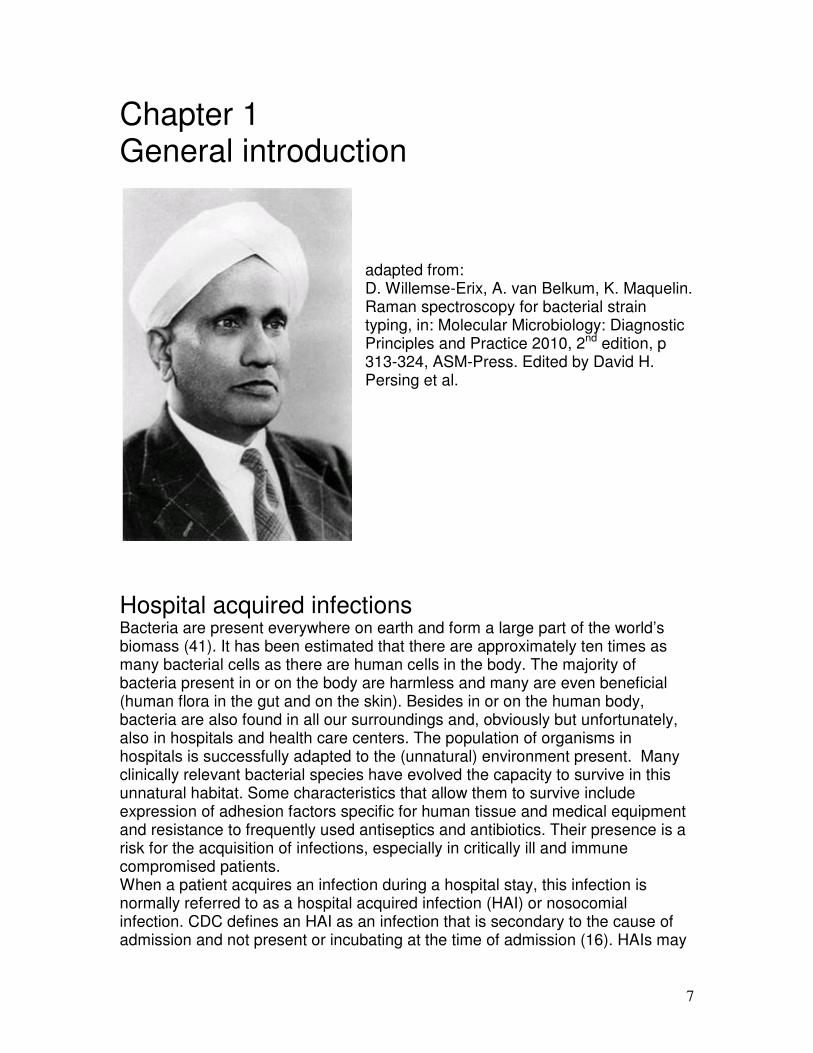
adapted from: D. Willemse-Erix, A. van Belkum, K. Maquelin. Raman spectroscopy for bacterial strain typing, in: Molecular Microbiology: Diagnostic Principles and Practice 2010, 2nd edition, p 313-324, ASM-Press. Edited by David H. Persing et al.
Hospital acquired infections Bacteria are present everywhere on earth and form a large part of the world’s biomass (41). It has been estimated that there are approximately ten times as many bacterial cells as there are human cells in the body. The majority of bacteria present in or on the body are harmless and many are even beneficial (human flora in the gut and on the skin). Besides in or on the human body, bacteria are also found in all our surroundings and, obviously but unfortunately, also in hospitals and health care centers. The population of organisms in hospitals is successfully adapted to the (unnatural) environment present. Many clinically relevant bacterial species have evolved the capacity to survive in this unnatural habitat. Some characteristics that allow them to survive include expression of adhesion factors specific for human tissue and medical equipment and resistance to frequently used antiseptics and antibiotics. Their presence is a risk for the acquisition of infections, especially in critically ill and immune compromised patients. When a patient acquires an infection during a hospital stay, this infection is normally referred to as a hospital acquired infection (HAI) or nosocomial infection. CDC defines an HAI as an infection that is secondary to the cause of admission and not present or incubating at the time of admission (16). HAIs may

8
be caused by infectious agents from endogenous sources (body sites such as skin, nose, and gastrointestinal tract) or exogenous sources (medical devices, health care personnel, other patients or the environment). It has been described that up to 10% of patients admitted to hospitals and long-term care facilities develop an infection while hospitalized and incidences up to 30% have been reported for intensive care units (13, 18, 36, 40). The most frequent types of HAI are urinary-tract infections, surgical-wound infections, pneumonia, and bloodstream infections (18). Most of the nosocomial urinary infections are due to the use of urethral catheters, while the use of indwelling vascular catheters is the main cause of bloodstream infections (37). Disruption of the skin barrier during surgery is a major risk for the development of a surgical-wound infection, and is associated with the number of bacteria present in the wound at surgery and other risk factors including bacterial carriage. Pneumonia is most prevalent in intensive care units and associated with intubation and mechanical ventilation. The high frequency of HAIs is a significant problem throughout the world as they are a major cause of morbidity, mortality and excess healthcare costs (11, 18, 34). HAIs are associated with prolonged hospital stay, delayed wound healing and increased exposure to antimicrobial therapy. Due to the extra use of antibiotics for treatment or prevention of infections, HAIs also contribute to the emergence and spread of antibiotic-resistant organisms. Furthermore, patients infected with resistant organisms can be a source of infection for both other hospitalized patients and people in the community. According to the CDC, the overall direct medical costs associated with HAI in US hospitals ranges from $28.4 to $33.8 billion per year (www.cdc.gov). Anderson et al. performed a meta-analysis using five published studies to determine the costs for different kind of infections. They estimated the costs for surgical site infection to be $10.443 per infection. The estimated costs per infection for bloodstream infections, ventilation associated pneumonia (VAP) and catheter-associated urinary-tract infections were estimated on $23.242, $25.072 and $758 resp. (1). Prevention of HAIs requires the systematic and multidisciplinary application of an infection-control program. Such a program includes surveillance and outbreak management, but it should also include education of hospital staff on the importance of, and their role in, infection prevention. An estimated 30% of all HAIs is due to transmission and, therefore, preventable by strict maintenance of hygienic measures (15,40). The positive effect of hand washing in infection prevention was already proven in the mid nineteenth century when Holmes and Semmelweis showed the effect of hand hygiene in reducing childbirth fever (20). Since then, many studies have been performed on the effect of hand washing in hospital settings and generally accepted guidelines on hand hygiene have been published (28).
9
Other effective hygienic measures include the use of gloves, masks and protective clothing while treating or nursing patients, but also include general procedure for waste disposal and sterilization of medical equipment. More strict regulations include isolated nursing of patients who provide an increased risk of transmitting infection to other patients or staff. Finally, closing and disinfection of entire wards is one of the most rigorous procedures for the limitation of the spread of infections. Ultimately, even personal may have to be treated to eliminate carriage. Outbreak control primarily involves the early identification of potential or initiating outbreaks. Since large-scale infection transmission usually arises from a common source, the rapid detection of sources and vectors is critical to limit the spread of the outbreak organism. With the development of rapid identification and susceptibility tools, the microbiology laboratory still plays an important role in supporting and guiding outbreak control (3). The recognition of nosocomial pathogens and the detection of unexpected antimicrobial resistance patterns are initiated from within the laboratory. Active screening of patients, staff and the environment can provide information on asymptomatic carriers, environmental reservoirs and possible routes of transmission. During outbreak investigations, establishing clonal relationships between bacterial isolates (typing) is mandatory to reliably identify the source and trace the spread of a specific strain. In this way the laboratory generates useful epidemiological information on different parameters for the infection control team and as such plays a crucial role in defining the epidemiology of a HAI. Combining epidemiological information and typing results may lead to an early warning system that makes intervention possible before outbreaks occur (23). To be able to provide all this information, the laboratory needs a quick and efficient method for bacterial strain typing. A useful bacterial typing method should allow for discrimination between unrelated isolates and point out similarities amongst isolates of the same microbial strain, since this is essential for epidemiological surveillance (33, 35). Ideally, such a typing method should provide timely, actionable information. Preferably, such a method is simple to perform by a qualified technologist, should have a high throughput, a good discriminatory power (17) and should provide results that are in concordance with epidemiological and clinical data. Below several of such systems will be discussed including an assessment of their strong and weaker characteristics.
Bacterial typing Real-time typing is assumed to be beneficial since it offers the possibility of early intervention that limits the transmission of microbes and reduces the number of HAI. Multiple papers have been published that indicate the benefits of active screening combined with real-time typing. Peterson et al. describe a 23% reduction in number of patients with a nosocomial infection and a significant reduction in costs of approx. 2 million dollars annually, after the installation of molecular typing facilities in a 700-bed US hospital (27). Nulens et al. evaluated
the cost-effectiveness of an active search and destroy policy for MRSA in a Dutch hospital (26). They concluded that this policy is beneficial even in an enduring endemic situation. These findings indicatecontrol strategies are associated with significant costs, these costs are clearly less than their potential financial benefit, let alone their clinical impact. Typing can be performed by a number of phenotypic and genotypic methoddifferent levels of reproducibility and discrimination. Phenotypic typing tools such as bacteriophage typing or serotyping were developed for specific bacterial species and are not generally applicable very useful first indication of relatedness. Antibiogram typing is another firstmethod used to identify possible cases of bacterial transmission in hospitals and healthcare institutions although his method should always be confirmed using other more precise methods.In the past 20 years, phenotypic typing methods have been largely replaced by genotyping methods, such as PCR fingerprinting, Pulsed Field Gel Electrophoresis (PFGE) and Multilocus Sequence Typing (MLST). techniques compare the DNA of bactepatients are infected with the same bacterial strain.While these methods often show high discriminatory power within a specific collection, they often suffer from complexity due to speciesIn addition, these methods require highly trained individuals and special laboratory conditions to ensure quality results. In general, these techniques do not fit the standard workflow in common medical microbiology labs. A recently developed alternativspectroscopy to test subtle differences in the molecular composition of the biomass, reflecting differences in the expression of DNA and the metabolic activity of the bacteria involved. The most important advantagespectroscopy compared to established molecular typing methods are speed, high sample throughput, and easeprimers, this technique, in principle, is applicable to any species that can be cultured, even without prior knowledge of the species identity.
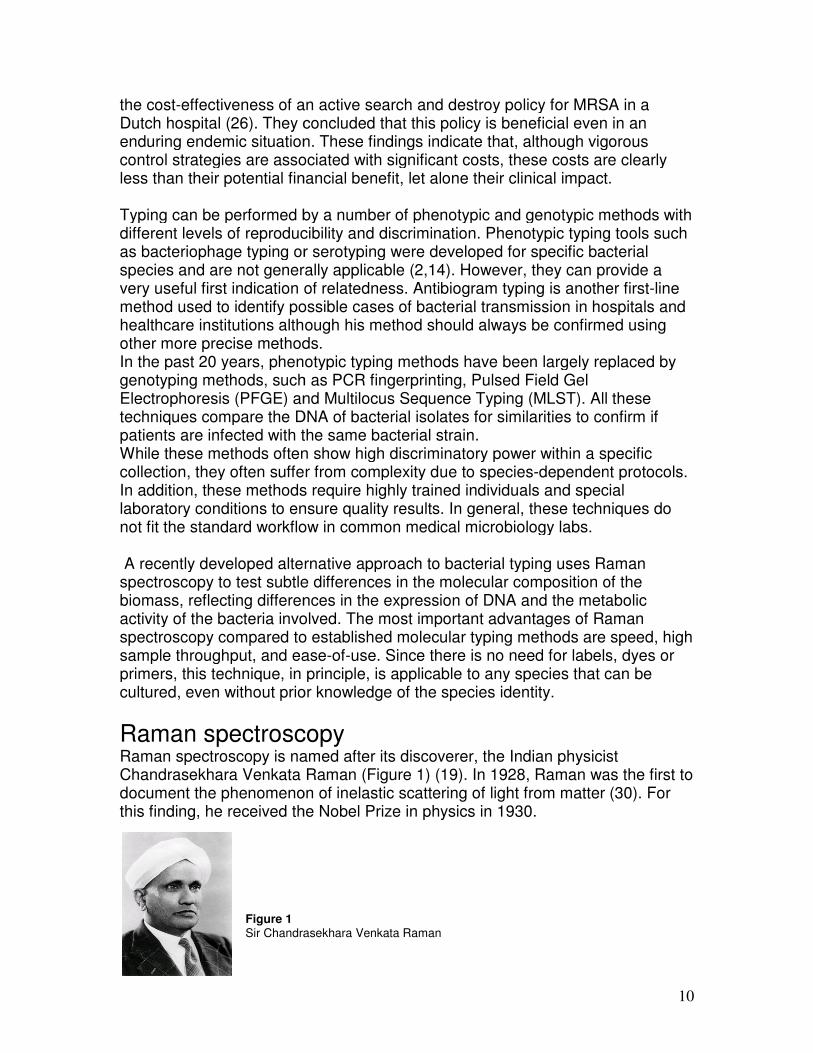
Raman spectroscopyRaman spectroscopy is named after its discoverer, the Indian physicist Chandrasekhara Venkata Raman document the phenomenon of inethis finding, he received the Nobel Prize in physics in 1930.
Figure 1 Sir Chandrasekhara Venkata Raman
effectiveness of an active search and destroy policy for MRSA in a . They concluded that this policy is beneficial even in an
enduring endemic situation. These findings indicate that, although vigorous control strategies are associated with significant costs, these costs are clearly less than their potential financial benefit, let alone their clinical impact.
Typing can be performed by a number of phenotypic and genotypic methoddifferent levels of reproducibility and discrimination. Phenotypic typing tools such as bacteriophage typing or serotyping were developed for specific bacterial species and are not generally applicable (2,14). However, they can provide a
first indication of relatedness. Antibiogram typing is another firstmethod used to identify possible cases of bacterial transmission in hospitals and healthcare institutions although his method should always be confirmed using
hods. In the past 20 years, phenotypic typing methods have been largely replaced by genotyping methods, such as PCR fingerprinting, Pulsed Field Gel Electrophoresis (PFGE) and Multilocus Sequence Typing (MLST). All these techniques compare the DNA of bacterial isolates for similarities to confirm if patients are infected with the same bacterial strain. While these methods often show high discriminatory power within a specific collection, they often suffer from complexity due to species-dependent protocols. In addition, these methods require highly trained individuals and special laboratory conditions to ensure quality results. In general, these techniques do not fit the standard workflow in common medical microbiology labs.
A recently developed alternative approach to bacterial typing uses Raman spectroscopy to test subtle differences in the molecular composition of the biomass, reflecting differences in the expression of DNA and the metabolic activity of the bacteria involved. The most important advantages of Raman spectroscopy compared to established molecular typing methods are speed, high sample throughput, and ease-of-use. Since there is no need for labels, dyes or primers, this technique, in principle, is applicable to any species that can be
, even without prior knowledge of the species identity.
Raman spectroscopy Raman spectroscopy is named after its discoverer, the Indian physicist Chandrasekhara Venkata Raman (Figure 1) (19). In 1928, Raman was the first to document the phenomenon of inelastic scattering of light from matter this finding, he received the Nobel Prize in physics in 1930.
Sir Chandrasekhara Venkata Raman
10
effectiveness of an active search and destroy policy for MRSA in a . They concluded that this policy is beneficial even in an
that, although vigorous control strategies are associated with significant costs, these costs are clearly less than their potential financial benefit, let alone their clinical impact.
Typing can be performed by a number of phenotypic and genotypic methods with different levels of reproducibility and discrimination. Phenotypic typing tools such as bacteriophage typing or serotyping were developed for specific bacterial
. However, they can provide a first indication of relatedness. Antibiogram typing is another first-line
method used to identify possible cases of bacterial transmission in hospitals and healthcare institutions although his method should always be confirmed using
In the past 20 years, phenotypic typing methods have been largely replaced by
All these rial isolates for similarities to confirm if
While these methods often show high discriminatory power within a specific dependent protocols.
In addition, these methods require highly trained individuals and special laboratory conditions to ensure quality results. In general, these techniques do
e approach to bacterial typing uses Raman spectroscopy to test subtle differences in the molecular composition of the biomass, reflecting differences in the expression of DNA and the metabolic
s of Raman spectroscopy compared to established molecular typing methods are speed, high
use. Since there is no need for labels, dyes or primers, this technique, in principle, is applicable to any species that can be
Raman spectroscopy is named after its discoverer, the Indian physicist . In 1928, Raman was the first to
lastic scattering of light from matter (30). For

11
However, it took more than 40 years before Raman spectroscopy was applied in biological sciences and microbiology. Two major technological breakthroughs were required for this to happen. The first was the invention of the laser in 1960 (12), which provided the much needed powerful monochromatic light source. Despite this breakthrough, obtaining a decent Raman spectrum still required hours of signal collection even when using highly concentrated samples in large volumes. The second major technological development essential to the advance of Raman spectroscopy was the Charge Coupled Device (CCD) invented by Boyle and Smith in 1970 (32) It took until 1987, however, before the CCD was first reported as a detector in Raman spectroscopy (9). Coinciding with these two inventions, Raman spectroscopy gained renewed interest and was increasingly applied in biological studies. Combining Raman spectroscopy with an optical microscope (Raman microspectroscopy) was first introduced by Puppels et al. in 1990 (29). The small confocal measurement volume that is used in Raman microspectroscopy allows the collection of Raman spectra from a limited amount of cells or even from a single cell (22, 38, 39). Therefore, this kind of spectroscopy is ideally suited for application in (medical) microbiology. Several other characteristics of Raman microspectroscopy render this technique suitable for application in microbiology. Preparing microbiological samples for Raman spectroscopy is a simple procedure. The culture and sample preparation protocols are very similar if not identical to the procedures used to date in diagnostic microbiology and require only a basic training level in microbiological methods. Since there is no need for specific labels, primers or dyes, the Raman-based protocols can be applied to a wide range of organisms. Initially, publications occurred on the possibilities of vibrational spectroscopy as an identification tool in microbiology (5, 6, 24, 25). One of the first studies that explored Raman spectroscopy’s potential as a typing method, was performed on Acinetobacter isolates (21). A collection of 25 outbreak isolates collected from five different hospitals in three countries was used. The Raman results obtained were similar to those based on more complex molecular laboratory techniques such as AFLP and cell surface protein profiling. This study provided a promising starting point for the development of Raman spectroscopy-based typing protocols and epidemiological studies.
Principle of Raman spectroscopy The bonds between atoms in a molecule allow them to vibrate and rotate within that molecule. When light is incident on a sample, the energy carriers in the light (photons) interact with the molecules in that sample and are scattered. This way, three types of scattering can occur: elastic Rayleigh scattering and inelastic Stokes and anti-Stokes scattering.

When there is no transfer of energy from the photon to the molecules, the energy level in the molecule is not changed. The scattered light has the same energy and wavelength as the incoming light. This process is called elasticscattering (Figure 2). A very small portion of the light (1 in 10photons), is scattered in-elastically and this process is called Raman scattering. When energy from the photon is transferred to the molecule, the molecule gains energy and enters an excited state. The energy of the scattered photon is reduced, resulting in a lower frequency and thus a longer wavelength of the scattered light compared to the incident light. This process is called Stokes Raman scattering (Figure 2). AntiStokes scattering. Energy is transferred from a molecule in a higher vibrational level to the photon. This results in a higher frequency and thus shorter wavelength of the scattered light compared to the incident light (Figure 2). normal situations (room temperature) most molecules are in the ground vibrational level, the intensity of the Stokes Raman scattering is higher than that of the anti-Stokes. Therefore, only the Stokes scattering is what measured in a Raman spectrometer.
Figure 2 Most of the incident light will be scattered from a sample with the Rayleigh scattering. A fraction of the incident light will be scattered with a slightly higher wavelength (lower wavelength (λ-∆) due to the interaction with the molecules in the sample.
en there is no transfer of energy from the photon to the molecules, the energy level in the molecule is not changed. The scattered light has the same energy and wavelength as the incoming light. This process is called elastic- or Rayleigh
A very small portion of the light (1 in 106 to 1 in 10elastically and this process is called Raman scattering.
When energy from the photon is transferred to the molecule, the molecule gains ited state. The energy of the scattered photon is
reduced, resulting in a lower frequency and thus a longer wavelength of the scattered light compared to the incident light. This process is called Stokes Raman scattering (Figure 2). Anti-stokes Raman scattering is the opposite of Stokes scattering. Energy is transferred from a molecule in a higher vibrational level to the photon. This results in a higher frequency and thus shorter wavelength of the scattered light compared to the incident light (Figure 2). normal situations (room temperature) most molecules are in the ground vibrational level, the intensity of the Stokes Raman scattering is higher than that
Stokes. Therefore, only the Stokes scattering is what measured in a
Most of the incident light will be scattered from a sample with the identical wavelength (λ), the soRayleigh scattering. A fraction of the incident light will be scattered with a slightly higher wavelength (
) due to the interaction with the molecules in the sample.
12
en there is no transfer of energy from the photon to the molecules, the energy level in the molecule is not changed. The scattered light has the same energy
or Rayleigh to 1 in 108 of the
elastically and this process is called Raman scattering. When energy from the photon is transferred to the molecule, the molecule gains
ited state. The energy of the scattered photon is reduced, resulting in a lower frequency and thus a longer wavelength of the scattered light compared to the incident light. This process is called Stokes
ering is the opposite of Stokes scattering. Energy is transferred from a molecule in a higher vibrational level to the photon. This results in a higher frequency and thus shorter wavelength of the scattered light compared to the incident light (Figure 2). In normal situations (room temperature) most molecules are in the ground vibrational level, the intensity of the Stokes Raman scattering is higher than that
Stokes. Therefore, only the Stokes scattering is what measured in a
), the so-called Rayleigh scattering. A fraction of the incident light will be scattered with a slightly higher wavelength (λ+∆) or
13
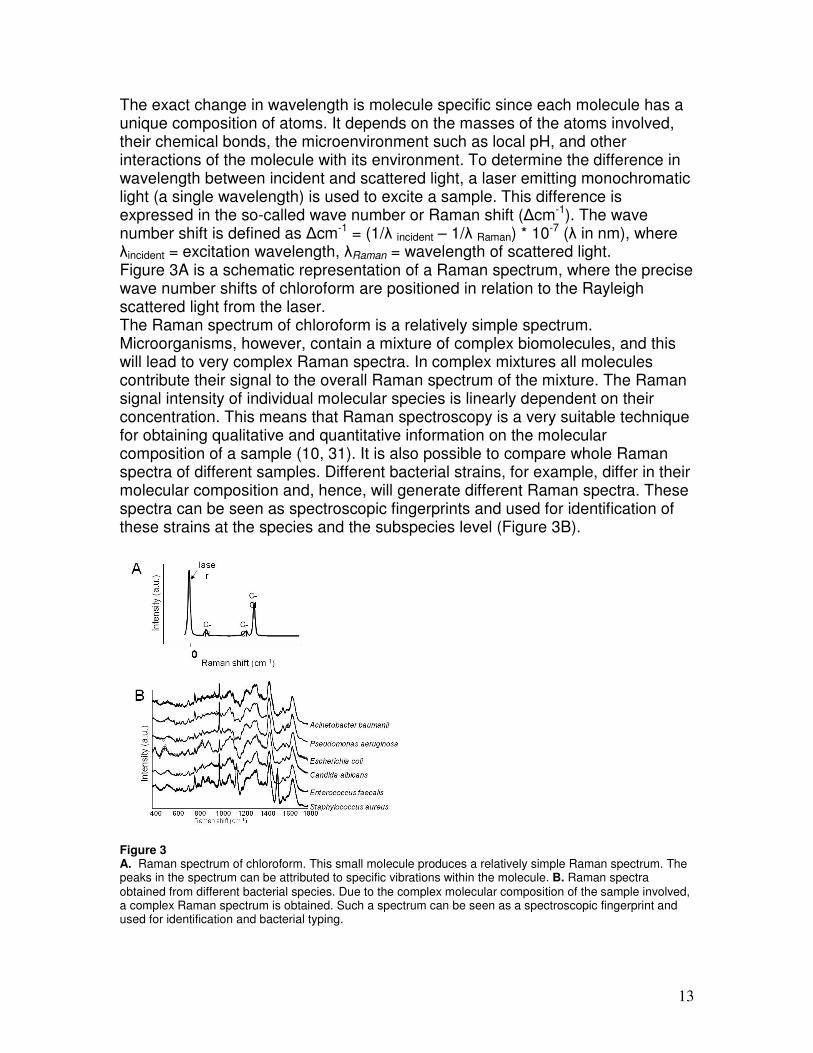
The exact change in wavelength is molecule specific since each molecule has a unique composition of atoms. It depends on the masses of the atoms involved, their chemical bonds, the microenvironment such as local pH, and other interactions of the molecule with its environment. To determine the difference in wavelength between incident and scattered light, a laser emitting monochromatic light (a single wavelength) is used to excite a sample. This difference is expressed in the so-called wave number or Raman shift (∆cm-1). The wave number shift is defined as ∆cm-1 = (1/λ incident – 1/λ Raman) * 10-7 (λ in nm), where λincident = excitation wavelength, λRaman = wavelength of scattered light. Figure 3A is a schematic representation of a Raman spectrum, where the precise wave number shifts of chloroform are positioned in relation to the Rayleigh scattered light from the laser. The Raman spectrum of chloroform is a relatively simple spectrum. Microorganisms, however, contain a mixture of complex biomolecules, and this will lead to very complex Raman spectra. In complex mixtures all molecules contribute their signal to the overall Raman spectrum of the mixture. The Raman signal intensity of individual molecular species is linearly dependent on their concentration. This means that Raman spectroscopy is a very suitable technique for obtaining qualitative and quantitative information on the molecular composition of a sample (10, 31). It is also possible to compare whole Raman spectra of different samples. Different bacterial strains, for example, differ in their molecular composition and, hence, will generate different Raman spectra. These spectra can be seen as spectroscopic fingerprints and used for identification of these strains at the species and the subspecies level (Figure 3B).
Figure 3 A. Raman spectrum of chloroform. This small molecule produces a relatively simple Raman spectrum. The peaks in the spectrum can be attributed to specific vibrations within the molecule. B. Raman spectra obtained from different bacterial species. Due to the complex molecular composition of the sample involved, a complex Raman spectrum is obtained. Such a spectrum can be seen as a spectroscopic fingerprint and used for identification and bacterial typing.

Raman instrumentationNowadays, the instrumentation required for Raman measurements is relatively simple and generally consists of 4 basic components component is the laser that provides the highlight. The choice of the laser wavelength can have a significant influence on the quality of Raman spectra. Fluorescent scattering, for instance, is very efficient and occurs over a very broad spectral region blocking the entire Raman spectrum. Fortunately, there are wavelengths in the electromagnetic spectrum that are in so-called fluorescent free windows. Choosing an excitation wavelength below 290 nm and above 700 nm will sfluorescent scattering, or cancel it out all togetherExcitation in the ultraviolet (UV; <400 nm) is used in UV resonance Raman. Because this excitation wavelength is within a major electronic absorption band associated with the 1615 cmenhanced by several orders of magnitude absorption rate of UV radiation by all sorts of biomolecules that can cause damage due to heating and other photocheminm (i.e. near infrared or NIR) does not have problems with the potential damaging of the sample and is therefore most often used in biomedical applications of Raman spectroscopy.
Figure 4 Every instrument for Raman spectroscopy consists of 4 basic parts; (1) a laser as an excitation source, (2) a sample stage where the light is focused on the sample and Raman scattered light is collected, (3) a spectrometer in which the scattered light is detected, and (4) a computer
Raman instrumentation Nowadays, the instrumentation required for Raman measurements is relatively simple and generally consists of 4 basic components (Figure 4). The fcomponent is the laser that provides the high-power monochromatic excitation light. The choice of the laser wavelength can have a significant influence on the quality of Raman spectra. Fluorescent scattering, for instance, is very efficient
over a very broad spectral region blocking the entire Raman spectrum. Fortunately, there are wavelengths in the electromagnetic spectrum
called fluorescent free windows. Choosing an excitation wavelength below 290 nm and above 700 nm will significantly minimize fluorescent scattering, or cancel it out all together (4). Excitation in the ultraviolet (UV; <400 nm) is used in UV resonance Raman. Because this excitation wavelength is within a major electronic absorption band
1615 cm-1 Raman band, the scattering signal is “resonance” enhanced by several orders of magnitude (25). A drawback, however, is the high absorption rate of UV radiation by all sorts of biomolecules that can cause damage due to heating and other photochemical effects. Excitation around 700 nm (i.e. near infrared or NIR) does not have problems with the potential damaging of the sample and is therefore most often used in biomedical applications of Raman spectroscopy.
pectroscopy consists of 4 basic parts; (1) a laser as an excitation source, (2) a sample stage where the light is focused on the sample and Raman scattered light is collected, (3) a spectrometer in which the scattered light is detected, and (4) a computer to analyze the collected spectra.
14
Nowadays, the instrumentation required for Raman measurements is relatively The first
power monochromatic excitation light. The choice of the laser wavelength can have a significant influence on the quality of Raman spectra. Fluorescent scattering, for instance, is very efficient
over a very broad spectral region blocking the entire Raman spectrum. Fortunately, there are wavelengths in the electromagnetic spectrum
called fluorescent free windows. Choosing an excitation ignificantly minimize
Excitation in the ultraviolet (UV; <400 nm) is used in UV resonance Raman. Because this excitation wavelength is within a major electronic absorption band
Raman band, the scattering signal is “resonance” . A drawback, however, is the high
absorption rate of UV radiation by all sorts of biomolecules that can cause cal effects. Excitation around 700
nm (i.e. near infrared or NIR) does not have problems with the potential damaging of the sample and is therefore most often used in biomedical
pectroscopy consists of 4 basic parts; (1) a laser as an excitation source, (2) a sample stage where the light is focused on the sample and Raman scattered light is collected, (3) a
to analyze the collected spectra.
15
In the second component the laser light is focused on the sample. In vitro applications most frequently use a microscope to deliver the laser light to the sample and collect the Raman scattered light via the same objective. The different wavelength components of the Raman scattered light are separated and recorded in a spectrometer, which is the third component of the Raman instrument. Since the intensity of Raman scattered light is much lower (by a factor of approx. 106) than that of Rayleigh scattered light, it is important to suppress the latter in order to prevent it from obscuring the Raman signal on the detector. This suppression is accomplished by using an optical filter. The property of this filter is such that shorter wavelengths, including the laser wavelength, are minimally transmitted (<0.0001%), while longer wavelengths (Raman shifted light) are optimally (>99.9%) transmitted. Next, the different wavelengths in the Raman spectrum are separated on an optical or diffraction grating and individually projected on a detector. A sensitive, infrared optimized CCD camera is often employed as a multi-channel detector. Finally, a regular personal computer with dedicated software is used to read out and analyze the collected Raman spectra from the spectrometer.
Data analysis on Raman spectra Data analysis of Raman spectra can be separated in two categories; quantification for (bio)chemical composition analyses and classification based on spectral similarities and differences. In quantification studies for chemical composition, Raman spectra are decomposed using spectra of pure compounds. The approach can be as simple as a visual assessment of clearly identifiable spectral features that can only correlate to the biochemical component of interest. More objective are the various spectral fitting procedures, which use (linear) combinations of pure compound spectra. The weighted component of the pure compound spectra that fits the Raman spectrum of a sample relate to the relative concentrations of these compounds in the analyzed spectrum (42). Quantification of components is generally considered of less importance to the clinical diagnostic laboratory. Analyses of certain industrially important molecules were reported earlier (7, 8. 10, 31). The most frequently used data analysis method for microbiological studies is classification. Two subcategories are distinguished; supervised and unsupervised. Supervised techniques use pattern recognition and create models based on previously known identification of isolates (reference collection). Such models can be trained to identify unknown samples. Examples of supervised methods are linear discriminant analysis (LDA) and artificial neural networks (ANNs). Unsupervised or objective classification methods solely rely on the assessment of spectral similarities. These methods analyze naturally occurring groups in a data set and require no a priori knowledge on group similarities. Inclusion of well-characterized samples in this analysis scheme allows groups to be identified on the basis of the properties/identities of these reference samples. Examples of such approaches are similarity matches based on the R2 values, principal
16
component analysis (PCA) and hierarchical cluster analysis (HCA). These approaches, specifically cluster analysis, are also applied in typing studies that use electrophoresis-based methods.
Outline of this thesis This thesis describes the development of Raman microspectroscopy for the rapid discrimination of microorganisms at the species and strain level and the use of this technique as a bacterial typing method in epidemiological studies and infection control. Bacterial typing by Raman spectroscopy is based on detection of small spectral differences between strains due to differences in molecular composition. Therefore, obtaining highly reproducible spectra is obliged. One aspect that can limit reproducibility is the presence of high fluorescent spectral backgrounds found in highly pigmented species. Furthermore, variance in the intensity of these pigment-related signals can overshadow strain specific differences and result in low spectral reproducibility and misclassification. The first part of this thesis describes an improved method to minimize fluorescence background (chapter 3) and a novel approach to minimize the variance that can be found in Raman spectra of pigmented bacteria (chapter 2 and 3). The use of Raman spectroscopy for the identification of causative agents in an infection, can lead to a significant reduction in the required analysis time. This means that the clinician is able to adjust the therapy sooner. Chapter 4 describes a culture based procedure for the fast and reliable identification of Mycobacterium species. The influence of various methods to inactivate mycobacteria on Raman spectra is evaluated as well as the repeatability of the procedure. Because of the differences in treatment and epidemiology, analysis is focussed on the discrimination between Mycobacterium tuberculosis and nontuberculous mycobacteria (NTM). Furthermore, the ability to identify seven frequently found NTM species is evaluated. Besides identification, Raman spectroscopy has great potential as a real-time bacterial typing method in epidemiological studies and infection control. The studies described in the following 4 chapters all focus on the ability to use Raman spectroscopy as a real-time typing method in bacterial epidemiology. Procedures are developed for different species that are frequently encountered in hospitals and patient care facilities. In chapter 5 a procedure is described for the bacterial typing of Staphylococcus aureus and MRSA. The same procedure is applied for coagulase negative staphylococci in chapter 6. In this chapter, multiple colonies from one culture and multiple isolates from one patient are investigated. In chapter 7 the evaluation of a Raman based typing scheme for enterococci is described, chapter 8 is focused on bacterial typing of ESBL-related enterobacteriacae. In all studies reference collections and previously described outbreak collections are analysed and results compared to the currently used gold standards. In chapter 9 the application of Raman spectroscopy in medical microbiology is reviewed based on the presented studies and results.
17
References
1. Anderson, D. J., K. B. Kirkland, K. S. Kaye, P. A. Thacker, 2nd, Z. A. Kanafani, G. Auten, and D. J. Sexton. 2007. Underresourced hospital infection control and prevention programs: penny wise, pound foolish? Infect Control Hosp Epidemiol 28:767-73.
2. Audurier, A., and C. Martin. 1989. Phage typing of Listeria monocytogenes. Int J Food Microbiol 8:251-7.
3. Canton, R. 2005. Role of the microbiology laboratory in infectious disease surveillance, alert and response. Clin Microbiol Infect 11 Suppl 1:3-8.
4. Carey, P. R. 1999. Raman spectroscopy, the sleeping giant in structural biology, awakes. J Biol Chem 274:26625-8.
5. Dalterio, R. A., W. H. Nelson, D. Britt, and J. F. Sperry. 1987. An ultraviolet (242 nm excitation) resonance Raman study of live bacteria and bacterial components. Appl Spectrosc 41(3):417-22.
6. Dalterio, R. A., W. H. Nelson, D. Britt, J. F. Sperry, and F. J. Purcell. 1986. A resonance Raman microprobe study of chromobacteria in water. Appl Spectrosc 40(2):271-72.
7. De Gelder, J., K. De Gussem, P. Vandenabeele, P. De Vos, and L. Moens. 2007. Methods for extracting biochemical information from bacterial Raman spectra: an explorative study on Cupriavidus metallidurans. Anal Chim Acta 585:234-40.
8. De Gelder, J., K. De Gussem, P. Vandenabeele, M. Vancanneyt, P. De Vos, and L. Moens. 2007. Methods for extracting biochemical information from bacterial Raman spectra: focus on a group of structurally similar biomolecules--fatty acids. Anal Chim Acta 603:167-75.
9. Dierker S.B., M. C. A., Legrange J.D. and Schlotter N.E. 1987. Characterization of order in Langmuir-Blodgett monolayers by unenhanced Raman spectroscopy. Chem. Phys. Lett. 137.
10. Gelder, J. D., D. Willemse-Erix, M. J. Scholtes, J. I. Sanchez, K. Maquelin, P. Vandenabeele, P. D. Boever, G. J. Puppels, L. Moens, and P. D. Vos. 2008. Monitoring poly(3-hydroxybutyrate) production in cupriavidus necator DSM 428 (H16) with raman spectroscopy. Anal Chem 80:2155-60.
11. Gould, I. M. 2006. Costs of hospital-acquired methicillin-resistant Staphylococcus aureus (MRSA) and its control. Int J Antimicrob Agents 28:379-84.
12. Gross, A. J., and T. R. Herrmann. 2007. History of lasers. World J Urol 25:217-20.
13. Grundmann, H., S. Barwolff, A. Tami, M. Behnke, F. Schwab, C. Geffers, E. Halle, U. B. Gobel, R. Schiller, D. Jonas, I. Klare, K. Weist, W. Witte, K. Beck-Beilecke, M. Schumacher, H. Ruden, and P. Gastmeier. 2005. How many infections are caused by patient-to-patient transmission in intensive care units? Crit Care Med 33:946-51.
14. Hagens, S., and M. J. Loessner. 2007. Application of bacteriophages for detection and control of foodborne pathogens. Appl Microbiol Biotechnol 76:513-9.

18
15. Harbarth, S., H. Sax, and P. Gastmeier. 2003. The preventable proportion of nosocomial infections: an overview of published reports. J Hosp Infect 54:258-66; quiz 321.
16. Horan, T. C., M. Andrus, and M. A. Dudeck. 2008. CDC/NHSN surveillance definition of health care-associated infection and criteria for specific types of infections in the acute care setting. Am J Infect Control 36:309-32.
17. Hunter, P. R., and M. A. Gaston. 1988. Numerical index of the discriminatory ability of typing systems: an application of Simpson's index of diversity. J Clin Microbiol 26:2465-6.
18. Klevens, R. M., J. R. Edwards, C. L. Richards, Jr., T. C. Horan, R. P. Gaynes, D. A. Pollock, and D. M. Cardo. 2007. Estimating health care-associated infections and deaths in U.S. hospitals, 2002. Public Health Rep 122:160-6.
19. Kyle, R. A., and M. A. Shampo. 1980. Sir Chandrasekkara Venkata Raman. Jama 243:1634.
20. Lane, H. J., N. Blum, and E. Fee. Oliver Wendell Holmes (1809-1894) and Ignaz Philipp Semmelweis (1818-1865): preventing the transmission of puerperal fever. Am J Public Health 100:1008-9.
21. Maquelin, K., L. Dijkshoorn, T. J. van der Reijden, and G. J. Puppels. 2006. Rapid epidemiological analysis of Acinetobacter strains by Raman spectroscopy. J Microbiol Methods 64:126-31.
22. Maquelin, K., C. Kirschner, L. P. Choo-Smith, N. van den Braak, H. P. Endtz, D. Naumann, and G. J. Puppels. 2002. Identification of medically relevant microorganisms by vibrational spectroscopy. J Microbiol Methods 51:255-71.
23. Mellmann, A., A. W. Friedrich, N. Rosenkotter, J. Rothganger, H. Karch, R. Reintjes, and D. Harmsen. 2006. Automated DNA sequence-based early warning system for the detection of methicillin-resistant Staphylococcus aureus outbreaks. PLoS Med 3:e33.
24. Naumann, D., D. Helm, and H. Labischinski. 1991. Microbiological characterizations by FT-IR spectroscopy. Nature 351:81-2.
25. Nelson, W. H. a. S., J.F. 1991. UV resonance Raman spectroscopic detection and identification of bacteria and other microorganisms, in Modern techniques for rapid microbiological analysis. VCH publishers, New York.
26. Nulens, E., E. Broex, A. Ament, R. H. Deurenberg, E. Smeets, J. Scheres, F. H. van Tiel, B. Gordts, and E. E. Stobberingh. 2008. Cost of the meticillin-resistant Staphylococcus aureus search and destroy policy in a Dutch university hospital. J Hosp Infect 68:301-7.
27. Peterson, L. R., and G. A. Noskin. 2001. New technology for detecting multidrug-resistant pathogens in the clinical microbiology laboratory. Emerg Infect Dis 7:306-11.
28. Pittet, D., B. Allegranzi, J. Boyce, and E. World Health Organization World Alliance for Patient Safety First Global Patient Safety Challenge Core Group of. 2009. The World Health Organization Guidelines on Hand Hygiene in Health Care and their consensus recommendations. Infect Control Hosp Epidemiol 30:611-22.
19
29. Puppels, G. J., F. F. de Mul, C. Otto, J. Greve, M. Robert-Nicoud, D. J. Arndt-Jovin, and T. M. Jovin. 1990. Studying single living cells and chromosomes by confocal Raman microspectroscopy. Nature 347:301-3.
30. Raman, C. V. a. K. S. K., A new type of radiation. Nature, 1928. 121(3048): p. 501-502). 1928. A new type of radiation. Nature 121:501-502.
31. Schuster, K. C., E. Urlaub, and J. R. Gapes. 2000. Single-cell analysis of bacteria by Raman microscopy: spectral information on the chemical composition of cells and on the heterogeneity in a culture. J Microbiol Methods 42:29-38.
32. Smith, W. S. B. a. G. E. 1970. Charge coupled semiconductor devices. J. Bell System Tech. 49.
33. Struelens, M. 2002. Molecular typing: a key tool for the surveillance and control of nosocomial infection. Curr Opin Infect Dis 15:383-5.
34. Suetens, C., L. Niclaes, B. Jans, J. Verhaegen, A. Schuermans, J. Van Eldere, and F. Buntinx. 2006. Methicillin-resistant Staphylococcus aureus colonization is associated with higher mortality in nursing home residents with impaired cognitive status. J Am Geriatr Soc 54:1854-60.
35. van Belkum, A., P. T. Tassios, L. Dijkshoorn, S. Haeggman, B. Cookson, N. K. Fry, V. Fussing, J. Green, E. Feil, P. Gerner-Smidt, S. Brisse, M. Struelens, and M. European Society of Clinical Microbiology and Infectious Diseases Study Group on Epidemiological. 2007. Guidelines for the validation and application of typing methods for use in bacterial epidemiology. Clin Microbiol Infect 13 Suppl 3:1-46.
36. Vincent, J. L., M. Chierego, M. Struelens, and B. Byl. 2004. Infection control in the intensive care unit. Expert Rev Anti Infect Ther 2:795-805.
37. von Eiff, C., G. Peters, and C. Heilmann. 2002. Pathogenesis of infections due to coagulase-negative staphylococci. Lancet infectious diseases 2 (11):677-685.
38. Wachsmann-Hogiu, S., T. Weeks, and T. Huser. 2009. Chemical analysis in vivo and in vitro by Raman spectroscopy--from single cells to humans. Curr Opin Biotechnol 20:63-73.
39. Wagner, M. 2009. Single-cell ecophysiology of microbes as revealed by Raman microspectroscopy or secondary ion mass spectrometry imaging. Annu Rev Microbiol 63:411-29.
40. Weist, K., K. Pollege, I. Schulz, H. Ruden, and P. Gastmeier. 2002. How many nosocomial infections are associated with cross-transmission? A prospective cohort study in a surgical intensive care unit. Infect Control Hosp Epidemiol 23:127-32.
41. Whitman, W. B., D. C. Coleman, and W. J. Wiebe. 1998. Prokaryotes: the unseen majority. Proc Natl Acad Sci U S A 95:6578-83.
42. Wolthuis, R., M. van Aken, K. Fountas, J. S. Robinson, Jr., H. A. Bruining, and G. J. Puppels. 2001. Determination of water concentration in brain tissue by Raman spectroscopy. Anal Chem 73:3915-20.
20
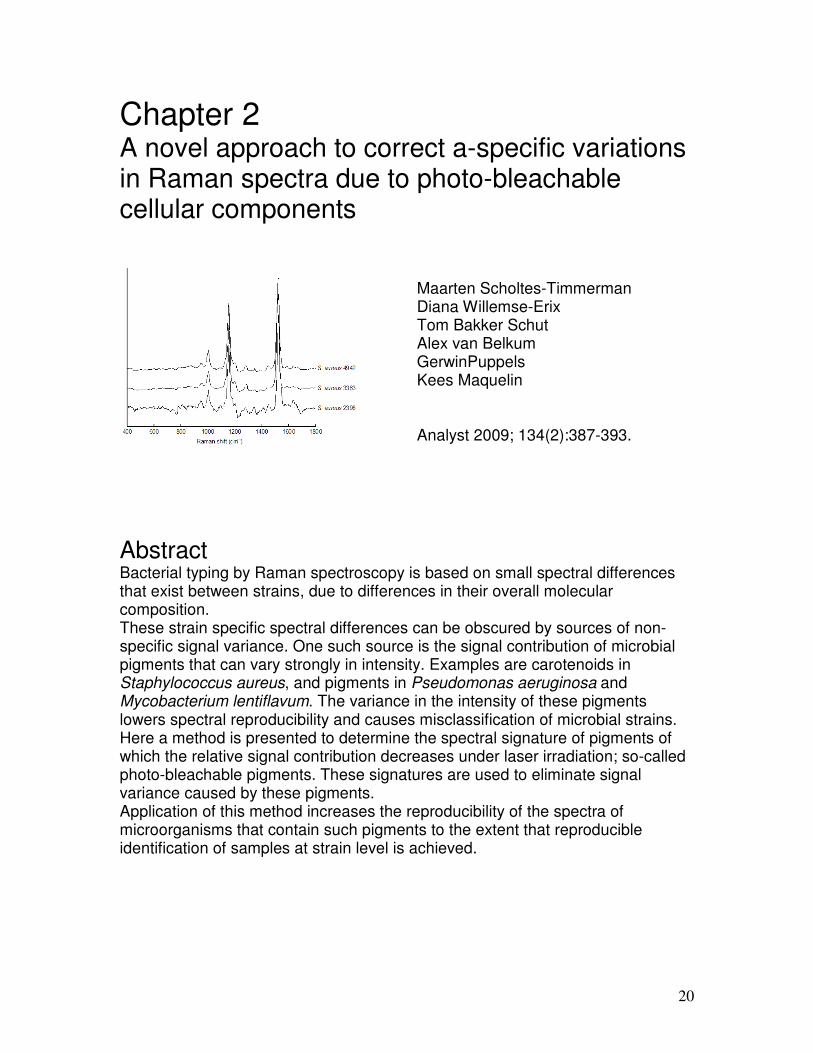
Chapter 2 A novel approach to correct a-specific variations in Raman spectra due to photo-bleachable cellular components
Maarten Scholtes-Timmerman Diana Willemse-Erix Tom Bakker Schut Alex van Belkum GerwinPuppels Kees Maquelin Analyst 2009; 134(2):387-393.
Abstract Bacterial typing by Raman spectroscopy is based on small spectral differences that exist between strains, due to differences in their overall molecular composition. These strain specific spectral differences can be obscured by sources of non-specific signal variance. One such source is the signal contribution of microbial pigments that can vary strongly in intensity. Examples are carotenoids in Staphylococcus aureus, and pigments in Pseudomonas aeruginosa and Mycobacterium lentiflavum. The variance in the intensity of these pigments lowers spectral reproducibility and causes misclassification of microbial strains. Here a method is presented to determine the spectral signature of pigments of which the relative signal contribution decreases under laser irradiation; so-called photo-bleachable pigments. These signatures are used to eliminate signal variance caused by these pigments. Application of this method increases the reproducibility of the spectra of microorganisms that contain such pigments to the extent that reproducible identification of samples at strain level is achieved.
21
Introduction We are developing technology and methods for Raman spectroscopic identification of bacteria at strain level. Previously, we showed that identification of bacteria at the species level is possible using this technique (1, 2), as well as strain-level discrimination of Acinetobacter strains (3). Discrimination between strains of the same bacterial species is referred to as typing, and is used in epidemiological investigations. The differences in the Raman spectra of strains can be minute. This makes it very important to obtain these spectra with very high reproducibility. This puts high demands on instrumentation and requires standardization of culture conditions. However, even standardization of culturing conditions does not always result in sufficient spectral reproducibility. We have found that in many cases this problem can be traced back to varying accumulation of pigments in microbial cells. An example is Staphylococcus aureus, which is a bacterium known for its yellow-orange pigmentation caused by carotenoids (aureus meaning golden in Latin). During growth, S. aureus incorporates various carotenoid intermediates (4) and different S. aureus strains may produce both different types and different amounts of carotenoids (5). Carotenoids have a distinctive and intense Raman spectrum. However, even when a strain is cultured according to strict culturing protocols (to avoid as much biological variability between repeated cultures as possible) it often happens that Raman spectra of different cultures show varying carotenoid signal contributions. Because the carotenoid signal is relatively intense, and different species of carotenoids can be present, this signal variance interferes with strain identification. Under laser irradiation, the signal of the carotenoid pigments steadily decreases. We have used this photo-bleaching effect to develop a method to eliminate the signal-variance caused by carotenoids, in S. aureus spectra. We also show its effectiveness in eliminating similar signal-variance caused by pigments in the bacterial species Pseudomonas aeruginosa and Mycobacterium lentiflavum.

22
Materials and methods Bacterial strains Table 1 shows the S. aureus, P. aeruginosa and M. lentiflavum strains used in this study. Table 1. Microbial strains used in this study Species CODT collection nr. Reference
S. aureus 2398a, 3363
a, 4942
a 9
W13
b, W16
b, W17
b, W18
b, W20
b 10
P. aeruginosa 00392b, 01958
b, 27853
b
28689
a,b, 28695
a,b
MMID MMD
M. gordonae 9900243a 6
M. xenopi 9701961a 6
M. lentiflavum 39-001SPAa, 39-043SPA
a RIVM
010Sp2N
b, 015Sp2N
b, 040SpA
b, 043SpA
b 091Sp2N
b 6
a isolates used in the experiment for determination of spectral components susceptible to photo-bleaching;
b isolates used in the experiment to assess the effect on strain identification of elimination of signal variance
due to photo-bleachable components MMID: isolates from Department of Medical Microbiology and Infectious Diseases, Erasmus MC; RIVM: isolates from the Dutch National Institute for Public Health and the Environment
Culturing of strains In all cases, bacterial isolates were stored at -80°C in Brain heart Infusion broth (BHI) containing 10% glycerol until use. S. aureus and P. aeruginosa samples were grown overnight on trypticase soy agar (TSA, Becton Dickinson, Franklin Lakes, NJ, USA) at 35°C to check for purity and then re-cultured for 20-24 hours on TSA. Mycobacterium strains were cultured as described earlier (6).
Sample preparation for Raman measurements Samples of S. aureus and P. aeruginosa were prepared for Raman measurements by collecting a 1 µl disposable loop of bacterial biomass from the growth medium and suspending this in 10 µl distilled water. The suspensions were vortexed and subsequently centrifuged for 1 minute at 13,200xg to remove air bubbles and to further concentrate the biomass. Approximately 6 µl of supernatant was removed; the biomass was resuspended in the remaining supernatant. 4 µl of the resulting suspension was transferred to a QG-quality fused silica microscope slide (Hellma Benelux BV, Aartselaar, Belgium). Samples were allowed to dry at 35°C for ~30 minutes. Mycobacterium samples were washed three times with distilled water6. The sediment was resuspended in 10 µl distilled water. 4 µl of the suspension was
23
transferred to a QG-quality fused silica microscope slide (Hellma Benelux BV, Aartselaar, Belgium). Samples were allowed to dry in air.
Raman instrumentation Raman spectra were collected using a Model 2500 High Performance Raman Module (HPRM) (River Diagnostics BV, Rotterdam, The Netherlands), coupled to a custom-built measurement head, which incorporates an automated XY-stage (River Diagnostics). The system was operated using RiverICon software (River Diagnostics), version 1.63. The spectrometer was calibrated according to the manufacturer’s guidelines. The measurement head contained a custom-designed microscope objective (River Diagnostics) with a numerical aperture of 0.7, 20× magnification, a working distance of 2.00mm. The optical system was optimized for Raman experiments in the 750-1000 nm wavelength region. The objective was designed to focus laser light emitted by the Model 2500 HPRM through a fused silica slide into the bacterial samples on top of the slide. A 785 nm diode laser (Sacher Lasertechnik, Marburg, Germany), delivered approximately 220 mW to the sample. The measurement volume is 5µm in the lateral direction and 15 µm along the optical axis. The objective also collects Raman back-scattered light from the samples. Spectra were recorded in the wavenumber region from 340 to 2450 cm-1, with a resolution of ~4 cm-1. Automated data collection and signal pre-processing was performed using the RiverICon software, according to manufacturer’s instructions. This consisted of recording spectra using a 1-second exposure time; signal pre-treatment consisted of correction for the signal contribution from optical components in the spectrometer and the signal contribution of the fused silica substrate.
Spectral processing Spectral preprocessing consisted of either:
1. Background signal correction using Extended Multiplicative Scatter Correction (EMSC) (7).
2. Background correction combined with correction for signal variance due to molecular cell constituents of which the signal intensity decreases during laser irradiation (bleachable components) using EMSC coupled to Spectral Interferent Subtraction (EMSC-SIS) (7).
Briefly, the EMSC-preprocessing of spectra consisted of the following steps: 1. For each bacterial species, a low-noise reference spectrum was created
by averaging spectra of strains belonging to that species. 2. During preprocessing of a spectrum, the spectrum was fitted with the
reference spectrum obtained in step I, and a 7th-order polynomial. 3. The fitted spectrum is used for further analysis.
Alternatively, the EMSC-SIS-preprocessing of spectra consisted of the following steps:
1. For each bacterial species, a low-noise reference spectrum was created by averaging spectra of strains belonging to that species.
24
2. During preprocessing of a spectrum, the spectrum was fitted with the reference spectrum, a 7th-order polynomial and the set of interferents. The set of interferents is the set of bleachable component spectra of the species in case (see Raman experiment I, below).
3. The fitted spectrum is used for further analysis.
Data analysis For all spectra, the 400-to-1800 cm-1 spectral region was used in the analysis. All spectral pre-processing and data analysis steps were performed using MATLAB 7.1 software (The Mathworks, Natick, MA, USA) and the PLS toolbox 2.0 (Eigenvector Research, Wenatchee, WA, USA). Processed spectra were analyzed using hierarchical cluster analysis (HCA). The input of the HCA consisted of the averaged Raman spectra per sample. The pair wise squared Pearson correlation coefficients (R2) were calculated between all pairs of spectra, and multiplied by 100 to be expressed as percentages. This similarity matrix, combined with Ward’s clustering algorithm was used to generate a dendrogram (8).
Raman experiment I, method for determination of spectral components susceptible to photo-bleaching In brief, the method of determining the spectrum of photo-bleachable components in a microbial strain comprised:
1. Irradiating a sample with laser light and recording Raman spectra until signal contributions of photo-bleachable components had been bleached away.
2. Determining at which point in such a measurement series about half of the signal of photo-bleachable components had decreased to about 50% of their original intensity
3. Averaging the spectra obtained before this 50%-point (average 1) and after this 50%-point (average 2) and calculating the difference average1-average2, yielding a spectrum of the photo-bleached components (‘bleachable component spectrum’).
An estimate of the 50% bleaching point was made by:
1. Subtracting a linear baseline from the most prominent pigment peak in the spectrum, enabling estimation of the integrated peak intensity.
2. The integrated peak intensity was calculated for each of the collected spectra in a bleaching series. This results in a curve showing the signal contribution of the photo-bleachable components as function of laser irradiation time, from which the time required to achieve 50% reduction of the peak area was determined (‘bleaching halftime’).
For the photo-induced bleaching experiment, several strains of the 3 species (S. aureus, P. aeruginosa, M. lentiflavum) were selected (see Table 1).
25
In each sample, 3 or more locations were randomly selected, and per location 500 consecutive Raman spectra of 1 second were recorded. When photo-bleaching occurred so fast that bleaching was complete before the end of the series of 500 spectra, fewer spectra were recorded instead. For each measurement series, a bleachable component spectrum was calculated and bleachable component spectra obtained from different locations in one sample were averaged to obtain a representative bleachable component spectrum per strain
Raman experiment II, method for assessing the effect on strain identification of elimination of signal variance due to photo-bleachable components Raman spectra were recorded from all strains in Table 1. Of the selected strains, two full biological replicates were cultured, processed and analyzed. Reproducibility is determined by creating a hierarchical cluster tree from all the measurements of one bacterial species. Measurements are considered reproducible when replicates of one strain cluster together, i.e. spectra of samples of one strain are more similar to each other than to any spectrum obtained from other strains.
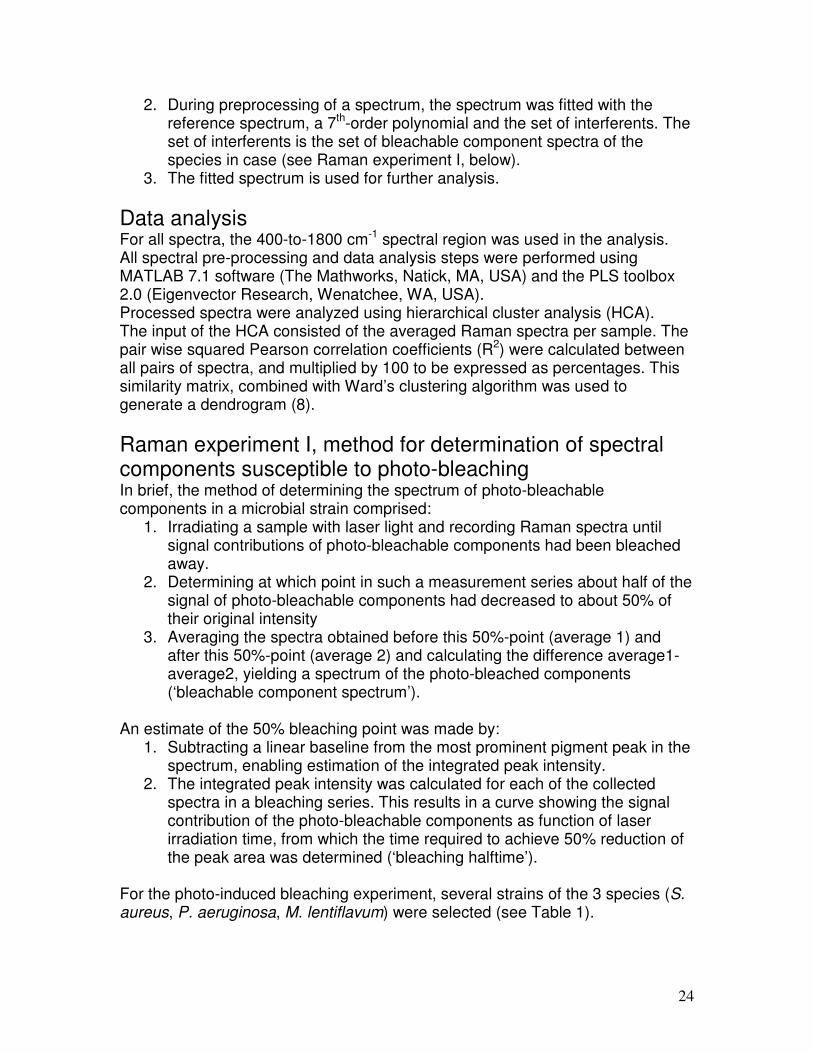
Results and discussion Figure 1 shows three Raman spectra obtained from three independent cultures of the same S. aureus strain (W05), cultured according to the same protocol. A large variance in relative signal intensity is visible in the intensity of the carotenoid signal contributions at 1157 cm-1 and 1525 cm-1 (shaded areas). Efforts to bring the variance in carotenoid signal under control by optimizing culturing conditions (such as culturing using different culture media, or different incubation times) proved to be unsuccessful. The most intense carotenoid bands in the Raman spectrum are found at about 1157 cm-1 and 1525 cm-1, where there is limited overlap with other S. aureus Raman bands. However, less prominent signal contributions are present in other parts of the spectrum. Therefore, a simple elimination of spectral regions around the 1157 and 1525 cm-1 peaks, from the spectrum does not sufficiently eliminate the carotenoid variation in the overall spectrum. Subtracting a scaled Raman spectrum of pure (beta)carotene is also practically impossible, since the exact compositions and conformations of these molecules in a sample cannot be determined in a practical approach for each sample to be measured. Clearly, a different correction approach is required.
26
Figure 1. Variation in the carotenoid signal contribution in Raman spectra from repeated cultures of the same S. aureus strain W05. Shaded areas indicate regions with clear signal variations. The inset shows an enlargement of the area indicated by the dotted line.
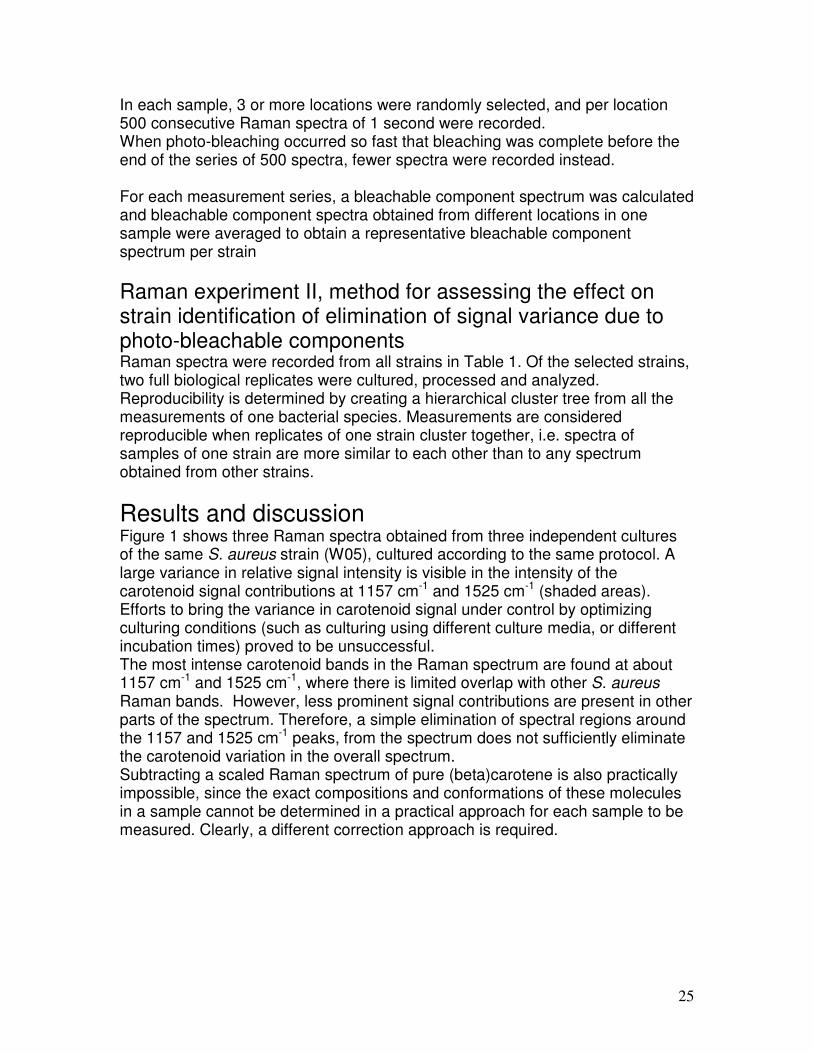
Raman experiment I Figure 2 shows a representative example of the evolution of the Raman spectrum during the measurement of the 500 sequential spectra for S. aureus 3363, all obtained with a 1 s signal collection time. For clarity, only spectra 1, 100, 200, 300, 400 and 500 are shown.
Figure 2. Spectra showing effect of photo-induced bleaching for S. aureus 3363. The inset shows an
enlargement of the area indicated by the dotted line.
27
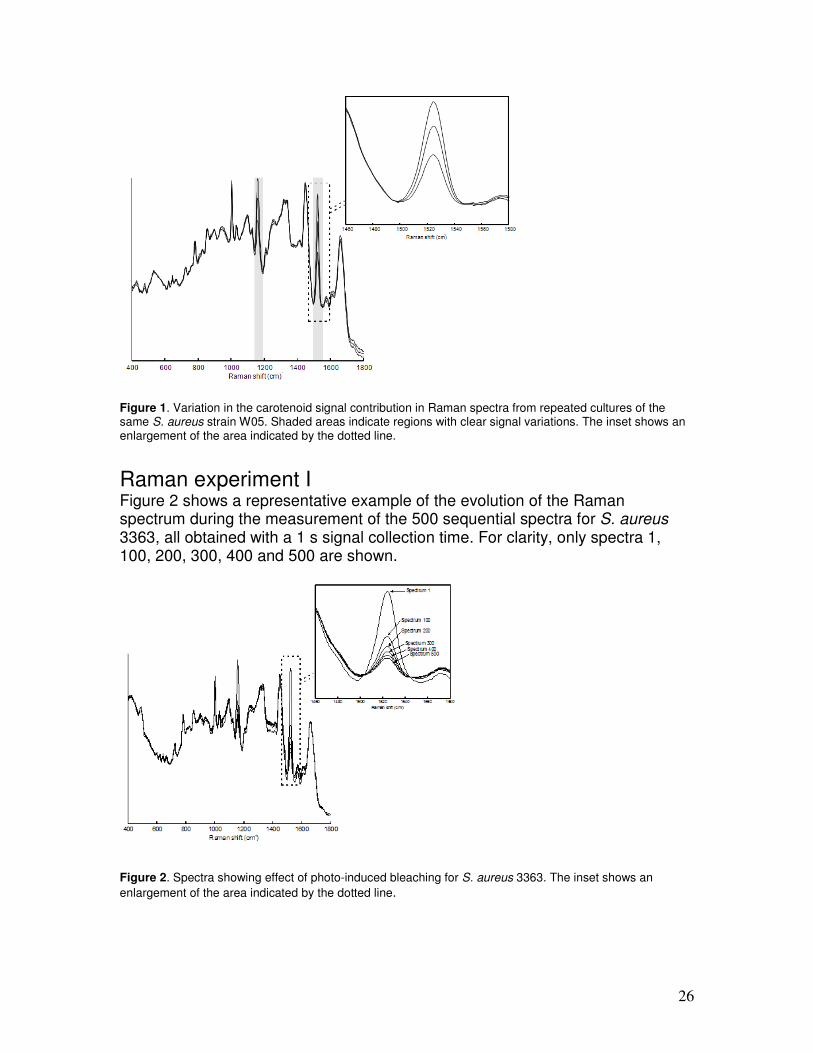
To determine the photo-induced bleaching of the carotenoid signal in S. aureus as function of time, the peak area of the region 1500-1550 cm-1 was determined for all 500 individual spectra. Figure 3 shows a typical decrease of this peak area during the 500 individual measurements, normalized between 0 and 100%. From these spectra, the photo-bleachable component spectrum was calculated. Bleachable component spectra obtained from different locations in one sample were identical (data not shown).
Figure 3. Evolution of carotenoids signal intensity during 500 measurements of S. aureus strain 3363
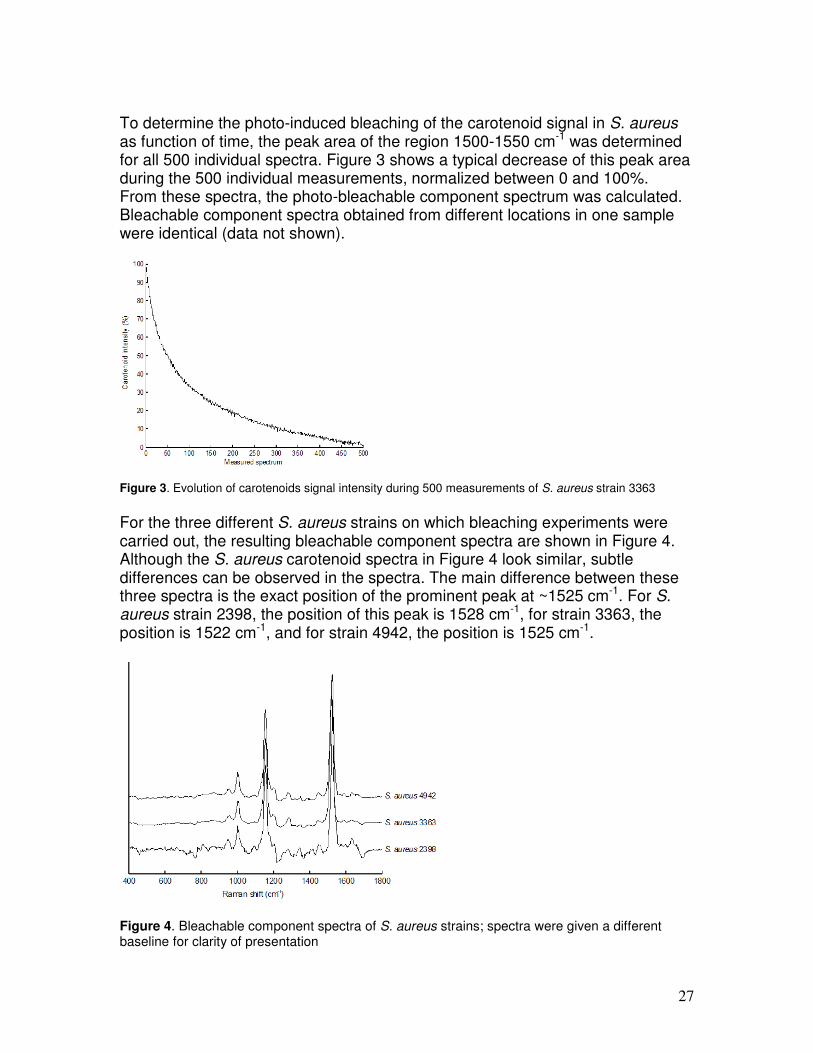
For the three different S. aureus strains on which bleaching experiments were carried out, the resulting bleachable component spectra are shown in Figure 4. Although the S. aureus carotenoid spectra in Figure 4 look similar, subtle differences can be observed in the spectra. The main difference between these three spectra is the exact position of the prominent peak at ~1525 cm-1. For S. aureus strain 2398, the position of this peak is 1528 cm-1, for strain 3363, the position is 1522 cm-1, and for strain 4942, the position is 1525 cm-1.
Figure 4. Bleachable component spectra of S. aureus strains; spectra were given a different baseline for clarity of presentation
28
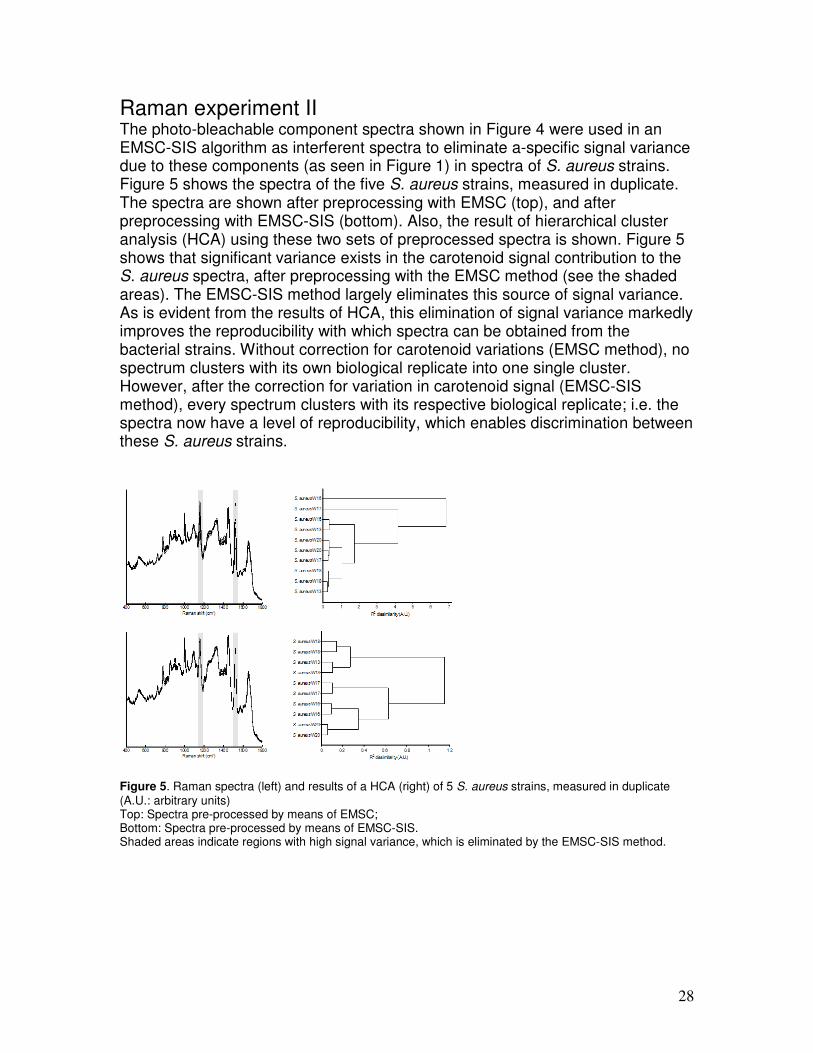
Raman experiment II The photo-bleachable component spectra shown in Figure 4 were used in an EMSC-SIS algorithm as interferent spectra to eliminate a-specific signal variance due to these components (as seen in Figure 1) in spectra of S. aureus strains. Figure 5 shows the spectra of the five S. aureus strains, measured in duplicate. The spectra are shown after preprocessing with EMSC (top), and after preprocessing with EMSC-SIS (bottom). Also, the result of hierarchical cluster analysis (HCA) using these two sets of preprocessed spectra is shown. Figure 5 shows that significant variance exists in the carotenoid signal contribution to the S. aureus spectra, after preprocessing with the EMSC method (see the shaded areas). The EMSC-SIS method largely eliminates this source of signal variance. As is evident from the results of HCA, this elimination of signal variance markedly improves the reproducibility with which spectra can be obtained from the bacterial strains. Without correction for carotenoid variations (EMSC method), no spectrum clusters with its own biological replicate into one single cluster. However, after the correction for variation in carotenoid signal (EMSC-SIS method), every spectrum clusters with its respective biological replicate; i.e. the spectra now have a level of reproducibility, which enables discrimination between these S. aureus strains.
Figure 5. Raman spectra (left) and results of a HCA (right) of 5 S. aureus strains, measured in duplicate (A.U.: arbitrary units) Top: Spectra pre-processed by means of EMSC; Bottom: Spectra pre-processed by means of EMSC-SIS. Shaded areas indicate regions with high signal variance, which is eliminated by the EMSC-SIS method.
29
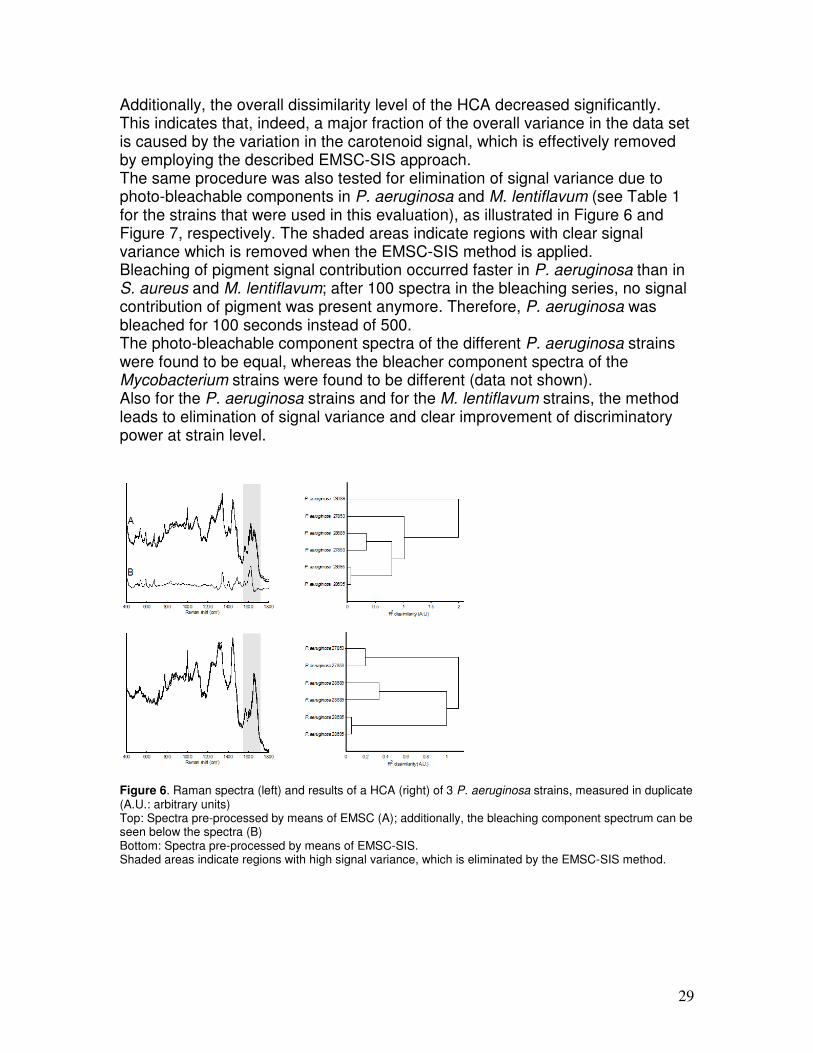
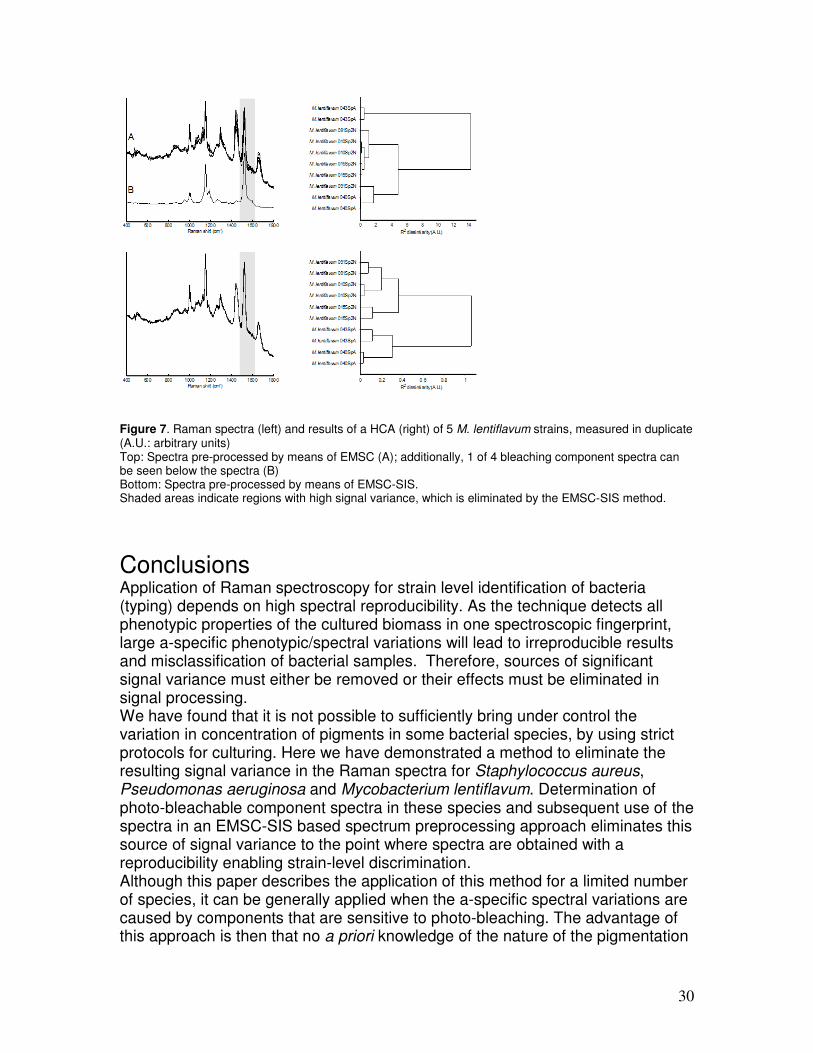
Additionally, the overall dissimilarity level of the HCA decreased significantly. This indicates that, indeed, a major fraction of the overall variance in the data set is caused by the variation in the carotenoid signal, which is effectively removed by employing the described EMSC-SIS approach. The same procedure was also tested for elimination of signal variance due to photo-bleachable components in P. aeruginosa and M. lentiflavum (see Table 1 for the strains that were used in this evaluation), as illustrated in Figure 6 and Figure 7, respectively. The shaded areas indicate regions with clear signal variance which is removed when the EMSC-SIS method is applied. Bleaching of pigment signal contribution occurred faster in P. aeruginosa than in S. aureus and M. lentiflavum; after 100 spectra in the bleaching series, no signal contribution of pigment was present anymore. Therefore, P. aeruginosa was bleached for 100 seconds instead of 500. The photo-bleachable component spectra of the different P. aeruginosa strains were found to be equal, whereas the bleacher component spectra of the Mycobacterium strains were found to be different (data not shown). Also for the P. aeruginosa strains and for the M. lentiflavum strains, the method leads to elimination of signal variance and clear improvement of discriminatory power at strain level.
Figure 6. Raman spectra (left) and results of a HCA (right) of 3 P. aeruginosa strains, measured in duplicate (A.U.: arbitrary units) Top: Spectra pre-processed by means of EMSC (A); additionally, the bleaching component spectrum can be seen below the spectra (B) Bottom: Spectra pre-processed by means of EMSC-SIS. Shaded areas indicate regions with high signal variance, which is eliminated by the EMSC-SIS method.
30
Figure 7. Raman spectra (left) and results of a HCA (right) of 5 M. lentiflavum strains, measured in duplicate (A.U.: arbitrary units) Top: Spectra pre-processed by means of EMSC (A); additionally, 1 of 4 bleaching component spectra can be seen below the spectra (B) Bottom: Spectra pre-processed by means of EMSC-SIS. Shaded areas indicate regions with high signal variance, which is eliminated by the EMSC-SIS method.
Conclusions Application of Raman spectroscopy for strain level identification of bacteria (typing) depends on high spectral reproducibility. As the technique detects all phenotypic properties of the cultured biomass in one spectroscopic fingerprint, large a-specific phenotypic/spectral variations will lead to irreproducible results and misclassification of bacterial samples. Therefore, sources of significant signal variance must either be removed or their effects must be eliminated in signal processing. We have found that it is not possible to sufficiently bring under control the variation in concentration of pigments in some bacterial species, by using strict protocols for culturing. Here we have demonstrated a method to eliminate the resulting signal variance in the Raman spectra for Staphylococcus aureus, Pseudomonas aeruginosa and Mycobacterium lentiflavum. Determination of photo-bleachable component spectra in these species and subsequent use of the spectra in an EMSC-SIS based spectrum preprocessing approach eliminates this source of signal variance to the point where spectra are obtained with a reproducibility enabling strain-level discrimination. Although this paper describes the application of this method for a limited number of species, it can be generally applied when the a-specific spectral variations are caused by components that are sensitive to photo-bleaching. The advantage of this approach is then that no a priori knowledge of the nature of the pigmentation
31
is required. For S. aureus, e.g., we have found that collecting three distinct bleachable component spectra allowed us to correct carotenoid signals in all strains with carotenoid pigmentation thus far encountered. The procedure can be simply adjusted to correct for carotenoids signals that were not previously encountered.
Acknowledgement Willem van Leeuwen is acknowledged for useful technical discussions. The authors wish to thank the Dutch Technology Foundation (STW) for funding of this research under project number 06311.
References 1. Kirschner, C. K. Maquelin, P. Pina, N.A. Ngo Thi, L.P. Choo-Smith, G.D.
Sockalingum, C. Sandt, D. Ami, F. Orsini, S.M. Doglia, P. Allouch, M. Mainfait, G.P. Puppels, and D. Naumann. 2001. Classification and idendification of Enterococci: a comparative phenotypic, genotypic and vibrational spectroscopic study. J Clin Microbiol 39:1763-1770.
2. Maquelin, K., L.P. Choo-Smith, T. van Vreeswijk, H.P. Endtz, B. Smith, R. Bennet, H.A. Bruining, and G.J. Puppels. 2000. Raman spectroscopic method for identification of clinically relevant microorganisms growing on solid culture medium. Anal Chem 72(1):12-19.
3. Maquelin, K., L. Dijkshoorn, T. J. van der Reijden, and G. J. Puppels. 2006. Rapid epidemiological analysis of Acinetobacter strains by Raman spectroscopy. J Microbiol Methods 64:126-31.
4. Hammond, R.K., and D.C. White. 1970. Carotenoid formation by Staphylococcus aureus. J. Bacteriol 103(1):191-198.
5. Marshall, J.H., and G.J. Wilmoth. 1981. Pigments of Staphylococcus aureus, a series of triterpenoid carotenoids. Bacteriol 147(3):900-913.
6. Buijtels, P.C.A.M., H.F.M. Willemse-Erix, P.L.C. Petit, H.P. Endtz, G.J. Puppels, H.A. Verbrugh, A. van Belkum, D. van Soolingen, and K. Maquelin. 2008. Rapid identification of Mycobacteria by Raman spectroscopy. J Clin Microbiol 46:961-965.
7. Martens, H., end E. Stark. Extended multiplicative signal correction and spectral interference subtraction: New preprocessing methods for near infrared spectroscopy. J Pharmaceutical and Biomedical Analysis 9; 625-635.
8. Ward, J.H. Hierarchical grouping to optimize an objective function. 1963. J Am Stat Assoc 58:236-244.
9. Wertheim, H.F., W.B. van Leeuwen, S. Snijders, M.C. Vos, A. Voss, C.M. Vandenbroucke-Grauls, J.A. Kluytmans, H.A. Verbrugh and A. van Belkum. 2005. Clonal distribution and differential occurrence of the enterotoxin gene cluster, egc, in carriage- versus bacteremia-associated isolates of Staphylococcus aureus. J Infect Dis 192:1196-1200.
10. Van Belkun, A., W. van Leeuwen, M.E. Kaufmann, B. Cookson, F. Forey, J. Etienne, R. Goering, F. Tenover, C. Steward, F. O’Brien, W. Grubb, P. Tassios, N. Legakis, A. Morvan, N. El Solh, R. de Ryck, M. Struelens, S. Salmenlinna, J. Vuopio-Varkila, M. Kooistra, A. Talens, W. Witte and H.A. Verbrugh. 1998. Assessment of resolution and intercenter reproducibility of results of genotyping Staphylococcus aureus by Pulsed Field Gel Electrophoresis. J Clin Microbiol 36:1653-1659.

32
Chapter 3 Towards Raman-based epidemiological typing of Pseudomonas aeruginosa
Diana Willemse-Erix Jan-willem Jachtenberg Tom Bakker Schut Willem van Leeuwen Alex van Belkum Gerwin Puppels Kees Maquelin Journal of Biophotonics 2010; 3(8-9):506- 511.
Abstract Raman spectra of bacteria can be used as highly specific fingerprints, enabling discrimination at strain level. Pseudomonas aeruginosa strains can be strongly pigmented, making it difficult to obtain high quality spectra of such isolates due to high fluorescent spectral backgrounds. Furthermore, the spectra that could be measured with acceptable quality often showed large spectral variations limiting the reproducibility required for strain level discrimination. It was found that applying a washing procedure to reduce the amount of fluorescent pigment, enabled the highly pigmented isolates to be measured with sufficient spectral quality. Isolation of the pigment spectral features, together with spectral scaling methods improved reproducibility. It will be important to analyze the range of the spectral variations that can occur and ensure the correction of all of these factors to obtain the highest reproducibility required for strain level typing.
Introduction Pseudomonas aeruginosa is a Gram-negative nonfermenting bacterial species that is commonly found in the environment, associated with moist places (1). Because of this specific preferred niche, the organism is also causing problems in the hospital environment. P. aeruginosa can be found in aqueous solutions including disinfectants, soaps, ointments, eye drops and in different sorts of equipment such as ventilators and nebulizers. Besides causing urinary tract infections, wound infections, and peritonitis, P. aeruginosa is feared for the pulmonary tract infections that are highly prevalent in critically ill patients on the
33
intensive care units (ICU). Mechanically ventilated patients have a higher risk of developing pneumonia while ventilated. Approximately 35% of the ventilator associated pneumonia (VAP) cases have been reported to be caused by P. aeruginosa (2). Because of the preference for a moist environment, transmission of the organism is associated with water supplies, showerheads etc. (2–5). Laboratory based characterization of P. aeruginosa (accurate and rapid identification and epidemiological typing) in routine diagnostics and epidemiological studies, is an important topic in infection prevention. P. aeruginosa produces an extracellular compound with yellowish green fluorescence, called pyoverdin, which functions as an iron scavenging siderophore. The production of pyoverdin coincides with the production of another siderophore, pyochelin. Pyoverdin is produced by P. aeruginosa in several forms (6, 7). The siderophore function of pyoverdin may be related to the pathogenicity of this bacterial species because pyoverdin stimulated growth not only in iron-deficient culture medium, but also in defined medium containing transferrin and in human serum or plasma (7, 8). In our laboratory we are developing microbial typing approaches based on Raman spectroscopy. While evaluating the possibilities to create a protocol for P. aeruginosa isolates, we found that we were limited by the fluorescent background present in the Raman spectra (9), probably caused by pyoverdin. This fluorescent background could be so intense that the total signal intensity saturates the detector in the routinely used exposure times. Isolates with such a high pigment expression could not be measured in a routinely used strategy (24 samples in 1–2 hours). Decreasing the signal collection time would be a possibility, but the signal-to-noise levels would significantly deteriorate and still lead to unusable spectra. Furthermore, for those isolates that could be measured, we observed that the previously described spectral scaling procedure (9) could not correct for all signal variations. The negative effect on signal-to-noise ratios of spectra caused by the high fluorescence background and the significant sample-to-sample variance caused by varying signal contributions of the pigment, hinder strain level identification. Here we present a simple washing step that made it possible to measure those fluorescent isolates and obtain more reproducible Raman fingerprints.
Materials and methods Bacterial isolates A collection of 20 P. aeruginosa isolates from the authors’ strain collection was used. This collection contained one reference strain (ATCC 27853) and 19 clinical isolates. Species identification of these strains was performed by combined culture and Vitek analysis (bioMérieux, Lyon, France). All isolates were stored at -80 °C in Brain Hearth Infusion broth (BHI) containing 10% glycerol.
34
Sample preparation Cultures and measurements were performed as described previously (10). Briefly, all isolates were grown overnight on Trypticase Soy agar (TSA, BectonDickinson, Franklin Lakes, NJ, USA). A small amount of biomass from a 20 h culture was suspended in sterile water and 3 µl was transferred to a sample carrier and allowed to dry. To wash samples, the following protocol was used. After suspending the initial biomass from the TSA plate in 5 µl of distilled water, the suspension was washed by adding 100 ml of distilled water, mixed using a vortex shaker, centrifuged for 3 minutes at 12,000xg and the supernatant was removed. Next, 3 µl of the wet pellet was transferred to the sample carrier and allowed to dry.
Raman spectroscopy Raman spectra were collected using a SpectraCellRA bacterial strain analyzer (River Diagnostics BV, Rotterdam, The Netherlands) as described before (10). Automated data collection and automated signal preprocessing was performed using the RiverICon software.
Data analysis All spectral pre-processing and data analysis steps were performed using MATLAB 7.1 software (The Mathworks, Natick, MA, USA) and the PLS toolbox 2.0 (Eigenvector Research, Wenatchee, WA, USA) The similarity between pairs of spectra was expressed in percentages and calculated using the squared Pearson correlation coefficient (R2) multiplied by 100.
Identifying and correcting varying signal contribution Spectra of P. aeruginosa showed a varying non-informative signal contribution, present as a fluorescent background and distinct Raman bands in the spectral regions from 500–700 cm-1 and 1400–1650 cm-1. The method used for elimination of this non-informative signal variance due to a “bleachable component” is described in detail elsewhere (9). This bleachable component is that spectral component that degrades while a sample is excited using the excitation conditions. To compare the spectral variance of the bleachable component to the secreted pigment, we used the following approach. Since the pigment is secreted in the environment, it will most likely be present in the inter-cellular space within a colony. To analyze the spectrum of the pigment, the pigmented supernatant of a highly pigmented isolate from the first washing steps was placed on a sample carrier, allowed to dry and measured as described above. Besides the pyoverdin, this supernatant will also contain other intercellular material.
Spectral pretreatment Spectra were corrected for varying background levels, spectral interferents (including the spectrum of the washed out pigment) as described elsewhere (9).
35
Reproducibility of Raman measurements Each isolate was cultured and measured three times as so-called full biological replicates (started by taking a fresh aliquot from the -80 °C stock). For each isolate the R2 values were calculated between any of the 3 unique combinations of replicate spectra obtained. The lowest R2 value was selected as the minimum correlation between replicate samples of an isolate. This value was named the ReproMatch and accounts for any signal variance due to differences in culturing, sample preparation or actual Raman measurements.
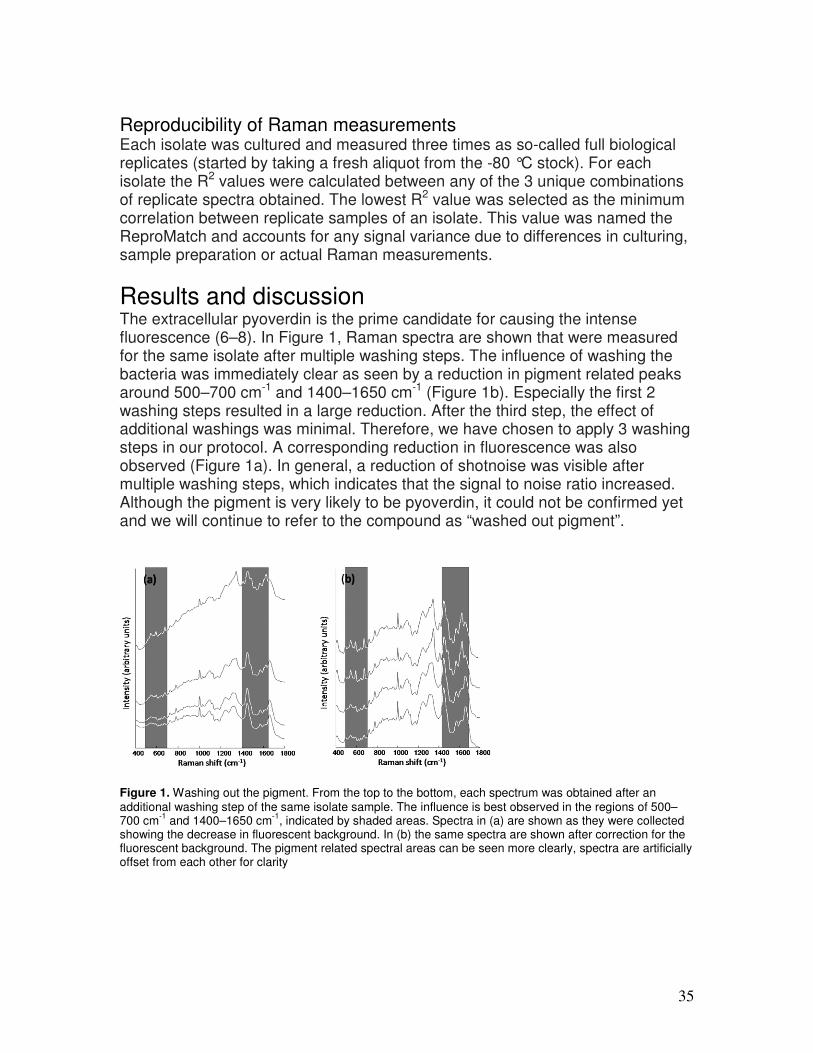
Results and discussion The extracellular pyoverdin is the prime candidate for causing the intense fluorescence (6–8). In Figure 1, Raman spectra are shown that were measured for the same isolate after multiple washing steps. The influence of washing the bacteria was immediately clear as seen by a reduction in pigment related peaks around 500–700 cm-1 and 1400–1650 cm-1 (Figure 1b). Especially the first 2 washing steps resulted in a large reduction. After the third step, the effect of additional washings was minimal. Therefore, we have chosen to apply 3 washing steps in our protocol. A corresponding reduction in fluorescence was also observed (Figure 1a). In general, a reduction of shotnoise was visible after multiple washing steps, which indicates that the signal to noise ratio increased. Although the pigment is very likely to be pyoverdin, it could not be confirmed yet and we will continue to refer to the compound as “washed out pigment”.
Figure 1. Washing out the pigment. From the top to the bottom, each spectrum was obtained after an additional washing step of the same isolate sample. The influence is best observed in the regions of 500–700 cm
-1 and 1400–1650 cm
-1, indicated by shaded areas. Spectra in (a) are shown as they were collected
showing the decrease in fluorescent background. In (b) the same spectra are shown after correction for the fluorescent background. The pigment related spectral areas can be seen more clearly, spectra are artificially offset from each other for clarity
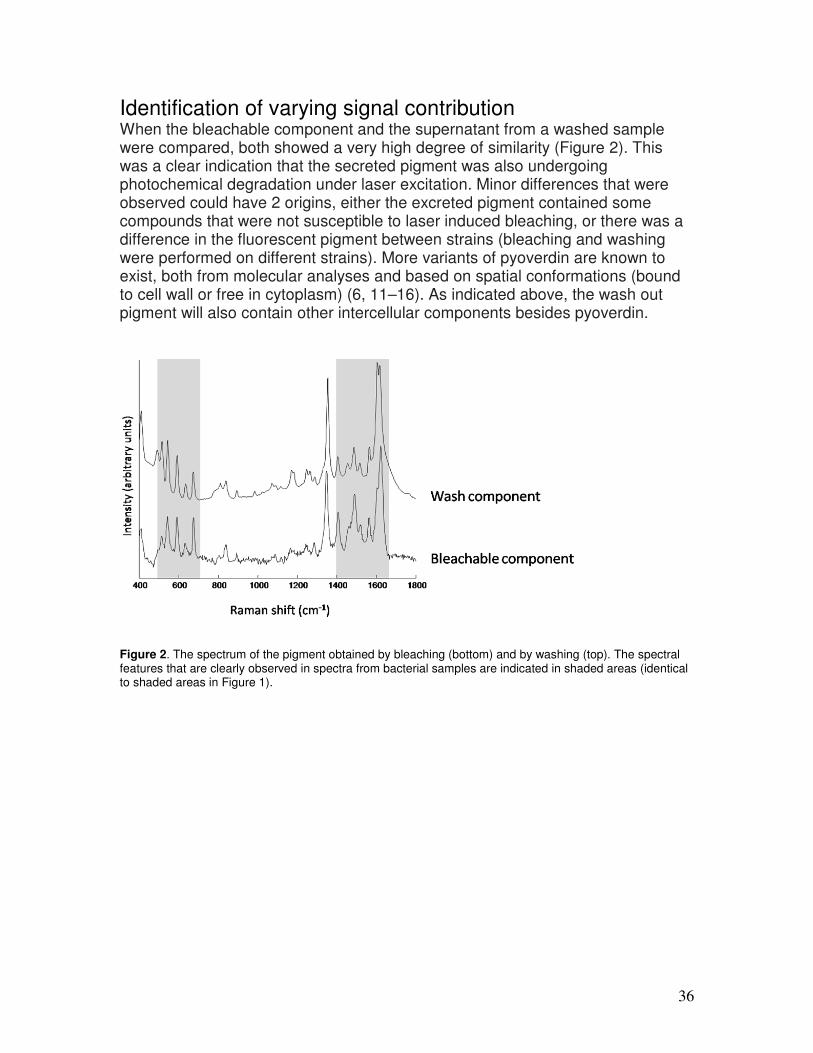
36
Identification of varying signal contribution When the bleachable component and the supernatant from a washed sample were compared, both showed a very high degree of similarity (Figure 2). This was a clear indication that the secreted pigment was also undergoing photochemical degradation under laser excitation. Minor differences that were observed could have 2 origins, either the excreted pigment contained some compounds that were not susceptible to laser induced bleaching, or there was a difference in the fluorescent pigment between strains (bleaching and washing were performed on different strains). More variants of pyoverdin are known to exist, both from molecular analyses and based on spatial conformations (bound to cell wall or free in cytoplasm) (6, 11–16). As indicated above, the wash out pigment will also contain other intercellular components besides pyoverdin.
Figure 2. The spectrum of the pigment obtained by bleaching (bottom) and by washing (top). The spectral features that are clearly observed in spectra from bacterial samples are indicated in shaded areas (identical to shaded areas in Figure 1).

37
Reproducibility of repeated measurements The reproducibility was analyzed using the ReproMatch value as defined in the Materials and methods section. When using either the bleachable component or the washed-out pigment to correct for spectral variance, both lead to a marked increase in the average ReproMatch value (Figure 3). The ReproMatch values increased 1.2% or 0.6% when the bleachable component or the washed out pigment was used respectively.
Figure 3. Improving intra- and inter-isolate similarities. From left to right: no interferent correction is performed, interferent correction using the bleachable component, interferent correction using the wash component. For each correction method the mean ± 1 standard deviation is presented. ReproMatch values are indicated by “1” on the horizontal axis, R
2 values between isolates are indicated by “2”.
In conclusion, we have come closer towards a protocol for strain level typing of P. aeruginosa, simply by adding a washing step to our protocol. All strains we have encountered so far could be measured without saturation of the detector in our currently used routine protocols. The pigment that is washed from the bacterial cells was the cause to the high fluorescence, and it is most likely pyoverdin. It has been descried that this pigment can be washed out (7). Both the previously described bleachable component (9) and the washed-out pigment can be used in the spectral interferent correction to improve the reproducibility of the measurements, although the bleachable component showed better results. Current research is focused at testing the developed protocol for analysis of clinical/outbreak related strain collections.
38
References 1. Holt, J.G., N.R. Krieg, P.H.A. Sneath, J.T. Staley, and S.T. Williams. 1994.
Bergey’s manual of determinative bacteriology. 9th ed. (Williams & Wilkins, Baltimore, USA).
2. Trouillet, J.L., A. Vuagnat, A. Combes, N. Kassis, J. Chastre, and C. Gibert. 2002. Pseudomonas aeruginosa ventilator-associated pneumonia: comparison of episodes due to Piperacillin-resistant versus Piperacillin-susceptible Organisms. Clin Infect Dis 34:1047–1054.
3. Bonten M.J., and R.A. Weinstein. 2002. Transmission pathways of Pseudomonas aeruginosa in intensive care units: don’t go near the water. Crit Care Med 30:2384–2385.
4. Bonten, M.J., D.C. Bergmans, H. Speijer, and E.E. Stobberingh. 1999. Characteristics of Polyclonal Endemicity of Pseudomonas aeruginosa Colonization in Intensive Care Units . Implications for Infection Control. Am J Respir Crit Care Med 160:1212–1219.
5. Speijer, H., P.H. Savelkoul, M.J. Bonten, E.E. Stobberingh, and J.H. Tjhie. 1999. Application of different genotyping methods for Pseudomonas aeruginosa in a setting of endemicity in an intensive care unit. J Clin Microbiol 37:3654–3661.
6. Ruangviriyachai, C., D. Fernndez, R. Fuchs, J.-M. Meyer, and H. Budzikiewicz. 2001. A new pyoverdin from Pseudomonas aeruginosa R'. Z. Naturforsch. Sect. C 56:933-938.
7. Cox, C.D., and P. Adams. 1985. Siderophore activity of pyoverdin for Pseudomonas aeruginosa. Infect Immun 48; 130–138.
8. Cody, Y.S., and D. C. Gross. 1987. Siderophore synthesis by mucoid Pseudomonas aeruginosa strains isolated from cystic fibrosis patients. Appl Environ Microbiol 53:928–934.
9. Scholtes-Timmerman, M.J., H.F.M. Willemse-Erix, T.C. Bakker- Schut, A. van Belkum, G. Puppels, and K. Maquelin. 2009. A novel approach to correct a-specific variations in Raman spectra due to photo-bleachable cellular components. Analyst 134:387–393.
10. Willemse-Erix, H.F.M., M.J. Scholtes-Timmerman, J.W. Jachtenberg, W.B. van Leeuwen, D. Horst-Kreft, T.C. Bakker-Schut, R.H. Deurenberg, G.J. Puppels, A. van Belkum, M.C. Vos, and K. Maquelin. 2009. Optical fingerprinting in bacterial epidemiology; Raman spectroscopy as a real-time typing method. J Clin Microbiol 47:652–659.
11. Yeterian, E., L.W. Martin, L. Guillon, L. Journet, I.L. Lamont, and I.J. Schalk. 2010. Synthesis of the siderophore pyoverdine in Pseudomonas aeruginosa involves a periplasmic maturation. Amino Acids 38(5):1447-1459.
12. Imperi, F., F. Tiburzi, and P. Visca. 2009. Molecular basis of pyoverdine siderophore recycling in Pseudomonas aeruginosa. Proc Natl Acad Sci USA 106:20440-20445.
13. Smith, E.E., E.H. Sims, D.H. Spencer, R. Kaul, and M.V. Olson. 2005. Evidence for diversifying selection at the pyoverdine locus of Pseudomonas aeruginosa. J Bacteriol 187:2138-2147.
14. Wasielewski, E., D.L. Tzou, B. Dillmann, J. Czaplicki, M.A. Abdallah, R.A. Atkinson, and B. Kieffer. 2008. Multiple conformations of the metal-bound pyoverdine Pvdl, a siderophore of Pseudomonas aeruginosa; a nuclear magnetic resonance study. Biochemistry 47:3397–3406.
15. Folschweiller, F., J. Gallay, M. Vincent, M.A. Abdallah, F. Pattus, and I.J. Schalk. 2002. The interaction between pyoverdin and its outer membrane receptor in
39
Pseudomonas aeruginosa leads to different conformers: a time-resolved fluorescence study. Biochemistry 41:14591–14601..
16. Schalk, I. J., C. Hennard, C. Dugave, K. Poole, M. A. Abdallah, and F. Pattus. 2001. Iron-free pyoverdin binds to its outer membrane receptor FpvA in Pseudomonas aeruginosa: a new mechanism for membrane iron transport. Mol Microbiol 39:351-360
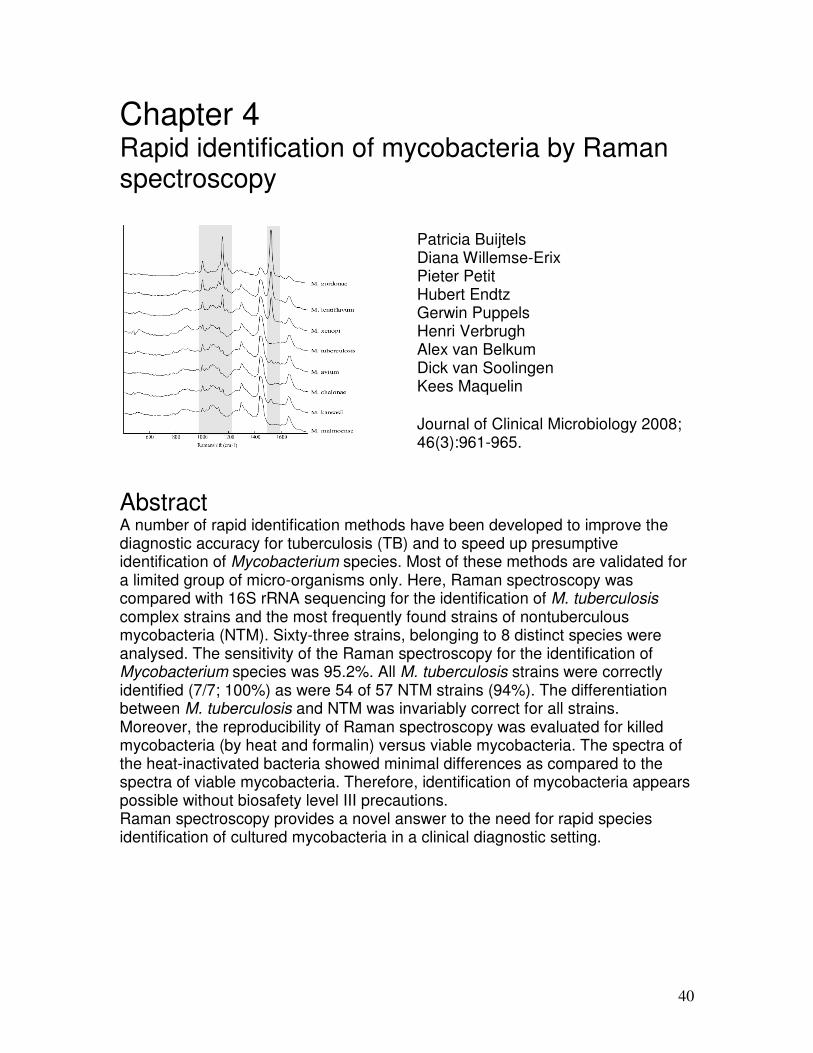
40
Chapter 4 Rapid identification of mycobacteria by Raman spectroscopy
Patricia Buijtels Diana Willemse-Erix Pieter Petit Hubert Endtz Gerwin Puppels Henri Verbrugh Alex van Belkum Dick van Soolingen Kees Maquelin
Journal of Clinical Microbiology 2008; 46(3):961-965.
Abstract A number of rapid identification methods have been developed to improve the diagnostic accuracy for tuberculosis (TB) and to speed up presumptive identification of Mycobacterium species. Most of these methods are validated for a limited group of micro-organisms only. Here, Raman spectroscopy was compared with 16S rRNA sequencing for the identification of M. tuberculosis complex strains and the most frequently found strains of nontuberculous mycobacteria (NTM). Sixty-three strains, belonging to 8 distinct species were analysed. The sensitivity of the Raman spectroscopy for the identification of Mycobacterium species was 95.2%. All M. tuberculosis strains were correctly identified (7/7; 100%) as were 54 of 57 NTM strains (94%). The differentiation between M. tuberculosis and NTM was invariably correct for all strains. Moreover, the reproducibility of Raman spectroscopy was evaluated for killed mycobacteria (by heat and formalin) versus viable mycobacteria. The spectra of the heat-inactivated bacteria showed minimal differences as compared to the spectra of viable mycobacteria. Therefore, identification of mycobacteria appears possible without biosafety level III precautions. Raman spectroscopy provides a novel answer to the need for rapid species identification of cultured mycobacteria in a clinical diagnostic setting.
41
Introduction Mycobacteria cause a variety of infections in humans. Classically defined lung tuberculosis (TB) is predominantly caused by M. tuberculosis complex. The number of new cases is estimated at nine million per year worldwide and the disease causes more than two million deaths annually (17). In addition, the incidence of pulmonary disease caused by nontuberculous mycobacteria (NTM) appears to be increasing worldwide (1, 6) . The clinical features of NTM-derived pulmonary disease are in some cases indistinguishable from that of tuberculosis. Because the treatment and the epidemiology of NTM-derived infections differ significantly from tuberculosis caused by M. tuberculosis complex bacteria, the timely and correct identification of causative organisms is mandatory for diagnosis, therapy and tuberculosis control. Conventional approaches to the diagnosis of mycobacterial infection rely on tests that are far from optimal. For example; sputum smear microscopy is insensitive, laborious and time-consuming. Culture is technically complex, time-consuming, has a sensitivity of only 80-85% and is scarcely available in high prevalence settings. Chest radiography is non-specific and not widely implemented either. Tuberculin skin testing is imprecise and the results are often non-specific (3). In the last decade, a number of rapid diagnostic tests have been developed in an effort to improve the diagnostic accuracy for TB and to speed up presumptive identification. PCR and other molecular amplification techniques are the most prominent among these new tools. While promising, none are more than adjunctive to the diagnosis of TB, since the sensitivity of these tests varies widely. The most reliable results are found when tests are applied to smear-positive specimens (2, 13) . In addition, these tests are specific for the detection of particular micro-organisms and not applicable to diagnose a wide spectrum of causative agents. Several commercial techniques are now available for species identification of M. tuberculosis complex and NTM. These techniques are fast but expensive and limited to selected, frequently encountered species, as is the case for the reverse line blot (RLB) assay (e.g. INNO-LiPA Mycobacteria; Innogenetics, Ghent, Belgium and GenoType Mycobacterium CM/AS, Hain Lifesience GmbH, Nehren, Germany), AMPLICOR nucleic acid amplification test (Roche Diagnostic Systems, Inc., Branchburg, New Jersey) and Gen-Probe Amplified Mycobacterium tuberculosis Direct Test (MTD) (Gen-Probe, San Diego, California) (2). For more rarely encountered Mycobacterium isolates DNA sequencing of the 16S rRNA gene is mostly used at mycobacteria reference laboratories. However, at peripheral laboratories implementation of 16S rRNA gene sequencing in routine practise has many drawbacks like high costs, complexity, lack of peer-reviewed databases and clear unambiguous interpretations. In view of these limitations, there is a continuing need for fast, simple alternatives which have the potential to be readily applicable to cultured bacteria from clinical material, enabling identification of a wide spectrum of micro-organisms.
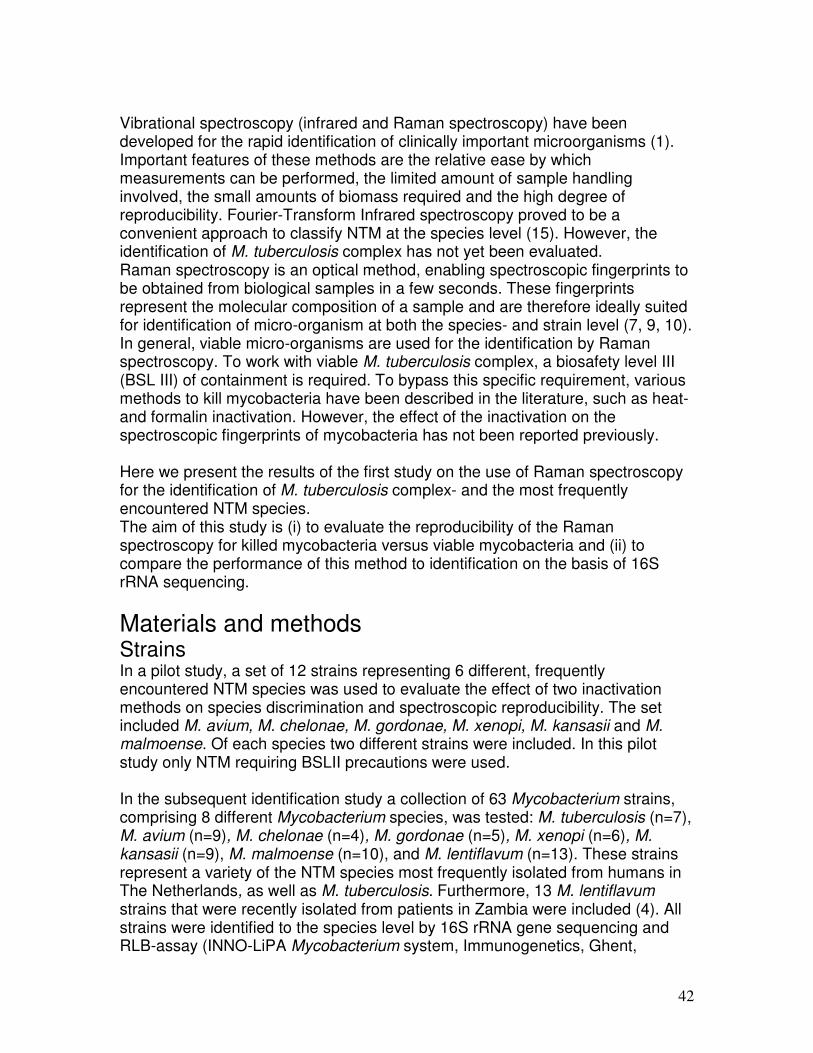
42
Vibrational spectroscopy (infrared and Raman spectroscopy) have been developed for the rapid identification of clinically important microorganisms (1). Important features of these methods are the relative ease by which measurements can be performed, the limited amount of sample handling involved, the small amounts of biomass required and the high degree of reproducibility. Fourier-Transform Infrared spectroscopy proved to be a convenient approach to classify NTM at the species level (15). However, the identification of M. tuberculosis complex has not yet been evaluated. Raman spectroscopy is an optical method, enabling spectroscopic fingerprints to be obtained from biological samples in a few seconds. These fingerprints represent the molecular composition of a sample and are therefore ideally suited for identification of micro-organism at both the species- and strain level (7, 9, 10). In general, viable micro-organisms are used for the identification by Raman spectroscopy. To work with viable M. tuberculosis complex, a biosafety level III (BSL III) of containment is required. To bypass this specific requirement, various methods to kill mycobacteria have been described in the literature, such as heat- and formalin inactivation. However, the effect of the inactivation on the spectroscopic fingerprints of mycobacteria has not been reported previously. Here we present the results of the first study on the use of Raman spectroscopy for the identification of M. tuberculosis complex- and the most frequently encountered NTM species. The aim of this study is (i) to evaluate the reproducibility of the Raman spectroscopy for killed mycobacteria versus viable mycobacteria and (ii) to compare the performance of this method to identification on the basis of 16S rRNA sequencing.
Materials and methods Strains In a pilot study, a set of 12 strains representing 6 different, frequently encountered NTM species was used to evaluate the effect of two inactivation methods on species discrimination and spectroscopic reproducibility. The set included M. avium, M. chelonae, M. gordonae, M. xenopi, M. kansasii and M. malmoense. Of each species two different strains were included. In this pilot study only NTM requiring BSLII precautions were used. In the subsequent identification study a collection of 63 Mycobacterium strains, comprising 8 different Mycobacterium species, was tested: M. tuberculosis (n=7), M. avium (n=9), M. chelonae (n=4), M. gordonae (n=5), M. xenopi (n=6), M. kansasii (n=9), M. malmoense (n=10), and M. lentiflavum (n=13). These strains represent a variety of the NTM species most frequently isolated from humans in The Netherlands, as well as M. tuberculosis. Furthermore, 13 M. lentiflavum strains that were recently isolated from patients in Zambia were included (4). All strains were identified to the species level by 16S rRNA gene sequencing and RLB-assay (INNO-LiPA Mycobacterium system, Immunogenetics, Ghent,
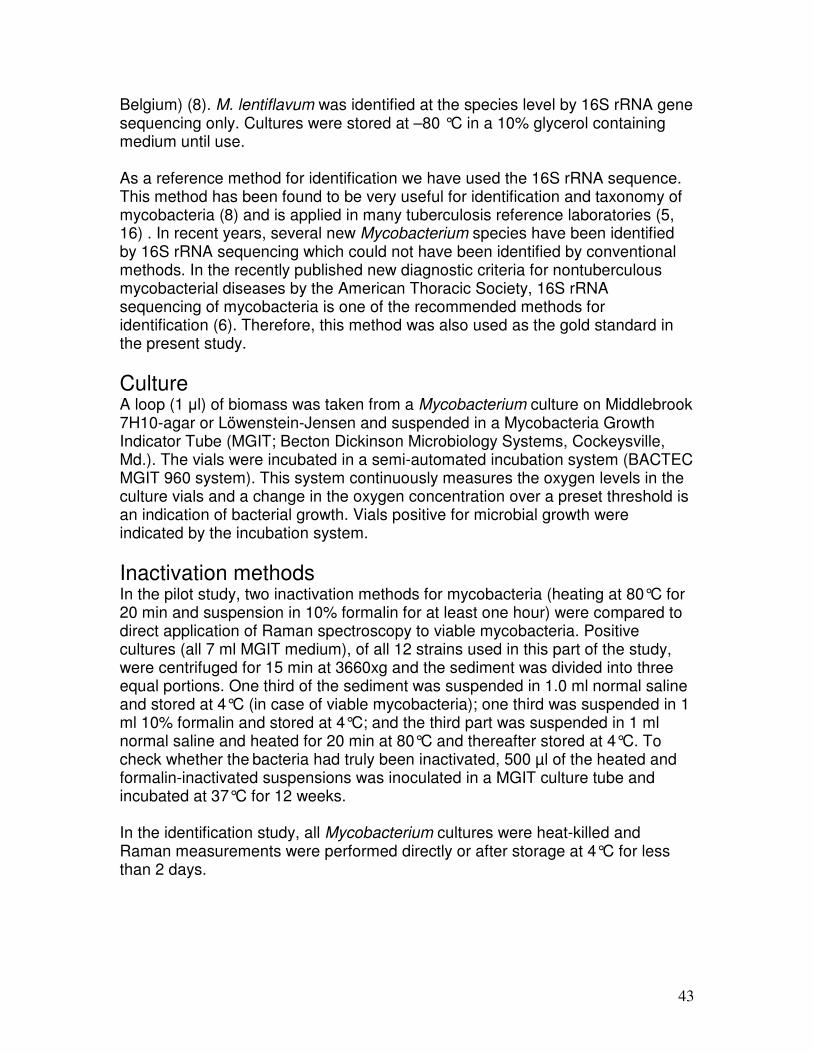
43
Belgium) (8). M. lentiflavum was identified at the species level by 16S rRNA gene sequencing only. Cultures were stored at –80 °C in a 10% glycerol containing medium until use. As a reference method for identification we have used the 16S rRNA sequence. This method has been found to be very useful for identification and taxonomy of mycobacteria (8) and is applied in many tuberculosis reference laboratories (5, 16) . In recent years, several new Mycobacterium species have been identified by 16S rRNA sequencing which could not have been identified by conventional methods. In the recently published new diagnostic criteria for nontuberculous mycobacterial diseases by the American Thoracic Society, 16S rRNA sequencing of mycobacteria is one of the recommended methods for identification (6). Therefore, this method was also used as the gold standard in the present study.
Culture A loop (1 µl) of biomass was taken from a Mycobacterium culture on Middlebrook 7H10-agar or Löwenstein-Jensen and suspended in a Mycobacteria Growth Indicator Tube (MGIT; Becton Dickinson Microbiology Systems, Cockeysville, Md.). The vials were incubated in a semi-automated incubation system (BACTEC MGIT 960 system). This system continuously measures the oxygen levels in the culture vials and a change in the oxygen concentration over a preset threshold is an indication of bacterial growth. Vials positive for microbial growth were indicated by the incubation system.
Inactivation methods In the pilot study, two inactivation methods for mycobacteria (heating at 80°C for 20 min and suspension in 10% formalin for at least one hour) were compared to direct application of Raman spectroscopy to viable mycobacteria. Positive cultures (all 7 ml MGIT medium), of all 12 strains used in this part of the study, were centrifuged for 15 min at 3660xg and the sediment was divided into three equal portions. One third of the sediment was suspended in 1.0 ml normal saline and stored at 4°C (in case of viable mycobacteria); one third was suspended in 1 ml 10% formalin and stored at 4°C; and the third part was suspended in 1 ml normal saline and heated for 20 min at 80°C and thereafter stored at 4°C. To check whether the bacteria had truly been inactivated, 500 µl of the heated and formalin-inactivated suspensions was inoculated in a MGIT culture tube and incubated at 37°C for 12 weeks. In the identification study, all Mycobacterium cultures were heat-killed and Raman measurements were performed directly or after storage at 4°C for less than 2 days.

44
Raman spectroscopy Before Raman measurements were performed, the samples were washed three times with aquadest (AD, prepared in-house). The sediment was suspended in 10 µl of AD and 4 µl was transferred to a fused silica glass slide and air dried, resulting in small pellets of biomass. Raman spectra were collected using a Model 2500 High Performance Raman Module (HPRM) (River Diagnostics BV, Rotterdam, The Netherlands), coupled to a custom-built inverted microscope stage, with an automated XY-stage (River Diagnostics) and operated using RiverICon software, version 1.63 (River Diagnostics, The Netherlands). The microscope contained a custom-designed microscope objective with a numerical aperture of 0.7, optimized for Raman experiments in the 750-1000 nm wavelength region, which focused laser light emitted by the Model 2500 HPRM in the samples on the fused silica slide. The objective also collected Raman scattered light from the samples. Samples were excited using laser light from a 785 nm diode laser (Sacher Lasertechnik, Marburg, Germany), delivering approximately 150 mW to the sample. The spectrometer was calibrated according to the manufacturer’s guidelines. Automated data collection and signal pre-treatment was performed using the RiverICon software, requiring approximately 1 minute per sample. Pre-treatment consisted of correction for the signal contribution of the fused silica substrate and scaling of all spectra using the extended multiplicative signal correction (EMSC) approach described by Martens and Stark (12). Briefly, all spectra were fitted to a representative Mycobacterium reference spectrum using a 7th order polynomial to correct for varying spectral backgrounds.
Identification and hierarchical cluster analysis The similarity between samples was calculated using the squared Pearson’s correlation coefficient (R2) between the representative spectra and then multiplied by 100 to be expressed as percentages (14). To evaluate the possibilities for species identification, a leave-one-out approach was used. In this approach the R2 of a sample to all other measured samples was calculated. The predicted species of a sample was assumed to be identical to the species of the sample with which the highest correlation occurred. This procedure was repeated for all measured samples and a cross table of the original and the predicted species was made. Hierarchical cluster analysis (HCA) on spectra was performed using the pair wise similarity matrix as distance matrix in combination with Ward’s cluster algorithm.
Reproducibility of Raman measurements In the pilot study all strains were cultured three times. The similarity between the spectra obtained from these replicates was used to evaluate the reproducibility of the Raman procedure compared to the inter-species similarity. Ideally, the intra-strain similarity is smaller than the intra-species similarity. To determine the intra-strain Raman reproducibility, we used the spectra obtained from the three

45
parallel cultures of one isolate. First the pair wise correlation coefficients between these three spectra were calculated (between spectrum 1 and 2, between spectrum 1 and 3, between spectrum 2 and 3). The mean of these three correlation coefficients is a measure for the intra-strain reproducibility. To determine the inter-species similarity, we calculated the mean spectrum of the first two isolates belonging to the same species. Then the pair wise correlation coefficients between this spectrum and the spectra of the other isolates in the pilot study were calculated. The mean value of these correlation coefficients is a measure for the similarity between the first species and all other species present in the study.
Data analysis All data analysis algorithms were programmed using MATLAB version 7.1 (The Mathworks, Natick, MA, USA) and the PLS toolbox 2.0 (Eigenvector Research Inc., Manson, WA, USA). To compare the intra-strain and inter-species similarities an unpaired Student t-test was used. A p-value of less than 0.05 was considered significant.
Results Pilot study Comparison of Raman spectroscopy spectra for inactivated and viable mycobacteria For biosafety reasons, the inactivation procedures were validated prior to further experiments. None of the heat-killed or formalin-inactivated Mycobacterium suspensions revealed growth in a liquid culture after incubation for 12 weeks. As a typical example, Raman spectra of a M. kansasii isolate after inactivation by formalin or heating in comparison to the procedure without inactivation are shown in Figure 1. No significant changes in the Raman spectra were seen after inactivation by heating, whereas formalin inactivation had a major influence on the Raman spectra. In general, the Raman spectra from the formalin inactivated samples were significantly different from the viable samples. There were some samples of which the formalin treatment did not induce major changes in the Raman spectra (data not shown). As the most robust approach, heat inactivation was selected as the method of choice for an evaluation of species identification capabilities of Raman spectroscopy.

46
Figure 1: Raman spectra of M. kansasii after inactivation with formalin and heating in comparison to the procedure without inactivation. Shaded areas indicate spectral region in which significant effects of formalin inactivation can be observed.
Classification of heat-killed and viable mycobacteria A HCA of the spectra obtained from the isolates used in the pilot study is shown in Figure 2. This figure represents spectra obtained from viable as well as heat-killed mycobacteria. It was possible to obtain good discrimination between the different species used in the pilot study. For all isolates spectra obtained from viable and heat-killed samples show low dissimilarities, indicating that the overall classification is not influenced by the pre-treatment.
Figure 2: Dendrogram of hierarchical cluster analysis of Raman spectra of the isolates used in the pilot study. Numbers refer to isolates of the collection of the national tuberculosis reference laboratory at the National Institute for Public Health and the Environment.
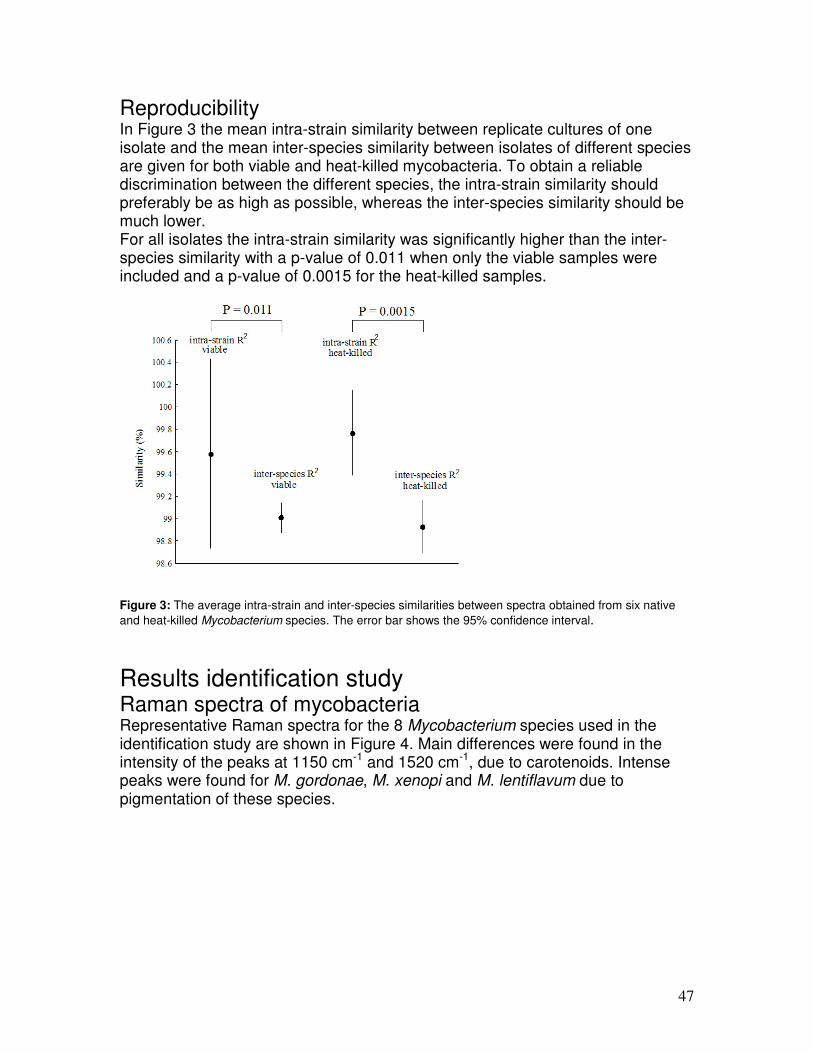
47
Reproducibility In Figure 3 the mean intra-strain similarity between replicate cultures of one isolate and the mean inter-species similarity between isolates of different species are given for both viable and heat-killed mycobacteria. To obtain a reliable discrimination between the different species, the intra-strain similarity should preferably be as high as possible, whereas the inter-species similarity should be much lower. For all isolates the intra-strain similarity was significantly higher than the inter-species similarity with a p-value of 0.011 when only the viable samples were included and a p-value of 0.0015 for the heat-killed samples.
Figure 3: The average intra-strain and inter-species similarities between spectra obtained from six native
and heat-killed Mycobacterium species. The error bar shows the 95% confidence interval.
Results identification study Raman spectra of mycobacteria Representative Raman spectra for the 8 Mycobacterium species used in the identification study are shown in Figure 4. Main differences were found in the intensity of the peaks at 1150 cm-1 and 1520 cm-1, due to carotenoids. Intense peaks were found for M. gordonae, M. xenopi and M. lentiflavum due to pigmentation of these species.
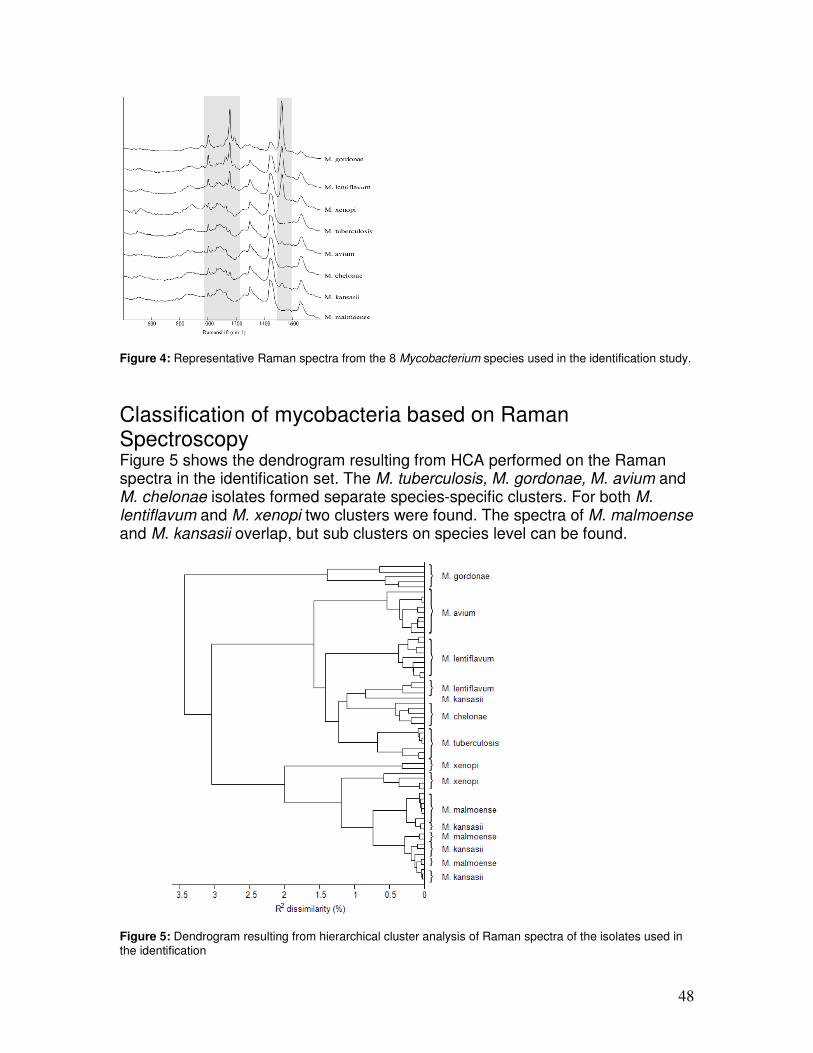
48
Figure 4: Representative Raman spectra from the 8 Mycobacterium species used in the identification study.
Classification of mycobacteria based on Raman Spectroscopy Figure 5 shows the dendrogram resulting from HCA performed on the Raman spectra in the identification set. The M. tuberculosis, M. gordonae, M. avium and M. chelonae isolates formed separate species-specific clusters. For both M. lentiflavum and M. xenopi two clusters were found. The spectra of M. malmoense and M. kansasii overlap, but sub clusters on species level can be found.
Figure 5: Dendrogram resulting from hierarchical cluster analysis of Raman spectra of the isolates used in the identification

49
Identification For species identification the R2 value was calculated for each isolate spectrum with every other isolate spectrum in the dataset. Each isolate to be classified is matched to the isolate in the dataset with the highest R2 value. The species identity of the isolate with which the highest R2 occurred determined the species of the tested isolate. The species identification obtained by 16S rRNA gene sequencing was used as the gold standard. This leave-one-out approach simulates the situation in a diagnostic setting where a new measurement is compared to an existing database. The overall sensitivity of this model was 95.2% (60 out of 63 strains, see Table 1 for more details). The differentiation between M. tuberculosis and NTM was correct for all strains. Within the group of NTM isolates three strains were misidentified: M. xenopi misidentified as M. malmoense; M. kansasii as M. lentiflavum, and M. gordonae as M. lentiflavum. Table 1. Classification of Mycobacterium species by 16S rRNA sequencing and Raman spectroscopy. The diagonal shows the number of strains predicted as the correct species (percentages of prediction are presented between brackets). Numbers out of the diagonal represent misclassified strains.
16S rRNA Raman identification sequencing M. tuberculosis M. avium M. chelonae M. gordonae M. kansassii M. malmoense M. xenopi M. lentiflavum
M. tuberculosis 7 (100%) M. avium 9 (100%) M. chelonae 4 (100%) M. gordonae 4 (80%) 1 (20%) M. kansassii 8 (89%) 1 (11%) M. malmoense 10 (100% M. xenopi 1 (17%) 5 (83%) M. lentiflavum 13 (100%)
Discussion Our Raman measurements indicate that efficient discrimination between Mycobacterium species can be made. Isolates belonging to a single species were grouped correctly into different clusters, corresponding to M. tuberculosis, the most relevant clinical species of NTM and M. lentiflavum. Overall, correct species identification was achieved in 95.2% of the samples within three hours of a positive signal of the automated culture system. The differentiation between M. tuberculosis and NTM was 100% accurate. As the treatment of NTM disease differs significantly from the treatment of TB, both the rapidity and the accuracy of this new assay are important assets. The spectra of the strains inactivated by heat-killing showed minimal differences when compared to the spectra of viable mycobacteria. Therefore, identification of mycobacteria was possible without biosafety III precautions during Raman measurements.
50
For 60 out of the 63 Mycobacterium strains analyzed, Raman spectroscopic identification corresponded to the molecular identification test. None of the three misidentifications can currently be explained. We suggest that although the DNA identification methods grouped these bacteria within single species, there still are considerable phenotypic differences between strains in a single species. More detailed DNA sequencing of bacteria sub-grouped by Raman may confirm this hypothesis. Further Raman studies with Mycobacterium isolates may reveal the accuracy of the method in discriminating more species. An extended spectral database containing more spectra of other M. tuberculosis complex and NTM strains with a larger number of isolates per species has to be established, as was already performed for other microorganisms (7, 10, 11). In addition, in our study only seven M. tuberculosis strains were analysed. The Raman spectroscopy correctly classified all strains, but larger studies will be necessary to confirm and extend these results. Future research will be based on extending the number of strains in the reference database. Fourier-Transform Infrared microspectroscopy was successfully used recently to differentiate NTM at the species level (15). To our knowledge, however, our data prove for the first time that Raman spectroscopy can be used for identification of mycobacteria, including M. tuberculosis complex. In addition to enabling rapid identification, vibrational spectroscopic techniques require virtually no sample handling or consumables and are, therefore, very cost-effective. This is in sharp contrast to other rapid identification techniques. Although regarded as the gold standard, 16S rRNA sequencing is not appropriate for routine analysis, due to its complexity and high costs. We conclude that Raman spectroscopy holds much promise for a rapid, accurate, and easy-to-use alternative for the identification of clinically relevant Mycobacterium species.
References 1. American Thoracic Society. 1997. Diagnosis and treatment of disease caused by
nontuberculous mycobacteria. Am J Respir Crit Care Med 156:S1-25. 2. American Thoracic Society Workshop. 1997. Rapid diagnostic tests for
tuberculosis: what is the appropriate use? Am J Respir Crit Care Med 155:1804-1814.
3. American Thoracic Society and the Centers for Disease Control and Prevention. 2000. Diagnostic Standards and Classification of Tuberculosis in Adults and Children. Am J Respir Crit Care Med 161:1376-1395.
4. Buijtels, P. C., P. L. Petit, H. A. Verbrugh, A. van Belkum, and D. van Soolingen. 2005. Isolation of nontuberculous mycobacteria in Zambia: eight case reports. J Clin Microbiol. 43:6020-6026.
5. Edwards, U., T. Rogall, H. Blocker, M. Emde, and E. C. Bottger. 1989. Isolation and direct complete nucleotide determination of entire genes. Characterization of a gene coding for 16S ribosomal RNA. Nucleic Acids Res. 17:7843-7853.
6. Griffith, D. E., T. Aksamit, B. A. Brown-Elliott, A. Catanzaro, C. Daley, F. Gordin, S. M. Holland, R. Horsburgh, G. Huitt, M. F. Iademarco, M. Iseman, K. Olivier, S.
51
Ruoss, C. F. von Reyn, R. J. Wallace, Jr., and K. Winthrop. 2007. An official ATS/IDSA statement: diagnosis, treatment, and prevention of nontuberculous mycobacterial diseases. Am J Respir Crit Care Med 175:367-416.
7. Ibelings, M. S., K. Maquelin, H. P. Endtz, H. A. Bruining, and G. J. Puppels. 2005. Rapid identification of Candida spp. in peritonitis patients by Raman spectroscopy. Clin Microbiol Infect 11:353-358.
8. Kirschner, P. and E. C. Bottger. 1998. Species identification of mycobacteria using rDNA sequencing. Methods Mol Biol 101:349-361.
9. Maquelin, K., L. Dijkshoorn, T. J. van der Reijden, and G. J. Puppels. 2006. Rapid epidemiological analysis of Acinetobacter strains by Raman spectroscopy. J Microbiol Methods 64:126-131.
10. Maquelin, K., C. Kirschner, L. P. Choo-Smith, N. A. Ngo-Thi, T. van Vreeswijk, M. Stammler, H. P. Endtz, H. A. Bruining, D. Naumann, and G. J. Puppels. 2003. Prospective study of the performance of vibrational spectroscopies for rapid identification of bacterial and fungal pathogens recovered from blood cultures. J Clin Microbiol 41:324-329.
11. Maquelin, K., C. Kirschner, L. P. Choo-Smith, B. N. van den, H. P. Endtz, D. Naumann, and G. J. Puppels. 2002. Identification of medically relevant microorganisms by vibrational spectroscopy. J Microbiol Methods 51:255-271.
12. Martens, H. and E. Stark. 1991. Extended multiplicative signal correction and spectral interference subtraction: new preprocessing methods for near infrared spectroscopy. J Pharm Biomed Anal 9:625-635.
13. Nahid, P., M. Pai, and P. C. Hopewell. 2006. Advances in the diagnosis and treatment of tuberculosis. Proc Am Thorac Soc 3:103-110.
14. Paerson, K. 1909. Determination of the coefficient of correlation. Science 30:23-25.
15. Rebuffo-Scheer, C. A., C. Kirschner, M. Staemmler, and D. Naumann. 2007. Rapid species and strain differentiation of non-tubercoulous mycobacteria by Fourier-Transform Infrared microspectroscopy. J Microbiol Methods 68:282-290.
16. Rogall, T., J. Wolters, T. Flohr, and E. C. Bottger. 1990. Towards a phylogeny and definition of species at the molecular level within the genus Mycobacterium. Int J Syst Bacteriol 40 :323-330.
17. World Health Organization. 2006. Global tuberculosis control: surveillance, planning, financing: WHO report 2006
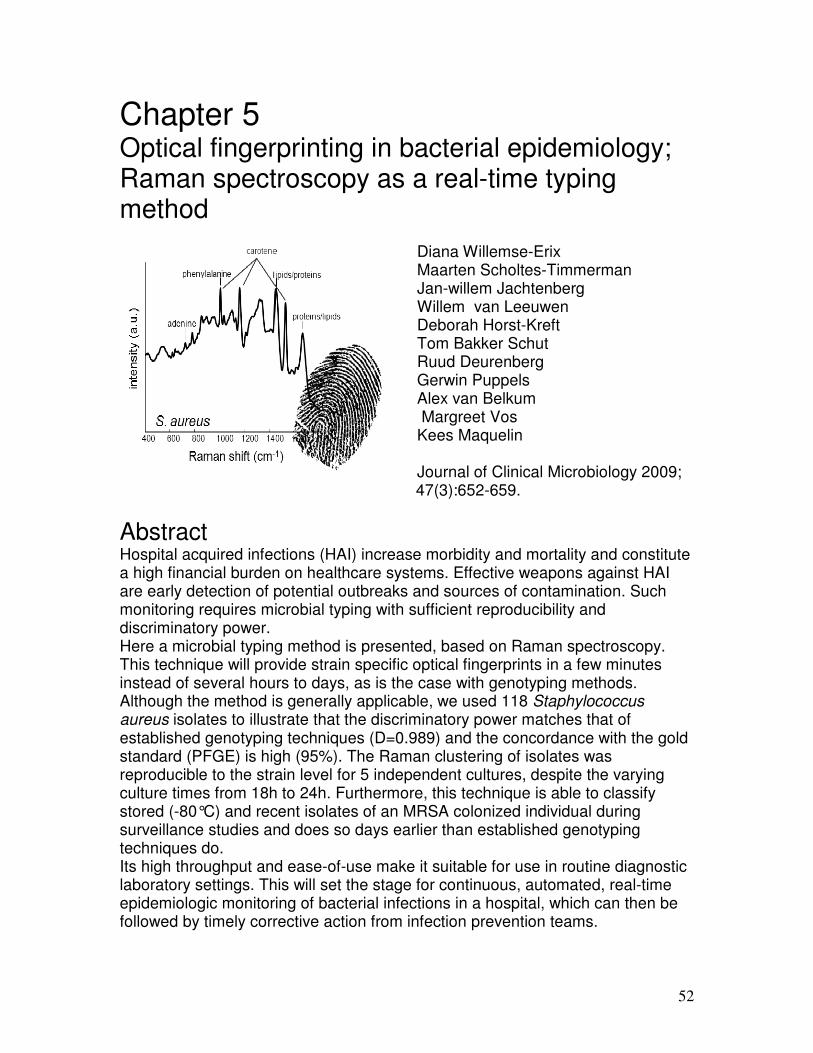
52
Chapter 5 Optical fingerprinting in bacterial epidemiology; Raman spectroscopy as a real-time typing method
Diana Willemse-Erix Maarten Scholtes-Timmerman Jan-willem Jachtenberg Willem van Leeuwen Deborah Horst-Kreft Tom Bakker Schut Ruud Deurenberg Gerwin Puppels Alex van Belkum Margreet Vos Kees Maquelin
Journal of Clinical Microbiology 2009; 47(3):652-659.
Abstract Hospital acquired infections (HAI) increase morbidity and mortality and constitute a high financial burden on healthcare systems. Effective weapons against HAI are early detection of potential outbreaks and sources of contamination. Such monitoring requires microbial typing with sufficient reproducibility and discriminatory power. Here a microbial typing method is presented, based on Raman spectroscopy. This technique will provide strain specific optical fingerprints in a few minutes instead of several hours to days, as is the case with genotyping methods. Although the method is generally applicable, we used 118 Staphylococcus aureus isolates to illustrate that the discriminatory power matches that of established genotyping techniques (D=0.989) and the concordance with the gold standard (PFGE) is high (95%). The Raman clustering of isolates was reproducible to the strain level for 5 independent cultures, despite the varying culture times from 18h to 24h. Furthermore, this technique is able to classify stored (-80°C) and recent isolates of an MRSA colonized individual during surveillance studies and does so days earlier than established genotyping techniques do. Its high throughput and ease-of-use make it suitable for use in routine diagnostic laboratory settings. This will set the stage for continuous, automated, real-time epidemiologic monitoring of bacterial infections in a hospital, which can then be followed by timely corrective action from infection prevention teams.
53
Introduction Hospital acquired infections (HAI) are among the most pressing problems in modern healthcare. Up to 10% of all admitted patients become infected while hospitalized, with incidences of 30% being reported in intensive care units (8, 23). These infections cause a significant increase in morbidity and mortality and also have a considerable impact on the costs of health care (4, 5, 16, 22). Direct medical costs per patient of between 27 and 35 k$ have been reported (5). Up to 30% of HAI is caused by transmission and can therefore be prevented by means of infection control strategies (6). Several studies have emphasized the importance of active screening of patients in order to identify transmission of microorganisms. This will detect possible cases of cross-transmission and thereby indicate the infection control measures to be taken, including isolation of patients (1, 2). Rapid assessment of microbial clonal relationships (typing) enables tracking of the spread of pathogens, which may be used to significantly decrease the number of HAI and additional costs, even in high risk situations(14, 17). Methicillin resistant Staphylococcus aureus (MRSA) is a leading cause of HAI, and numerous DNA-based typing methods have been developed for this organism. Therefore, we use MRSA as an example to demonstrate the capabilities of a new typing method. Pulsed field gel electrophoresis (PFGE) is generally the most preferred typing method (9), followed by multilocus sequence typing (MLST) and spa typing. All these techniques require dedicated facilities, are labor-intensive, have a long turnaround time (48 to 72 hours when starting from a pure culture) and a low sample throughput. Therefore, they are unsuitable for routine use in hospitals and consequently mostly applied in retrospective analysis of outbreak situations. An ideal typing method should be rapid and simple, have a high throughput, a good discriminatory power and should provide results that are in concordance with the epidemiological data (19). We present a novel approach to meet these requirements, based on Raman spectroscopy. Raman spectra of bacteria are a representation of their overall molecular composition and can be used as highly specific spectroscopic fingerprints. We used 4 different collections of methicillin-sensitive and -resistant S. aureus isolates to demonstrate effectiveness of Raman spectroscopy as a typing tool that could be used in epidemiologic surveillance studies and conclude that this technique is an easy-to-use and rapid alternative in the battle against MRSA.
Materials and methods Bacterial strain collections Four different strain collections were used in this study. Collection I was used as a reference collection and contained 20 well-characterized MRSA isolates. These isolates have previously been analyzed using multiple typing techniques (21) and have been used to determine the inter-laboratory reproducibility of PFGE in a multi-center study (20). This collection contains 5 isolates with identical PFGE patterns, 5 isolates with related PFGE
54
patterns (patterns that differ by ≤ 3 bands) and 10 unrelated isolates (patterns that differ by > 3 bands). Collection II was obtained from the Department of Medical Microbiology and Infectious Diseases of the Erasmus University Medical Center (Erasmus MC, Rotterdam, The Netherlands) and included all 78 MRSA isolates collected in the year 2002 in this tertiary care Dutch hospital. The isolates were retrieved from patients as well as from Health care workers. All isolates have been analyzed independently using PFGE at the Department of Medical Microbiology at the Erasmus MC as well as at the Dutch National Institute for Public Health and the Environment (RIVM). Collection III was obtained from the Department of Microbiology at the University Hospital Maastricht, the Netherlands and contained 5 isolates retrieved from a MRSA-colonized member of the hospital staff collected over a period of 18 months, and 4 isolates obtained from different patients during an MRSA-contact screening. Collection IV contained 4 MRSA-isolates (one from a patient and 3 from a colonized staff member) and 7 MSSA isolates obtained during an MRSA contact screening in January 2007 at the Erasmus MC.
Storage and culture Isolates were stored at –80°C in brain-heart infusion broth (Becton Dickinson, Franklin Lakes, New Jersey, USA), containing 10% glycerol, until use. For Raman measurements, all isolates were grown overnight on Trypticase Soy agar (Becton Dickinson, Franklin Lakes, NJ, USA). After this first culture was checked for purity, 3-5 colonies were picked to fill a calibrated 1µl loop and suspended in 20 µl of sterilized demineralised water (AD, prepared in-house). This suspension was diluted 100x in AD and 20 µl was plated onto a TSA plate. These plates were incubated for 20h at 35°C to obtain a confluent bacterial layer.
Pulsed-field gel electrophoresis (PFGE) PFGE was performed according to the Harmony protocol (3). Briefly, a suspension of bacteria was mixed with 1% InCert agarose (FMC Bioproducts, Rockland, USA). Agarose plugs were incubated with lysostaphine (Sigma-Aldrich, Zwijndrecht, The Netherlands) and spheroplasts were lysed using proteinase K (Sigma-Aldrich). DNA was digested by SmaI (Fermentas, St. Leon-Rot, Germany). Macro-restriction fragments were separated using a BioRad CHEF Mapper (BioRad, Veenendaal, The Netherlands) with a total run time of 20h. PFGE patterns were assigned based on unique patterns (19).
spa-Typing Real-time amplification of the spa locus, followed by sequencing was performed as described before (15). The spa types were clustered into spa-CCs using the algorithm Based Upon Repeat Pattern (BURP) with the Ridom StaphType version 1.5 software package (http://www.ridom.de). The default settings recommended by the manufacturer were used. The associated CCs, as
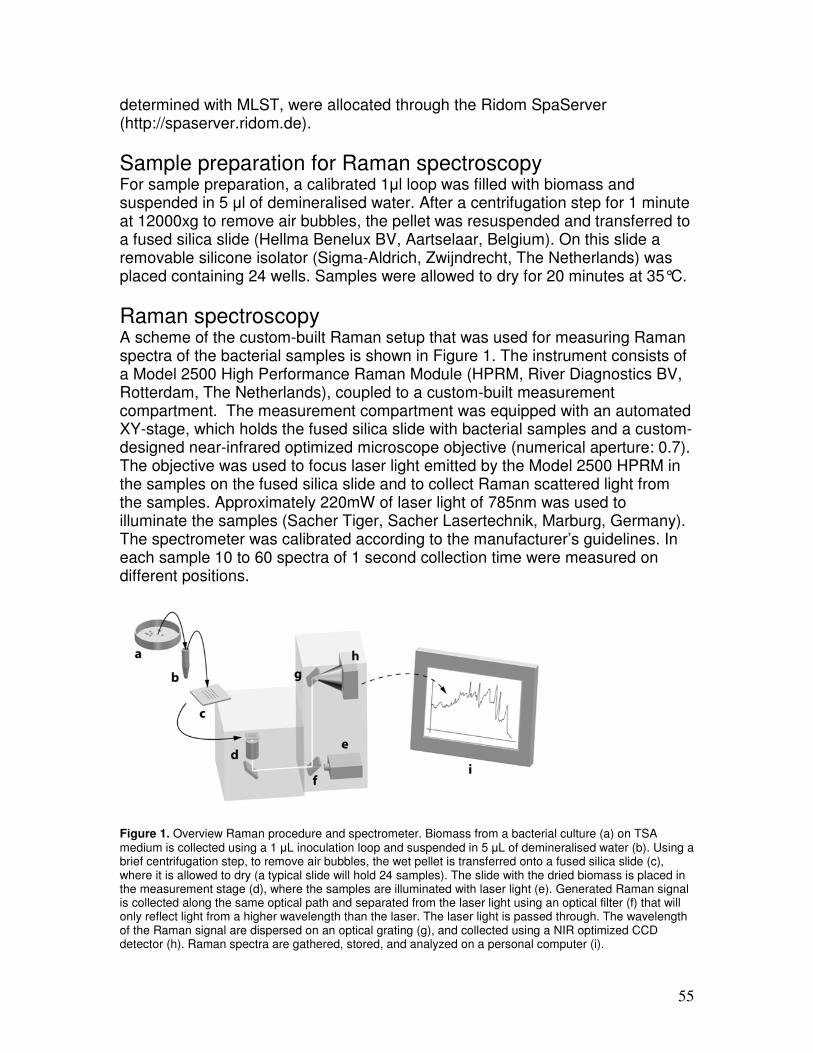
55
determined with MLST, were allocated through the Ridom SpaServer (http://spaserver.ridom.de).
Sample preparation for Raman spectroscopy For sample preparation, a calibrated 1µl loop was filled with biomass and suspended in 5 µl of demineralised water. After a centrifugation step for 1 minute at 12000xg to remove air bubbles, the pellet was resuspended and transferred to a fused silica slide (Hellma Benelux BV, Aartselaar, Belgium). On this slide a removable silicone isolator (Sigma-Aldrich, Zwijndrecht, The Netherlands) was placed containing 24 wells. Samples were allowed to dry for 20 minutes at 35°C.
Raman spectroscopy A scheme of the custom-built Raman setup that was used for measuring Raman spectra of the bacterial samples is shown in Figure 1. The instrument consists of a Model 2500 High Performance Raman Module (HPRM, River Diagnostics BV, Rotterdam, The Netherlands), coupled to a custom-built measurement compartment. The measurement compartment was equipped with an automated XY-stage, which holds the fused silica slide with bacterial samples and a custom-designed near-infrared optimized microscope objective (numerical aperture: 0.7). The objective was used to focus laser light emitted by the Model 2500 HPRM in the samples on the fused silica slide and to collect Raman scattered light from the samples. Approximately 220mW of laser light of 785nm was used to illuminate the samples (Sacher Tiger, Sacher Lasertechnik, Marburg, Germany). The spectrometer was calibrated according to the manufacturer’s guidelines. In each sample 10 to 60 spectra of 1 second collection time were measured on different positions.
Figure 1. Overview Raman procedure and spectrometer. Biomass from a bacterial culture (a) on TSA medium is collected using a 1 µL inoculation loop and suspended in 5 µL of demineralised water (b). Using a brief centrifugation step, to remove air bubbles, the wet pellet is transferred onto a fused silica slide (c), where it is allowed to dry (a typical slide will hold 24 samples). The slide with the dried biomass is placed in the measurement stage (d), where the samples are illuminated with laser light (e). Generated Raman signal is collected along the same optical path and separated from the laser light using an optical filter (f) that will only reflect light from a higher wavelength than the laser. The laser light is passed through. The wavelength of the Raman signal are dispersed on an optical grating (g), and collected using a NIR optimized CCD detector (h). Raman spectra are gathered, stored, and analyzed on a personal computer (i).

56
Data analysis Signal pre-processing Measured spectra contained 3 sources of non-informative signal variance; the signal contribution from the fused silica substrate, a varying broad band background signal of the Raman spectra of the bacteria and varying signal contributions obtained from the carotenoids in the S. aureus –cells. Elimination of this non-informative signal variance is described in detail elsewhere(18). It is based on the use of Extended Multiplicative Scattering Correction (EMSC-SIS) (12), and also uses the sensitivity to photodecomposition of carotenoids. The resulting spectra all had identical spectral backgrounds and carotenoid signal intensities. Software scripts for spectrum pre-treatment and data analysis were written in MATLAB version 7.1 (The Mathworks, Natick, MA).
Calculation of similarities between spectra The similarity between pairs of spectra was calculated using the squared Pearson correlation coefficient (R2) and multiplied by 100 to be expressed as percentages.
Hierarchical cluster analysis (HCA) Cluster analysis of sets of spectra was performed using the pair wise similarities as a distance matrix in combination with Ward’s cluster algorithm. This results in a dendrogram in which each node represents the lowest correlation coefficient (or similarity) between all isolates combined in the cluster defined by this node. For each isolate collection, the 5 genetically identical isolates of collection I were measured and analyzed simultaneously and used to indicate clusters, or Raman types. The individual steps of this process are:
1. Define the node were the 5 identical reference isolates of collection I combine in the dendrogram.
2. The correlation coefficient represented by this node is used as a cut-off value in the dendrogram.
3. All isolates combined in a cluster of which the value of the node is higher than the correlation coefficient found for the reference isolates are considered to be indistinguishable.
4. All clusters defined with this procedure can then be validated using previously known typing results of the isolates, epidemiological data or a collection of reference isolates.
Discriminatory power The discriminatory power of a typing method is defined as its ability to assign a different type to two unrelated strains (19). To quantify the discriminatory power of Raman spectroscopy the numerical index of diversity (D) was calculated as described by Hunter and Gaston (7).
57
Experiments applied to evaluate Raman spectroscopy Reproducibility, influence of culturing time Raman spectra represent the overall molecular composition of bacterial cells. Since differences in culture conditions may influence the metabolic pathways and therefore the molecular makeup of bacterial cells, changes in growing conditions may lead to changes in spectra and negatively affect the reproducibility of the Raman procedure. Two MRSA isolates with an identical PFGE pattern and three MRSA isolates with unique PFGE patterns were selected from collection I to evaluate the reproducibility of the Raman technique. All isolates were cultured in 5 independent sessions and in each session samples were prepared and measured after 18h, 20h, 22h and 24h of incubation time, yielding a total of 20 samples for each isolate.
Reproducibility and concordance with other typing techniques PFGE is considered the gold standard for typing of S. aureus isolates. Therefore, the 20 MRSA isolates of reference collection I were used to compare the results for the Raman typing with previously obtained typing results (21).
Experiments to evaluate the application of Raman spectroscopy in epidemiological surveillance Retrospective study; concordance with clinical epidemiology The 78 clinical MRSA isolates of collection II were used to validate the concordance of Raman typing with clinical epidemiological data.
Historical isolates Collection III contains MRSA isolates obtained from a staff member that were collected over a period of 18 months. These isolates were used to evaluate the ability of Raman spectroscopy to recognize historical and recent isolates from a colonized person.
Prospective study; comparative typing Collection IV represents isolates obtained during an MRSA contact screening and was used to validate Raman spectroscopy to assess relatedness within a small set of isolates (comparative typing) in a possible outbreak situation.
Results Experiments were carried out to test the reproducibility of Raman spectroscopy, its discriminatory power in comparison with established typing techniques such as PFGE and spa typing and its concordance with epidemiological data.
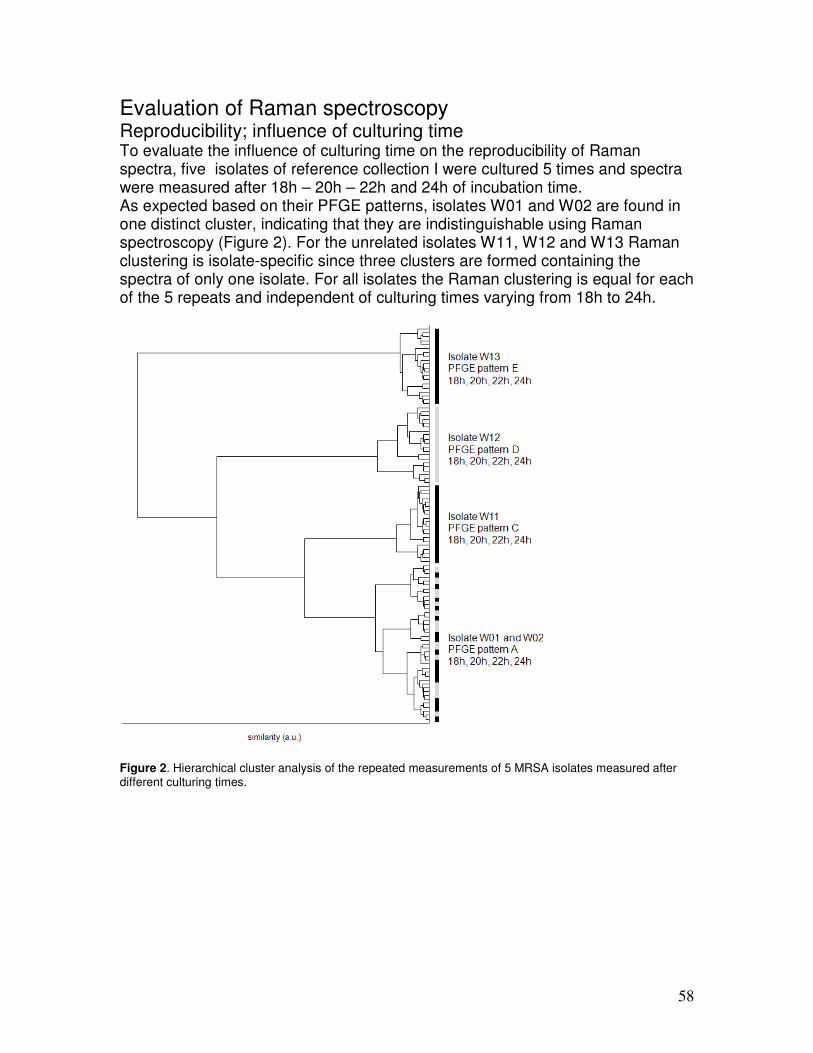
58
Evaluation of Raman spectroscopy Reproducibility; influence of culturing time To evaluate the influence of culturing time on the reproducibility of Raman spectra, five isolates of reference collection I were cultured 5 times and spectra were measured after 18h – 20h – 22h and 24h of incubation time. As expected based on their PFGE patterns, isolates W01 and W02 are found in one distinct cluster, indicating that they are indistinguishable using Raman spectroscopy (Figure 2). For the unrelated isolates W11, W12 and W13 Raman clustering is isolate-specific since three clusters are formed containing the spectra of only one isolate. For all isolates the Raman clustering is equal for each of the 5 repeats and independent of culturing times varying from 18h to 24h.
Figure 2. Hierarchical cluster analysis of the repeated measurements of 5 MRSA isolates measured after different culturing times.

59
Reproducibility and concordance with PFGE In Figure 3 the results are shown of a hierarchical cluster analysis performed on the Raman spectra of the 20 MRSA isolates of reference collection I. One distinct cluster is found containing the repeated measurements of the PFGE identical isolates W01-to-W05, indicating that they are also indistinguishable using Raman spectroscopy. The lowest correlation coefficient between spectra in this cluster is 99.9348. Taking this value as a cut-off to determine Raman types, PFGE-related isolates W07/W09 were both classified as Raman type 7 and PFGE-related isolates W06/W08 as Raman type 8. The remaining PFGE-related isolate W10 and the 10 non-related isolates were found in separate clusters and therefore assigned a unique Raman type. In total, 14 different Raman types were assigned in this collection compared to 16 unique PFGE patterns or 11 PFGE types based on ≤ 3 bands difference between patterns (20). For this collection the diversity index was calculated according to Hunter & Gaston (7). Although the number of isolates is low, we see that Raman spectroscopy scored highly (D-value = 0.989).
Figure 3. Hierarchical cluster analysis of the MRSA isolates of collection I. Clusters are indicated in grey and based on the correlation coefficient of the 5 isolates with identical PFGE patterns A. For each node with a correlation coefficient lower than the cut-off, de corresponding value is indicated.
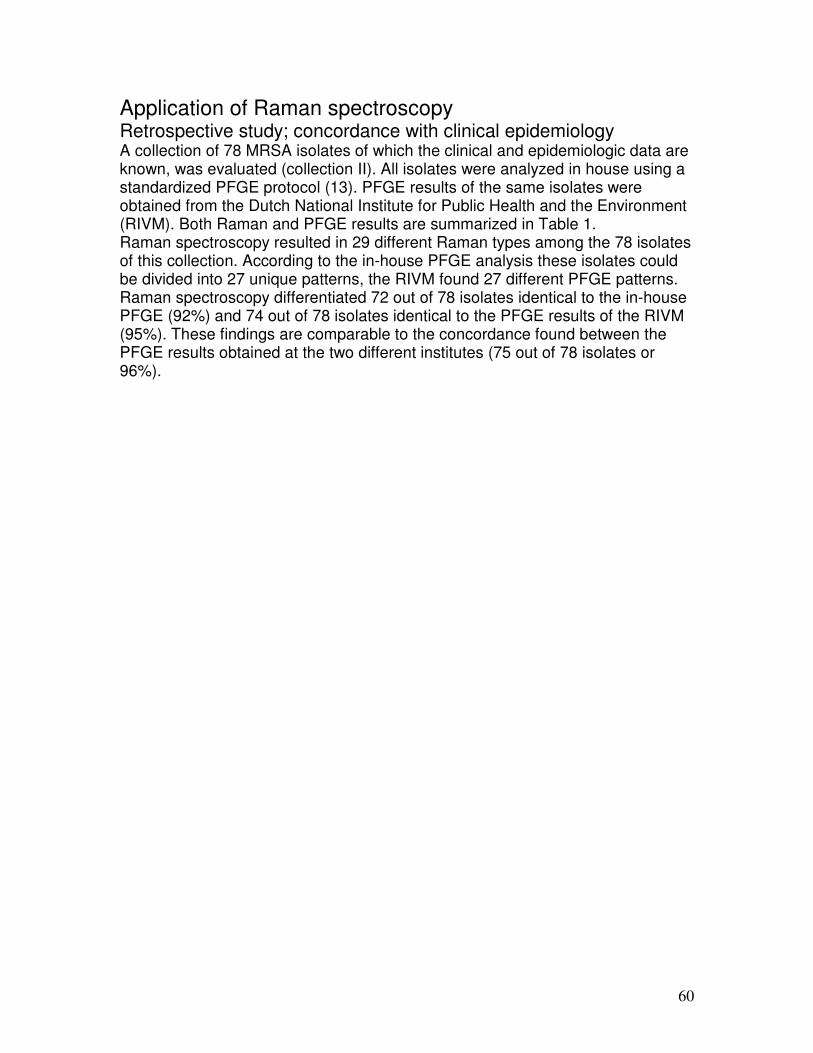
60
Application of Raman spectroscopy Retrospective study; concordance with clinical epidemiology A collection of 78 MRSA isolates of which the clinical and epidemiologic data are known, was evaluated (collection II). All isolates were analyzed in house using a standardized PFGE protocol (13). PFGE results of the same isolates were obtained from the Dutch National Institute for Public Health and the Environment (RIVM). Both Raman and PFGE results are summarized in Table 1. Raman spectroscopy resulted in 29 different Raman types among the 78 isolates of this collection. According to the in-house PFGE analysis these isolates could be divided into 27 unique patterns, the RIVM found 27 different PFGE patterns. Raman spectroscopy differentiated 72 out of 78 isolates identical to the in-house PFGE (92%) and 74 out of 78 isolates identical to the PFGE results of the RIVM (95%). These findings are comparable to the concordance found between the PFGE results obtained at the two different institutes (75 out of 78 isolates or 96%).
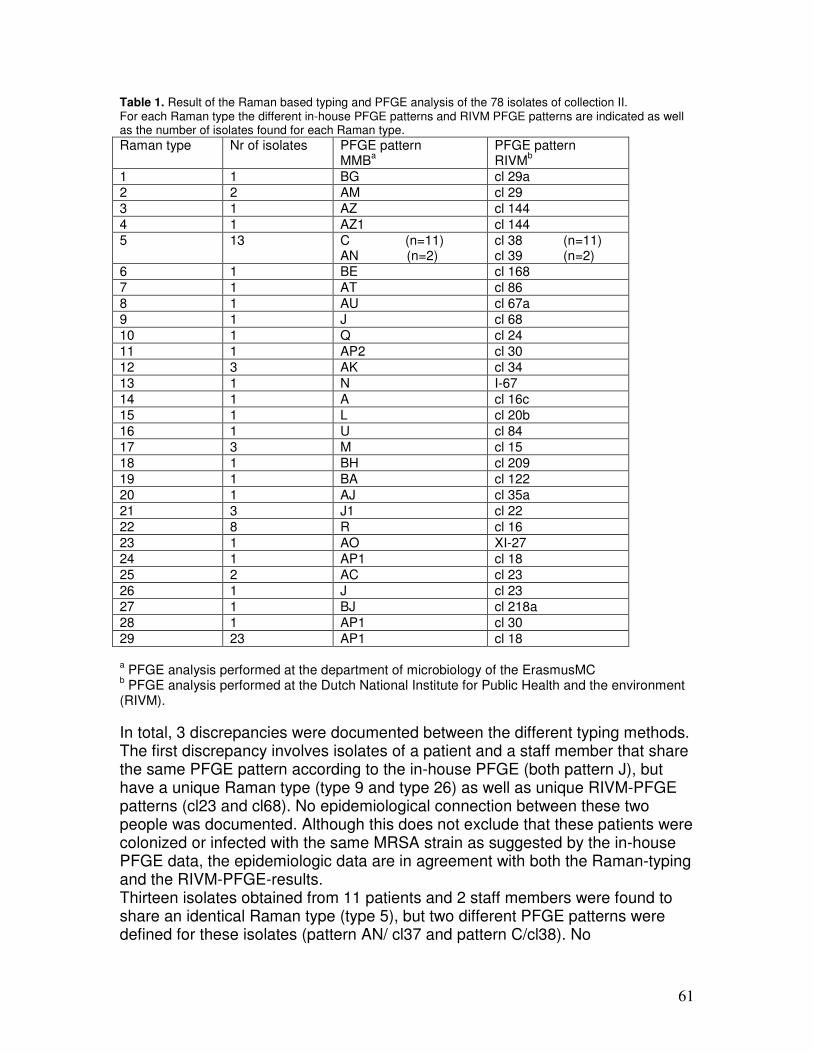
61
Table 1. Result of the Raman based typing and PFGE analysis of the 78 isolates of collection II. For each Raman type the different in-house PFGE patterns and RIVM PFGE patterns are indicated as well as the number of isolates found for each Raman type. Raman type Nr of isolates PFGE pattern
MMBa
PFGE pattern RIVM
b
1 1 BG cl 29a 2 2 AM cl 29 3 1 AZ cl 144 4 1 AZ1 cl 144 5 13 C (n=11)
AN (n=2) cl 38 (n=11) cl 39 (n=2)
6 1 BE cl 168 7 1 AT cl 86 8 1 AU cl 67a 9 1 J cl 68 10 1 Q cl 24 11 1 AP2 cl 30 12 3 AK cl 34 13 1 N I-67 14 1 A cl 16c 15 1 L cl 20b 16 1 U cl 84 17 3 M cl 15 18 1 BH cl 209 19 1 BA cl 122 20 1 AJ cl 35a 21 3 J1 cl 22 22 8 R cl 16 23 1 AO XI-27 24 1 AP1 cl 18 25 2 AC cl 23 26 1 J cl 23 27 1 BJ cl 218a 28 1 AP1 cl 30 29 23 AP1 cl 18 a PFGE analysis performed at the department of microbiology of the ErasmusMC
b PFGE analysis performed at the Dutch National Institute for Public Health and the environment
(RIVM).
In total, 3 discrepancies were documented between the different typing methods. The first discrepancy involves isolates of a patient and a staff member that share the same PFGE pattern according to the in-house PFGE (both pattern J), but have a unique Raman type (type 9 and type 26) as well as unique RIVM-PFGE patterns (cl23 and cl68). No epidemiological connection between these two people was documented. Although this does not exclude that these patients were colonized or infected with the same MRSA strain as suggested by the in-house PFGE data, the epidemiologic data are in agreement with both the Raman-typing and the RIVM-PFGE-results. Thirteen isolates obtained from 11 patients and 2 staff members were found to share an identical Raman type (type 5), but two different PFGE patterns were defined for these isolates (pattern AN/ cl37 and pattern C/cl38). No
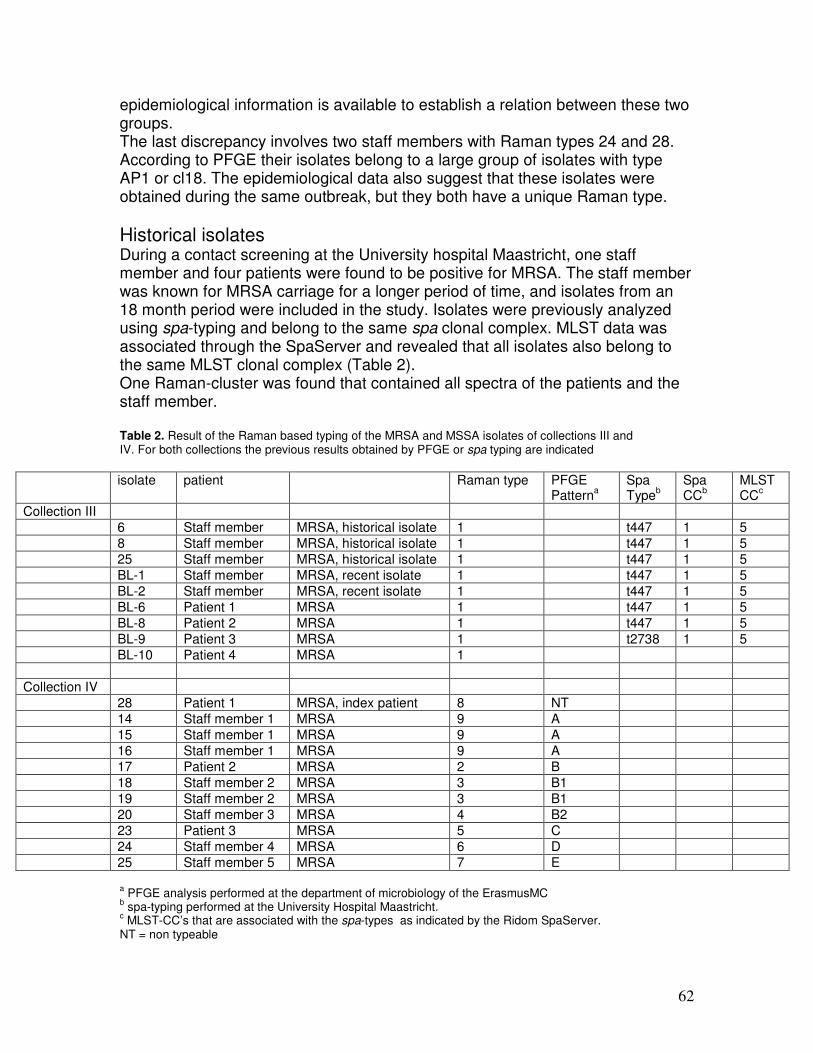
62
epidemiological information is available to establish a relation between these two groups. The last discrepancy involves two staff members with Raman types 24 and 28. According to PFGE their isolates belong to a large group of isolates with type AP1 or cl18. The epidemiological data also suggest that these isolates were obtained during the same outbreak, but they both have a unique Raman type.
Historical isolates During a contact screening at the University hospital Maastricht, one staff member and four patients were found to be positive for MRSA. The staff member was known for MRSA carriage for a longer period of time, and isolates from an 18 month period were included in the study. Isolates were previously analyzed using spa-typing and belong to the same spa clonal complex. MLST data was associated through the SpaServer and revealed that all isolates also belong to the same MLST clonal complex (Table 2). One Raman-cluster was found that contained all spectra of the patients and the staff member. Table 2. Result of the Raman based typing of the MRSA and MSSA isolates of collections III and IV. For both collections the previous results obtained by PFGE or spa typing are indicated
isolate patient Raman type PFGE
Patterna
Spa Type
b Spa CC
b MLST CC
c
Collection III 6 Staff member MRSA, historical isolate 1 t447 1 5 8 Staff member MRSA, historical isolate 1 t447 1 5 25 Staff member MRSA, historical isolate 1 t447 1 5 BL-1 Staff member MRSA, recent isolate 1 t447 1 5 BL-2 Staff member MRSA, recent isolate 1 t447 1 5 BL-6 Patient 1 MRSA 1 t447 1 5 BL-8 Patient 2 MRSA 1 t447 1 5 BL-9 Patient 3 MRSA 1 t2738 1 5 BL-10 Patient 4 MRSA 1 Collection IV 28 Patient 1 MRSA, index patient 8 NT 14 Staff member 1 MRSA 9 A 15 Staff member 1 MRSA 9 A 16 Staff member 1 MRSA 9 A 17 Patient 2 MRSA 2 B 18 Staff member 2 MRSA 3 B1 19 Staff member 2 MRSA 3 B1 20 Staff member 3 MRSA 4 B2 23 Patient 3 MRSA 5 C 24 Staff member 4 MRSA 6 D 25 Staff member 5 MRSA 7 E
a PFGE analysis performed at the department of microbiology of the ErasmusMC
b spa-typing performed at the University Hospital Maastricht.
c MLST-CC’s that are associated with the spa-types as indicated by the Ridom SpaServer.
NT = non typeable
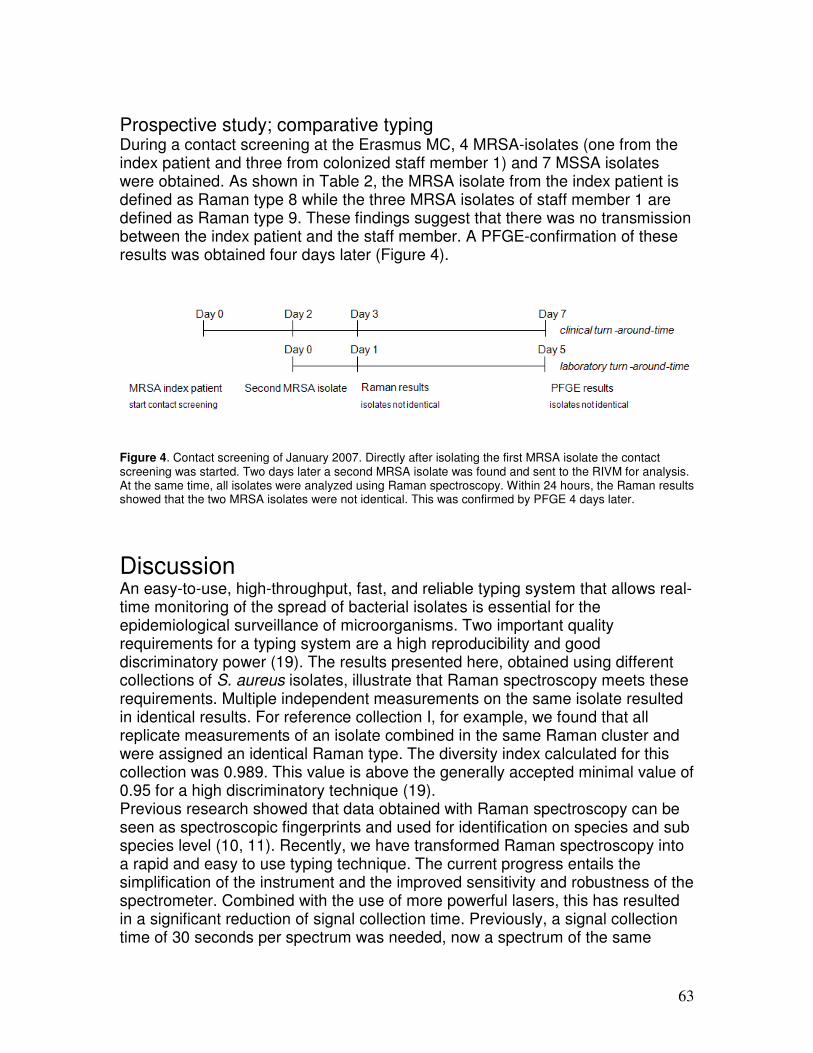
63
Prospective study; comparative typing During a contact screening at the Erasmus MC, 4 MRSA-isolates (one from the index patient and three from colonized staff member 1) and 7 MSSA isolates were obtained. As shown in Table 2, the MRSA isolate from the index patient is defined as Raman type 8 while the three MRSA isolates of staff member 1 are defined as Raman type 9. These findings suggest that there was no transmission between the index patient and the staff member. A PFGE-confirmation of these results was obtained four days later (Figure 4).
Figure 4. Contact screening of January 2007. Directly after isolating the first MRSA isolate the contact screening was started. Two days later a second MRSA isolate was found and sent to the RIVM for analysis. At the same time, all isolates were analyzed using Raman spectroscopy. Within 24 hours, the Raman results showed that the two MRSA isolates were not identical. This was confirmed by PFGE 4 days later.
Discussion An easy-to-use, high-throughput, fast, and reliable typing system that allows real-time monitoring of the spread of bacterial isolates is essential for the epidemiological surveillance of microorganisms. Two important quality requirements for a typing system are a high reproducibility and good discriminatory power (19). The results presented here, obtained using different collections of S. aureus isolates, illustrate that Raman spectroscopy meets these requirements. Multiple independent measurements on the same isolate resulted in identical results. For reference collection I, for example, we found that all replicate measurements of an isolate combined in the same Raman cluster and were assigned an identical Raman type. The diversity index calculated for this collection was 0.989. This value is above the generally accepted minimal value of 0.95 for a high discriminatory technique (19). Previous research showed that data obtained with Raman spectroscopy can be seen as spectroscopic fingerprints and used for identification on species and sub species level (10, 11). Recently, we have transformed Raman spectroscopy into a rapid and easy to use typing technique. The current progress entails the simplification of the instrument and the improved sensitivity and robustness of the spectrometer. Combined with the use of more powerful lasers, this has resulted in a significant reduction of signal collection time. Previously, a signal collection time of 30 seconds per spectrum was needed, now a spectrum of the same
64
quality can be obtained with a signal collection time of 1 second. Furthermore, a general procedure has been developed that is similar to the procedures used today in diagnostic microbiology laboratories. The protocols can be applied to a wide range of organisms, since there is no need for specific labels, dyes or special laboratory equipment, other than the Raman spectrometer. Starting from positive microbial cultures, sample preparation of 24 isolates will take approximately 45 minutes including 30 minutes hands on time. Raman spectra are collected automatically and this usually takes 10 seconds to one minute per sample. To validate typing techniques the combination of typing data with the epidemiological data is needed to confirm an outbreak situation. The Raman clustering obtained for the isolates of collection II revealed a good agreement with the epidemiological data. In 2002, five outbreaks were reported in the ErasmusMC that were confirmed by PFGE. Raman spectroscopy recognized these 5 clusters of isolates and identified the majority of unique PFGE isolates as unique Raman types. Both techniques classified a number of isolates as identical, although no epidemiological link could be found. One of the main reasons for typing is outbreak investigation. Dutch hospitals use an active ‘search & destroy’ policy for MRSA control (24). During such a contact screening, a considerable number of samples have to be screened for the presence of MRSA. Typing methods play an important role in this strategy in order to confirm transmission of isolates (comparative typing). The results obtained with collection III show that Raman spectroscopy enabled historical isolates of an MRSA colonized individual to be classified as being identical, strongly demonstrate a long-time colonization of the staff member and a possible epidemiological link between the staff member and the four different patients. Furthermore, both collections III and IV show that, for the contact screenings described here, Raman spectroscopy yielded the same results as established genotyping techniques, but several days earlier. We conclude that Raman spectroscopy is a highly reproducible, easy-to-use and rapid alternative for the currently used typing techniques that is suitable for real-time typing in clinical diagnostic laboratories. Such a technique will give the infection prevention teams a tool for the continuous monitoring of isolates in their hospital and will alert them immediately when corrective actions should be taken. This will lead to an accurate, real-time rather than retrospective surveillance and a new approach to combating hospital acquired infections.
References 1. Bootsma, M. C., O. Diekmann, and M. J. Bonten. 2006. Controlling methicillin-
resistant Staphylococcus aureus: quantifying the effects of interventions and rapid diagnostic testing. Proc Natl Acad Sci USA 103:5620-5.
2. Clancy, M., A. Graepler, M. Wilson, I. Douglas, J. Johnson, and C. S. Price. 2006. Active screening in high-risk units is an effective and cost-avoidant method to reduce the rate of methicillin-resistant Staphylococcus aureus infection in the hospital. Infect Control Hosp Epidemiol 27:1009-17.
3. Cookson, B. D., D. A. Robinson, A. B. Monk, S. Murchan, A. Deplano, R. de Ryck, M. J. Struelens, C. Scheel, V. Fussing, S. Salmenlinna, J. Vuopio-Varkila,
65
C. Cuny, W. Witte, P. T. Tassios, N. J. Legakis, W. van Leeeuwen, A. van Belkum, A. Vindel, J. Garaizer, S. Haeggman, B. Olsson-Liljequist, U. Ransjo, M. Muller-Premru, W. Hryniewicz, A. Rossney, B. O'Connell, B. D. Short, J. Thomas, S. O'Hanlon, and M. C. Enright. 2007. Evaluation of Molecular Typing Methods in Characterizing a European Collection of Epidemic Methicillin-Resistant Staphylococcus aureus (MRSA) - the HARMONY collection. J Clin Microbiol.
4. Cosgrove, S. E., Y. Qi, K. S. Kaye, S. Harbarth, A. W. Karchmer, and Y. Carmeli. 2005. The impact of methicillin resistance in Staphylococcus aureus bacteremia on patient outcomes: mortality, length of stay, and hospital charges. Infect Control Hosp Epidemiol 26:166-74.
5. Gould, I. M. 2006. Costs of hospital-acquired methicillin-resistant Staphylococcus aureus (MRSA) and its control. Int J Antimicrob Agents 28:379-84.
6. Harbarth, S., H. Sax, and P. Gastmeier. 2003. The preventable proportion of nosocomial infections: an overview of published reports. J Hosp Infect 54:258-66; quiz 321.
7. Hunter, P. R., and M. A. Gaston. 1988. Numerical index of the discriminatory ability of typing systems: an application of Simpson's index of diversity. J Clin Microbiol 26:2465-6.
8. Klevens, R. M., J. R. Edwards, C. L. Richards, Jr., T. C. Horan, R. P. Gaynes, D. A. Pollock, and D. M. Cardo. 2007. Estimating health care-associated infections and deaths in U.S. hospitals, 2002. Public Health Rep 122:160-6.
9. Maquelin, K., B. Cookson, P. Tassios, A. van Belkum, and M. for the European Society for Microbiology and Infectious Diseases Study Group on Epidemiological. 2007. Current Trends in the Epidemiological typing of clinically relevant microbes in Europe. J Microbiol Methods 69:222-6.
10. Maquelin, K., L. Dijkshoorn, T. J. van der Reijden, and G. J. Puppels. 2006. Rapid epidemiological analysis of Acinetobacter strains by Raman spectroscopy. J Microbiol Methods 64:126-31.
11. Maquelin, K., C. Kirschner, L. P. Choo-Smith, N. A. Ngo-Thi, T. van Vreeswijk, M. Stammler, H. P. Endtz, H. A. Bruining, D. Naumann, and G. J. Puppels. 2003. Prospective study of the performance of vibrational spectroscopies for rapid identification of bacterial and fungal pathogens recovered from blood cultures. J Clin Microbiol 41:324-9.
12. Martens, H., and E. Stark. 1991. Extended multiplicative signal correction and spectral interference subtraction: new preprocessing methods for near infrared spectroscopy. J Pharm Biomed Anal 9:625-35.
13. Murchan, S., M. E. Kaufmann, A. Deplano, R. de Ryck, M. Struelens, C. E. Zinn, V. Fussing, S. Salmenlinna, J. Vuopio-Varkila, N. El Solh, C. Cuny, W. Witte, P. T. Tassios, N. Legakis, W. van Leeuwen, A. van Belkum, A. Vindel, I. Laconcha, J. Garaizar, S. Haeggman, B. Olsson-Liljequist, U. Ransjo, G. Coombes, and B. Cookson. 2003. Harmonization of pulsed-field gel electrophoresis protocols for epidemiological typing of strains of methicillin-resistant Staphylococcus aureus: a single approach developed by consensus in 10 European laboratories and its application for tracing the spread of related strains. J Clin Microbiol 41:1574-85.
14. Nulens, E., E. Broex, A. Ament, R. H. Deurenberg, E. Smeets, J. Scheres, F. H. van Tiel, B. Gordts, and E. E. Stobberingh. 2008. Cost of the meticillin-resistant Staphylococcus aureus search and destroy policy in a Dutch university hospital. J Hosp Infect 68:301-7.
15. Nulens, E., E. E. Stobberingh, H. van Dessel, S. Sebastian, F. H. van Tiel, P. S. Beisser, and R. H. Deurenberg. 2008. Molecular Characterization of

66
Staphylococcus aureus Bloodstream Isolates in a Dutch University Hospital between 1999 and 2006. J Clin Microbiol.
16. Perencevich, E. N., P. W. Stone, S. B. Wright, Y. Carmeli, D. N. Fisman, S. E. Cosgrove, and A. Society for Healthcare Epidemiology of. 2007. Raising standards while watching the bottom line: making a business case for infection control. Infect Control Hosp Epidemiol 28:1121-33.
17. Peterson, L. R., and G. A. Noskin. 2001. New technology for detecting multidrug-resistant pathogens in the clinical microbiology laboratory. Emerg Infect Dis 7:306-11.
18. Scholtes-Timmerman, M., D. Willemse-Erix, T.C. Bakker Schut, A. van Belkum, G.J. Puppels, and K. Maquelin. 2009. A novel approach to correct a-specific variations in Raman spectra due to bleachable cellular components. The Analyst DOI: 10.1039/b811596f.
19. van Belkum, A., P. T. Tassios, L. Dijkshoorn, S. Haeggman, B. Cookson, N. K. Fry, V. Fussing, J. Green, E. Feil, P. Gerner-Smidt, S. Brisse, M. Struelens, and M. European Society of Clinical Microbiology and Infectious Diseases Study Group on Epidemiological. 2007. Guidelines for the validation and application of typing methods for use in bacterial epidemiology. Clin Microbiol Infect 13 Suppl 3:1-46.
20. van Belkum, A., W. van Leeuwen, M. E. Kaufmann, B. Cookson, F. Forey, J. Etienne, R. Goering, F. Tenover, C. Steward, F. O'Brien, W. Grubb, P. Tassios, N. Legakis, A. Morvan, N. El Solh, R. de Ryck, M. Struelens, S. Salmenlinna, J. Vuopio-Varkila, M. Kooistra, A. Talens, W. Witte, and H. Verbrugh. 1998. Assessment of resolution and intercenter reproducibility of results of genotyping Staphylococcus aureus by pulsed-field gel electrophoresis of SmaI macrorestriction fragments: a multicenter study. J Clin Microbiol 36:1653-9.
21. van Leeuwen, W., C. Libregts, M. Schalk, J. Veuskens, H. Verbrugh, and A. van Belkum. 2001. Binary typing of Staphylococcus aureus strains through reversed hybridization using digoxigenin-universal linkage system-labeled bacterial genomic DNA. J Clin Microbiol 39:328-31.
22. Vandijck, D. M., M. Depaemelaere, S. O. Labeau, P. O. Depuydt, L. Annemans, F. M. Buyle, S. Oeyen, K. E. Colpaert, R. P. Peleman, S. I. Blot, and J. M. Decruyenaere. 2008. Daily cost of antimicrobial therapy in patients with Intensive Care Unit-acquired, laboratory-confirmed bloodstream infection. Int J Antimicrob Agents 31:161-5.
23. Vincent, J. L., M. Chierego, M. Struelens, and B. Byl. 2004. Infection control in the intensive care unit. Expert Rev Anti Infect Ther 2:795-805.
24. Wertheim, H. F., M. C. Vos, H. A. Boelens, A. Voss, C. M. Vandenbroucke-Grauls, M. H. Meester, J. A. Kluytmans, P. H. van Keulen, and H. A. Verbrugh. 2004. Low prevalence of methicillin-resistant Staphylococcus aureus (MRSA) at hospital admission in the Netherlands: the value of search and destroy and restrictive antibiotic use. J Hosp Infect 56:321-5.
Acknowledgements Ellen Stobberingh from the University Hospital Maastricht is acknowledged for her technical support and scientific discussion. The authors would also like to thank Sam van Haaster for his help in generating figure 4. This study was funded by the Dutch Technology Foundation (STW) under project number 06311.

67
Chapter 6 Proof of principle for successful characterization of methicillin-resistant Coagulase Negative Staphylococci isolated from skin using Raman spectroscopy and Pulsed Field Gel Electrophoresis.
Diana Willemse-Erix Jan-willem Jachtenberg Hatice Barutçi Gerwin Puppels Alex van Belkum Margreet Vos Kees Maquelin Journal of Clinical Microbiology 2010; 48(3):736-740.
Abstract Coagulase-negative staphylococci (CNS) are among the most frequently isolated bacterial species in clinical microbiology and most CNS related infections are hospital-acquired. Distinguishing between these frequently multi antibiotic resistant isolates is important for both treatment and transmission control. In this study we used isolates of methicillin resistant coagulase negative staphylococci (MR-CNS) that were selected from a large surveillance study on the direct spread of MR-CNS. This strain collection was used to evaluate (i) Raman spectroscopy as a typing tool for MR-CNS isolates and (ii) diversity between colonies with identical and different morphologies. Reproducibility was high, with 215 of 216 (99.5%) of the replicate samples for 72 isolates ending up in the same cluster. The concordance with PFGE based clusters was 94.4%. We also confirm that the skin of patients can be colonized with multiple MR-CNS types at the same time. Morphological differences between colonies from a single patient sample correlated with differences in Raman and PFGE types. Some morphologically indistinguishable colonies revealed different Raman and PFGE types. This indicates that multiple MR-CNS colonies should be examined to obtain a complete insight in the prevalence of different types and to be able to perform an accurate transmission analysis.
68
Here we show that Raman spectroscopy is a reproducible typing system for MR-CNS isolates. It is a tool for screening variability within a collection of isolates. Because of the high throughput, it enables the analysis of multiple colonies per patient which will enhance the quality of clinical and epidemiological studies.
Introduction Coagulase-negative staphylococci (CNS) are among the most frequently isolated bacterial species in clinical microbiology. They colonize the human skin, throat, nose and/or gut and represent a major part of the normal bacterial flora of healthy people (15, 20). Although CNS have long been regarded as non-pathogenic, they have now been recognized as relevant opportunistic pathogens (23). Most of the CNS related infections are hospital-acquired. Since many nosocomial isolates are able to form biofilms on indwelling devices such as intravascular catheters, eradication of CNS is difficult and removal of the catheter or device can be the only effective intervention. Bloodstream infections (BSI) caused by these organisms are frequently related to the use of medical devices. They account for significant morbidity and mortality, especially in immuno-compromised individuals and neonates (16, 17, 20). A likely source of CNS isolates involved in catheter related infections appears to be the skin flora. Several studies indicate that subtle morphological differences can be found among CNS colonies cultured from infected catheters, suggesting multiple CNS types being present (3, 5, 18). Furthermore, it has been shown that CNS bacteria can be transmitted by hospitalized patients and health care workers (1, 13, 21). Isolates involved in transmission are often characterized by their resistance against many of the commonly used antibiotics, including methicillin (6, 9, 14). Although several studies suggest that colonized patients and health care workers should be considered as reservoirs for these microorganisms, sometimes too little attention is paid to the control of these multiresistant isolates (7, 8, 23). Distinction between clinically significant and contaminating isolates can be important as well as determining possible transmission and transmission routes in infection prevention and surveillance studies. This, however, requires a more detailed characterization of isolates using an appropriate typing method. The most widely used typing method for outbreak analysis and surveillance of CNS is pulsed field gel electrophoresis (PFGE). However, this technique is laborious, has a long turnaround time and low sample throughput, which makes it unsuitable for routine use and large-scale clinical studies. Currently, the gold standard to assess phylogenic relatedness between isolates is Multilocus Sequence typing (MLST). Recently, Raman spectroscopy has been reported as a powerful tool for identification of microorganisms on the species and subspecies level. The technique is fast and easy-to-use. Raman spectra of bacteria are a representation of their overall molecular composition and can be used as strain-specific spectroscopic fingerprints (10, 12, 22). Using a collection of Staphylococcus aureus isolates it was shown that typing results obtained are comparable to PFGE (22). Highly similar grouping compared to Amplification
69
Fragment Length Polymorphism (AFLP) was documented for a collection of Acinetobacter isolates (10). In this study we used a collection of methicillin resistant coagulase negative staphylococci (MR-CNS) to illustrate that Raman spectroscopy can be used as a rapid and reproducible typing technique for MR-CNS isolates. We confirm that the skin of hospital patients can be colonized with multiple MR-CNS types and therefore, screening for variability is essential for accurate transmission analysis.
Materials and Methods Culture and storage of isolates Isolates were selected from a large surveillance study performed at the Erasmus MC (Rotterdam, The Netherlands) to evaluate risk factors for acquiring MR-CNS. Therefore, patients were sampled daily during their hospital stay by swabbing of the lower part of the arm, just above the inside of the wrist. On this location it is easy to reproducibly collect samples by different health care workers and it is not incriminating for the patient. The study was approved by the ErasmusMC ethical review board. Swabs were incubated at 35°C in phenol red mannitol broth (Becton Dickinson, Franklin Lakes, NJ, USA) containing 5µg/ml of ceftizoxime and 75µg/ml of aztreonam. After 48 hours all cultures were plated onto a Columbia blood agar plate (Becton Dickinson) and incubated for 48 hours at 35°C. Isolates were stored at -80°C in glycerol containing brain heart infusion broth (Becton Dickinson) until further use. Colonies with a different visual morphology were stored as different MR-CNS types. For colonies with identical visual morphology, only one colony was stored.
MR-CNS isolates In total 162 isolates obtained from 19 patients were selected from the surveillance study. These isolates were divided into 3 collections. Collection I was used as a reference collection to evaluate the reproducibility of Raman spectroscopy and the diversity of MR-CNS types over time. This collection contained 72 MR-CNS isolates obtained from 5 different patients. Isolates were collected over a period of 8-27 days, depending on the admission period. To determine the reproducibility of the measurements, so-called full biological replicates were performed. This means that for each replicate a separate new culture and sample preparation was performed on separate days. Collection II was used to evaluate the clonal diversity of CNS isolates showing differences in colony morphology. This collection contained isolates obtained from 4 patients. For each patient a culture was selected showing two morphotypes. For each morphotype, 5 morphological identical colonies were selected from the initial growth medium, resulting in 40 isolates. Collection III was used to evaluate the clonal diversity of CNS isolates with an identical colony morphology. This collection consisted of 50 isolates that were obtained from 10 patients. For each patient a culture was selected showing one morphotype. For each culture, 5 morphological identical colonies were selected.

70
Pulsed-field gel electrophoresis (PFGE) Isolates were cultured on Columbia blood agar plates and incubated overnight at 35°C. PFGE was performed as described previously (4). Briefly, a suspension of bacteria was mixed with 1% InCert agarose (FMC Bioproducts, Rockland, USA). Agarose plugs were incubated with lysostaphin (Sigma-Aldrich, Zwijndrecht, The Netherlands) and spheroplasts were lysed using proteinase K (Sigma-Aldrich). DNA was digested by SmaI (Fermentas, St. Leon-Rot, Germany). Macro-restriction fragments were separated using a BioRad CHEF Mapper (BioRad, Veenendaal, The Netherlands) with a total run time of 20h. PFGE type definition was based on the presence of unique banding patterns.
Culture and sample preparation for Raman spectroscopy Culture of bacterial isolates and sample preparation prior to Raman measurements were performed as described previously (22). Briefly, all isolates were grown for 20h at 35°C on Trypticase Soy agar (Becton Dickinson). Biomass was suspended in sterilized distilled water (prepared in house) and transferred to a quartz slide (Hellma Benelux, Rijswijk, The Netherlands). On this slide a removable silicone isolator (Sigma-Aldrich) was placed containing 24 wells. Samples were allowed to dry for 20 minutes at 35°C.
Raman spectroscopy Raman measurements were performed as described previously (2, 22). Raman spectra were collected using a High Performance Raman Module 2500 coupled to a custom-built inverted microscope stage with an automated XYZ-stage (River Diagnostics BV, Rotterdam, The Netherlands). Automated data collection was performed using the RiverIcon software, version 1.63 (River Diagnostics). To account for sample heterogeneity, for each sample spectra were measured at multiple positions, using a 1s signal collection time per measurement. The total measurement time per sample was 40 to 60 seconds.
Data-analysis Signal pre-processing All measured spectra were processed to remove non-informative signal variance, such as the background signal contribution from the fused silica substrate. Small variations in biochemical composition between independent cultures of an isolate were corrected as described before (11). Software scripts for spectrum pre-treatment and data analysis were written in MATLAB version 7.1 (The MathWorks).
Calculation of similarities between spectra The similarity between pairs of spectra was expressed in percentages and calculated using the squared Pearson correlation coefficient (R2) multiplied by 100.
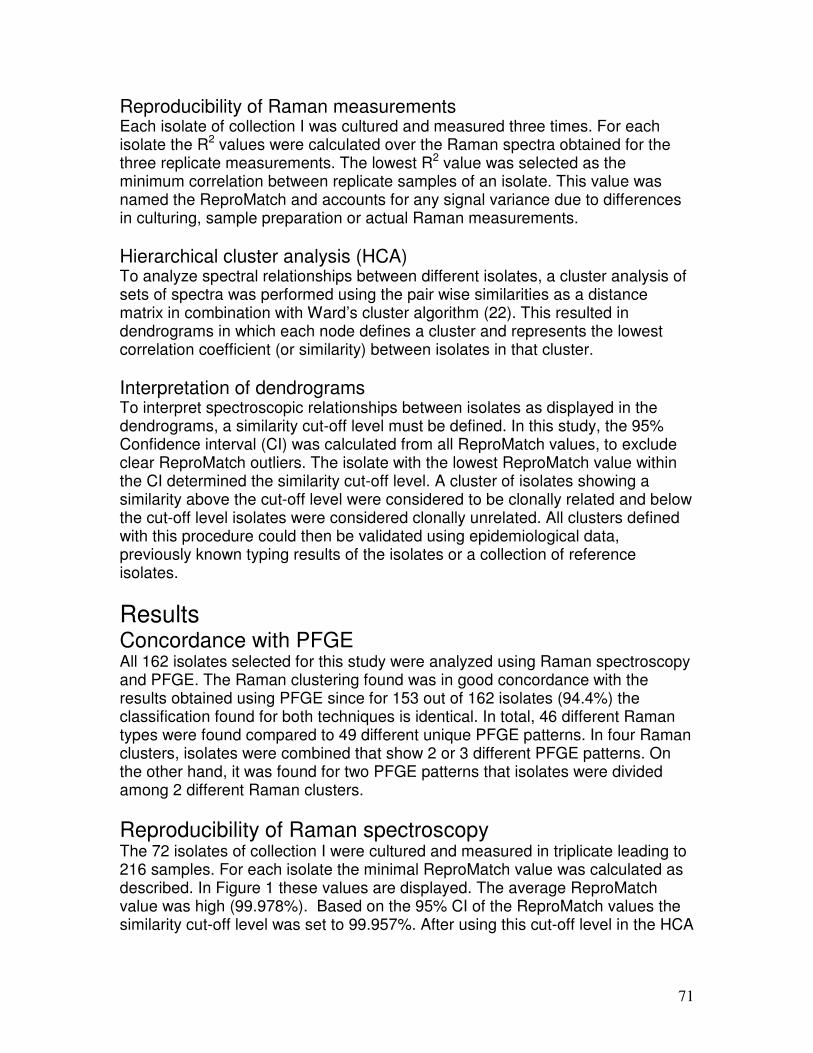
71
Reproducibility of Raman measurements Each isolate of collection I was cultured and measured three times. For each isolate the R2 values were calculated over the Raman spectra obtained for the three replicate measurements. The lowest R2 value was selected as the minimum correlation between replicate samples of an isolate. This value was named the ReproMatch and accounts for any signal variance due to differences in culturing, sample preparation or actual Raman measurements.
Hierarchical cluster analysis (HCA) To analyze spectral relationships between different isolates, a cluster analysis of sets of spectra was performed using the pair wise similarities as a distance matrix in combination with Ward’s cluster algorithm (22). This resulted in dendrograms in which each node defines a cluster and represents the lowest correlation coefficient (or similarity) between isolates in that cluster.
Interpretation of dendrograms To interpret spectroscopic relationships between isolates as displayed in the dendrograms, a similarity cut-off level must be defined. In this study, the 95% Confidence interval (CI) was calculated from all ReproMatch values, to exclude clear ReproMatch outliers. The isolate with the lowest ReproMatch value within the CI determined the similarity cut-off level. A cluster of isolates showing a similarity above the cut-off level were considered to be clonally related and below the cut-off level isolates were considered clonally unrelated. All clusters defined with this procedure could then be validated using epidemiological data, previously known typing results of the isolates or a collection of reference isolates.
Results Concordance with PFGE All 162 isolates selected for this study were analyzed using Raman spectroscopy and PFGE. The Raman clustering found was in good concordance with the results obtained using PFGE since for 153 out of 162 isolates (94.4%) the classification found for both techniques is identical. In total, 46 different Raman types were found compared to 49 different unique PFGE patterns. In four Raman clusters, isolates were combined that show 2 or 3 different PFGE patterns. On the other hand, it was found for two PFGE patterns that isolates were divided among 2 different Raman clusters.
Reproducibility of Raman spectroscopy The 72 isolates of collection I were cultured and measured in triplicate leading to 216 samples. For each isolate the minimal ReproMatch value was calculated as described. In Figure 1 these values are displayed. The average ReproMatch value was high (99.978%). Based on the 95% CI of the ReproMatch values the similarity cut-off level was set to 99.957%. After using this cut-off level in the HCA
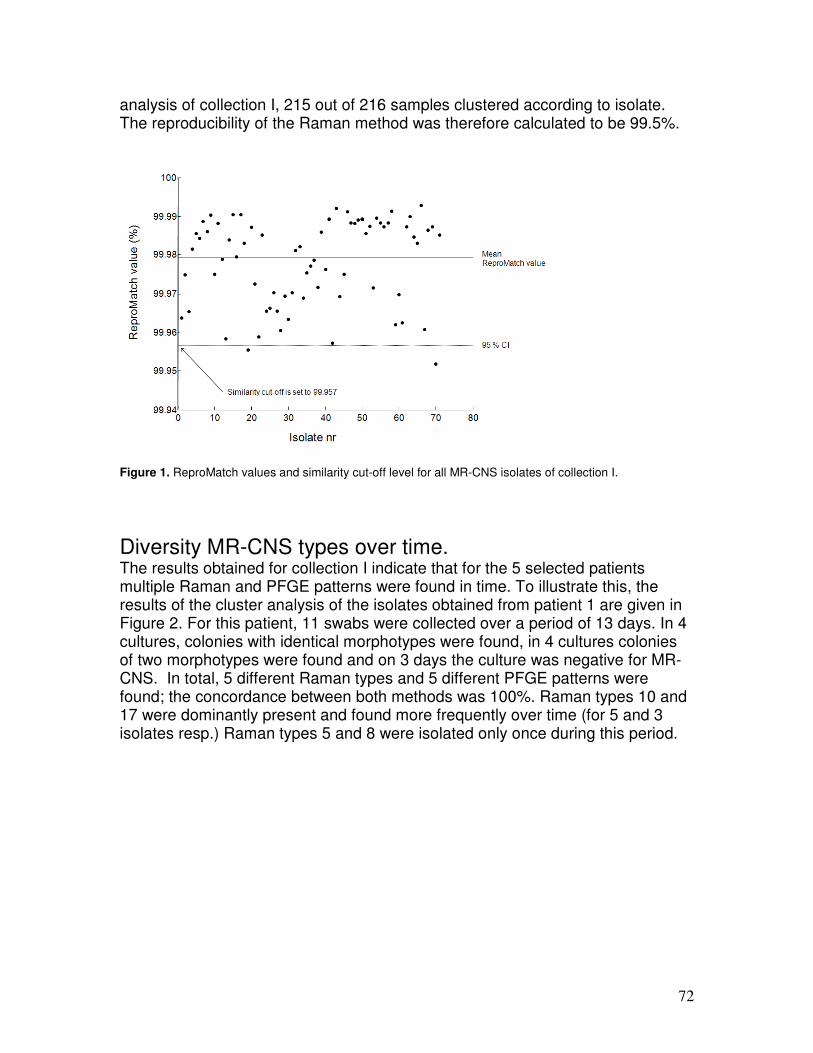
72
analysis of collection I, 215 out of 216 samples clustered according to isolate. The reproducibility of the Raman method was therefore calculated to be 99.5%.
Figure 1. ReproMatch values and similarity cut-off level for all MR-CNS isolates of collection I.
Diversity MR-CNS types over time. The results obtained for collection I indicate that for the 5 selected patients multiple Raman and PFGE patterns were found in time. To illustrate this, the results of the cluster analysis of the isolates obtained from patient 1 are given in Figure 2. For this patient, 11 swabs were collected over a period of 13 days. In 4 cultures, colonies with identical morphotypes were found, in 4 cultures colonies of two morphotypes were found and on 3 days the culture was negative for MR-CNS. In total, 5 different Raman types and 5 different PFGE patterns were found; the concordance between both methods was 100%. Raman types 10 and 17 were dominantly present and found more frequently over time (for 5 and 3 isolates resp.) Raman types 5 and 8 were isolated only once during this period.
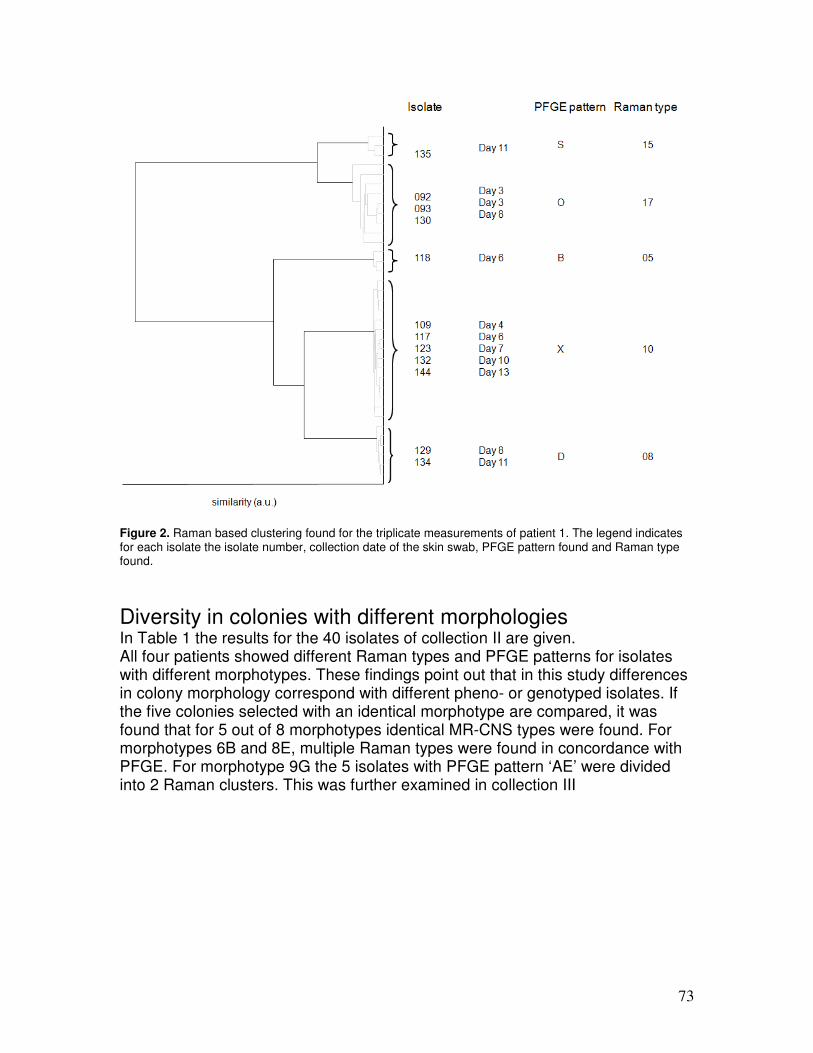
73
Figure 2. Raman based clustering found for the triplicate measurements of patient 1. The legend indicates for each isolate the isolate number, collection date of the skin swab, PFGE pattern found and Raman type found.
Diversity in colonies with different morphologies In Table 1 the results for the 40 isolates of collection II are given. All four patients showed different Raman types and PFGE patterns for isolates with different morphotypes. These findings point out that in this study differences in colony morphology correspond with different pheno- or genotyped isolates. If the five colonies selected with an identical morphotype are compared, it was found that for 5 out of 8 morphotypes identical MR-CNS types were found. For morphotypes 6B and 8E, multiple Raman types were found in concordance with PFGE. For morphotype 9G the 5 isolates with PFGE pattern ‘AE’ were divided into 2 Raman clusters. This was further examined in collection III
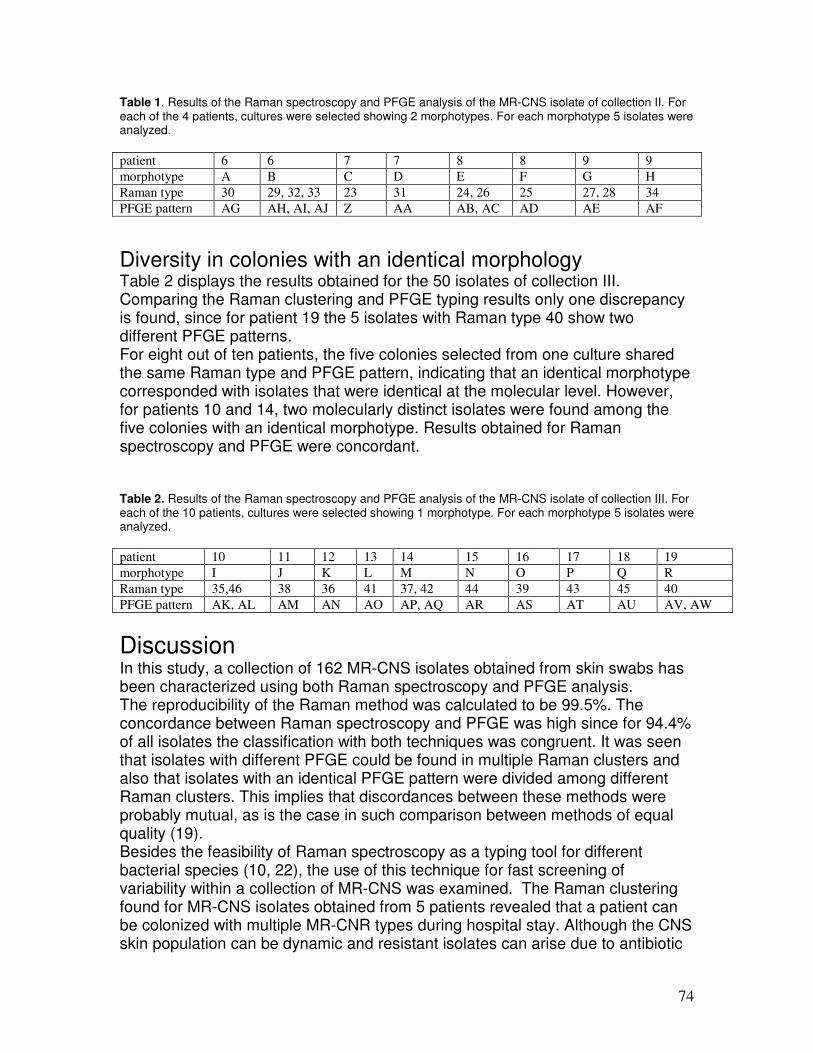
74
Table 1. Results of the Raman spectroscopy and PFGE analysis of the MR-CNS isolate of collection II. For each of the 4 patients, cultures were selected showing 2 morphotypes. For each morphotype 5 isolates were analyzed.
patient 6 6 7 7 8 8 9 9
morphotype A B C D E F G H
Raman type 30 29, 32, 33 23 31 24, 26 25 27, 28 34
PFGE pattern AG AH, AI, AJ Z AA AB, AC AD AE AF
Diversity in colonies with an identical morphology Table 2 displays the results obtained for the 50 isolates of collection III. Comparing the Raman clustering and PFGE typing results only one discrepancy is found, since for patient 19 the 5 isolates with Raman type 40 show two different PFGE patterns. For eight out of ten patients, the five colonies selected from one culture shared the same Raman type and PFGE pattern, indicating that an identical morphotype corresponded with isolates that were identical at the molecular level. However, for patients 10 and 14, two molecularly distinct isolates were found among the five colonies with an identical morphotype. Results obtained for Raman spectroscopy and PFGE were concordant. Table 2. Results of the Raman spectroscopy and PFGE analysis of the MR-CNS isolate of collection III. For each of the 10 patients, cultures were selected showing 1 morphotype. For each morphotype 5 isolates were analyzed.
patient 10 11 12 13 14 15 16 17 18 19
morphotype I J K L M N O P Q R
Raman type 35,46 38 36 41 37, 42 44 39 43 45 40
PFGE pattern AK, AL AM AN AO AP, AQ AR AS AT AU AV, AW
Discussion In this study, a collection of 162 MR-CNS isolates obtained from skin swabs has been characterized using both Raman spectroscopy and PFGE analysis. The reproducibility of the Raman method was calculated to be 99.5%. The concordance between Raman spectroscopy and PFGE was high since for 94.4% of all isolates the classification with both techniques was congruent. It was seen that isolates with different PFGE could be found in multiple Raman clusters and also that isolates with an identical PFGE pattern were divided among different Raman clusters. This implies that discordances between these methods were probably mutual, as is the case in such comparison between methods of equal quality (19). Besides the feasibility of Raman spectroscopy as a typing tool for different bacterial species (10, 22), the use of this technique for fast screening of variability within a collection of MR-CNS was examined. The Raman clustering found for MR-CNS isolates obtained from 5 patients revealed that a patient can be colonized with multiple MR-CNR types during hospital stay. Although the CNS skin population can be dynamic and resistant isolates can arise due to antibiotic
75
treatment, this pattern of colonization with different MR-CNS isolates seems unlikely. The random occurrence and absence of strains suggest a lack in the reproducibility of the sample collection from the patient skin, since only one isolate of each morphotype was stored and analyzed. For the patients used in this study, one or two isolate types were found more frequently over time, indicating that the patient was persistently colonized with this isolate. Isolate types that were found only once in the same time period could be transient isolates. Since samples were taken from the arm, the chance of retrieving transient isolates by transmission from a patient, health care worker or from the innate environment is relatively high. On the other hand, these isolate types could be persistent but in a lower number and missed. To confirm the statement that multiple isolate types could be present in one culture an additional study on 14 patients was performed. Both Raman spectroscopy and PFGE revealed that indeed different isolate types were found not only among colonies of different morphotypes but also for some colonies with the same morphotype. These findings indicate that, even for the limited number of colonies tested in this study, the variability in CNS populations on skin is surely higher than might be expected from morphological differences only. In an ideal study design therefore, several single MR-CNS colonies should be selected and characterized individually to obtain a correct insight in the prevalence of isolate types. We also found that a more reliable determination of colony morphology by visual inspection could be obtained by incubating for at least 72 hours (data not given). However, this will result in a delay of at least two days compared to typing of isolates after a 20 hour incubation time as we used here. This is not a problem in a research setting, but could be a consideration in a clinical situation e.g. for the microbiological diagnosis of catheter-related bloodstream infections (CR-BSI) (5, 16). Furthermore, previous studies indicated that polyclonality in CNS cultures from CR-BSI correlates with differences in antimicrobial susceptibility patterns and may have important consequences for the treatment of these infections (5). Since only a small number of patients are included in this study, it is not possible to draw a significant medical conclusion. But our findings do provide technical support that characterizing a limited number of MR-CNS colonies only may result in misleading information as multiple isolates may be present in cultures. A problem for large surveillance studies on the transmission of CNS or for the reliable diagnosis of CR-BSI could result by simply missing significant clonal types. Analyzing multiple colonies will lead to a significant increase in the amount of samples that need to be analyzed and demand a typing tool with high sample throughput. Although PFGE analysis is still the gold standard for typing of CNS isolates, we have shown that Raman spectroscopy could provide typing results that are in good concordance with PFGE. Due to its high throughput, Raman spectroscopy enables the analysis of multiple colonies per patient which will increase the quality of clinical and epidemiological studies.
76
References 1. Ben Saida, N., A. Ferjeni, N. Benhadjtaher, K. Monastiri, and J. Boukadida. 2006.
Clonality of clinical methicillin-resistant Staphylococcus epidermidis isolates in a neonatal intensive care unit. Pathol Biol (Paris) 54:337-42.
2. Buijtels, P. C., H. F. Willemse-Erix, P. L. Petit, H. P. Endtz, G. J. Puppels, H. A. Verbrugh, A. van Belkum, D. van Soolingen, and K. Maquelin. 2008. Rapid identification of mycobacteria by Raman spectroscopy. J Clin Microbiol 46:961-5.
3. Casey, A. L., T. Worthington, P. A. Lambert, and T. S. Elliott. 2007. Evaluation of routine microbiological techniques for establishing the diagnosis of catheter-related bloodstream infection caused by coagulase-negative staphylococci. J Med Microbiol 56:172-6.
4. Cookson, B. D., D. A. Robinson, A. B. Monk, S. Murchan, A. Deplano, R. de Ryck, M. J. Struelens, C. Scheel, V. Fussing, S. Salmenlinna, J. Vuopio-Varkila, C. Cuny, W. Witte, P. T. Tassios, N. J. Legakis, W. van Leeeuwen, A. van Belkum, A. Vindel, J. Garaizer, S. Haeggman, B. Olsson-Liljequist, U. Ransjo, M. Muller-Premru, W. Hryniewicz, A. Rossney, B. O'Connell, B. D. Short, J. Thomas, S. O'Hanlon, and M. C. Enright. 2007. Evaluation of Molecular Typing Methods in Characterizing a European Collection of Epidemic Methicillin-Resistant Staphylococcus aureus (MRSA) - the HARMONY collection. J Clin Microbiol.
5. Garcia de Viedma, D., P. Martin Rabadan, M. Diaz, E. Cercenado, and E. Bouza. 2000. Heterogeneous antimicrobial resistance patterns in polyclonal populations of coagulase-negative staphylococci isolated from catheters. J Clin Microbiol 38:1359-63.
6. Juarez-Verdayes, M. A., M. A. Reyes-Lopez, M. E. Cancino-Diaz, S. Munoz-Salas, S. Rodriguez-Martinez, F. J. de la Serna, C. H. Hernandez-Rodriguez, and J. C. Cancino-Diaz. 2006. Isolation, vancomycin resistance and biofilm production of Staphylococcus epidermidis from patients with conjunctivitis, corneal ulcers, and endophthalmitis. Rev Latinoam Microbiol 48:238-46.
7. Kloos, W. E., and T. L. Bannerman. 1994. Update on clinical significance of coagulase-negative staphylococci. Clin Microbiol Rev 7:117-40.
8. Knauer, A., P. Fladerer, C. Strempfl, R. Krause, and C. Wenisch. 2004. Effect of hospitalization and antimicrobial therapy on antimicrobial resistance of colonizing Staphylococcus epidermidis. Wien Klin Wochenschr 116:489-94.
9. Kozitskaya, S., S. H. Cho, K. Dietrich, R. Marre, K. Naber, and W. Ziebuhr. 2004. The bacterial insertion sequence element IS256 occurs preferentially in nosocomial Staphylococcus epidermidis isolates: association with biofilm formation and resistance to aminoglycosides. Infect Immun 72:1210-5.
10. Maquelin, K., L. Dijkshoorn, T. J. van der Reijden, and G. J. Puppels. 2006. Rapid epidemiological analysis of Acinetobacter strains by Raman spectroscopy. J Microbiol Methods 64:126-31.
11. Maquelin, K., T. Hoogenboezem, J. Jachtenberg, R. Dumke, E. Jacobs, G. J. Puppels, N. G. Hartwig, and C. Vink. 2009. Raman spectroscopic typing reveals the presence of carotenoids in Mycoplasma pneumoniae. Microbiology DOI 10.1099/mic.0.026724-0.
12. Maquelin, K., C. Kirschner, L. P. Choo-Smith, N. van den Braak, H. P. Endtz, D. Naumann, and G. J. Puppels. 2002. Identification of medically relevant microorganisms by vibrational spectroscopy. J Microbiol Methods 51:255-71.
13. Milisavljevic, V., F. Wu, J. Cimmotti, J. Haas, P. Della-Latta, E. Larson, and L. Saiman. 2005. Genetic relatedness of Staphylococcus epidermidis from infected infants and staff in the neonatal intensive care unit. Am J Infect Control 33:341-7.

77
14. Miragaia, M., I. Couto, S. F. Pereira, K. G. Kristinsson, H. Westh, J. O. Jarlov, J. Carrico, J. Almeida, I. Santos-Sanches, and H. de Lencastre. 2002. Molecular characterization of methicillin-resistant Staphylococcus epidermidis clones: evidence of geographic dissemination. J Clin Microbiol 40:430-8.
15. Smith, A. J., M. S. Jackson, and J. Bagg. 2001. The ecology of Staphylococcus species in the oral cavity. J Med Microbiol 50:940-6.
16. Spare, M. K., S. E. Tebbs, S. Lang, P. A. Lambert, T. Worthington, G. W. Lipkin, and T. S. Elliott. 2003. Genotypic and phenotypic properties of coagulase-negative staphylococci causing dialysis catheter-related sepsis. J Hosp Infect 54:272-8.
17. Uckay, I., D. Pittet, P. Vaudaux, H. Sax, D. Lew, and F. Waldvogel. 2008. Foreign body infections due to Staphylococcus epidermidis. Ann Med:1-11.
18. van Belkum, A., J. Kluijtmans, W. van Leeuwen, W. Goessens, E. ter Averst, J. Wielenga, and H. Verbrugh. 1996. Monitoring persistence of coagulase-negative staphylococci in a hematology department using phenotypic and genotypic strategies. Infect Control Hosp Epidemiol 17:660-7.
19. van Belkum, A., P. T. Tassios, L. Dijkshoorn, S. Haeggman, B. Cookson, N. K. Fry, V. Fussing, J. Green, E. Feil, P. Gerner-Smidt, S. Brisse, M. Struelens, and M. European Society of Clinical Microbiology and Infectious Diseases Study Group on Epidemiological. 2007. Guidelines for the validation and application of typing methods for use in bacterial epidemiology. Clin Microbiol Infect 13 Suppl 3:1-46.
20. von Eiff, C., G. Peters, and C. Heilmann. 2002. Pathogenesis of infections due to coagulase-negative staphylococci. Lancet infectious diseases 2 (11):677-685.
21. Widerstrom, M., T. Monsen, C. Karlsson, and J. Wistrom. 2006. Molecular epidemiology of meticillin-resistant coagulase-negative staphylococci in a Swedish county hospital: evidence of intra- and interhospital clonal spread. J Hosp Infect 64:177-83.
22. Willemse-Erix, D. F., M. J. Scholtes-Timmerman, J. W. Jachtenberg, W. B. van Leeuwen, D. Horst-Kreft, T. C. Bakker Schut, R. H. Deurenberg, G. J. Puppels, A. van Belkum, M. C. Vos, and K. Maquelin. 2009. Optical fingerprinting in bacterial epidemiology: Raman spectroscopy as a real-time typing method. J Clin Microbiol 47:652-9.
23. Ziebuhr, W., S. Hennig, M. Eckart, H. Kranzler, C. Batzilla, and S. Kozitskaya. 2006. Nosocomial infections by Staphylococcus epidermidis: how a commensal bacterium turns into a pathogen. Int J Antimicrob Agents 28 Suppl 1:S14-20.
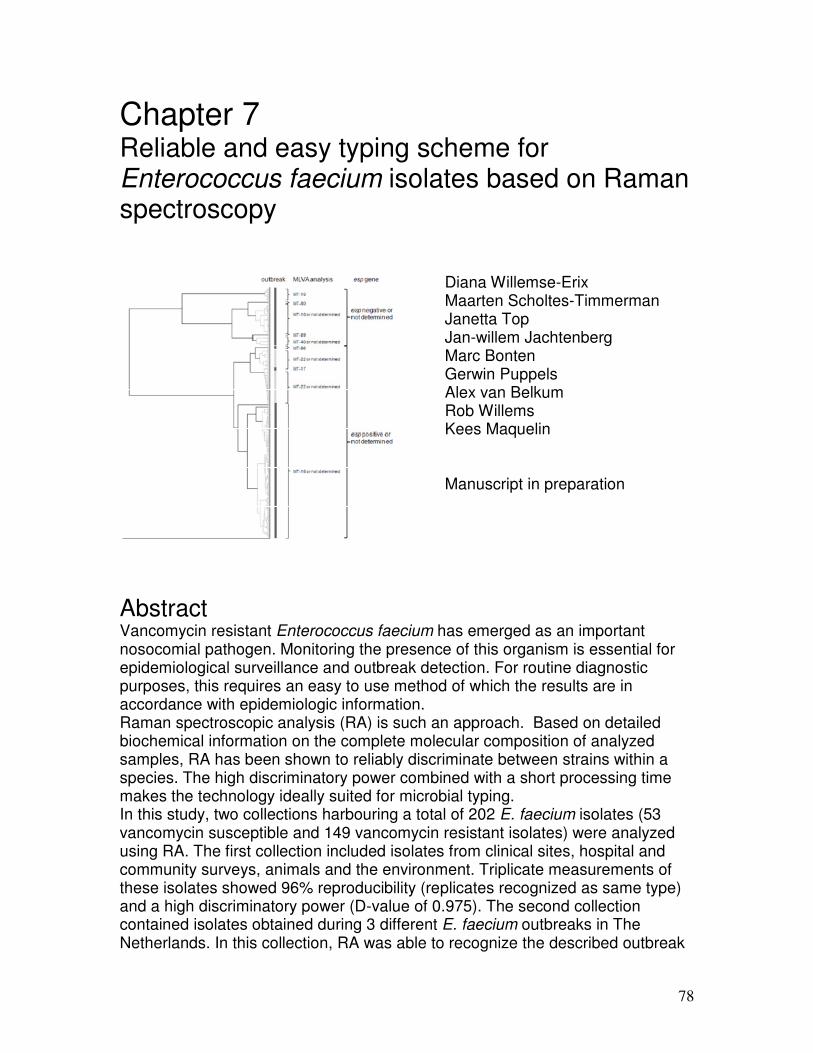
78
Chapter 7 Reliable and easy typing scheme for Enterococcus faecium isolates based on Raman spectroscopy
Diana Willemse-Erix Maarten Scholtes-Timmerman Janetta Top Jan-willem Jachtenberg Marc Bonten Gerwin Puppels Alex van Belkum Rob Willems Kees Maquelin Manuscript in preparation
Abstract Vancomycin resistant Enterococcus faecium has emerged as an important nosocomial pathogen. Monitoring the presence of this organism is essential for epidemiological surveillance and outbreak detection. For routine diagnostic purposes, this requires an easy to use method of which the results are in accordance with epidemiologic information. Raman spectroscopic analysis (RA) is such an approach. Based on detailed biochemical information on the complete molecular composition of analyzed samples, RA has been shown to reliably discriminate between strains within a species. The high discriminatory power combined with a short processing time makes the technology ideally suited for microbial typing. In this study, two collections harbouring a total of 202 E. faecium isolates (53 vancomycin susceptible and 149 vancomycin resistant isolates) were analyzed using RA. The first collection included isolates from clinical sites, hospital and community surveys, animals and the environment. Triplicate measurements of these isolates showed 96% reproducibility (replicates recognized as same type) and a high discriminatory power (D-value of 0.975). The second collection contained isolates obtained during 3 different E. faecium outbreaks in The Netherlands. In this collection, RA was able to recognize the described outbreak
79
isolates and esp-positive and esp-negative isolates were confined in separate clusters. This sub-clustering separated community acquired and hospital acquired isolates. Using RA E. faecium isolates could be reproducibly discriminated at the strain level. Furthermore, the results were concordant with previous typing results using molecular methods and, more importantly, the results were concordant with epidemiological data.
Introduction Worldwide, the increase of antibiotic resistance is a serious problem for the successful treatment of hospital acquired infections (HAI). Infection control strategies are essential in limiting the spread of antibiotic resistant pathogens (7). HAI with these pathogens are associated with a significant increase in morbidity and mortality and consequently have a considerable impact on health care costs (3, 5). In the last decades, vancomycin resistant enterococci (VRE) have emerged as important nosocomial pathogens. Historically, E. faecalis accounted for 80-90% of all enterococcal infections whereas E. faecium was responsible for only 5 to 10% of enterococci related infections (15, 21, 30). However, the fraction of infections caused by E. faecium is increasing (21). Although acquisition of antimicrobial resistance can occur in any enterococcal species, E. faecium is more frequently associated with ampicillin and glycopeptide resistance than other species (21, 30). Initially, many of the VRE related hospital outbreaks were found in the USA, but after the turn of the century more and more outbreaks in European hospitals have been reported (15, 24). Population genetics of E. faecium based on multilocus sequence typing (MLST), revealed that hospital derived strains are genotypically distinct from non-hospital isolates. The majority of these strains belong to a polyclonal subpopulation, complex-17 (12, 26, 27). This subpopulation represents isolates that are successfully adapted to hospital environments and are characterized by ampicillin resistance and the presence of the esp virulence gene (1, 20). The esp gene encodes for the enterococcal surface protein (Esp) and is thought to play an important role in biofilm formation and colonization of the urinary tract (8, 25). Infection control and prevention will benefit significantly from real-time, reproducible and discriminatory bacterial typing methods. Recognition and early detection of potential epidemic isolates will lead to early discovery of transmission routes, enabling earlier interventions. Several typing methods have been used for the characterization of VRE. Of these, pulsed field gel electrophoresis (PFGE) has traditionally been used most often to determine relatedness of isolates (4). MLST and multiple-locus variable-number tandem repeat analysis (MLVA) are increasingly being used to determine the genetic relationships between isolates (9, 20). Previous research showed that Raman spectroscopic analysis (RA) is able to differentiate enterococcal species (11). Using this technique, spectroscopic fingerprints of bacterial samples can be obtained in a few seconds. These fingerprints represent the total molecular
80
composition of a sample and are suited for the identification of different microorganisms, even at the subspecies level (28, 29). In this study, a RA-based protocol was developed for epidemiological typing of E. faecium isolates. We show that RA is a reproducible and highly discriminatory method that facilitated the tracing of isolates during hospital outbreaks.
Materials and methods Bacterial strain collections All isolates used in this study (n=202) were obtained from the Department of Medical Microbiology of the University Medical Center Utrecht (UMC, Utrecht, The Netherlands). Isolates were stored at -80°C in glycerol containing brain heart infusion broth (BHI; Becton Dickinson) until further use. Collection I contained 122 E. faecium isolates (53 vancomycin susceptible and 69 vancomycin resistant isolates). For all isolates typing results were available based on MLST (26) and for 98 isolates MLVA results were also known (20). Isolates were retrieved from different countries in Europe and North- and South-America. They were derived from clinical sites (25 isolates), hospital surveys and outbreak analysis (47 isolates), community surveys (29 isolates), animal surveys (14 isolates) and the environment (7 isolates). This collection was used to determine the effect of culture-to-culture variation on the repeatability of the RA results and to quantify its discriminatory power compared to established typing methods. Collection II contained 80 isolates with a known epidemiological profile that were selected from a larger collection obtained during 3 different outbreaks in Dutch hospitals. Isolates were collected at the VU University Medical Centre in Amsterdam (19), the Eemland hospital in Amersfoort (23) and the University Medical Centre of Utrecht (16). These outbreaks were previously analyzed using amplified fragment length polymorphism (AFLP) and PFGE, and revealed spread of the same clone in the last two centers. For all three collections, representative outbreak clones were selected and analyzed using MLVA (Table 1). This collection was used for a retrospective analysis to investigate whether RA is able to provide data that is useful in making adequate decisions in outbreak analysis.
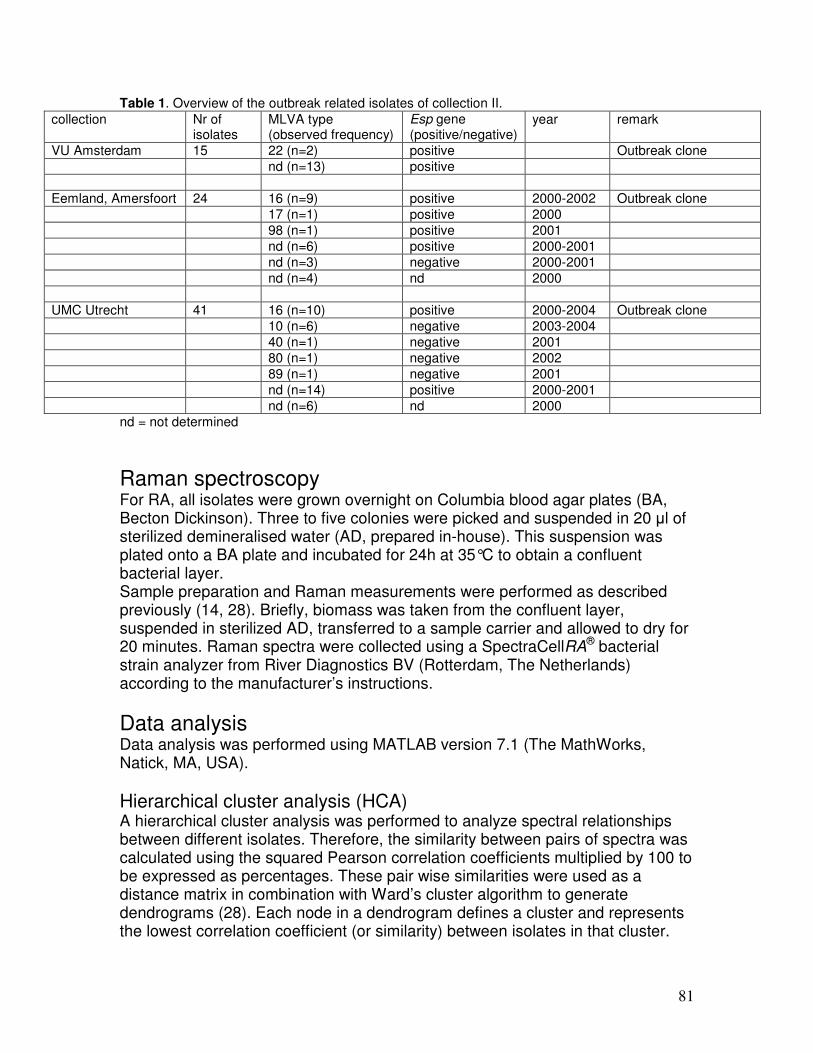
81
Table 1. Overview of the outbreak related isolates of collection II. collection Nr of
isolates MLVA type (observed frequency)
Esp gene (positive/negative)
year remark
VU Amsterdam 15 22 (n=2) positive Outbreak clone nd (n=13) positive Eemland, Amersfoort 24 16 (n=9) positive 2000-2002 Outbreak clone 17 (n=1) positive 2000 98 (n=1) positive 2001 nd (n=6) positive 2000-2001 nd (n=3) negative 2000-2001 nd (n=4) nd 2000 UMC Utrecht 41 16 (n=10) positive 2000-2004 Outbreak clone 10 (n=6) negative 2003-2004 40 (n=1) negative 2001 80 (n=1) negative 2002 89 (n=1) negative 2001 nd (n=14) positive 2000-2001 nd (n=6) nd 2000
nd = not determined
Raman spectroscopy For RA, all isolates were grown overnight on Columbia blood agar plates (BA, Becton Dickinson). Three to five colonies were picked and suspended in 20 µl of sterilized demineralised water (AD, prepared in-house). This suspension was plated onto a BA plate and incubated for 24h at 35°C to obtain a confluent bacterial layer. Sample preparation and Raman measurements were performed as described previously (14, 28). Briefly, biomass was taken from the confluent layer, suspended in sterilized AD, transferred to a sample carrier and allowed to dry for 20 minutes. Raman spectra were collected using a SpectraCellRA® bacterial strain analyzer from River Diagnostics BV (Rotterdam, The Netherlands) according to the manufacturer’s instructions.
Data analysis Data analysis was performed using MATLAB version 7.1 (The MathWorks, Natick, MA, USA).
Hierarchical cluster analysis (HCA) A hierarchical cluster analysis was performed to analyze spectral relationships between different isolates. Therefore, the similarity between pairs of spectra was calculated using the squared Pearson correlation coefficients multiplied by 100 to be expressed as percentages. These pair wise similarities were used as a distance matrix in combination with Ward’s cluster algorithm to generate dendrograms (28). Each node in a dendrogram defines a cluster and represents the lowest correlation coefficient (or similarity) between isolates in that cluster.
82
Similarity cut-off level To interpret relationships between isolates in the dendrograms, a similarity cut-off level was defined as described before (29). For each isolate the minimal correlation coefficient between replicates was calculated (ReproMatch value). To exclude clear ReproMatch outliers, the isolate with the lowest correlation coefficient within the 95% confidence interval determined the similarity cut-off level. Shifting the cut-off to a lower similarity level will create fewer (and larger) clusters. This way, defined clusters could be validated using available epidemiologic data or previously known typing results.
Discriminatory power The discriminatory power of a typing method is defined as its ability to assign a different type to two epidemiologically unrelated strains and is considered a valuable parameter for making decisions on strain identity or diversity (22). To quantify the discriminatory power of RA, Simpson’s index of diversity (D) was calculated as described by Hunter and Gaston (10). Confidence intervals were calculated as described by Grundmann et al (6). To quantify the discriminatory power of RA, MLST, and MLVA, the discriminatory index (D) was calculated using 98 isolates of collection I that were typed by all three methods. The D-values based on data available for the complete collection of 122 isolates were also determined for RA and MLST.
Clustering concordance For comparison of the concordance between cluster or type assignments by different typing methods, the Adjusted Rand (AR) and Wallace (W) coefficients were calculated (2, 18). The AR coefficient represents the overall match between two methods. AR values close to 1 indicate a high level of congruence between methods while values close to 0 indicate a lack of congruence. The W coefficient represents the probability of two isolates sharing the same type by two methods. W values close to 1 indicate that the clustering obtained by the first method give a good prediction of the clustering determined by the second method.
Results Repeatability of RA All isolates were cultured and measured in triplicate generating 606 Raman spectra. The average ReproMatch value was 99.98%. The similarity cut-off used in the resulting dendrogram was based on the lowest ReproMatch value, found within the 95% CI of this collection, and was 99.97%. Using this value as a cut-off in the HCA, the three replicates of 118 out of 122 isolates (collection I) were found in

83
the same cluster (97%). For collection II a similar repeatability was observed with77 out of 80 isolate replicates in the same cluster (96%).
Discriminatory power and clustering concordance In the collection of 98 isolates, 52 RA types, 51 MLST types, and 56 MLVA-types were recognized (Table 2). For all three methods the discriminatory power was high. RA, MLST, and MLVA resp. showed D-values of 0.975, 0.966, and 0.947. For the complete collection I, the D-value was the same for both RA and MLST (0.979). MLST resulted in 69 different sequence types compared to 64 different RA types. Table 2. Comparison of the number of types and index of diversity (D) found for three different typing methods using strain collection I.
Isolates typed by Typing method RA, MLST and MLVA
a RA and MLST
b
Nr of types D CI Nr of types D CI RA 52 0.975 0.96-0.99 64 0.979 0.97-0.99 MLST 51 0.966 0.95-0.98 69 0.979 0.96-0.99 MLVA 56 0.947 0.92-0.97 a a total of 98 isolates were tested
b a total of 122 isolates were tested
In order to measure the concordance between the type assignment of the three different methods, AR and W were calculated for the subset of 98 isolates (Table 3). The values of AR and W between RA and MLST were generally higher than the values found between RA and MLVA. The highest AR value obtained was between RA and MLST (0.657), the other values were lower (0.337 and 0.272). The concordance between RA and MLVA as defined by W is relatively low. The W-value of 0.783 when comparing RA with MLST indicates that two isolates with the same RA type have a good probability of belonging to the same sequence type. Table 3. The Adjusted Rand coefficients (AR) and Wallace (W) coefficients for the three methods used to characterize 98 E. faecium isolates of strain collection I.
Adjusted Rand coefficients (AR) Wallace coefficients (W) Typing method Typing method RA MLST MLVA RA MLST MLVA RA 1.000 1.000 0.783 0.458 MLST 0.657 1.000 0.580 1.000 0.463 MLVA 0.272 0.337 1.000 0.222 0.300 1.000
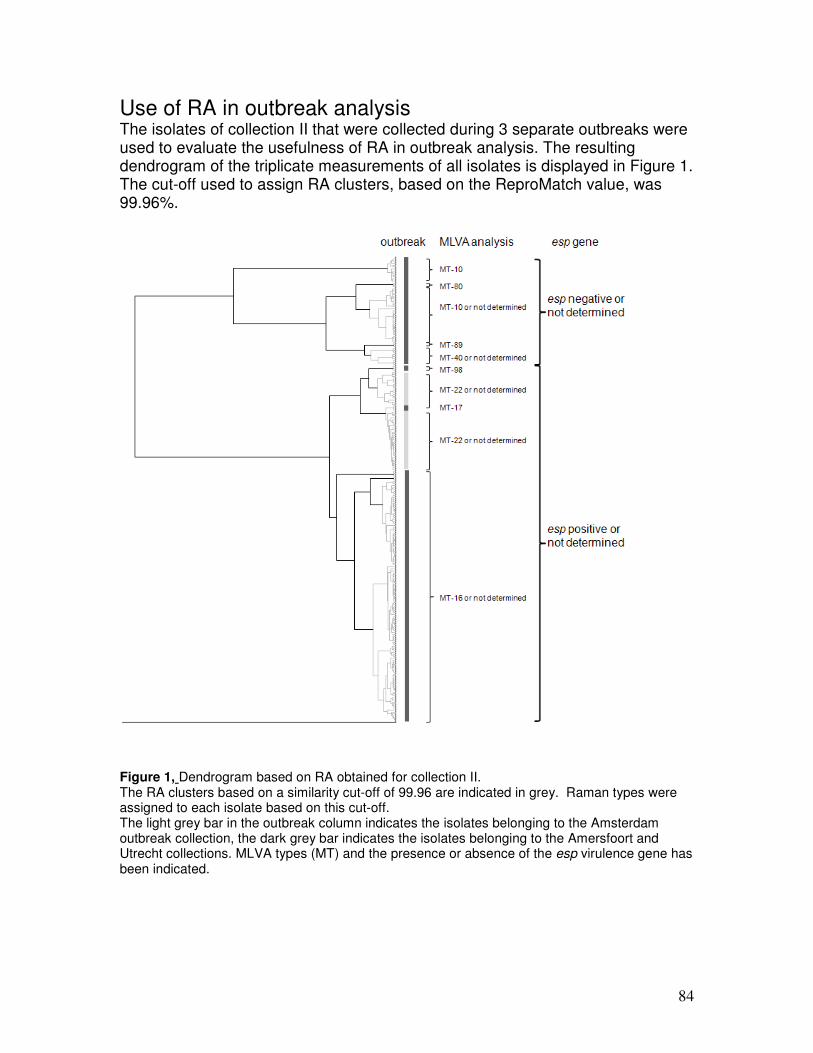
84
Use of RA in outbreak analysis The isolates of collection II that were collected during 3 separate outbreaks were used to evaluate the usefulness of RA in outbreak analysis. The resulting dendrogram of the triplicate measurements of all isolates is displayed in Figure 1. The cut-off used to assign RA clusters, based on the ReproMatch value, was 99.96%.
Figure 1, Dendrogram based on RA obtained for collection II. The RA clusters based on a similarity cut-off of 99.96 are indicated in grey. Raman types were assigned to each isolate based on this cut-off. The light grey bar in the outbreak column indicates the isolates belonging to the Amsterdam outbreak collection, the dark grey bar indicates the isolates belonging to the Amersfoort and Utrecht collections. MLVA types (MT) and the presence or absence of the esp virulence gene has been indicated.
85
Raman spectroscopy divided the isolates from the VRE outbreak in Amsterdam in 2 closely related Raman clusters containing 5 and 10 isolates. The two isolates with MLVA type 22 (MT-22) grouped in separate RA clusters. From the Utrecht and Amersfoort collections, a total of 65 isolates were analyzed, including 19 isolates representing an outbreak clone with MT-16, 6 MT-10 outbreak isolates and as a control 5 epidemiologically unlinked isolates representing MLVA types MT-17, MT-40, MT-80, MT-89 and MT-98, respectively. Finally, 35 isolates were included which were not previously typed by MLVA, but were isolated from patients during the MT-16 outbreak. RA divided this collection into 10 clusters (Figure 1). The isolates with MT-80, MT-89 and MT-98 formed a separate cluster. The MT-17 isolate grouped together with ten MT-22 isolates from the Amsterdam outbreak, while the MT-40 isolate grouped with three non typed isolates. Four of the MT-10 isolates were combined in one separate cluster. The remaining two MT-10 isolates grouped with a set of seven isolates that were not typed by MLVA. The MT-16 isolates grouped in two RA clusters with isolates that were not typed by MLVA. These clusters are closely related and each cluster contains isolates from both the Utrecht and Amersfoort outbreaks.
Presence of enterococcal surface protein gene For 68 isolates the presence of the enterococcal surface protein gene (esp) was determined. The dendrogram displayed in Figure 1 shows a separation into two groups at the lowest level of similarity. In the upper part of the dendrogram only clusters that contain esp-negative isolates or isolates for which the presence of the esp was not determined are found. All outbreak associated isolates belonging to MT-16 or MT-22 contain the esp gene. These isolates were all found in the lower part of the dendrogram in clusters containing only esp-positive isolates or isolates for which the presence of the esp was not determined.
Discussion Monitoring the spread of bacterial strains is essential for adequate epidemiological surveillance and infection prevention. Among others, this requires an easy to use and reliable typing system. In this study, a total of 202 E. faecium isolates was used to evaluate the use of RA as an epidemiological tying tool. The described procedure resulted in highly reproducible spectra; 96-97% of the replicate samples were assigned the same RA type. The discriminatory power of RA was determined by calculating the diversity index (D) which was compared to MLST and MLVA. This revealed that Raman spectroscopy was able to achieve a degree of discrimination that was similar to MLST and is more discriminatory compared to MLVA. The concordance between the three methods was relatively low. Raman based clustering showed the best concordance with MLST based typing (AR of 0.657). The chance that two isolates with the same Raman type belong to the same sequence type is 78% (W RA
�MLST is 0.783).
A reliable and fast test to distinguish epidemic from non-epidemic strains is essential for targeted infection control. Previous evaluation showed that using
86
genotyping methods to target infection control, in combination with enhanced hand-hygiene compliance, successfully controlled nosocomial spread of epidemic VRE (17). Here we evaluated if RA based typing of E. faecium, could be effectively used in a similar fashion as genotyping methods. The 15 isolates of the Amsterdam collection were all outbreak-related and divided into two Raman based clusters. No overlap is seen between these isolates and the MT-16 outbreak clones found in Amersfoort and Utrecht. In each Raman cluster, one of the two MT-22 isolates was found. The two Raman clusters are closely related, indicating a possible relationship between both groups. Strains derived from this outbreak were initially typed by AFLP analysis and based on > 90% homology of AFLP patterns (19) these isolates were considered identical. Since the AFLP pattern found for the two MT-22 isolates are different (25), this genotypic variance between the isolates explains the small differentiation that was found using RA. The MT-16 outbreak clones found in Amersfoort and Utrecht grouped in two closely related RA clusters. This finding is in agreement with previous research that revealed a possible relationship between the VRE outbreak in Amersfoort and Utrecht (16, 23). Two of the patients involved in the Amersfoort outbreak were previously admitted to the hospital in Utrecht. The Amersfoort and Utrecht outbreak clones were indistinguishable by MLVA and MLST, but small differences were found between the AFLP patterns (25). Expression of Esp by E. faecium is associated with the ability to form biofilms (8). It plays a role in a murine model of urinary tract infections and is, therefore, seen as an important virulence factor (13). Furthermore, the presence of the esp-gene is epidemiologically linked with hospital-derived isolates (25, 26). For the collection used in this study, RA clustered esp-positive isolates together and distinct from esp-negative isolates. In the analyzed isolate collection, RA made a clear distinction between hospital and community derived strains. Whether this observation can be used for diagnostic purposes should be validated with a much larger collection. The evaluation results obtained in this study show that RA is an easy to use alternative to genotyping. The reproducibility, discriminatory power, concordance with epidemiological data, and ease of use make RA a suitable technique for typing-targeted surveillance and infection control.
References 1. Bonten, M. J., R. Willems, and R. A. Weinstein. 2001. Vancomycin-resistant
enterococci: why are they here, and where do they come from? Lancet Infect Dis 1:314-25.
2. Carrico, J. A., C. Silva-Costa, J. Melo-Cristino, F. R. Pinto, H. de Lencastre, J. S. Almeida, and M. Ramirez. 2006. Illustration of a common framework for relating multiple typing methods by application to macrolide-resistant Streptococcus pyogenes. J Clin Microbiol 44:2524-32.
3. Cosgrove, S. E., Y. Qi, K. S. Kaye, S. Harbarth, A. W. Karchmer, and Y. Carmeli. 2005. The impact of methicillin resistance in Staphylococcus aureus bacteremia on patient outcomes: mortality, length of stay, and hospital charges. Infect Control Hosp Epidemiol 26:166-74.
87
4. Domig, K. J., H. K. Mayer, and W. Kneifel. 2003. Methods used for the isolation, enumeration, characterisation and identification of Enterococcus spp. 2. Pheno- and genotypic criteria. Int J Food Microbiol 88:165-88.
5. Gould, I. M. 2006. Costs of hospital-acquired methicillin-resistant Staphylococcus aureus (MRSA) and its control. Int J Antimicrob Agents 28:379-84.
6. Grundmann, H., S. Hori, and G. Tanner. 2001. Determining confidence intervals when measuring genetic diversity and the discriminatory abilities of typing methods for microorganisms. J Clin Microbiol 39:4190-2.
7. Harbarth, S., H. Sax, and P. Gastmeier. 2003. The preventable proportion of nosocomial infections: an overview of published reports. J Hosp Infect 54:258-66; quiz 321.
8. Heikens, E., M. J. Bonten, and R. J. Willems. 2007. Enterococcal surface protein esp is important for biofilm formation of Enterococcus faecium E1162. J Bacteriol 189:8233-40.
9. Homan, W. L., D. Tribe, S. Poznanski, M. Li, G. Hogg, E. Spalburg, J. D. Van Embden, and R. J. Willems. 2002. Multilocus sequence typing scheme for Enterococcus faecium. J Clin Microbiol 40:1963-71.
10. Hunter, P. R., and M. A. Gaston. 1988. Numerical index of the discriminatory ability of typing systems: an application of Simpson's index of diversity. J Clin Microbiol 26:2465-6.
11. Kirschner, C., K. Maquelin, P. Pina, N. A. Ngo Thi, L. P. Choo-Smith, G. D. Sockalingum, C. Sandt, D. Ami, F. Orsini, S. M. Doglia, P. Allouch, M. Mainfait, G. J. Puppels, and D. Naumann. 2001. Classification and identification of enterococci: a comparative phenotypic, genotypic, and vibrational spectroscopic study. J Clin Microbiol 39:1763-70.
12. Leavis, H. L., R. J. Willems, W. J. van Wamel, F. H. Schuren, M. P. Caspers, and M. J. Bonten. 2007. Insertion sequence-driven diversification creates a globally dispersed emerging multiresistant subspecies of E. faecium. PLoS Pathog 3:e7.
13. Leendertse, M., E. Heikens, L. M. Wijnands, M. van Luit-Asbroek, G. J. Teske, J. J. Roelofs, M. J. Bonten, T. van der Poll, and R. J. Willems. 2009. Enterococcal surface protein transiently aggravates Enterococcus faecium-induced urinary tract infection in mice. J Infect Dis 200:1162-5.
14. Maquelin, K., T. Hoogenboezem, J. W. Jachtenberg, R. Dumke, E. Jacobs, G. J. Puppels, N. G. Hartwig, and C. Vink. 2009. Raman spectroscopic typing reveals the presence of carotenoids in Mycoplasma pneumoniae. Microbiology 155:2068-77.
15. Mascini, E. M., and M. J. Bonten. 2005. Vancomycin-resistant enterococci: consequences for therapy and infection control. Clin Microbiol Infect 11 Suppl 4:43-56.
16. Mascini, E. M., A. C. Gigengack-Baars, R. J. Hene, T. E. Kamp-Hopmans, A. J. Weersink, and M. J. Bonten. 2000. [Epidemiologic increase of various genotypes of vancomycin-resistant Enterococcus faecium in a university hospital] Epidemische verheffing van verscheidene genotypen van vancomycineresistente Enterococcus faecium in een academisch ziekenhuis. Ned Tijdschr Geneeskd 144:2572-6.
17. Mascini, E. M., A. Troelstra, M. Beitsma, H. E. Blok, K. P. Jalink, T. E. Hopmans, A. C. Fluit, R. J. Hene, R. J. Willems, J. Verhoef, and M. J. Bonten. 2006. Genotyping and preemptive isolation to control an outbreak of vancomycin-resistant Enterococcus faecium. Clin Infect Dis 42:739-46.
18. Miragaia, M., J. A. Carrico, J. C. Thomas, I. Couto, M. C. Enright, and H. de Lencastre. 2008. Comparison of molecular typing methods for characterization of
88
Staphylococcus epidermidis: proposal for clone definition. J Clin Microbiol 46:118-29.
19. Timmers, G. J., W. C. van der Zwet, I. M. Simoons-Smit, P. H. Savelkoul, H. H. Meester, C. M. Vandenbroucke-Grauls, and P. C. Huijgens. 2002. Outbreak of vancomycin-resistant Enterococcus faecium in a haematology unit: risk factor assessment and successful control of the epidemic. Br J Haematol 116:826-33.
20. Top, J., L. M. Schouls, M. J. Bonten, and R. J. Willems. 2004. Multiple-locus variable-number tandem repeat analysis, a novel typing scheme to study the genetic relatedness and epidemiology of Enterococcus faecium isolates. J Clin Microbiol 42:4503-11.
21. Treitman, A. N., P. R. Yarnold, J. Warren, and G. A. Noskin. 2005. Emerging incidence of Enterococcus faecium among hospital isolates (1993 to 2002). J Clin Microbiol 43:462-3.
22. van Belkum, A., P. T. Tassios, L. Dijkshoorn, S. Haeggman, B. Cookson, N. K. Fry, V. Fussing, J. Green, E. Feil, P. Gerner-Smidt, S. Brisse, M. Struelens, and M. European Society of Clinical Microbiology and Infectious Diseases Study Group on Epidemiological. 2007. Guidelines for the validation and application of typing methods for use in bacterial epidemiology. Clin Microbiol Infect 13 Suppl 3:1-46.
23. van der Steen, L. F., M. J. Bonten, E. van Kregten, J. J. Harssema-Poot, R. Willems, and C. A. Gaillard. 2000. [Vancomycin-resistant Enterococcus faecium outbreak in a nephrology ward] Uitbraak van vancomycineresistente Enterococcus faecium op een afdeling Nefrologie. Ned Tijdschr Geneeskd 144:2568-72.
24. Werner, G., T. M. Coque, A. M. Hammerum, R. Hope, W. Hryniewicz, A. Johnson, I. Klare, K. G. Kristinsson, R. Leclercq, C. H. Lester, M. Lillie, C. Novais, B. Olsson-Liljequist, L. V. Peixe, E. Sadowy, G. S. Simonsen, J. Top, J. Vuopio-Varkila, R. J. Willems, W. Witte, and N. Woodford. 2008. Emergence and spread of vancomycin resistance among enterococci in Europe. Euro Surveill 13.
25. Willems, R. J., W. Homan, J. Top, M. van Santen-Verheuvel, D. Tribe, X. Manzioros, C. Gaillard, C. M. Vandenbroucke-Grauls, E. M. Mascini, E. van Kregten, J. D. van Embden, and M. J. Bonten. 2001. Variant esp gene as a marker of a distinct genetic lineage of vancomycin-resistant Enterococcus faecium spreading in hospitals. Lancet 357:853-5.
26. Willems, R. J., J. Top, M. van Santen, D. A. Robinson, T. M. Coque, F. Baquero, H. Grundmann, and M. J. Bonten. 2005. Global spread of vancomycin-resistant Enterococcus faecium from distinct nosocomial genetic complex. Emerg Infect Dis 11:821-8.
27. Willems, R. J., and W. van Schaik. 2009. Transition of Enterococcus faecium from commensal organism to nosocomial pathogen. Future Microbiol 4:1125-35.
28. Willemse-Erix, D. F., M. J. Scholtes-Timmerman, J. W. Jachtenberg, W. B. van Leeuwen, D. Horst-Kreft, T. C. Bakker Schut, R. H. Deurenberg, G. J. Puppels, A. van Belkum, M. C. Vos, and K. Maquelin. 2009. Optical fingerprinting in bacterial epidemiology: Raman spectroscopy as a real-time typing method. J Clin Microbiol 47:652-9.
29. Willemse-Erix, H. F., J. Jachtenberg, H. Barutci, G. J. Puppels, A. van Belkum, M. C. Vos, and K. Maquelin. 2009. Proof of principle for successful characterization of methicillin-resistant Coagulase Negative Staphylococci isolated from skin using Raman spectroscopy and Pulsed Field Gel Electrophoresis. J Clin Microbiol.
30. Witte, W., R. Wirth, and I. Klare. 1999. Enterococci. Chemotherapy 45:135-45
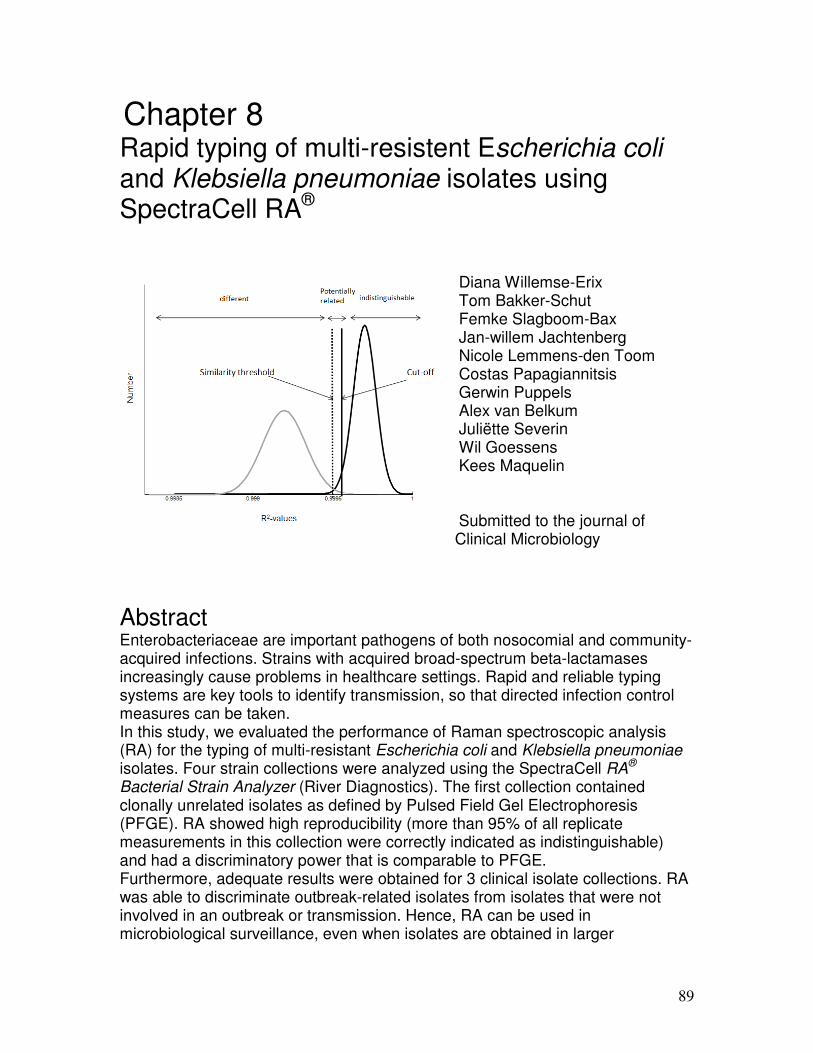
89
Chapter 8
Rapid typing of multi-resistent Escherichia coli and Klebsiella pneumoniae isolates using SpectraCell RA®
Diana Willemse-Erix Tom Bakker-Schut Femke Slagboom-Bax Jan-willem Jachtenberg Nicole Lemmens-den Toom Costas Papagiannitsis Gerwin Puppels Alex van Belkum Juliëtte Severin Wil Goessens Kees Maquelin
Submitted to the journal of Clinical Microbiology
Abstract Enterobacteriaceae are important pathogens of both nosocomial and community-acquired infections. Strains with acquired broad-spectrum beta-lactamases increasingly cause problems in healthcare settings. Rapid and reliable typing systems are key tools to identify transmission, so that directed infection control measures can be taken. In this study, we evaluated the performance of Raman spectroscopic analysis (RA) for the typing of multi-resistant Escherichia coli and Klebsiella pneumoniae isolates. Four strain collections were analyzed using the SpectraCell RA® Bacterial Strain Analyzer (River Diagnostics). The first collection contained clonally unrelated isolates as defined by Pulsed Field Gel Electrophoresis (PFGE). RA showed high reproducibility (more than 95% of all replicate measurements in this collection were correctly indicated as indistinguishable) and had a discriminatory power that is comparable to PFGE. Furthermore, adequate results were obtained for 3 clinical isolate collections. RA was able to discriminate outbreak-related isolates from isolates that were not involved in an outbreak or transmission. Hence, RA can be used in microbiological surveillance, even when isolates are obtained in larger
90
geographical areas or over a longer time period. Since the the β-lactamase content of an isolate does not affect the obtained RA classification, this technique is able to distinguish between clones harboring identical ESBL-gene types. It can be concluded that RA is a suitable typing technique for E. coli and K. pneumoniae isolates. Combining high reproducibility, speed and ease-of-use, this technique can play an important role in monitoring these important nosocomial species.
Introduction Enterobacteriaceae are important pathogens causing nosocomial and community-acquired infections (19). The emergence of multi-antibiotic resistance in Enterobacteriaceae is of great concern (7, 18). Resistance to e.g. third-generation cephalosporins is typically associated with the acquisition of plasmids that contain genes encoding extended-spectrum β-lactamases (ESBLs). These plasmids often carry further resistance genes as well. Resistance to carbapenems has been uncommon until now. To date, Klebsiella pneumoniae has acquired a novel mechanism conferring resistance to carbapenems, known as K. pneumoniae carbapenemase (KPC) β-lactamase (19). In recent years, the overall number of infections by ESBL-producing Enterobacteriaceae has been rising (21). Approximately 20% of K. pneumoniae infections in intensive care units in the United States are now caused by isolates that are resistant to third-generation cephalosporins (15). Escherichia coli isolates, especially the highly virulent CTX-M-15-producing B2-Escherichia coli O25b-ST131, are associated with urinary tract infections (8). The epidemiology of resistance is complex since it is believed that it combines the spread of certain bacterial strains with the independent spread of mobile genetic elements such as plasmids and transposons. However, several studies show that transmission is associated with spread of a single successful clone (13, 16, 17, 23). Furthermore, patients with infections, but also colonized patients and the environment may serve as reservoirs (1). In general, standard infection control measures can reduce up to 30-40% of nosocomial infections by prevention of transmission (6, 24). When an outbreak is suspected, additional actions should be taken. Using a typing system in routine diagnostics, e.g. for certain alert organisms or on high-risk wards, would facilitate the early detection of transmission. In recent years, Raman spectroscopic analysis (RA) has been validated for the bacterial typing of different species (12, 25, 26). In these studies it was shown that RA is a fast and easy-to-use typing system that is applicable for a range of species. In the present study, a RA-based protocol was developed for the epidemiological typing of E. coli and K. pneumoniae isolates. Using multiple collections of ESBL- or KPC-producing isolates, the value of RA in surveillance and detection of hospital outbreaks is explored.
91
Materials and methods Strain collections. A total of 241 isolates were used, comprised of four different sub collections. Isolates were stored at -80°C in glycerol containing brain heart infusion broth (BHI; Becton Dickinson, Franklin Lakes, NJ) until further use. Collection I comprised of 96 isolates and was used for the technical evaluation of RA (reproducibility of RA measurements and discriminatory power). This collection consisted of 48 ESBL-positive E. coli isolates and 38 ESBL-positive K. pneumoniae isolates that were obtained during a 4 month surveillance study in Surabaya, Indonesia (22). Another 10 K. pneumoniae isolates were selected from the collection of clinical isolates of the Department of Medical Microbiology and Infectious Diseases of the Erasmus MC, (Rotterdam, The Netherlands). All isolates in collection I were obtained from different patients and were classified as genetically unrelated based on Pulsed Field Gel Electrophoresis (PFGE) (22). Collection II was used for retrospective outbreak analysis. It contained 38 K. pneumoniae isolates from a previously described outbreak on a surgical ward in Lelystad, The Netherlands (5). Based on PFGE results, 20 SHV-5 producing isolates were involved in the outbreak, whereas 18 isolates, isolated in the same hospital in the same time period, showed unique PFGE patterns. Collection III contained 24 KPC-2 producing K. pneumoniae isolates that were selected from a large surveillance study performed at the Microbiology Department of the National School of Public Health (Athens, Greece) (3).This collection also contained one VIM-1 producing K. pneumoniae isolate. This isolate was not included in the above study, but was isolated in a previous time period. The isolates were collected from hospitals all over Greece in an 18 month time period. Isolates displaying a similarity of 85% or more in their PFGE profile were considered to belong to the same PFGE type. Isolates were also typed by multi-locus sequence typing (MLST) (4). The presence of the blaKPC gene was confirmed by PCR and sequencing (3). This collection was used to evaluate the accuracy of RA to identify possible epidemic spread of a K. pneumoniae strain over a prolonged period of time and in a larger geographical area. Collection IV was used to evaluate the accuracy to identify E. coli strains carrying different ESBL genes isolated at the Erasmus MC in Rotterdam. This collection contained 82 E. coli strains obtained from different patients in 2008. Characterization of the β-lactamase genes was performed by different PCR based methods, amplicons were subsequently sequenced (11, 14, 28). All isolates were previously typed using the repetitive-sequence-based PCR (rep-PCR) DiversiLab Microbial Typing System® (bioMérieux) as described by Lau et al (9).
Raman spectroscopy Isolates were grown on Trypticase Soy Agar (TSA, Becton Dickinson, Franklin Lakes, NJ, USA). Culturing and sample preparation were performed as described

92
previously (27). Briefly, isolates were cultured for 20h at 35°C to obtain a confluent bacterial layer. From this culture, biomass was suspended in water, transferred to a MicroSlide sample carrier (River Diagnostics BV, Rotterdam, The Netherlands) and allowed to dry. Raman spectra were collected using the SpectraCellRA® Bacterial Strain Analyzer (River Diagnostics) according to the manufacturer’s instructions.
Data analysis Spectrum pretreatment and cluster analysis were performed using the SpectraCellRA software (River Diagnostics). Histogram plots and correlation matrices were created using MATLAB version 7.1 (The MathWorks, Natick, MA, USA).
Reproducibility and discriminatory power of RA In the SpectraCellRA software, the similarity between two measured samples is expressed as the squared Pearson correlation coefficient (R2-value). Similarity between replicate spectra of the same isolate account for any signal variance due to differences in culturing, sample preparation, or actual Raman measurement. A representative distribution of these similarity or R2-values is visualized by the black curve in Figure 1. The width of such a curve is a measure for reproducibility of RA and preferably is as narrow as possible. To be able to use Raman spectra for bacterial typing, it should be possible to discriminate between genetically non-related isolates. Therefore, the similarity between spectra of non-related isolates should be lower than the similarity between spectra of repeated measurements of the same isolate. A representative distribution of the similarities between isolates is indicated by the grey curve in Figure 1. The overlap between both curves indicates the discriminatory power of RA. The smaller the overlap, the better RA is able to discriminate isolates.
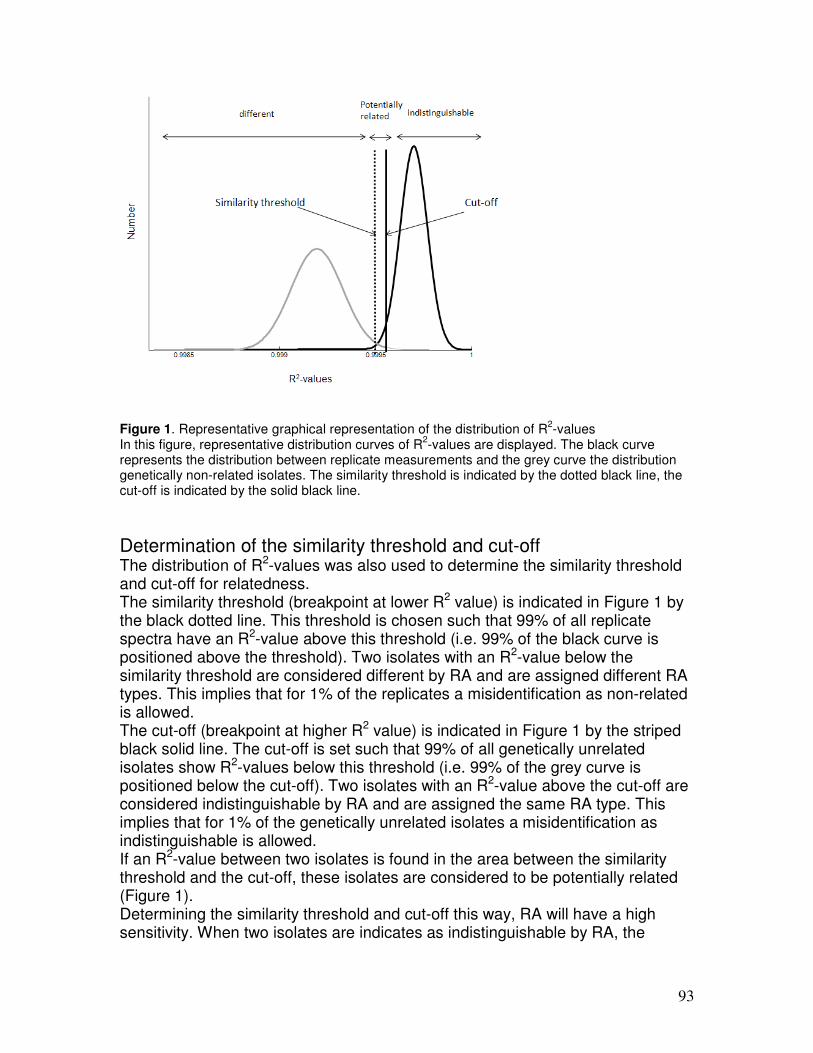
93
Figure 1. Representative graphical representation of the distribution of R
2-values
In this figure, representative distribution curves of R2-values are displayed. The black curve
represents the distribution between replicate measurements and the grey curve the distribution genetically non-related isolates. The similarity threshold is indicated by the dotted black line, the cut-off is indicated by the solid black line.
Determination of the similarity threshold and cut-off The distribution of R2-values was also used to determine the similarity threshold and cut-off for relatedness. The similarity threshold (breakpoint at lower R2 value) is indicated in Figure 1 by the black dotted line. This threshold is chosen such that 99% of all replicate spectra have an R2-value above this threshold (i.e. 99% of the black curve is positioned above the threshold). Two isolates with an R2-value below the similarity threshold are considered different by RA and are assigned different RA types. This implies that for 1% of the replicates a misidentification as non-related is allowed. The cut-off (breakpoint at higher R2 value) is indicated in Figure 1 by the striped black solid line. The cut-off is set such that 99% of all genetically unrelated isolates show R2-values below this threshold (i.e. 99% of the grey curve is positioned below the cut-off). Two isolates with an R2-value above the cut-off are considered indistinguishable by RA and are assigned the same RA type. This implies that for 1% of the genetically unrelated isolates a misidentification as indistinguishable is allowed. If an R2-value between two isolates is found in the area between the similarity threshold and the cut-off, these isolates are considered to be potentially related (Figure 1). Determining the similarity threshold and cut-off this way, RA will have a high sensitivity. When two isolates are indicates as indistinguishable by RA, the

94
accuracy is very high. Most of the matches that are missed will be indicated as potentially related and need further research. Only in 1% of all cases a match (and thus an outbreak) will be missed.
Correlation matrix To analyze spectral relationships between different isolates, a correlation matrix was created. This matrix displays the similarity of each pair of spectra using a color index. The diagonal indicates R2-values of 1, since this represents the similarity of each isolate with itself. The values above the diagonal are the reverse graphic image of the values below this diagonal. In each matrix, black clusters indicate isolates that are indistinguishable based on the previously set cut-off. The white areas indicate samples that are classified as non-related based on the previously set similarity threshold. The samples that are potentially related are indicated by shades of grey (light grey indicates lower similarities, dark grey indicates higher similarities) Spectra were sorted based on similarity. Each horizontal line in the matrix represents all R2-values of an isolate with all other isolates in the matrix. Correlation coefficients were calculated between each group of R2-values. By sorting these correlation coefficients based on height, those isolates with high similarity are grouped together.
Results Reproducibility of RA and discrimination between non-related isolates The repeatability of RA was determined for E. coli and K. pneumoniae separately using the isolates of collection I. All isolates were measured in triplicate, generating 288 Raman spectra. Figure 2 displays the R2 distributions between replicates (in black) and between genotypic non-related isolates (in grey). For both species, the distribution of R2-values between replicates is narrow and the overlap with the non-related distribution is low. The similarity threshold was 0.9993 for both species. The calculated cut-off was 0.9995 for K. pneumoniae and 0.9996 for E. coli. For the replicate measurements of the K. pneumoniae isolates, it was found that 95% was correctly indicated as indistinguishable and 5% as possibly related. For E. coli it was found that 97% of the replicate measurements were correctly identified as indistinguishable and 3% as possibly related. None of the replicate measurements were incorrectly classifies as non-related. To evaluate the discriminatory power of RA, the ability to distinguish genotypically non-related isolates was tested. For both species it was found that RA was able to classify 95% of the isolates as non-related. For E. coli, two isolates were identified as potentially related while two K. pneumoniae isolates were found to be indistinguishable.
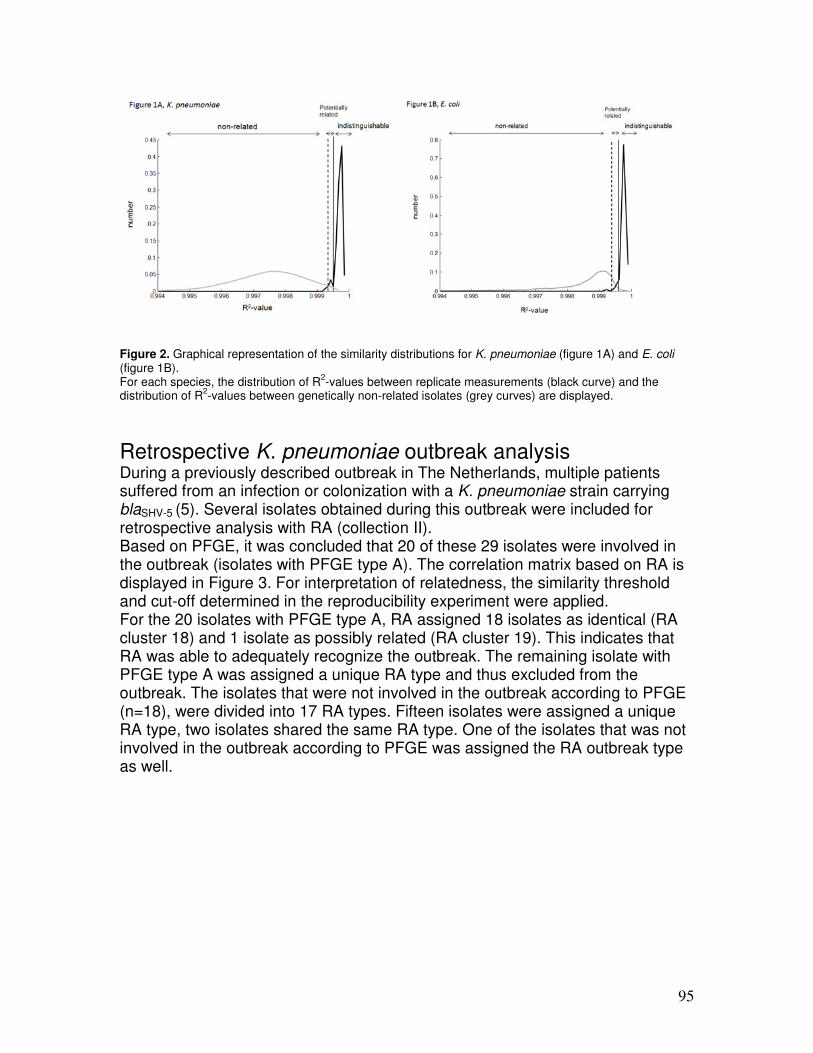
95
Figure 2. Graphical representation of the similarity distributions for K. pneumoniae (figure 1A) and E. coli (figure 1B). For each species, the distribution of R
2-values between replicate measurements (black curve) and the
distribution of R2-values between genetically non-related isolates (grey curves) are displayed.
Retrospective K. pneumoniae outbreak analysis During a previously described outbreak in The Netherlands, multiple patients suffered from an infection or colonization with a K. pneumoniae strain carrying blaSHV-5 (5). Several isolates obtained during this outbreak were included for retrospective analysis with RA (collection II). Based on PFGE, it was concluded that 20 of these 29 isolates were involved in the outbreak (isolates with PFGE type A). The correlation matrix based on RA is displayed in Figure 3. For interpretation of relatedness, the similarity threshold and cut-off determined in the reproducibility experiment were applied. For the 20 isolates with PFGE type A, RA assigned 18 isolates as identical (RA cluster 18) and 1 isolate as possibly related (RA cluster 19). This indicates that RA was able to adequately recognize the outbreak. The remaining isolate with PFGE type A was assigned a unique RA type and thus excluded from the outbreak. The isolates that were not involved in the outbreak according to PFGE (n=18), were divided into 17 RA types. Fifteen isolates were assigned a unique RA type, two isolates shared the same RA type. One of the isolates that was not involved in the outbreak according to PFGE was assigned the RA outbreak type as well.
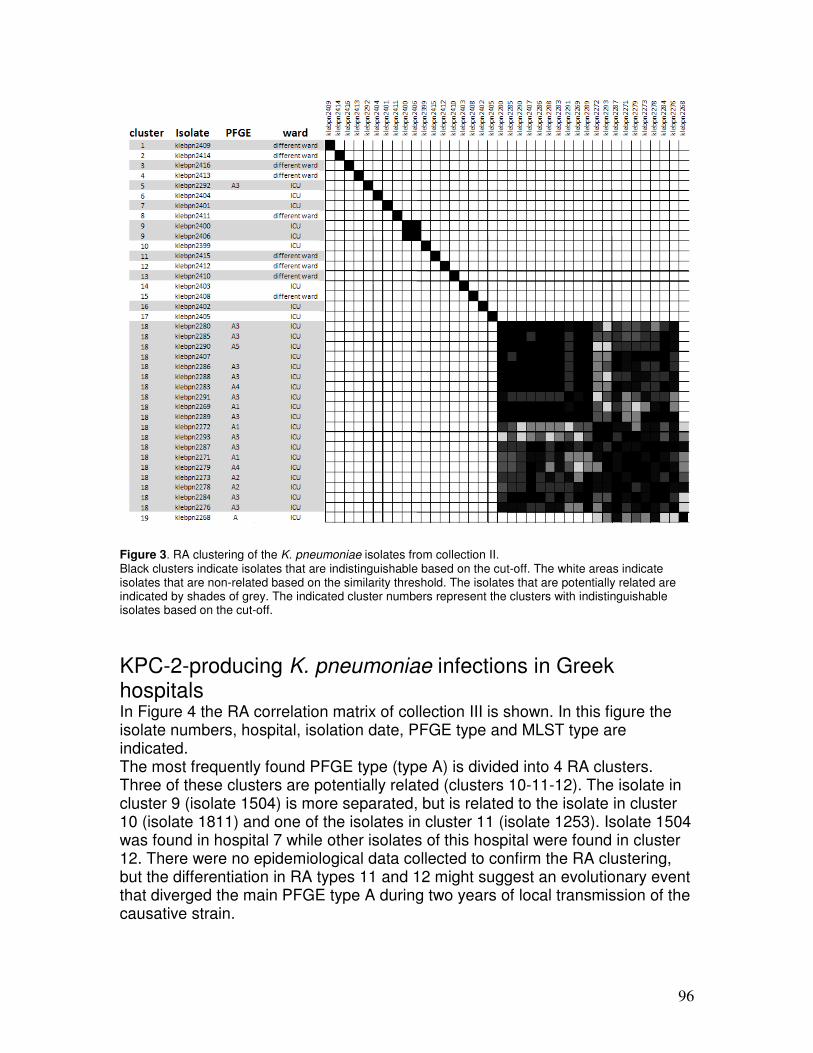
96
Figure 3. RA clustering of the K. pneumoniae isolates from collection II. Black clusters indicate isolates that are indistinguishable based on the cut-off. The white areas indicate isolates that are non-related based on the similarity threshold. The isolates that are potentially related are indicated by shades of grey. The indicated cluster numbers represent the clusters with indistinguishable isolates based on the cut-off.
KPC-2-producing K. pneumoniae infections in Greek hospitals In Figure 4 the RA correlation matrix of collection III is shown. In this figure the isolate numbers, hospital, isolation date, PFGE type and MLST type are indicated. The most frequently found PFGE type (type A) is divided into 4 RA clusters. Three of these clusters are potentially related (clusters 10-11-12). The isolate in cluster 9 (isolate 1504) is more separated, but is related to the isolate in cluster 10 (isolate 1811) and one of the isolates in cluster 11 (isolate 1253). Isolate 1504 was found in hospital 7 while other isolates of this hospital were found in cluster 12. There were no epidemiological data collected to confirm the RA clustering, but the differentiation in RA types 11 and 12 might suggest an evolutionary event that diverged the main PFGE type A during two years of local transmission of the causative strain.
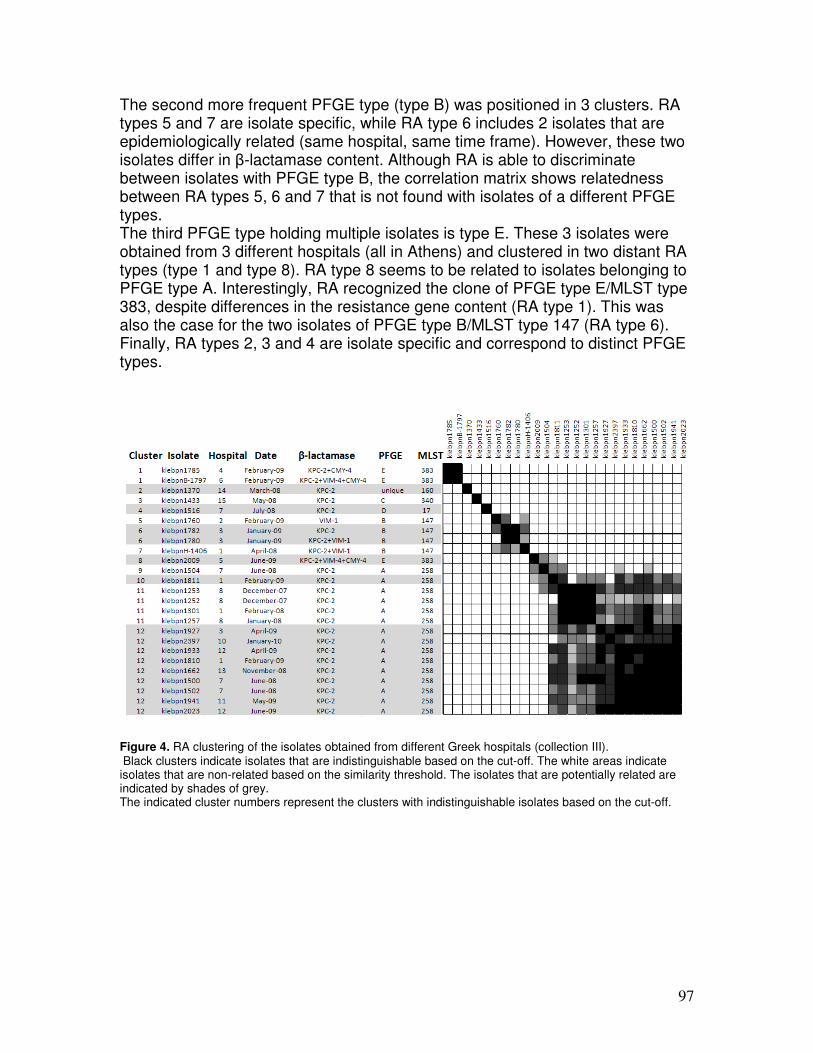
97
The second more frequent PFGE type (type B) was positioned in 3 clusters. RA types 5 and 7 are isolate specific, while RA type 6 includes 2 isolates that are epidemiologically related (same hospital, same time frame). However, these two isolates differ in β-lactamase content. Although RA is able to discriminate between isolates with PFGE type B, the correlation matrix shows relatedness between RA types 5, 6 and 7 that is not found with isolates of a different PFGE types. The third PFGE type holding multiple isolates is type E. These 3 isolates were obtained from 3 different hospitals (all in Athens) and clustered in two distant RA types (type 1 and type 8). RA type 8 seems to be related to isolates belonging to PFGE type A. Interestingly, RA recognized the clone of PFGE type E/MLST type 383, despite differences in the resistance gene content (RA type 1). This was also the case for the two isolates of PFGE type B/MLST type 147 (RA type 6). Finally, RA types 2, 3 and 4 are isolate specific and correspond to distinct PFGE types.
Figure 4. RA clustering of the isolates obtained from different Greek hospitals (collection III). Black clusters indicate isolates that are indistinguishable based on the cut-off. The white areas indicate isolates that are non-related based on the similarity threshold. The isolates that are potentially related are indicated by shades of grey. The indicated cluster numbers represent the clusters with indistinguishable isolates based on the cut-off.

98
Prevalence of ESBL positive E. coli strains in a tertiary care center in The Netherlands In 2008, 85 ESBL-positive E.coli isolates were found at the Erasmus MC (collection IV). Characterization of the β-lactamase genes revealed that 77 (90%) of the isolates were positive for CTX-M. Resistance genes blaCTX-M-15 (47%), blaCTX-M-61 (25%) and blaCTX-M-14 (14%) were the most frequently observed genes. The results of the RA analysis and rep-PCR analysis are summarized in Table 1. Both techniques demonstrate lack of clonality between E. coli isolates since in all groups of bla-genes, multiple RA and rep-PCR types were found. Only among the CTX-M-15 containing isolates, several indistinguishable isolates were found. The 41 isolates harboring this ESBL-gene were divided into 20 different RA types. In total 22 isolates were found in two large RA clusters; RA type M (n=10) and RA type N (n=12). It was also found that these two clusters are related and that all 22 isolates belong to the same rep-PCR type. Furthermore, these isolates belong to the virulent B2 phylogenetic group. Table 1. characterization of β-lactamase genes and clonallity based on RA and rep-PCR for the ESBL-positive isolates of collectionIV
ESBL-gene Number of isolates Number of RA
clusters Number of rep-PCR clusters
CTX-M 1 1 1 1 CTX-M 2 2 2 2 CTX-M 8 1 1 1 CTX-M 14 11 10
1 10
1
CTX-M 15 41 20 2 15
2
CTX-M 27 1 1 1 CTX-M 61 18 18 17 TEM-19 1 1 1 TEM 52 6 6 6 1 two isolates were indistinguishable using both techniques
2 RA type M (n=10) and RA type N (n=12) are potentially related. These 22 isolates belong to rep-PCR type
1 (n=25)
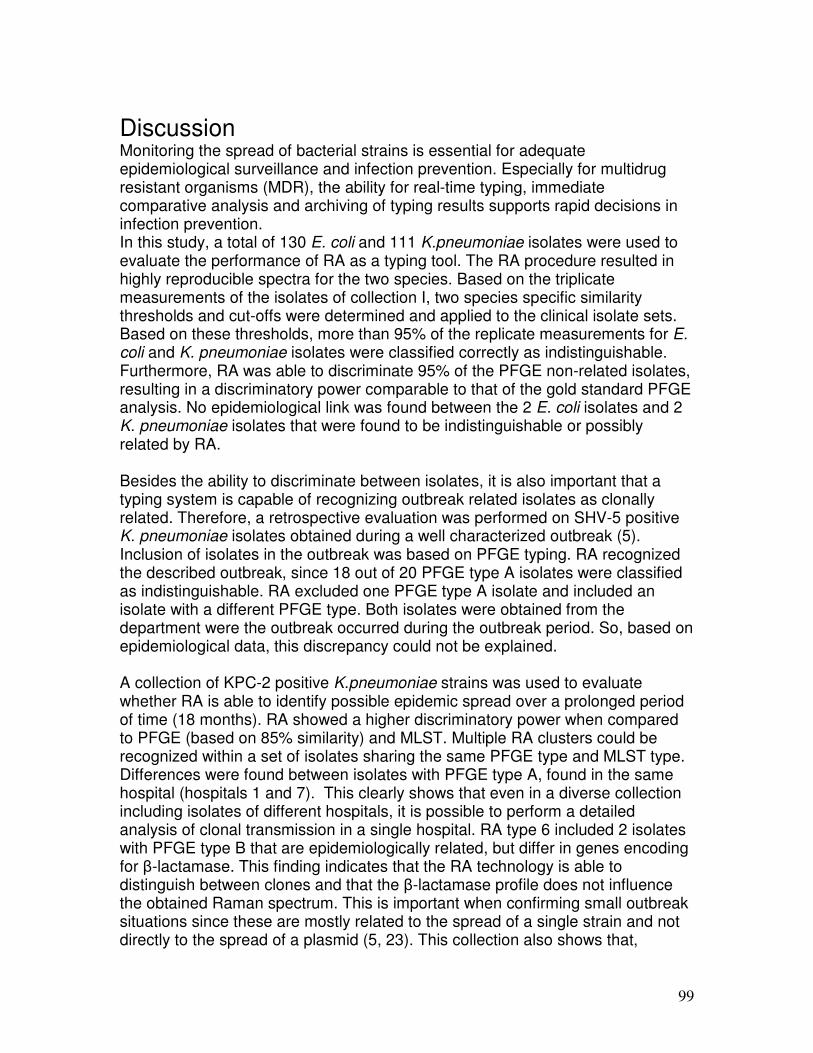
99
Discussion Monitoring the spread of bacterial strains is essential for adequate epidemiological surveillance and infection prevention. Especially for multidrug resistant organisms (MDR), the ability for real-time typing, immediate comparative analysis and archiving of typing results supports rapid decisions in infection prevention. In this study, a total of 130 E. coli and 111 K.pneumoniae isolates were used to evaluate the performance of RA as a typing tool. The RA procedure resulted in highly reproducible spectra for the two species. Based on the triplicate measurements of the isolates of collection I, two species specific similarity thresholds and cut-offs were determined and applied to the clinical isolate sets. Based on these thresholds, more than 95% of the replicate measurements for E. coli and K. pneumoniae isolates were classified correctly as indistinguishable. Furthermore, RA was able to discriminate 95% of the PFGE non-related isolates, resulting in a discriminatory power comparable to that of the gold standard PFGE analysis. No epidemiological link was found between the 2 E. coli isolates and 2 K. pneumoniae isolates that were found to be indistinguishable or possibly related by RA. Besides the ability to discriminate between isolates, it is also important that a typing system is capable of recognizing outbreak related isolates as clonally related. Therefore, a retrospective evaluation was performed on SHV-5 positive K. pneumoniae isolates obtained during a well characterized outbreak (5). Inclusion of isolates in the outbreak was based on PFGE typing. RA recognized the described outbreak, since 18 out of 20 PFGE type A isolates were classified as indistinguishable. RA excluded one PFGE type A isolate and included an isolate with a different PFGE type. Both isolates were obtained from the department were the outbreak occurred during the outbreak period. So, based on epidemiological data, this discrepancy could not be explained. A collection of KPC-2 positive K.pneumoniae strains was used to evaluate whether RA is able to identify possible epidemic spread over a prolonged period of time (18 months). RA showed a higher discriminatory power when compared to PFGE (based on 85% similarity) and MLST. Multiple RA clusters could be recognized within a set of isolates sharing the same PFGE type and MLST type. Differences were found between isolates with PFGE type A, found in the same hospital (hospitals 1 and 7). This clearly shows that even in a diverse collection including isolates of different hospitals, it is possible to perform a detailed analysis of clonal transmission in a single hospital. RA type 6 included 2 isolates with PFGE type B that are epidemiologically related, but differ in genes encoding for β-lactamase. This finding indicates that the RA technology is able to distinguish between clones and that the β-lactamase profile does not influence the obtained Raman spectrum. This is important when confirming small outbreak situations since these are mostly related to the spread of a single strain and not directly to the spread of a plasmid (5, 23). This collection also shows that,

100
although the discriminatory power of RA is high, it is still possible to follow clones over an extended period of time by looking into the related clusters. These results are generally in line with the results of the currently preferred typing techniques (PFGE and MLST). The final isolate collection used, harbored 82 ESBL-positive E. coli isolates which were obtained in 2008 at the Erasmus MC. Characterization of the bla genes revealed that the major class of ESBLs is CTX-M (90.6%). Within these isolates, 47% are blaCTX-M-15 positive. This confirms that strain harboring this ESBL-gene are a major problem worldwide (1, 2, 10). RA typing seems to lack association with antibiotic resistance profiles since multiple clusters were found within a collection of strains harboring the same ESBL type. However, RA revealed two predominant clusters consisting of 12 and 10 isolates. These two clusters were found to be related and to belong to the same rep-PCR type. All isolates posses CTX-M-15, with high resistance to non β-lactam antibiotics. This shows that it is possible to identify certain clonal lineages that correlate with the presence of a certain ESBL type. Furthermore, RA showed a good concordance with rep-PCR and this technique was proven previously to be useful in the detection of ESBL-producing E. coli isolates that belong to the clonal complex ST131 (9, 16, 20). Based on the collections used in this evaluation, RA revealed high reproducibility and discriminative power comparable to established techniques such as PFGE. Adequate results could be obtained for the clinical isolates studied in more detail, using a defined similarity threshold and cut-off. Based on the high discriminative power, RA can be used to define outbreaks that occur over a short time interval. Results obtained for collection III show that RA is able to discriminate within a group of isolates that share the same PFGE or MLST type. However, it was also shown that these RA clusters are potentially related to each other and not related to RA clusters harboring different PFGE or MLST types. These findings indicate that RA provides results that would be of immediate use in a surveillance study. The importance of monitoring the epidemiology of E. coli and K. pneumoniae is evident in the light of the rapid evolution of antimicrobial resistance in these species. Combining high reproducibility, speed and ease-of-use, RA can play an important role in detecting the pandemic spread of the most relevant clonal strains.
Acknowledgements The authors like to thank prof. dr. Alkiviadis Vatopoulos from the Department of Microbiology, of the National School of Public Health (Athens, Greece) for his comments and reviewing of the manuscript.
References 1. Cantón, R., A. Novais, A. Valverde, E. Machado, L. Peixe, F. Baquero, and T. M.
Coque. 2008. Prevalence and spread of extended-spectrum beta-lactamase-producing Enterobacteriaceae in Europe. Clin Microbiol Infect 14 Suppl 1:144-53.
101
2. Coque, T. M., A. Novais, A. Carattoli, L. Poirel, J. Pitout, L. Peixe, F. Baquero, R. Cantón, and P. Nordmann. 2008. Dissemination of clonally related Escherichia coli strains expressing extended-spectrum beta-lactamase CTX-M-15. Emerg Infect Dis 14:195-200.
3. Giakkoupi, P., H. Maltezou, M. Polemis, O. Pappa, G. Saroglou, A. Vatopoulos, and R. Greek System for the Surveillance of Antimicrobial. 2009. KPC-2-producing Klebsiella pneumoniae infections in Greek hospitals are mainly due to a hyperepidemic clone. Euro Surveill 14.
4. Giakkoupi, P., C. C. Papagiannitsis, V. Miriagou, O. Pappa, M. Polemis, K. Tryfinopoulou, L. S. Tzouvelekis, and A. C. Vatopoulos. 2011. An update of the evolving epidemic of blaKPC-2-carrying Klebsiella pneumoniae in Greece (2009-10). J Antimicrob Chemother 66:1510-3.
5. Gruteke, P., W. Goessens, J. Van Gils, P. Peerbooms, N. Lemmens-den Toom, M. Van Santen-Verheuvel, A. Van Belkum, and H. Verbrugh. 2003. Patterns of resistance associated with integrons, the extended-spectrum beta-lactamase SHV-5 gene, and a multidrug efflux pump of Klebsiella pneumoniae causing a nosocomial outbreak. J Clin Microbiol 41:1161-6.
6. Harbarth, S., H. Sax, and P. Gastmeier. 2003. The preventable proportion of nosocomial infections: an overview of published reports. J Hosp Infect 54:258-66; quiz 321.
7. Henshke-Bar-Meir, R., A. M. Yinnon, B. Rudensky, D. Attias, Y. Schlesinger, and D. Raveh. 2006. Assessment of the clinical significance of production of extended-spectrum beta-lactamases (ESBL) by Enterobacteriaceae. Infection 34:66-74.
8. Jacobsen, S. M., D. J. Stickler, H. L. Mobley, and M. E. Shirtliff. 2008. Complicated catheter-associated urinary tract infections due to Escherichia coli and Proteus mirabilis. Clin Microbiol Rev 21:26-59.
9. Lau, S. H., J. Cheesborough, M. E. Kaufmann, N. Woodford, A. R. Dodgson, K. J. Dodgson, E. J. Bolton, A. J. Fox, and M. Upton. 2010. Rapid identification of uropathogenic Escherichia coli of the O25:H4-ST131 clonal lineage using the DiversiLab repetitive sequence-based PCR system. Clin Microbiol Infect 16:232-7.
10. Lau, S. H., M. E. Kaufmann, D. M. Livermore, N. Woodford, G. A. Willshaw, T. Cheasty, K. Stamper, S. Reddy, J. Cheesbrough, F. J. Bolton, A. J. Fox, and M. Upton. 2008. UK epidemic Escherichia coli strains A-E, with CTX-M-15 beta-lactamase, all belong to the international O25:H4-ST131 clone. J Antimicrob Chemother 62:1241-4.
11. Mabilat C, and S. Goussard. 1993. PCR detection and identification of genes for extended-spectrum ß-lactamases. Diagnostic molecular microbiology: principles and applications. Edited by Persing DH, Smith TF, Tenover FC, White TJ:p. 553-9.
12. Maquelin, K., L. Dijkshoorn, T. J. van der Reijden, and G. J. Puppels. 2006. Rapid epidemiological analysis of Acinetobacter strains by Raman spectroscopy. J Microbiol Methods 64:126-31.
13. Nordmann, P., G. Cuzon, and T. Naas. 2009. The real threat of Klebsiella pneumoniae carbapenemase-producing bacteria. Lancet Infect Dis 9:228-36.
14. Nuesch-Inderbinen, M. T., H. Hachler, and F. H. Kayser. 1996. Detection of genes coding for extended-spectrum SHV beta-lactamases in clinical isolates by a molecular genetic method, and comparison with the E test. Eur J Clin Microbiol Infect Dis 15:398-402.
102
15. Paterson, D. L. 2006. Resistance in gram-negative bacteria: Enterobacteriaceae. Am J Infect Control 34:S20-8; discussion S64-73.
16. Peirano, G., M. Costello, and J. D. Pitout. Molecular characteristics of extended-spectrum beta-lactamase-producing Escherichia coli from the Chicago area: high prevalence of ST131 producing CTX-M-15 in community hospitals. Int J Antimicrob Agents 36:19-23.
17. Peirano, G., and J. D. Pitout. Molecular epidemiology of Escherichia coli producing CTX-M beta-lactamases: the worldwide emergence of clone ST131 O25:H4. Int J Antimicrob Agents 35:316-21.
18. Pitout, J. D. Infections with extended-spectrum beta-lactamase-producing enterobacteriaceae: changing epidemiology and drug treatment choices. Drugs 70:313-33.
19. Pitout, J. D. 2008. Multiresistant Enterobacteriaceae: new threat of an old problem. Expert Rev Anti Infect Ther 6:657-69.
20. Pitout, J. D., L. Campbell, D. L. Church, P. W. Wang, D. S. Guttman, and D. B. Gregson. 2009. Using a commercial DiversiLab semiautomated repetitive sequence-based PCR typing technique for identification of Escherichia coli clone ST131 producing CTX-M-15. J Clin Microbiol 47:1212-5.
21. Pitout, J. D., P. Nordmann, K. B. Laupland, and L. Poirel. 2005. Emergence of Enterobacteriaceae producing extended-spectrum beta-lactamases (ESBLs) in the community. J Antimicrob Chemother 56:52-9.
22. Severin, J. A., N. M. Mertaniasih, K. Kuntaman, E. S. Lestari, M. Purwanta, N. Lemmens-den Toom, D. O. Duerink, U. Hadi, A. van Belkum, H. A. Verbrugh, and W. H. Goessens; Study Group 'Antimicrobial Resistance in Indonesia: Prevalence and Prevention' (AMRIN). 2010. Molecular characterization of extended-spectrum beta-lactamases in clinical Escherichia coli and Klebsiella pneumoniae isolates from Surabaya, Indonesia. J Antimicrob Chemother 65:465-9.
23. Warren, R. E., G. Harvey, R. Carr, D. Ward, and A. Doroshenko. 2008. Control of infections due to extended-spectrum beta-lactamase-producing organisms in hospitals and the community. Clin Microbiol Infect 14 Suppl 1:124-33.
24. Weist, K., K. Pollege, I. Schulz, H. Ruden, and P. Gastmeier. 2002. How many nosocomial infections are associated with cross-transmission? A prospective cohort study in a surgical intensive care unit. Infect Control Hosp Epidemiol 23:127-32.
25. Willemse-Erix, D. F., J. W. Jachtenberg, T. B. Schut, W. van Leeuwen, A. van Belkum, G. Puppels, and K. Maquelin. Towards Raman-based epidemiological typing of Pseudomonas aeruginosa. J Biophotonics 3:506-11.
26. Willemse-Erix, D. F., M. J. Scholtes-Timmerman, J. W. Jachtenberg, W. B. van Leeuwen, D. Horst-Kreft, T. C. Bakker Schut, R. H. Deurenberg, G. J. Puppels, A. van Belkum, M. C. Vos, and K. Maquelin. 2009. Optical fingerprinting in bacterial epidemiology: Raman spectroscopy as a real-time typing method. J Clin Microbiol 47:652-9.
27. Willemse-Erix, H. F., J. Jachtenberg, H. Barutci, G. J. Puppels, A. van Belkum, M. C. Vos, and K. Maquelin. Proof of principle for successful characterization of methicillin-resistant coagulase-negative staphylococci isolated from skin by use of Raman spectroscopy and pulsed-field gel electrophoresis. J Clin Microbiol 48:736-40.
28. Woodford, N., E. J. Fagan, and M. J. Ellington. 2006. Multiplex PCR for rapid detection of genes encoding CTX-M extended-spectrum (beta)-lactamases. J Antimicrob Chemother 57:154
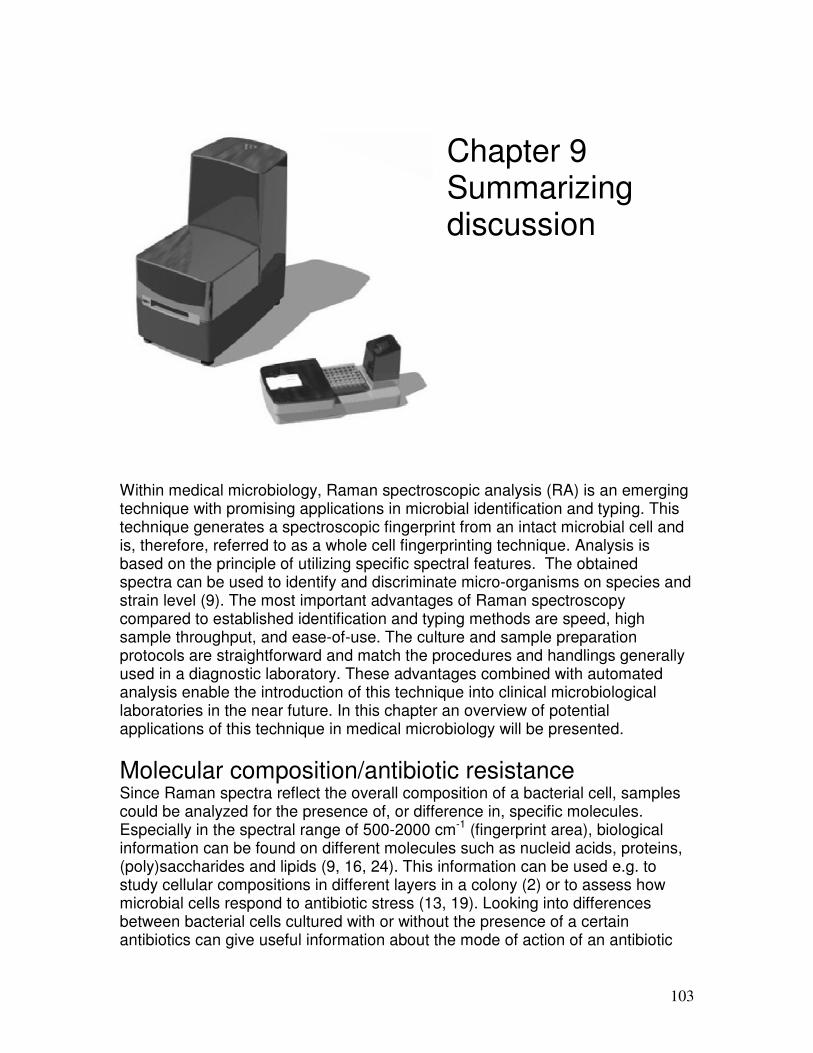
103
Chapter 9 Summarizing discussion
Within medical microbiology, Raman spectroscopic analysis (RA) is an emerging technique with promising applications in microbial identification and typing. This technique generates a spectroscopic fingerprint from an intact microbial cell and is, therefore, referred to as a whole cell fingerprinting technique. Analysis is based on the principle of utilizing specific spectral features. The obtained spectra can be used to identify and discriminate micro-organisms on species and strain level (9). The most important advantages of Raman spectroscopy compared to established identification and typing methods are speed, high sample throughput, and ease-of-use. The culture and sample preparation protocols are straightforward and match the procedures and handlings generally used in a diagnostic laboratory. These advantages combined with automated analysis enable the introduction of this technique into clinical microbiological laboratories in the near future. In this chapter an overview of potential applications of this technique in medical microbiology will be presented.
Molecular composition/antibiotic resistance Since Raman spectra reflect the overall composition of a bacterial cell, samples could be analyzed for the presence of, or difference in, specific molecules. Especially in the spectral range of 500-2000 cm-1 (fingerprint area), biological information can be found on different molecules such as nucleid acids, proteins, (poly)saccharides and lipids (9, 16, 24). This information can be used e.g. to study cellular compositions in different layers in a colony (2) or to assess how microbial cells respond to antibiotic stress (13, 19). Looking into differences between bacterial cells cultured with or without the presence of a certain antibiotics can give useful information about the mode of action of an antibiotic
104
(13). For some species and/or antibiotics it might even be possible to discriminate between sensitive and resistant isolates. Furthermore, different studies describe monitoring of specific molecules of industrial importance (3-5, 23). Although specific differences in Raman spectra are beneficial in differentiating strains, non-specific signal variance can limit differentiation. Certain kinds of variance can be controlled by standardization of culture conditions. But sometimes even standardization does not result in sufficient spectral reproducibility. Chapter 2 and chapter 3 deal with this problem. It was found that in many cases the problem of non-specific variance can be linked to varying concentrations of pigments in microbial cells. In chapter 2, Staphylococcus aureus is used as an example. This bacterium is known for its yellow-orange pigmentation caused by carotenoids. During growth, S. aureus incorporates various carotenoid intermediates (6) and different S. aureus strains produce both different types and different amounts of carotenoids (17). This variance in amounts of pigment lowers spectral reproducibility and can cause misclassification. It was also found that the relative signal contribution of these pigments decreases under laser irradiation (so-called photo-bleachable pigments). This allowed the isolation of the bleachable components of the S. aureus spectrum. These components were used to develop a method to eliminate the signal variance caused by these pigments. The method makes use of the Extended Multiplicative Scatter Correction and Spectral Interferent Subtraction (EMSC-SIS) algorithm as developed by Martens and Stark (18) and resulted in increase of reproducibility to the extent that discrimination of S. aureus samples could be obtained at strain level. Another bacterial species known to produce pigments is Pseudomonas aeruginosa. This bacterium produces a characteristic yellowish green fluorescent pigment, called pyoverdin. This extracellular compound functions as an iron scavenging siderophore and can be produced by P. aeruginosa in several forms. Although the method described in chapter 2 could also be applied to correct P. aeruginosa spectra, an additional problem was found. The strongly pigmented strains resulted in high fluorescent spectral backgrounds that could cause saturation of the CCD camera. In chapter 3 it is described that applying a washing procedure to reduce the amount of fluorescent pigment, enabled the highly pigmented isolates to be measured with sufficient spectral quality. Combined with the analysis approach described in chapter 2, it was able to obtain the high reproducibility required for strain level typing.
Species identification Initially, the use of RA in microbiology mainly focused on species identification. Inspection of the colony morphology and interpretation of Gram-stained preparations usually is the first step in identification of bacteria. These characteristics indicate a series of biochemical tests that lead to identification of an organism. Since there are large differences between the cell walls of Gram-
105
positive bacteria, Gram-negative bacteria and yeast, a clear discrimination can be made between those three groups. Therefore, RA could serve as an automated and fast alternative to routine Gram staining (16, 20). Further identification of bacteria usually is performed based on metabolic activity of the microorganisms. For this kind of test, several automated systems are available as Vitek (BioMerieux) and BD Phoenix (Beckton Dickinson). Since these methods require an incubation step to monitor metabolic activity, it usually takes 6 to 8 hours to obtain results after an overnight pure culture is performed. Another approach is identification based on genetics. Most of these techniques use a DNA amplification step (PCR), requiring only a few bacterial cells for detection. This is very useful to identify uncultivable or fastidious organisms, but these techniques are labor intensive. RA is able to provide a reliable identification in a matter of minutes after a 20 hour culture is available. A micro spectroscopic technique has been described to measure microbial microcolonies directly on the solid culture medium. This way, no overnight culture is required, but identification results can be obtained within 6–8 h after starting a culture (15). Another study shows that different Candida strains could be identified significantly faster using a Raman based procedure compared to commercial phenotypic identification systems (11, 14). In case of critically ill patients e.g. on an intensive care unit, this can save valuable time and allows the clinician to act and adjust empirical therapy sooner. Furthermore, the ability for automation makes RA a suitable candidate for clinical diagnostic microbiology. However, at this moment only limited studies have been described that focus on the identification of species. One of the drawbacks of this moment is the availability of species-specific spectral databases. Although different algorithms can be used to identify unknown microbial strains, this can only be achieved when a reference database is present. It is important that such a reference database contain representative numbers of spectra covering all relevant microbial strains to be identified. Mycobacteria is one of the bacterial species for which speed of identification is very important. Because the treatment and the epidemiology of lung tuberculosis caused by Mycobacterium tuberculosis differ significantly from pulmonary disease caused by nontuberculous mycobacteria (NTM), the timely and correct identification of the causative organisms is mandatory for diagnosis, therapy, and control. In chapter 4, the development of a culture based protocol for mycobacteria is described. RA was compared to 16S rRNA sequencing for the identification of M. tuberculosis complex strains and 7 of the most frequently found NTM. Because of the biosafety precausions required for M. tuberculosis, the effect of different inactivation methods on the Raman spectra was evaluated. The spectra of the heat-inactivated bacteria showed minimal differences compared to the spectra of viable mycobacteria. Therefore, the identification of mycobacteria appears possible without biosafety level 3 precautions. All M. tuberculosis strains were
106
correctly identified, as were 54 of 57 NTM strains (94%). The differentiation between M. tuberculosis and NTM was invariably correct for all strains.
Bacterial typing In bacterial typing, isolates are compared for (clonal) relationships to analyze possible outbreak situations, transmissions routes or sources. Outbreaks are often recognised the moment the clinical laboratory notices an increased number of infections caused by a certain organism. This means that the outbreak is already happening. To actually prove that an outbreak exists, it must be established that the isolates responsible for the infection of different patients have an identical (geno)type. Because of its speed and high repeatability, RA can fill an important niche in the area of epidemiological typing. Raman spectra can be collected from only a limited amount of microbial cells; even from a single cell or bacterial spore (1, 7, 8). However, the general procedure described in this thesis includes a culture step to obtain enough biomass for analysis. Since the way this culture step is performed will influence repeatability, there are some fundamental aspects that need to be considered for Raman based typing. Differences in culture conditions may influence the metabolic pathways and, therefore, the molecular makeup of microbial cells. Since Raman spectra represent the overall composition of cells, changes in growing conditions will introduce differences in Raman spectra (2, 21). This does not mean that differences in culture time automatically lead to lower reproducibility or misclassification (10). To minimize variations, however, a standard incubation time needs to be applied. The choice of culture medium usually has a more significant effect on Raman spectra. In order to be able to determine the relatedness between different isolates or to be able to build a large database, all isolates used in an analysis should therefore be cultured on the same medium. The last 4 chapters of this thesis focus on the development of different RA based typing schemes for species that are frequently linked to hospital acquired infections and outbreaks. For each protocol, the optimal culture conditions and optimal sample preparation method is determined. Although small differences were seen, for all species a basic protocol resulted in high repeatability and good discriminatory power. Chapter 5 describes the typing scheme of a well-known nosocomial pathogen, methicillin resistant Staphylococcus aureus (MRSA). For this organism, the so-called search and destroy policy is introduced in The Netherlands (26). As soon as a MRSA isolate is found, a contact screening of people and the environment is started. During such a screening, a considerable number of samples have to be screened for the presence of MRSA and typed in order to confirm or decline transmission of isolates (comparative typing). It was shown that RA was able to provide answers in a short period of time, offering the possibility of early

107
intervention. This will result in a reduction of patients involved and a significant cost reduction for the hospital (22). In chapter 6, proof of principle is given for the characterization of coagulase negative Staphylococci (CNS) isolated from skin. CNS are among the most frequently isolated bacterial species in clinical Microbiology and most CNS-related infections are hospital acquired. Multiple-antibiotic-resistance is frequently found in these isolates (MR-CNS isolates). In the study described in chapter 6, isolates were selected from a large surveillance study. This study aimed at determination of the direct spread of MR-CNS between patients on the same ward or even the same room. Besides the evaluation of RA as a typing tool for MR-CNS isolates, the diversity between colonies with identical and different morphologies was studied. It was confirmed that the skin of patients can be colonized with multiple MR-CNS types at the same time. Morphological differences between colonies from a single patient sample correlated with differences in Raman and PFGE types. Since some morphologically indistinguishable colonies revealed different Raman and PFGE types, it is important to examine multiple MR-CNS colonies to obtain a complete insight into the prevalence of different types. This will also enhance the quality of clinical and epidemiological studies. A bacterial typing scheme for Enterococcus faecium is described in chapter 7. Using a collection of 122 isolates from clinical sites, hospital and community surveys, animals and the environment, it was shown that RA is highly reproducible and has a discriminatoty power comparible to established typing techniques. A second collection containing isolates obtained during 3 different E. faecium outbreaks in The Netherlands revealed that RA was able to recognize the described outbreak isolates. Furthermore, esp-positive and esp-negative isolates were confined in separate clusters. This sub-clustering separated community acquired and hospital acquired isolates. In chapter 8, typing of multi-resistant Escherichia coli and Klebsiella pneumoniae isolates was evaluated. A first collection of genotypically unrelated isolates was used to optimize the protocol. These results were also used to determine the threshold and cut-off for relatedness for both species. Analyzing 3 clinical isolate collections showed that adequate results were obtained using these (unbiased) settings. RA was able to discriminate outbreak-related isolates from isolates that were not involved in an outbreak or transmission, even when isolates are obtained in larger geographical areas or over a longer time period. It was also found that the β-lactamase content of an isolate does not affect the obtained RA classification sinde this technique is able to distinguish between clones harboring identical ESBL-gene types.
Bringing Raman spectroscopy into the laboratory Although promising, RA is still mainly performed in research oriented laboratories. So what will it take to routinely put RA into the clinical laboratory?
108
First of all, there is a need for affordable, reliable and easy-to-use instrumentation. Raman spectroscopy has been traditionally held back by the fact that the Raman phenomenon is seen in only a small fraction of the photons. In this thesis, a custom built Raman system is described that is based on conventional Raman spectroscopy. Improved, sensitive instrumentation combined with dedicated data-preprocessing are important key elements that led to the results described here. Another way to improve results is enhancement of the Raman signal. Several techniques have been described, of which surface-enhanced Raman scattering (SERS) spectroscopy is one of the most promising (12). This technique utilizes the fact that Raman scattering is amplified when molecules are absorbed onto metal surfaces (usually gold or silver). More recently, an alternative SERS technology has been described combining it with microfluidic devices (25, 27). This way, small sample volumes can be analyzed and it has the potential of simplifying sample preparation and concentration of bacteria from clinical fluids. Although still under development, these kinds of developments are moving the technique nearer to the clinical laboratory. Second problem is the availability of spectral databases. It is clear that participation of routine microbiology laboratories clear advantages for infectious disease surveillance. But clinical and economic benefits for healthcare systems can only be achieved when all the information present on epidemiology and typing can be centralized into computing systems. Ideally, such systems are connected to regional or (inter)national databases. This way, automatic systems can be developed for analysis of surveillance data and for automatic alerts. To participate, microbiology laboratories should be able to store their typing data into (worldwide) accessible databases. This requires standardized protocols that provide typing results that are easy to interpret, stable in time and reproducible between laboratories. Raman spectra can be seen as a collection of 701 data-points or intensities that can easily be stored in a spectral database. Similarity between isolates can be expressed as a Pearson’s correlation coefficient making it an unbiased method. Although the microbiologist will always be able to influence the setting of thresholds manually, it is possible to calculate thresholds based on historic data. Fixed thresholds will make comparison of results between laboratories easier. But even on hospital level, the ability to build a database of Raman spectra can be beneficial. It allows e.g. the monitoring of a certain species throughout a hospital or the monitoring of multiple species on one ward. Comparison of a new isolates to the database will determine a possible hit and can provide an automatic alert. This allows direct intervention and will improve infection control by effective tracing and elimination. Since the current published studies mainly focus on retrospective outbreak studies it is important to evaluate RA as a real-time typing system in the daily routine of a laboratory on short notice.
In conclusion
109
Raman spectroscopy is an emerging technique with promising applications in microbial identification and typing studies. It is a powerful technique and offers great analysis potential to microbiologists in environmental, food-processing, and clinical laboratories. In recent history, phenotypic techniques have been widely replaced by genotypic methods (and with good reason). But it is interesting to see that a relatively new phenotypic, whole cell technique as Raman spectroscopy can be an added value in clinical diagnostics. Because a single protocol can almost be universally used to obtain Raman fingerprints, the method seems to be an easy-to-use and rapid alternative for the currently used typing techniques. It is suitable for real-time typing in clinical diagnostic laboratories. Furthermore, it will provide the infection prevention teams a tool for the continuous monitoring of isolates in their hospital and will alert them immediately when corrective actions should be taken. Commercialization of standard instrumentation and protocols can be a powerful push to public acceptance and adoption of this technique. Similar to the evolvement of gene-based databases, it can be anticipated that the use of Raman spectroscopy will lead to the generation of public and interactive spectral databases. This might clear the way to accurate, real-time surveillance and a new approach to combating hospital acquired infections.
References 1. Brehm-Stecher, B. F., and E. A. Johnson. 2004. Single-cell microbiology: tools,
technologies, and applications. Microbiol Mol Biol Rev 68:538-59. 2. Choo-Smith, L. P., K. Maquelin, T. van Vreeswijk, H. A. Bruining, G. J. Puppels,
N. A. Ngo Thi, C. Kirschner, D. Naumann, D. Ami, A. M. Villa, F. Orsini, S. M. Doglia, H. Lamfarraj, G. D. Sockalingum, M. Manfait, P. Allouch, and H. P. Endtz. 2001. Investigating microbial (micro)colony heterogeneity by vibrational spectroscopy. Appl Environ Microbiol 67:1461-9.
3. De Gelder, J., K. De Gussem, P. Vandenabeele, P. De Vos, and L. Moens. 2007. Methods for extracting biochemical information from bacterial Raman spectra: an explorative study on Cupriavidus metallidurans. Anal Chim Acta 585:234-40.
4. De Gelder, J., K. De Gussem, P. Vandenabeele, M. Vancanneyt, P. De Vos, and L. Moens. 2007. Methods for extracting biochemical information from bacterial Raman spectra: focus on a group of structurally similar biomolecules--fatty acids. Anal Chim Acta 603:167-75.
5. Gelder, J. D., D. Willemse-Erix, M. J. Scholtes, J. I. Sanchez, K. Maquelin, P. Vandenabeele, P. D. Boever, G. J. Puppels, L. Moens, and P. D. Vos. 2008. Monitoring poly(3-hydroxybutyrate) production in cupriavidus necator DSM 428 (H16) with raman spectroscopy. Anal Chem 80:2155-60.
6. Hammond, R. K., and D. C. White. 1970. Carotenoid formation by Staphylococcus aureus. J Bacteriol 103:191-8.
7. Huang, W. E., A. Ferguson, A. C. Singer, K. Lawson, I. P. Thompson, R. M. Kalin, M. J. Larkin, M. J. Bailey, and A. S. Whiteley. 2009. Resolving genetic functions within microbial populations: in situ analyses using rRNA and mRNA stable isotope probing coupled with single-cell raman-fluorescence in situ hybridization. Appl Environ Microbiol 75:234-41.
8. Huang, W. E., R. I. Griffiths, I. P. Thompson, M. J. Bailey, and A. S. Whiteley. 2004. Raman microscopic analysis of single microbial cells. Anal Chem 76:4452-8.
110
9. Huang, W. E., M. Li, R. M. Jarvis, R. Goodacre, and S. A. Banwart. Shining light on the microbial world the application of Raman microspectroscopy. Adv Appl Microbiol 70:153-86.
10. Hutsebaut, D., K. Maquelin, P. De Vos, P. Vandenabeele, L. Moens, and G. J. Puppels. 2004. Effect of culture conditions on the achievable taxonomic resolution of Raman spectroscopy disclosed by three Bacillus species. Anal Chem 76:6274-81.
11. Ibelings, M. S., K. Maquelin, H. P. Endtz, H. A. Bruining, and G. J. Puppels. 2005. Rapid identification of Candida spp. in peritonitis patients by Raman spectroscopy. Clin Microbiol Infect 11:353-8.
12. Jarvis, R. M., and R. Goodacre. 2004. Discrimination of bacteria using surface-enhanced Raman spectroscopy. Anal Chem 76:40-7.
13. Lopez-Diez, E. C., C. L. Winder, L. Ashton, F. Currie, and R. Goodacre. 2005. Monitoring the mode of action of antibiotics using Raman spectroscopy: investigating subinhibitory effects of amikacin on Pseudomonas aeruginosa. Anal Chem 77:2901-6.
14. Maquelin, K., L. P. Choo-Smith, H. P. Endtz, H. A. Bruining, and G. J. Puppels. 2002. Rapid identification of Candida species by confocal Raman microspectroscopy. J Clin Microbiol 40:594-600.
15. Maquelin, K., L. P. Choo-Smith, T. van Vreeswijk, H. P. Endtz, B. Smith, R. Bennett, H. A. Bruining, and G. J. Puppels. 2000. Raman spectroscopic method for identification of clinically relevant microorganisms growing on solid culture medium. Anal Chem 72:12-9.
16. Maquelin, K., C. Kirschner, L. P. Choo-Smith, N. van den Braak, H. P. Endtz, D. Naumann, and G. J. Puppels. 2002. Identification of medically relevant microorganisms by vibrational spectroscopy. J Microbiol Methods 51:255-71.
17. Marshall, J. H., and G. J. Wilmoth. 1981. Pigments of Staphylococcus aureus, a series of triterpenoid carotenoids. J Bacteriol 147:900-13.
18. Martens, H., and E. Stark. 1991. Extended multiplicative signal correction and spectral interference subtraction: new preprocessing methods for near infrared spectroscopy. J Pharm Biomed Anal 9:625-35.
19. Moritz, T. J., C. R. Polage, D. S. Taylor, D. M. Krol, S. M. Lane, and J. W. Chan. 2010. Evaluation of Escherichia coli cell response to antibiotic treatment by use of Raman spectroscopy with laser tweezers. J Clin Microbiol 48:4287-90.
20. Naumann, D., D. Helm, and H. Labischinski. 1991. Microbiological characterizations by FT-IR spectroscopy. Nature 351:81-2.
21. Neugebauer, U., U. Schmid, K. Baumann, W. Ziebuhr, S. Kozitskaya, V. Deckert, M. Schmitt, and J. Popp. 2007. Towards a detailed understanding of bacterial metabolism--spectroscopic characterization of Staphylococcus epidermidis. Chemphyschem 8:124-37.
22. Peterson, L. R., and G. A. Noskin. 2001. New technology for detecting multidrug-resistant pathogens in the clinical microbiology laboratory. Emerg Infect Dis 7:306-11.
23. Schuster, K. C., E. Urlaub, and J. R. Gapes. 2000. Single-cell analysis of bacteria by Raman microscopy: spectral information on the chemical composition of cells and on the heterogeneity in a culture. J Microbiol Methods 42:29-38.
24. Uzunbajakava, N., A. Lenferink, Y. Kraan, E. Volokhina, G. Vrensen, J. Greve, and C. Otto. 2003. Nonresonant confocal Raman imaging of DNA and protein distribution in apoptotic cells. Biophys J 84:3968-81.
111
25. Walter, A., A. Maerz, W. Schumacher, P. Roesch, and J. Popp. 2011. Towards a fast, high specific and reliable discrimination of bacteria on strain level by means of SERS in a microfluidic device. Lab on a chip 11:1013-1021.
26. Wertheim, H. F., M. C. Vos, H. A. Boelens, A. Voss, C. M. Vandenbroucke-Grauls, M. H. Meester, J. A. Kluytmans, P. H. van Keulen, and H. A. Verbrugh. 2004. Low prevalence of methicillin-resistant Staphylococcus aureus (MRSA) at hospital admission in the Netherlands: the value of search and destroy and restrictive antibiotic use. J Hosp Infect 56:321-5.
27. Wilson, R., P. Monaghan, S. A. Bowden, J. Parnell, and J. M. Cooper. 2007. Surface-enhanced Raman signatures of pigmentation of cyanobacteria from within geological samples in a spectroscopic-microfluidic flow cell. Anal Chem 79:7036-41
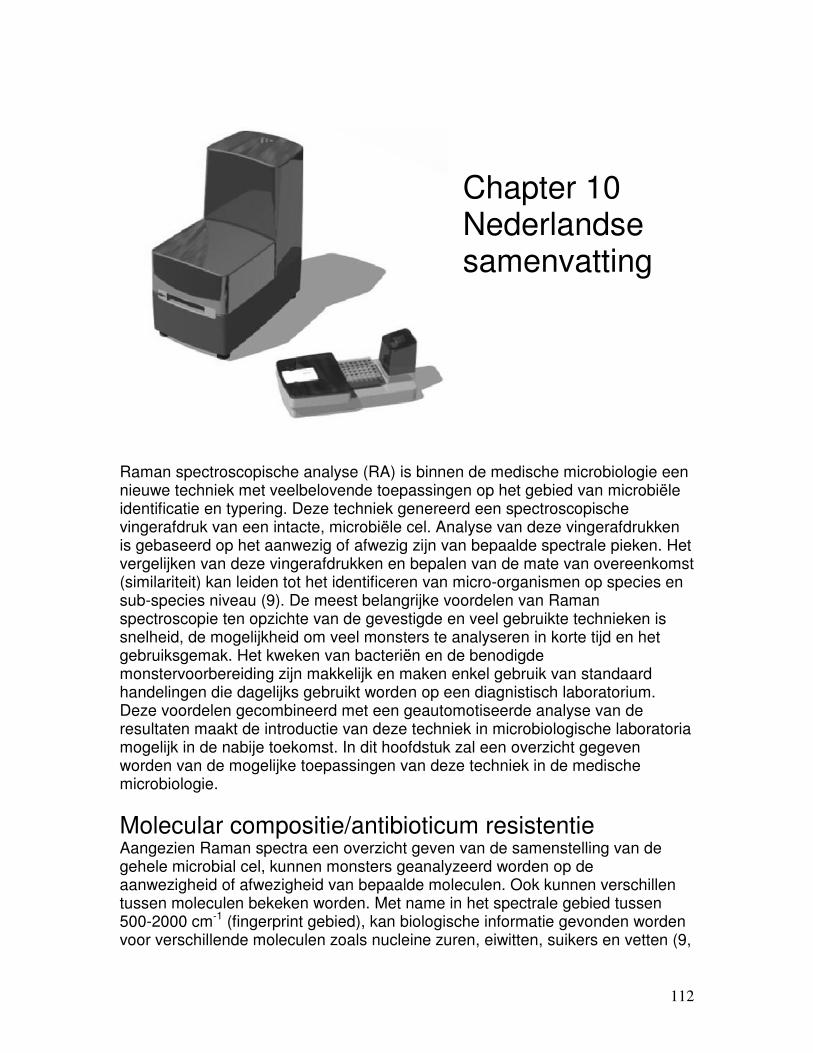
112
Chapter 10 Nederlandse samenvatting
Raman spectroscopische analyse (RA) is binnen de medische microbiologie een nieuwe techniek met veelbelovende toepassingen op het gebied van microbiële identificatie en typering. Deze techniek genereerd een spectroscopische vingerafdruk van een intacte, microbiële cel. Analyse van deze vingerafdrukken is gebaseerd op het aanwezig of afwezig zijn van bepaalde spectrale pieken. Het vergelijken van deze vingerafdrukken en bepalen van de mate van overeenkomst (similariteit) kan leiden tot het identificeren van micro-organismen op species en sub-species niveau (9). De meest belangrijke voordelen van Raman spectroscopie ten opzichte van de gevestigde en veel gebruikte technieken is snelheid, de mogelijkheid om veel monsters te analyseren in korte tijd en het gebruiksgemak. Het kweken van bacteriën en de benodigde monstervoorbereiding zijn makkelijk en maken enkel gebruik van standaard handelingen die dagelijks gebruikt worden op een diagnistisch laboratorium. Deze voordelen gecombineerd met een geautomotiseerde analyse van de resultaten maakt de introductie van deze techniek in microbiologische laboratoria mogelijk in de nabije toekomst. In dit hoofdstuk zal een overzicht gegeven worden van de mogelijke toepassingen van deze techniek in de medische microbiologie.
Molecular compositie/antibioticum resistentie Aangezien Raman spectra een overzicht geven van de samenstelling van de gehele microbial cel, kunnen monsters geanalyzeerd worden op de aanwezigheid of afwezigheid van bepaalde moleculen. Ook kunnen verschillen tussen moleculen bekeken worden. Met name in het spectrale gebied tussen 500-2000 cm-1 (fingerprint gebied), kan biologische informatie gevonden worden voor verschillende moleculen zoals nucleine zuren, eiwitten, suikers en vetten (9,
113
16, 24). Deze informatie kan bijvoorbeeld gebruikt worden om de samenstelling van verschillende lagen in een bacteria kolonie te bestuderen (2). Ook kan het effect van een antibioticum op de groei en samenstelling van een micobiële cel bestudeerd worden (13, 19). Door te kijken naar verschillen tussen cellen die gekweekt zijn in de aanwezigheid of afwezigheid van een antibioticum kan nuttige informative verkregen worden over de werking van het gebruikte antibioticum (13). Verder zijn verschillende studies beschreven waarin Raman spectroscopie gebruikt wordt om specifieke moleculen te monitoren die van belang zijn voor de industrie (3-5, 23). Specifieke verschillen in Raman spectra zijn zeer nuttig zijn als onderscheid gemaakt moet worden tussen bacteriële stammen. Het aanwezig zijn van niet-specieke variantie zal de reproduceerbaarheid van de techniek en mogelijk het onderscheidend vermogen echter belemmeren. Bepaalde soorten variantie kan gecontroleerd worden door de kweek omstandigheden te standaardiseren. Maar dit zal niet altijd leiden tot voldoende spectrale reproduceerbaarheid en de mogelijkheid om bacteriële stammen te onderscheiden. In hoofdstuk 2 en hoofdstuk 3 wordt dit probleem beschreven. Het is namelijk gebleken dat in veel gevallen het aanwezig zijn van niet specifieke variantie te wijten is aan varierende hoeveelheden van een bepaalde kleurstof of pigment in de microbiële cel. In hoofdtuk 2 worden Staphylococcus aureus isolaten gebruikt als voorbeeld. Het is bekend dat deze bacterie caroteen produceerd, een geel-oranje pigment. Verder is bekend dat meerdere soorten caroteen aanwezig kunnen zijn in een cel (6, 17). Verder kan de hoeveelheid carotene wat geproduceerd worden sterk variëren tussen kweken. Hierdoor kunnen spectrale verschillen ontstaan wanneer een stam meerdere keren gekweekt wordt en dit heeft een negatieve invloed op de reproduceerbaarheid. Tijdens onderzoek is gebleken dat de signaal sterkte van het caroteen afneemt als de cel belicht wordt door een laser (zogenoemde blekende effect van laserlicht). Dit fenomeen kan gebruikt worden om voor het caroteen een specifiek Raman spectrum af te leiden. Dit specifieke spectrum kan dan weer gebruikt worden om de aanwezige varientie in hoeveelheid te corrigeren. Deze correctie methode maakt gebruik van een algoritme dat ontwikkeld is door Martens and Stark (18) en resulted in een zodanig verhoogde reproduceerbaarheid dat het mogelijk is om S. aureus stammen van elkaar te onderscheiden. Ook Pseudomonas aeruginosa staat bekend om zijn pigment produktie. Dit species produceerd pyoverdine, een geel-groen fluoriserend pigment. Dit pigment kan door de bacterie uitgescheiden worden en kan ijzer binden uit de omgeving. Hoewel de methode beschreven in hoofdstuk 2 ook voor dit species toegepast kan worden, is een additioneel probleem gevonden. Het meten van stammen die grote hoeveelheden pigment produceren leid namelijk to hoge spectrale ondergronden en verzadiging van de CCD camera. Aangezien een groot deel van het pigment zich buiten de cel bevind, wordt in hoofdstuk 3 beschreven dat toevoegen van een extra wasstap voor de Raman meting het meten van sterk gekleurde stammen mogelijk maakt. Gecombineerd met de
114
analyse methode beschreven in hoofdstuk 2 is aangetoond dat ook voor P. aeruginosa een hoge reproduceerbaarheid behaald kan worden.
Species identificatie In eerste instantie was het gebruik van RA in de microbiologie met name gericht op species identificatie. In de huidige routine is inspectie van de kolonie morfologie en interpretatie van het Gram-preparaat nog steeds de eerste stap in identificatie. Deze eerste resultaten bepalen welke aanvullende biochemische testen gedaan moeten worden om tot een definitieve identificatie te komen. Aangezien er grote verschillen zijn in de celwand opbouw van Gram-positieve bacteriën, Gram-negatieve bacteriën en gisten is het zeer goed mogelijk om met RA een duidelijk onderscheid te maken tussen deze drie groepen. Dit betekend dat RA een snel alternatief kan zijn voor de momenteel gebruikte Gram kleurig (16, 20). Verdere identificatie van bacteriën is vaak gebaseerd op de metabole activiteit van micro-organismen. Hiervoor zijn meerdere geautomatiseerde systemen beschikbaar zoals de Vitek van BioMerieux of de BD Phoenix van Beckton Dickinson. Deze systemen vereisen echter een incubatie stap om de metabole activiteit te kunnen monitoren. Dit betekend dat het 6 tot 8 uur duurt voor het resultaat bekend is, nadat eerst een overnacht kweek beschikbaar moet zijn. Andere identificatie methoden richten zich op de genetische samenstelling van bacterieën. De meeste van deze technieken maken gebruik van een DNA amplificatie stap, waardoor slechts enkele bacteriële cellen nodig zijn. Hierdoor zijn ze uitermate geschikt voor species die niet of onder specifieke omstandigheden gekweekt moeten worden. Een groot nadeel is echter dat deze technieken duur en arbeidsintensief zijn. Er is een methode beschreven waarin RA wordt toegepast voor het meten van bacterieële colonies direct op de kweekplaat. Op deze manier kan identificatie plaats vinden na een kweektijd van 6 uur in plaats van de gebruikelijke overnacht incubatie (15). Een andere studie toont aan dat verschillende Candida stammen snel geidentificeerd kunnen worden wanneer RA wordt toegepast. Hierbij wordt aangegeven dat RA sneller resultaten geeft in vergelijking met commercieel beschikbare systemen (11, 14). Dit is met name belangrijk voor ernstig zieke patiënten bijvoorbeeld op een afdeling voor intensieve zorg. Hoewel de voordelen van RA duidelijk zijn, is het aantal studie mbt species identificatie beperkt. Een van de limiterende factoren om deze techniek in te voeren op een diagnostische lab is het niet beschikbaar zijn van een spectrale database. Het kunnen herkennen van een bepaald species is alleen mogelijk als er een referentie database aanwezig is. Om betrouwbare resultaten te verkrijgen is het belangrijk dat zo’n database spectra bevat van alle relevantie bacteriële species. Mycobacterium is een species waarbij snelle identificatie zeer belangrijk is. De behandeling en de epidemiologie van long tuberculose veroorzaakt door Mycobacterium tuberculosis verschilt aanzienlijk van de long aandoeningen
115
veroorzaakt door atypische mycobacteria (NTM). Het tijdig en correct identificeren van de veroorzaker is daarom van groot beland voor de behandeling. In hoofdstuk 4 wordt de ontwikkeling beschreven van een RA protocol gebaseerd op gekweekte mycobacterium stammen. De resultaten verkregen met RA zijn vergeleken met de resultaten verkregen met behulp van 16S rRNA sequencing. Hierbij is gekeken naar de identification van stammen behorende tot het M. tuberculosis complex en stammen behorende tot de 7 meest voorkomende atypische species. Gezien de strengen veiligheidsvoorschriften wanneer gewerkt wordth met M. tuberculosis, is tevens gekeken naar het effect van verschillende inactivatie procedures op de juistheid van identificatie. Het is gebleken dat het inactiveren van bacteriën met behulp van verhitting vergelijkbare resultaten opleverde vergeleken met niet geinactiveerde bacteriën. Dit betekend dat het toepassen van veiligheidsniveau 3 niet noodzakelijk is. Vergeleken met de 16S sequencing resultaten weren alle M. tuberculosis stammen correct geidentificeerd. Voor de atypische species werden 54 van de 57 stammen correct geidentificeerd (94%). Het onderscheid tussen M. tuberculosis and atypische mycobacteriën was voor alle stammen correct.
Bacteriële typering Het principe van bacteriële typering berust op het vaststellen van (klonale) verwantschap. Hierdoor kunnen mogelijke uitbraken, bronnen en transmissie routes worden bepaald. Op dit moment worden uitbraken vaak herkend als op het microbiologisch laboratorium een verhoogd aantal infecties veroorzaakt door eenzelfde species wordt gerapporteerd. Dit betekend dat dan de uitbraak al bezig is. Om te bewijzen dat er inderdaad sprake is van een uitbraak moet aangetoond worden dat meerder patiënten geinfecteerd zijn met dezelfe bacterie stam. Aangezien snelheid hier van groot belang is, kan RA een belangrijke rol spelen op het gebied van epidemiologische typering. Hoewel beschreven is dat Raman spectra verkregen kunnen worden van een enkele cel of spore (1, 7, 8), is het gebruikelijk om de bacteriën te kweken om genoeg biomassa te verkrijgen. Verschillen in kweekcondities kunnen de metabole processen in een cel beinvloeden en daarmee ook de samenstelling van de cel. Aangezien Raman spectra een geheel beeld geven van de cel, kunnen verschillen in kweekcondities verschillen in Raman spectra veroorzaken (2, 21). Dit betend niet automatisch dat hierdoor een lagere reproduceerbaarheid of misclassificatie van stammen plaats vindt (10). Het is echter aan te raden om een standaard incubatie tijd aan te houden. De keuze van het kweekmedium heeft meestal een duidelijker effect op de Raman spectra. Zeker voor typeren van stammen of het opbouwen van databanken is het hierdoor noodzakelijk om alle stammen in een studie te kweken op hetzelfde medium. In de hoofdstukken 5 t/m 8 wordt de ontwikkeling van verschillende typerings schema’s beschreven. Er is gekozen voor bacteriële species die veelvuldig
116
geassocieerd worden met ziekenhuis infecties en uitbraken. Voor elk protocol zijn de optimale kweekcondities en analyse voorwaarden vastgesteld. Hoewel kleine verschillen in de protocollen zijn vastgelegd, is gebleken dat voor alle species een basis protocol gebruikt kan worden voor reproduceerbare resultaten. In hoofdstuk 5 wordt een protocol beschreven voor een welbekende ziekenhuis bacterie, de meticilline resistente Staphylococcus aureus (MRSA). In Nederland is op dit organisme het ‘search and destroy’ beleid van toepassing. Zodra een MRSA bacterie wordt gevonden in een ziekenhuis, vind een contact onderzoek plaats. Hierbij worden van alle medewerkers, medepatiënten en familieleden kweken afgenomen. Ook worden kweken afgenomen in de directe omgeving. Het vinden van een identieke MRSA stam bij meerdere mensen of in de omgeving leidt tot sluiten van de afdeling. Gedurende zo’n onderzoek moet een groot aantal kweken worden geanalyseerd en getypeerd om transmissie te bevestigen of the ontkrachten. Vergeleken met de momenteel gebruikte methoden bleek RA gelijke resultaten op te leveren in een kortere tijd. Hierdoor kan sneller interventie plaats vinden en dit leidt tot een reductie van het aantal betrokken patiënten en verlaging van de ziekenhuis kosten (22). De karakterisatie van coagulase negatieve Staphylococci (CNS) geisoleerd vanaf de huid is beschreven in hoofdstuk 6. CNS zijn een van de meest voorkomende species binnen de klinische microbliologie en infecties zijn vaak ziekenhuis gerelateerd. Resistentie tegen meerdere antibiotica wordt regelmatig geconstateerd voor deze species (MR-CNS). In de studie beschreven in hoofdstuk 6 zijn stammen gebruikt die geselcteerd zijn uit een grote surveillance onderzoek naar de verspreiding van MR-CNS. Naast de evaluatie van RA als typerings techniek voor MR-CNS stammen, is gekeken naar de diversiteit aan stamtypes binnen 1 patient. De verkregen resultaten laten zien dat op de huid van een patiënt meerdere MR-CNS types kunnen voorkomen. Wanneer in een kweek kolonies worden gevonden met een verschillende morfologie blijken deze altijd afkomstig van verschillende stamtypes. Het is echter ook aangetoond dat in kolonies met een identieke morfologie meerder stamtypes voor kunnen komen. Het is daarom van groot belang dat voor elke beschikbare huidkweek meerdere MR-CNS kolonies worden geanalyseerd om een goed beeld te krijgen van de aanwezige stamtypes. Dit zal de kwaliteit van klinische en epidemiologische studies sterk verbeteren. De ontwikkeling en evaluatie van een typeerschema voor Enterococcus faecium wordt beschreven in hoofdstuk 7. In dit hoofdstuk is een collectie van 122 stammen gebruikt die afkomstig zijn vanuit meerdere ziekenhuizen, van dieren of de omgeving. Ook voor dit species is gevonden dat de RA resultaten vergelijkbaar zijn met de gevestigde en veelgebruikte technieken. De evaluatie van stammen verkregen tijdens meerder uitbraken in Nederland tonen aan dat het gebruik van RA deze uitbraken snel en accuraat aangetoond hadden kunnen worden. Verder is gezien dat stammen met en zonder het esp-gen van elkaar onderscheiden konden worden. Hoewel dit niet op grote schaal is onderzocht, zou hiermee onderscheid gemaakt kunnen worden tussen stammen die in de gemeenschap voorkomen en stammen die gevonden worden in ziekenhuizen.
117
In hoofdstuk 8 wordt gekeken naar een collective van Gram-negatieve bacteriën. In dit hoofdstuk is RA gebruikt voor het typeren van multi-resistente Escherichia coli en Klebsiella pneumoniae stammen. Een eerste collectie van niet-gerelateerde stammen is gebruikt om op een onbevooroordeelde manier grenzen vast te leggen voor verwantschap. Het gebruik van deze grenzen voor 3 onafhankelijke klinische collecties resulteerde in accurate resultaten. RA was in staat om uitbraakgerelateerde stammen te herkennen, zelfs als deze over een groter geografisch gebied of in een langer tijdspad waren verzameld. Het is ook aangetoond dat de aanwezigheid van een bepaald β-lactamase gen de RA classificatie niet beinvloedde gezien het feit dat onderscheid gemaakt kon worden tussen stammen met hetzelfde β-lactamase gen.
Het introduceren van Raman spectroscopie op het laboratorium Hoewel RA veelbelovend is, worden de meeste studies in onderzoeks georiënteerde laboratoria uitgevoerd. Wat zou er moeten veranderen zodat RA ook op een routine matige manier op een klinisch laboratorium gebruikt zal gaan worden? Allereerst is er behoefte aan betaalbare, betrouwbare en makkelijk te bedienen apperatuur. Een van de problemen hierbij is het feit dat het Raman effect slechts optreed bij een klein percentage van alle fotonen. Hierdoor heeft het bruikbare signaal een lage intensiteit. Voor het onderzoek in dit proefschrift is gebruik gemaakt van een Raman spectrometer die specifiek ontwikkeld is voor het meten van bacteriën. Deze spectrometer is gebaseerd op conventionele Raman spectroscopie. Verbeterde en gevoelige apparatuur gecombineerd met specifieke data-behandeling zijn belangrijke sleutel elementen die geleidt hebben tot de resultaten beschreven in dit proefschrift. In de literatuur zijn meerdere manieren beschreven om de signaal intensiteit te verhogen. Een van deze technieken is gebaseerd op het versterken van het Raman signaal door moleculen te koppelen aan metalen zoals goud of zilver, de zogenoemde surface enhanced Raman spectroscopy of SERS (12). Recent is een alternatieve SERS method beschreven waarbij deze technologie wordt gekoppeld aan microkanaaltjes waardoor vloeistof geleid kan worden (microfluidics) (25, 27). Op deze manier kunnen kleine volumes geanalyseerd worden. Dit kan de gehele monster voorbereiding aanzienlijk versimpelen en ka nook gebruikt worden voor het concentreren van biologische vloeistoffen. Hoewel deze technieken nog in ontwikkeling zijn, zouden ze zeker bij kunnen dragen aan het implementeren van Raman spectroscopie in het laboratorium. Een tweede aandachtspunt is het beschikbaar zijn van spectrale databanken. Het is duidelijk dat het participeren van microbiologische laboratoria in surveillance enkel voordelen heeft. Maar klinisch en economisch voordeel in de zorg kan alleen bereikt worden indien alle informatie omtrent epidemiologie en typering gecentraliseerd worden in computer ondersteunde systemen. In een
118
ideale situatie zouden dit soort systemen zelfs gekoppeld moeten zijn aan regionale of (inter)nationale databanken. Op deze manier zouden automatische analyse en waarschuwings systemen ontwikkeld kunnen worden. Om hieraan deel te nemen zouden microbiologische laboratoria in staat moeten zijn om hun gegevens op te slaan in (wereldwijd) toegankelijke databanken. Dit vereist standaardisatie van protocollen om zo resultaten te verkrijgen die makkelijk te interpreteren zijn, stabiel zijn en uitgewisseld kunnen worden tussen laboratoria. Een Raman spectrum wordt opgeslagen als een tabel met daarin 701 datapunten of intensiteiten. Hierdoor zijn ze makkelijk op te slaan in databanken. Het bepalen van verwantschap gebeurd door het berekenen van Pearson’s correlatie coefficiente. Dit is een objectieve berekening. Hoewel de microbioloog de grenzen voor verwantschap handmatig aan kan passen, is het mogelijk om deze, gebaseerd op historische resultaten, te berekenen. Deze berekende grenzen maken het vergelijken van resultaten tussen laboratoria mogelijk. Maar zelfs binnen een ziekenhuis kan de mogelijkheid om een locale database te bouwen al zeer efficient zijn. Dit maakt het namelijk mogelijk om een bepaald species in het ziekenhuis te monitoren of om de aanwezigheid van meerdere species op een afdeling in kaart te brengen. Vergelijk van nieuw gemeten stammen met de aanwezige database kan een overeenkomst opleveren en dus een waarschuwing genereren. Hierdoor kunnen interventie maatregelen sneller ingevoerd worden. Aangezien de huidige studies vaak gericht zijn op retrospectieve analyses is het belangrijk om op korte termijn de mogelijkheden van RA als een dagelijks typeersysteem te evalueren.
Conclusie Raman spectroscopie is een opkomende techniek met veelbelovende toepassingen in microbiële identificatie en typerings studies. Het is een krachtige techniek en bied vele mogelijkheden voor microbiologen werkend in klinische laboratoria, milieu laboratoria en de voedsel industrie. Nog niet zo lang geleden zijn fenotypische typeringstechnieken grotendeels vervangen door genotypische methoden. Maar het is interessant om te zien dat een relatief nieuw, fenotypische techniek als Raman spectroscopy een waardevolle toevoeging blijkt te zijn voor de klinische daignostiek. Omdat een enkel protocol, met kleine aanpassingen, toegepast kan worden om Raman vingerafdrukken te krijgen, is deze techniek een makkelijk en snel alternatief voor de huidige typerings methoden. De techniek is geschikt voor het dagelijks monitoren van stammen en levert zo nuttige informatie voor het infectie preventie team. Het stelt hen in staat om continue te monitoren en snel interventie maatregelen in te voeren. Het commercieel beschikbaar maken van apparatuur en protocollen is een grote stap in de richting van implementatie in het laboratorium. Het is te verwachten dat toegankelijke en interactieve spectrale databanken worden ontwikkeld, zoals dit ook gebeurd is voor verschillende genetische databanken. Dit zal de weg vrijmaken voor betrouwbare, dagelijkse surveillance en een nieuwe benadering om ziekenhuis infecties te bestrijden.
119
Referenties 1. Brehm-Stecher, B. F., and E. A. Johnson. 2004. Single-cell microbiology: tools,
technologies, and applications. Microbiol Mol Biol Rev 68:538-59. 2. Choo-Smith, L. P., K. Maquelin, T. van Vreeswijk, H. A. Bruining, G. J. Puppels,
N. A. Ngo Thi, C. Kirschner, D. Naumann, D. Ami, A. M. Villa, F. Orsini, S. M. Doglia, H. Lamfarraj, G. D. Sockalingum, M. Manfait, P. Allouch, and H. P. Endtz. 2001. Investigating microbial (micro)colony heterogeneity by vibrational spectroscopy. Appl Environ Microbiol 67:1461-9.
3. De Gelder, J., K. De Gussem, P. Vandenabeele, P. De Vos, and L. Moens. 2007. Methods for extracting biochemical information from bacterial Raman spectra: an explorative study on Cupriavidus metallidurans. Anal Chim Acta 585:234-40.
4. De Gelder, J., K. De Gussem, P. Vandenabeele, M. Vancanneyt, P. De Vos, and L. Moens. 2007. Methods for extracting biochemical information from bacterial Raman spectra: focus on a group of structurally similar biomolecules--fatty acids. Anal Chim Acta 603:167-75.
5. Gelder, J. D., D. Willemse-Erix, M. J. Scholtes, J. I. Sanchez, K. Maquelin, P. Vandenabeele, P. D. Boever, G. J. Puppels, L. Moens, and P. D. Vos. 2008. Monitoring poly(3-hydroxybutyrate) production in cupriavidus necator DSM 428 (H16) with raman spectroscopy. Anal Chem 80:2155-60.
6. Hammond, R. K., and D. C. White. 1970. Carotenoid formation by Staphylococcus aureus. J Bacteriol 103:191-8.
7. Huang, W. E., A. Ferguson, A. C. Singer, K. Lawson, I. P. Thompson, R. M. Kalin, M. J. Larkin, M. J. Bailey, and A. S. Whiteley. 2009. Resolving genetic functions within microbial populations: in situ analyses using rRNA and mRNA stable isotope probing coupled with single-cell raman-fluorescence in situ hybridization. Appl Environ Microbiol 75:234-41.
8. Huang, W. E., R. I. Griffiths, I. P. Thompson, M. J. Bailey, and A. S. Whiteley. 2004. Raman microscopic analysis of single microbial cells. Anal Chem 76:4452-8.
9. Huang, W. E., M. Li, R. M. Jarvis, R. Goodacre, and S. A. Banwart. Shining light on the microbial world the application of Raman microspectroscopy. Adv Appl Microbiol 70:153-86.
10. Hutsebaut, D., K. Maquelin, P. De Vos, P. Vandenabeele, L. Moens, and G. J. Puppels. 2004. Effect of culture conditions on the achievable taxonomic resolution of Raman spectroscopy disclosed by three Bacillus species. Anal Chem 76:6274-81.
11. Ibelings, M. S., K. Maquelin, H. P. Endtz, H. A. Bruining, and G. J. Puppels. 2005. Rapid identification of Candida spp. in peritonitis patients by Raman spectroscopy. Clin Microbiol Infect 11:353-8.
12. Jarvis, R. M., and R. Goodacre. 2004. Discrimination of bacteria using surface-enhanced Raman spectroscopy. Anal Chem 76:40-7.
13. Lopez-Diez, E. C., C. L. Winder, L. Ashton, F. Currie, and R. Goodacre. 2005. Monitoring the mode of action of antibiotics using Raman spectroscopy: investigating subinhibitory effects of amikacin on Pseudomonas aeruginosa. Anal Chem 77:2901-6.
14. Maquelin, K., L. P. Choo-Smith, H. P. Endtz, H. A. Bruining, and G. J. Puppels. 2002. Rapid identification of Candida species by confocal Raman microspectroscopy. J Clin Microbiol 40:594-600.
15. Maquelin, K., L. P. Choo-Smith, T. van Vreeswijk, H. P. Endtz, B. Smith, R. Bennett, H. A. Bruining, and G. J. Puppels. 2000. Raman spectroscopic method
120
for identification of clinically relevant microorganisms growing on solid culture medium. Anal Chem 72:12-9.
16. Maquelin, K., C. Kirschner, L. P. Choo-Smith, N. van den Braak, H. P. Endtz, D. Naumann, and G. J. Puppels. 2002. Identification of medically relevant microorganisms by vibrational spectroscopy. J Microbiol Methods 51:255-71.
17. Marshall, J. H., and G. J. Wilmoth. 1981. Pigments of Staphylococcus aureus, a series of triterpenoid carotenoids. J Bacteriol 147:900-13.
18. Martens, H., and E. Stark. 1991. Extended multiplicative signal correction and spectral interference subtraction: new preprocessing methods for near infrared spectroscopy. J Pharm Biomed Anal 9:625-35.
19. Moritz, T. J., C. R. Polage, D. S. Taylor, D. M. Krol, S. M. Lane, and J. W. Chan. 2010. Evaluation of Escherichia coli cell response to antibiotic treatment by use of Raman spectroscopy with laser tweezers. J Clin Microbiol 48:4287-90.
20. Naumann, D., D. Helm, and H. Labischinski. 1991. Microbiological characterizations by FT-IR spectroscopy. Nature 351:81-2.
21. Neugebauer, U., U. Schmid, K. Baumann, W. Ziebuhr, S. Kozitskaya, V. Deckert, M. Schmitt, and J. Popp. 2007. Towards a detailed understanding of bacterial metabolism--spectroscopic characterization of Staphylococcus epidermidis. Chemphyschem 8:124-37.
22. Peterson, L. R., and G. A. Noskin. 2001. New technology for detecting multidrug-resistant pathogens in the clinical microbiology laboratory. Emerg Infect Dis 7:306-11.
23. Schuster, K. C., E. Urlaub, and J. R. Gapes. 2000. Single-cell analysis of bacteria by Raman microscopy: spectral information on the chemical composition of cells and on the heterogeneity in a culture. J Microbiol Methods 42:29-38.
24. Uzunbajakava, N., A. Lenferink, Y. Kraan, E. Volokhina, G. Vrensen, J. Greve, and C. Otto. 2003. Nonresonant confocal Raman imaging of DNA and protein distribution in apoptotic cells. Biophys J 84:3968-81.
25. Walter, A., A. Maerz, W. Schumacher, P. Roesch, and J. Popp. 2011. Towards a fast, high specific and reliable discrimination of bacteria on strain level by means of SERS in a microfluidic device. Lab on a chip 11:1013-1021.
26. Wertheim, H. F., M. C. Vos, H. A. Boelens, A. Voss, C. M. Vandenbroucke-Grauls, M. H. Meester, J. A. Kluytmans, P. H. van Keulen, and H. A. Verbrugh. 2004. Low prevalence of methicillin-resistant Staphylococcus aureus (MRSA) at hospital admission in the Netherlands: the value of search and destroy and restrictive antibiotic use. J Hosp Infect 56:321-5.
27. Wilson, R., P. Monaghan, S. A. Bowden, J. Parnell, and J. M. Cooper. 2007. Surface-enhanced Raman signatures of pigmentation of cyanobacteria from within geological samples in a spectroscopic-microfluidic flow cell. Anal Chem 79:7036-41

121
Appendices Dankwoord Curriculum vitae List of publications PhD portfolio
Dankwoord Dan nu het meest gelezen hoofdstuk van menig proefschrift. En terecht. Want uiteindelijk schrijf je een proefschrift niet alleen. Dit lukt alleen met een team van mensen om je heen waarmee je samenwerkt en die je helpen en motiveren op de reis naar promotie. Daarom dit stukje tekst om alle mensen te bedanken die mij gedurende dit promotietraject op wat voor manier dan ook hebben begeleid, geholpen. Ondanks het risico dat ik bepaalde personen zal vergeten, wil ik toch graag enkele mensen in het bijzonder noemen. Alex, je bent al in vele dankwoorden genoemd en geroemd. Ook ik heb jouw geheel eigen en unieke manier van begeleiden zeer gewaardeerd. Zelfs nadat je was vertrokken naar het verre Frankrijk bleef je snel reageren op vragen. Het ontcijferen van je commentaren werd een nog grotere uitdaging omdat nu alle documenten ingescand werden. Je nuchtere kijk en het feit dat je in elk resultaat iets positiefs kon ontdekken waren zeer motiverend. Bedankt voor een leerzaam promotietraject. Kees, jij bent degene geweest die me met zachte hand richting promotietraject heeft gestuurd. Op het moment dat ik voor mezelf eindelijk besloten had om deze weg in te slaan, had jij alles al met Alex besproken en geregeld. Tijdens het gehele traject bleef je vertrouwen houden in een goede afloop, zelf als ik dat vertrouwen niet had. Het was fijn om aan jouw hand de wondere wereld van
122
congressen, manuscripten en presentaties te ontdekken. De zonnegroet zal nooit meer hetzelfde zijn. Mijn beide paranimfen, bedankt dat jullie naast me willen staan. Jan-willem, we hebben samen heel wat tijd doorgebracht op het lab. In het begin in schemerige sferen en met heel veel koffiepauzes. Maar ook toen het licht aan mocht is de sfeer tussen ons blijven bestaan. Je hebt me niet alleen enorm geholpen met al het labwerk, zonder jou had ik nooit zoveel geleerd over eten en bodybuilden. Heel veel succes met het traject waar je nu aan begint. Het is mooi om te zien hoe je jezelf aan het ontwikkelen bent. Liesbeth, samen waren we lange tijd de twee chlamydia meisjes. Ondanks het lawaai als we beide half in de flowkast hingen, kregen we het altijd voor elkaar om tijdens het werk gewoon door te kletsen. Dank je wel dat ik ook nu nog mijn verhaal bij je kwijt kan. Gerwin, zowel op het CODT als bij River Diagnostics heb ik je leren kennen als een gedreven wetenschapper. Met weinig en vaak zeer directe woorden wist je in een studie of manuscript de vinger op de zere plek te leggen. En ook al werd dit niet altijd meteen gewaardeerd, het leidde vaak wel tot een verbeterd inzicht. Bedankt voor je vertrouwen de ruimte die je me gegeven hebt om me op verschillende gebieden te ontwikkelen. Tom, je hulp is in de afgelopen jaren meer dan eens onmisbaar gebleken als ik weer eens vastzat met een data-analyse. Hoewel je uitleg en oplossingen in eerste instantie heel simpel leken, zijn er telkens weer de nodige hoofdbrekers nodig geweest om alles goed te snappen. Zelfs data op vrijdagavond inleveren betekende op maandag ochtend een rapport vol figuren en weinig uitleg. Alle (ex-) collega’s van het CODT, bedankt voor de gezelligheid op de werkvloer en tijdens de lunches. Het is goed om ook eens niet over werk te praten en gezien de meest uiteenlopende onderwerpen en conversaties tijdens de lunch lukt dit prima. Ik heb in ieder geval geleerd om snel een boterham naar binnen te werken. Peter, bedankt dat je altijd bereid bent om vragen te beantwoorden of te luisteren naar mijn verhalen. Alwin and Masha, good luck with your future work. Willemijn, het is goed om weer een ‘partner in crime’ te hebben op de kamer. Ik heb er alle vertrouwen in dat het met je onderzoek helemaal goed gaat komen. Maarten, je bent ondertussen een ex-collega, maar ik wil je graag bedanken voor je steun, hulp en collegialiteit tijdens de 4 jaar STW. Het is, denk ik, voor ons beide een leerzame periode geweest. En niet alleen op wetenschappelijk gebied. Alle (ex-) collega’s van River Diagnostics, bedankt voor de fijne samenwerking de afgelopen jaren.
123
Femke, natuurlijk wil ik jou als eerste noemen. Je bent mijn steun en toeverlaat op het lab. Het is fijn om iemand naast je te hebben waar je blind op kunt vertouwen. Bedankt voor je vrolijkheid en inzet. Guisseppe, thanks for the interesting conversations and your input in our research. I don’t think I will learn how to speak Italian soon, but keep trying to implement words. Gert, in de korte periode dat je bij ons hebt gewerkt heb je toch een heel positieve invloed gehad op het team door je nuchtere en heldere kijk. Heli, het heeft je in het begin veel moeite gekost om ons in te laten zien dat SOP’s en lijstjes uiteindelijk winst opleveren. Bedankt voor je geduld en de gezellige gesprekjes op het lab. Martin, Ronald en Jordy, bedankt dat jullie altijd klaar staan als dingen minder goed verlopen op het lab. Ursula, je bent telkens weer een grote steun als reizen of hotels geboekt moeten worden. Dank je dat je altijd klaarstaat. Alle (ex-) collega’s van de Medische Microbiologie en infectieziekten. Ik ben wel niet zo vaak op de afdeling, maar ik wil iedereen bedanken voor de ontspannen praatjes tijdens de koffie, picknick of borrel. Bedankt dat jullie al die tijd interesse hebben getoond in mij en mijn werk. Willem en René, in de loop van de tijd hebben we steeds meer samengewerkt. Ook al zijn veel van de wilde plannen nooit uitgevoerd, en bleken niet alle stammen collecties vindbaar, saai is overleg met juliie nooit. Ad, dank je wel dat je altijd klaar staat als ik langs kom met vragen of weer eens om stammen kom vragen. Naast de vele discussies met collega’s op de werkvloer, is er gelukkig ook nog genoeg tijd geweest voor discussies met vrienden. En al hadden deze gesprekken geen wetenschappelijke betekenis (soms zelfs helemaal geen betekenis), ze waren daardoor niet minder nuttig. Als je de neiging hebt om iets te veel met je werk bezig te zijn is het goed om erop gewezen te worden dat bacteriën gewoon enge beestjes zijn die je plat moet slaan, dat laserlicht leuk is voor de disco en dat een titel alleen nuttig is als je pompbediende wilt worden. In ieder geval bedankt voor alle feestjes, etentjes, avondjes uit, kampeer weekendjes, dagjes Efteling, dagjes sauna enz. Hopelijk volgen er nog velen….. Familie en schoonfamilie. Bedankt voor de belangstelling, maar zeker ook voor het fungeren als uitlaatklep middels de feestjes en weekendjes. Fred en Jeannette, jullie waren altijd aanwezig als steun op de achtergrond. En zorgen bovendien dat we op de hoogte blijven van alle gebeurtenissen in de buurt (op een goede manier). Tim en Ivo, jullie zijn twee kanjers. Ik ben trots op jullie. Paps en mams, het is lastig om jullie te bedanken in een paar zinnen. Ondanks het feit dat jullie mijn keuzes misschien niet altijd begrijpen, blijven jullie achter me staan. Het is fijn om te weten dat ik nog altijd ‘thuis’ kan komen.
124
Ronald, de laatste alinea is voor jou. Je hebt me de afgelopen jaren steeds gesteund in mijn keuzes en als geen ander met me meegeleefd. Ik kon telkens weer mijn verhaal aan je kwijt en op geheel eigen wijze wist je alles te relativeren. De spiegel die je me regelmatig voorhoudt blijkt telkens weer nuttig. Bedankt voor alle fijne jaren en ik hoop dat er nog velen volgen.
Curriculum vitae Diana Willemse-Erix is geboren te Oosterhout op 15 april 1968. In 1986 behaalde zij haar VWO diploma op het Mgr. Frencken college te Oosterhout. Na het propedeuse jaar aan de academie voor dietetiek besluit zij over te stappen naar de opleiding Medisch Laboratoriumonderwijs aan de Hogeschool Brabant te Etten-leur. Deze opleiding wordt succesvol afgerond in 1991 na een afstudeerstage op de afdeling Virologie van de Katholieke Universiteit Nijmegen. Na haar afstuderen blijft zij gedurende 5 jaar werkzaam op deze afdeling. Ze werkt hier als analist onder leiding van Dr. Willem Melchers aan verschillende onderzoeken o.a. naar de pathogenese van Enterovirussen en de prevalentie van het Humaan Papilloma virus. In 1996 zet zij haar werkzaamheden voort op de afdeling Medische Microbiologie en Infectieziekten van het ErasmusMC te Rotterdam in de research groep van prof. Dr. Dr. Alex van Belkum. Zij werkt hier onder leiding van Dr. Roel Verkooyen o.a. aan projecten gericht op de identificatie, prevalentie en pathogenes van Chlamydia pneumoniae en Chlamydia trachomatis. Van 2004 tot 2008 is ze werkzaam op een samenwerkingsproject van de afdeling Medische Microbiologie en het Centrum voor Optische Diagnostiek en Therapie (CODT). Hier werkt ze onder leiding van Dr. Kees Maquelin en Dr. Gerwin Puppels aan het gebruik van Raman spectroscopie voor de snelle identificatie en typering van diverse microorganisme. In 2008 gaat ze part-time aan de slag bij River Diagnostics BV, een spin-off bedrijf van het CODT. Hier heeft ze momenteel een leidinggevende functie op het laboratorium waar diverse projecten uitgevoerd worden mbt de ontwikkeling van species specifieke protocollen en software voor de SpectraCell RA. Naast deze aanstelling heeft ze tevens een part-time positie aan de afdeling Medische Microbiologie behouden. Hier werkt ze verder aan het promotietraject dat in 2007 is opgestart. Het onderzoek dat voor dit promotietraject is uitgevoerd, staat beschreven in dit proefschrift.
125
List of publications
1. Willemse-Erix HFM, Bakker-Schut T, Bax F, Lemmens N, Papagiannitsis C, Puppels GJ, van Belkum A, Severin J, Goessens W, Maquelin K. Rapid typing of ESBL and KPC producing Escherichia coli and Klebsiella pneumoniae isolates using SpectraCell RA®. Journal of Clinical Microbiology 2011; submitted.
2. Willemse-Erix HFM, Scholtes-Timmerman MJ, Top J, Jachtenberg JW, Bonten M, Puppels GJ, van Belkum A, Willems R, Maquelin K. Reliable and easy typing scheme for Enterococcus faecium isolates based on Raman spectroscopy. 2011; in preparation.
3. Wulf MWH, Willemse-Erix HFM, Verduin CM, Puppels GJ, van Belkum A, Maquelin K. The use of Raman spectroscopy in the epidemiology of Methicillin resistant Staphylococcus aureus of human and animal related clonal lineages. Clinical Microbiology and Infection 2011; published online.
4. Rours GI, Duijts L, Moll HA, Arends LR, de Groot R, Jaddoe VW, Hofman A, Steegers EA, Mackenbach JP, Ott A, Willemse HFM, van der Zwaan EA, Verkooijen RP, Verbrugh HA. Chlamydia trachomatis infection during pregnancy associated with preterm delivery: a population-based prospective cohort study. European Journal of Epidemiology 2011; 26(6):493-502.
5. Rours GI, de Krijger RR, Ott A, Willemse HFM, de Groot R, Zimmermann LJ, Kornelisse RF, Verbrugh HA, Verkooijen RP. Chlamydia trachomatis and placental inflammation in early preterm delivery. European Journal of Epidemiology 2011; 26(5):421-428.
6. Willemse-Erix HFM, van Belkum A, Maquelin K. Raman spectroscopy for bacterial strain typing. Molecular Microbiology: Diagnostic Principles and Practice, 2nd edition 2010; 313-324.
7. Willemse-Erix HFM, Jachtenberg JW, Bakker Schut T, van Leeuwen W, van Belkum A, Puppels GJ, Maquelin K. Towards Raman-based epidemiological typing of Pseudomonas aeruginosa. Biophotonics. Journal of Biophotonics 2010; 3(8-9):506-511.
8. Willemse-Erix HFM, Jachtenberg JW, Barutçi H, Puppels GJ, van Belkum A, Vos MC, Maquelin K. Characterization of methicillin-resistant Coagulase Negative Staphylococci isolated from skin using Raman spectroscopy and Pulsed field gel electrophoresis. Journal of Clinical Microbiology 2010; 48(3):736-740.
9. Willemse-Erix HFM, Scholtes-Timmerman MJ, Jachtenberg JW, van Leeuwen WB, Horst-Kreft D, Bakker Schut TC, Deurenberg RH, Puppels GJ, van Belkum A, Vos MC, Maquelin K. Optical fingerprinting in bacterial epidemiology: Raman spectroscopy as a real-time typing method. Journal of Clinical Microbiology 2009; 47(3):652-659.
10. Scholtes-Timmerman MJ, Willemse-Erix HFM, Schut TB, van Belkum A, Puppels G, Maquelin K. A novel approach to correct variations in Raman spectra due to photo-bleachable cellular components. Analyst 2009; 134(2):387-393.
11. Rours GI, Hammerschlag MR, Van Doornum GJ, Hop WC, de Groot R, Willemse-Erix HFM, Verbrugh HA, Verkooyen RP. Chlamydia trachomatis respiratory infection in Dutch infants. Archives of Disease in Childhood 2009; 94(9):705-707.
12. Gelder JD, Willemse-Erix HFM, Scholtes MJ, Sanchez JI, Maquelin K, Vandenabeele P, Boever PD, Puppels GJ, Moens L, Vos PD. Monitoring poly(3-
126
hydroxybutyrate) production in cupriavidus necator DSM 428 (H16) with Raman spectroscopy. Analalytical Chemistry 2008; 80(6):2155-2160.
13. Buijtels PC, Willemse-Erix HFM, Petit PL, Endtz HP, Puppels GJ, Verbrugh HA, van Belkum A, van Soolingen D, Maquelin K. Rapid identification of mycobacteria by Raman spectroscopy. Journal of Clinical Microbiology 2008; 46(3):961-965.
14. Willemse-Erix HFM, Scholtes MJ, Puppels GJ, Vandamme P, van Belkum A, Maquelin K. The use of Raman spectroscopy for the identification of the Burkholderia cepacia complex and related species. Daniel den Hoed Cancer News 2007; July:37-38.
15. Willemse HFM, Maquelin K, Scholtes MJ, Vandamme P, van Belkum A, Puppels GJ. Use of Raman spectroscopy for the identification of Burkholderia spp. Nederlands tijdschrift voor Medische Microbiologie 2006; 14(supplement):43-44.
16. Scholtes MJ, Maquelin K, Willemse HFM, van Belkum A, Puppels GJ. Use of Raman spectroscopy for rapid subspecies identification of vancomycin resistant enterococci. Nederlands Tijdschrift voor Medische Microbiologie 2006; 14(supplement):91-92.
17. Rours GI, Verkooyen RP, Willemse HFM, van der Zwaan EA, van Belkum A, de Groot R, Verbrugh HA, Ossewaarde JM. Use of pooled urine samples and automated DNA isolation to achieve improved sensitivity and cost-effectiveness of large-scale testing for Chlamydia trachomatis in pregnant women. Journal of Clinical Microbiology 2005; 43(9):4684-4690.
18. Maquelin K, Willemse HFM, Scholtes MJ, Endtz HPh, van Belkum A, Puppels GJ. Microbes and Light, a vibrant interaction. Fotonica Magazine 2004; 29:20-22.
19. Becker MJ, de Marie S, Willemse HFM, Verbrugh HA, Bakker-Woudenberg IA. Quantitative galactomannan detection is superior to PCR in diagnosing and monitoring invasive pulmonary aspergillosis in an experimental rat model. Journal of Clinical Microbiology 2000; 38(4):1434-1438.
20. Verkooyen RP, Willemse HFM, Hiep-van Casteren SC, Joulandan SA, Snijder RJ, van den Bosch JM, van Helden HP, Peeters MF, Verbrugh HA. Evaluation of PCR, culture, and serology for diagnosis of Chlamydia pneumoniae respiratory infections. Journal of Clinical Microbiology 1998; 36(8):2301-2307.
21. van Belkum A, Scherer S, van Leeuwen W, Willemse HFM, van Alphen L, Verbrugh. HA. Variable number of tandem repeats in clinical strains of Haemophilus influenza. Infection and Immunity 1997; 65(12):5017-5027.
22. Melchers WJ, Ferrera A, Willemse HFM, Galama J, Walboomers J, De Barahona O, Figueroa M, Snijders P. Human papillomavirus and cervical cancer in Honduran women. The American Journal of Tropical Medicine and Hygiene 1994; 50(2):137-142.
23. van Kuppeveld FJ, Melchers WJ, Willemse HFM, Kissing J, Galama JM, van der Logt JT. Detection of Mycoplasma pulmonis in experimentally infected laboratory rats by 16S rRNA amplification. Journal of Clinical Microbiology 1993; 31(3):524-527.
24. Melchers WJ, de Visser M, Jongen P, van Loon A, Nibbeling R, Oostvogel P, Willemse HFM, Galama JM. The postpolio syndrome: no evidence for poliovirus persistence. Annals of Neurology 1992; 32(6):728-732.

127
PhD portfolio Name PhD student: H.F.M. Willemse-Erix Erasmus MC department: Medical Microbiology and Infectious diseases PhD period: 2007-2011 Research school: Postgraduate School Molecular Medicine Promotor: Prof. dr. dr. A. van Belkum Copromotor: Dr. K. Maquelin
1. PHD training Courses year Hospital Epidemiology (ESCMID-SHEA) 2008 Patient related research (EMC) 2010 Clostridium difficile associated disease (Boerhaave commissie) 2008 Seminars and workshops Departmental Journal clubs 2007 - 2011 Departmental Research meetings 2007 - 2011 11th Molecular Medicine day (oral presentation) 2007 Departmental Research day (oral presentation) 2008 12th Molecular Medicine day (poster presentation) 2008 Departmental Research day (oral presentation) 2009 Departmental Research day (oral presentation) 2010 International conferences FTIR Spectroscopy, Berlin, Germany (poster presentation) 2007 18th ECCMID, Barcelona, Spain (oral/poster presentation) 2008 108th general meeting of the ASM (poster presentation) 2008 19th ECCMID, Helsinki, Finland (poster presentation) 2009 IMMEM-9, Werningerode, Germany (poster presentations) 2010 111th general meeting of the ASM (poster presentation) 2011
2. Teaching
Lectures Molecular Diagnostics course (oral presentation) 2010 Supervision Supervision of bachelor students Life Sciences 2007 - 2011 Supervision of guests and trainees 2007 - 2011 Training on the use of SpectraCell RA system 2009 – 2011