optical amplifiers (chapter 6)ece-research.unm.edu/hayat/ece565/ece565_amps1.pdfoptical amplifiers...
TRANSCRIPT
Optical Amplifiers (Chapter 6)General optical amplifier theory
Semiconductor Optical Amplifier (SOA)Raman Amplifiers
Erbium-doped Fiber Amplifiers (EDFA)Read Chapter 6, pp. 226-266
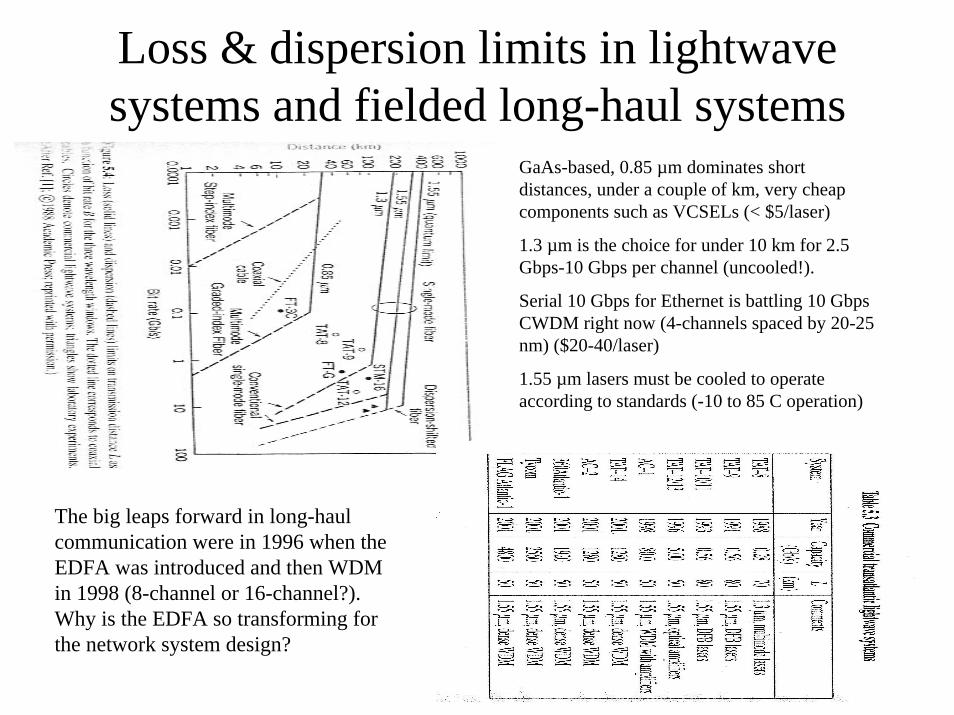
Loss & dispersion limits in lightwave systems and fielded long-haul systems
GaAs-based, 0.85 µm dominates short distances, under a couple of km, very cheap components such as VCSELs (< $5/laser)
1.3 µm is the choice for under 10 km for 2.5Gbps-10 Gbps per channel (uncooled!).
Serial 10 Gbps for Ethernet is battling 10 Gbps CWDM right now (4-channels spaced by 20-25 nm) ($20-40/laser)
1.55 µm lasers must be cooled to operate according to standards (-10 to 85 C operation)
The big leaps forward in long-haul communication were in 1996 when the EDFA was introduced and then WDM in 1998 (8-channel or 16-channel?). Why is the EDFA so transforming for the network system design?
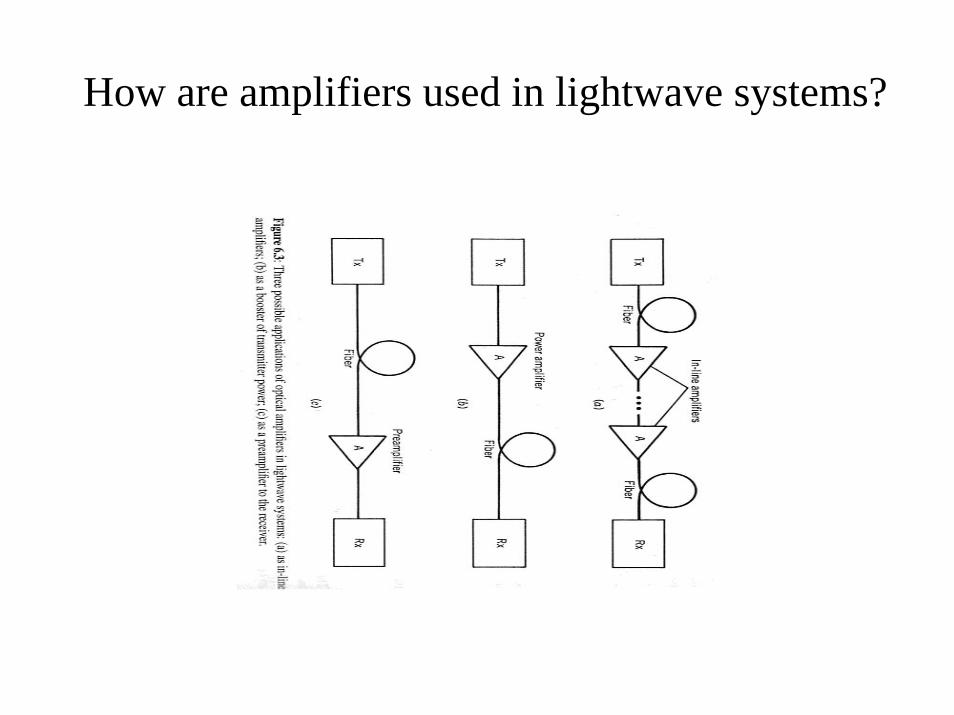
How are amplifiers used in lightwave systems?
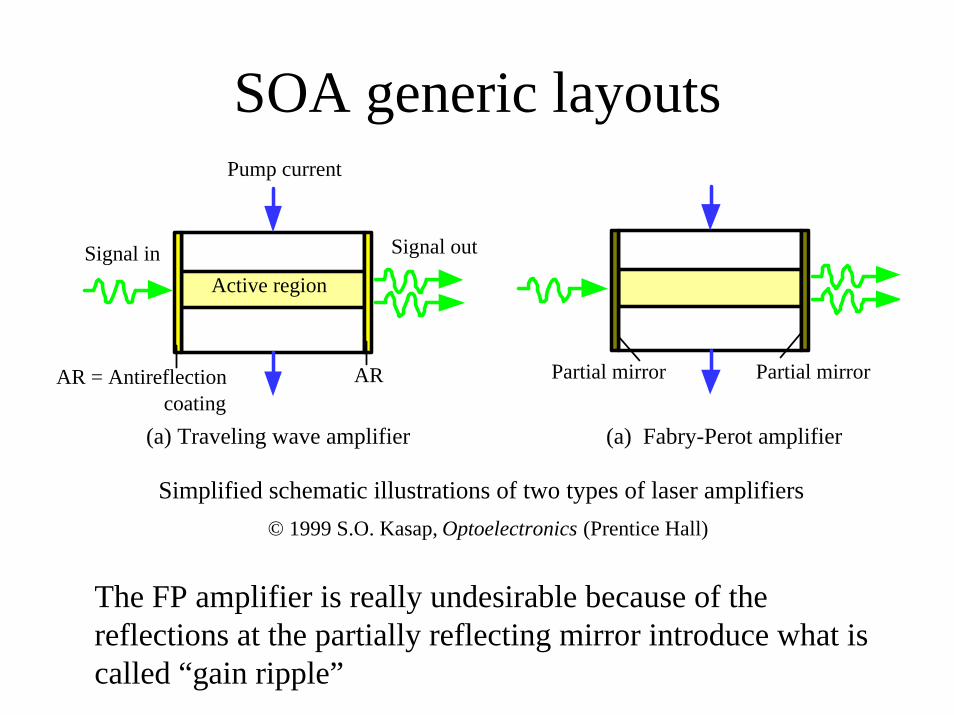
SOA generic layouts
Simplified schematic illustrations of two types of laser amplifiers
Pump current
Active region
AR = Antireflectioncoating
AR
Signal in Signal out
(a) Traveling wave amplifier (a) Fabry-Perot amplifier
Partial mirror Partial mirror
© 1999 S.O. Kasap, Optoelectronics (Prentice Hall)
The FP amplifier is really undesirable because of the reflections at the partially reflecting mirror introduce what iscalled “gain ripple”
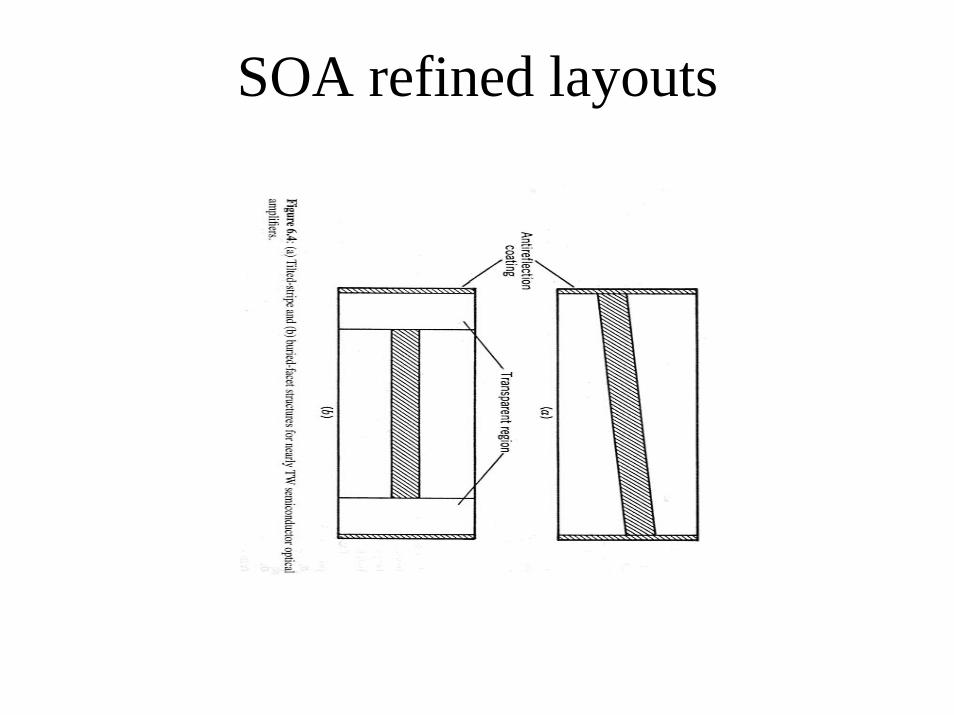
SOA refined layouts
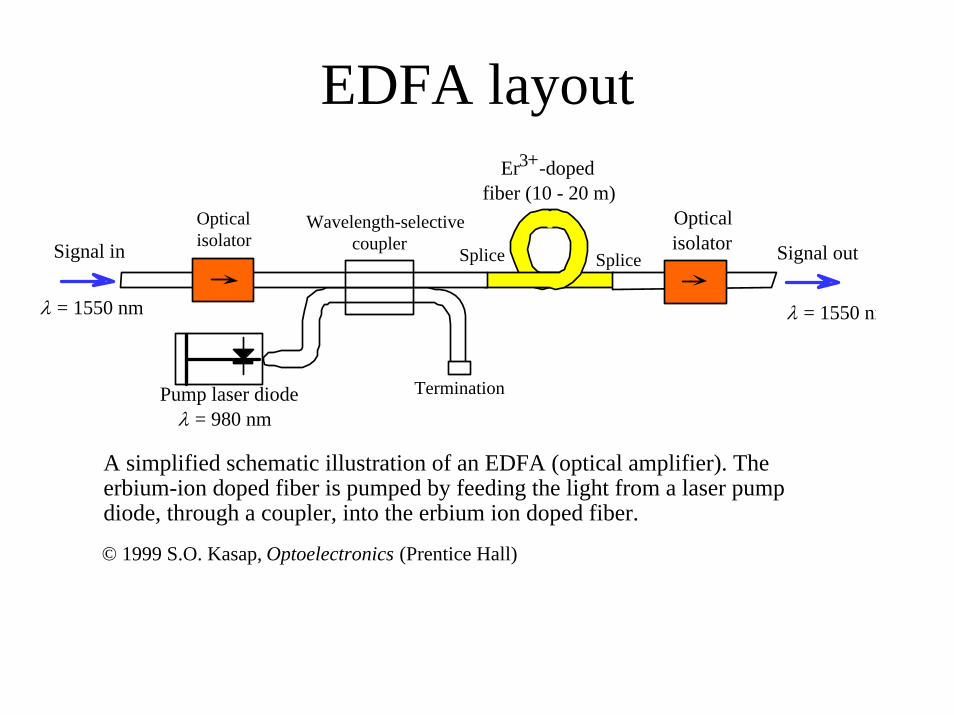
EDFA layout
Signal in Signal outSplice
Er3+-dopedfiber (10 - 20 m)
Wavelength-selective coupler
Pump laser diode
Splice
λ = 1550 nm λ = 1550 nm
λ = 980 nmTermination
Opticalisolator
Opticalisolator
A simplified schematic illustration of an EDFA (optical amplifier). Theerbium-ion doped fiber is pumped by feeding the light from a laser pumpdiode, through a coupler, into the erbium ion doped fiber.
© 1999 S.O. Kasap, Optoelectronics (Prentice Hall)
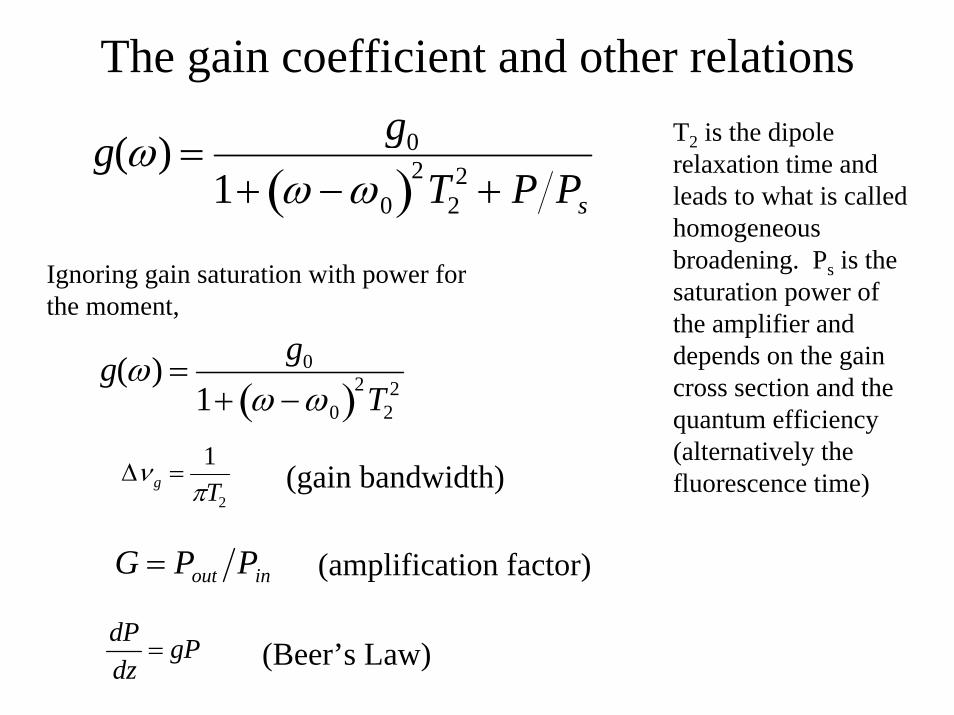
The gain coefficient and other relations
g(ω) =g0
1+ ω −ω0( )2T22 + P Ps
T2 is the dipole relaxation time and leads to what is called homogeneous broadening. Ps is the saturation power of the amplifier and depends on the gain cross section and the quantum efficiency (alternatively the fluorescence time)
Ignoring gain saturation with power for the moment,
g(ω) =g0
1+ ω −ω0( )2T22
∆ν g =1
πT2(gain bandwidth)
G = Pout Pin (amplification factor)
dPdz
= gP (Beer’s Law)
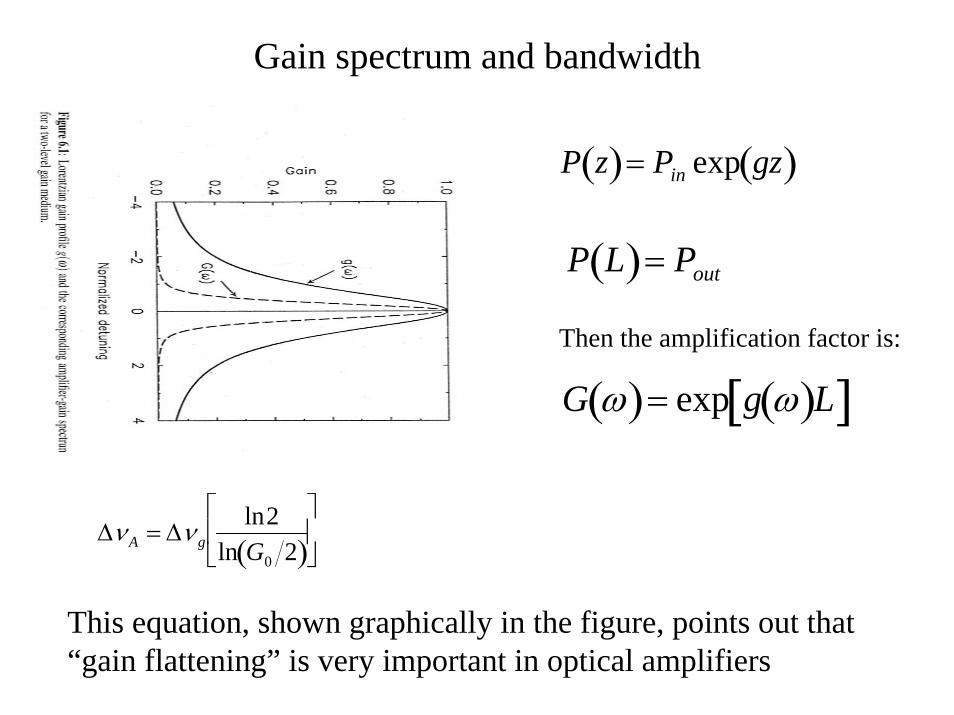
Gain spectrum and bandwidth
P z( )= Pin exp gz( )
P L( )= Pout
Then the amplification factor is:
G ω( )= exp g ω( )L[ ]
∆ν A = ∆ν gln2
ln G0 2( )⎡
⎣ ⎢
⎤
⎦ ⎥
This equation, shown graphically in the figure, points out that “gain flattening” is very important in optical amplifiers
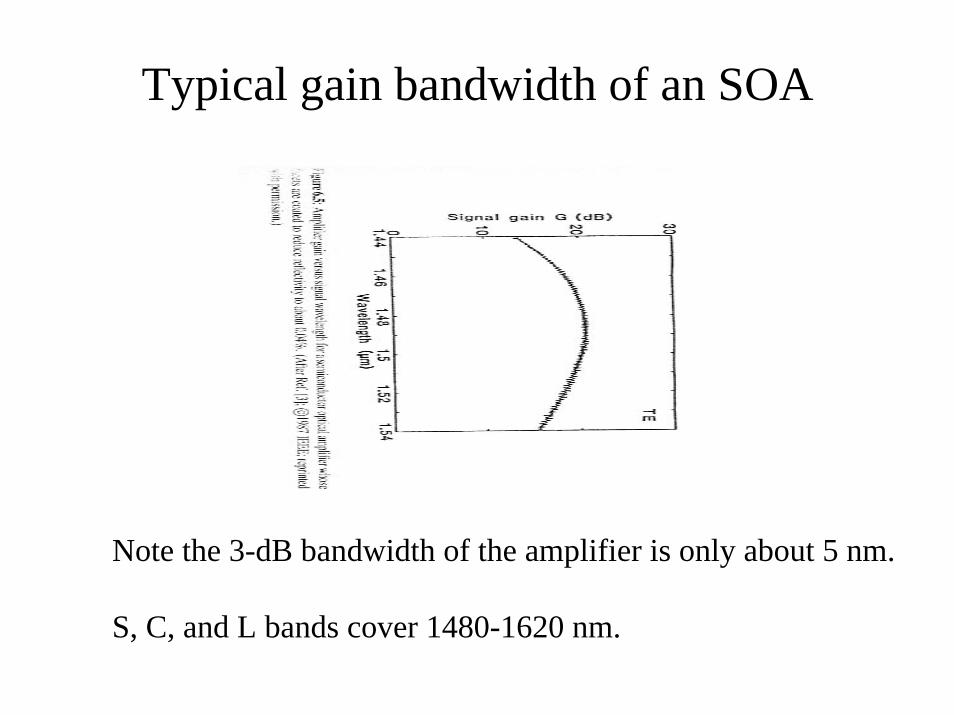
Typical gain bandwidth of an SOA
Note the 3-dB bandwidth of the amplifier is only about 5 nm.
S, C, and L bands cover 1480-1620 nm.
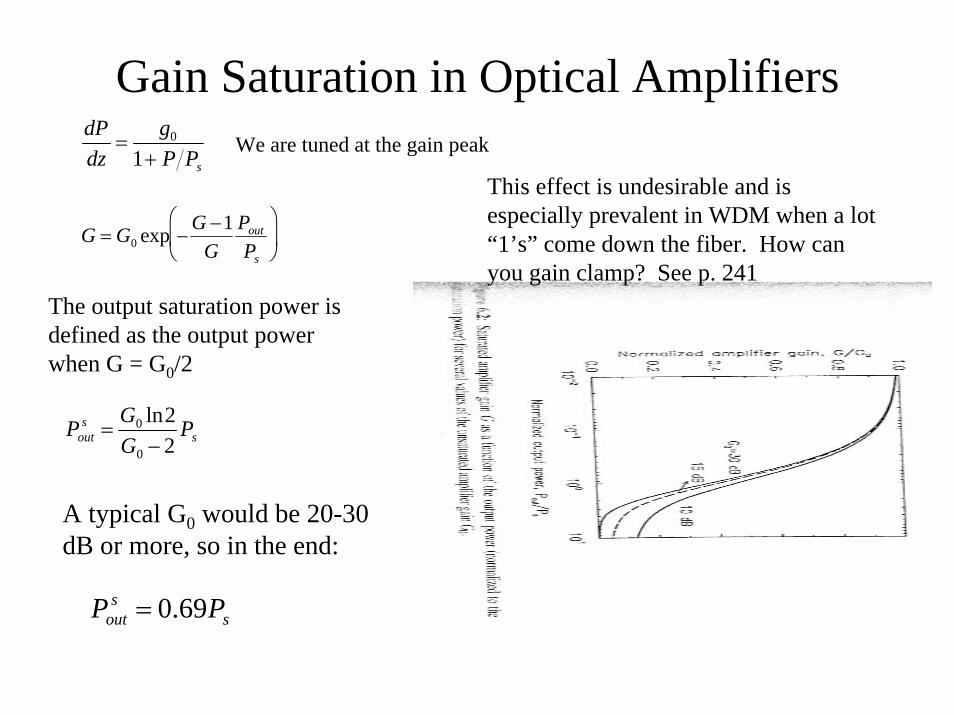
Gain Saturation in Optical AmplifiersdPdz
=g0
1+ P Ps
G = G0 exp −G −1
GPout
Ps
⎛
⎝ ⎜
⎞
⎠ ⎟
Pouts =
G0 ln2G0 − 2
Ps
We are tuned at the gain peak
Pouts = 0.69Ps
This effect is undesirable and is especially prevalent in WDM when a lot “1’s” come down the fiber. How can you gain clamp? See p. 241
The output saturation power is defined as the output power when G = G0/2
A typical G0 would be 20-30 dB or more, so in the end:
Optical Amplifier Noise (big issue! 3dB is the minimum theoretical noise figure)
Fn =SNR( )in
SNR( )out
Amplifier noise figure is Fn, the amplifier has a gain, G, and input and output powers, Pin and Pout.Pout = GPin
First, find the signal-to-noise ratio on the input:
R is the responsivity and we are assuming zero dark current in an ideal photodetector
SNR( )in =I 2
σ s2 =
RPin( )2
2q RPin( )∆f=
Pin
2hν∆f
I is the average photocurrent and σs2 is the shot noise variance
(p. 156)
Amplifier noise continuedNext, the signal-to-noise ratio on the output end of the amp must take into account the spontaneous emission induced noise
The noise spectral density is:
Ssp ν( )= G −1( )nsphν
Where nsp, the spontaneous emission factor or population inversion factor is:
nsp = N2 N2 − N1
The dominant contribution to the noise is the beating of the spontaneous emission with the signal.
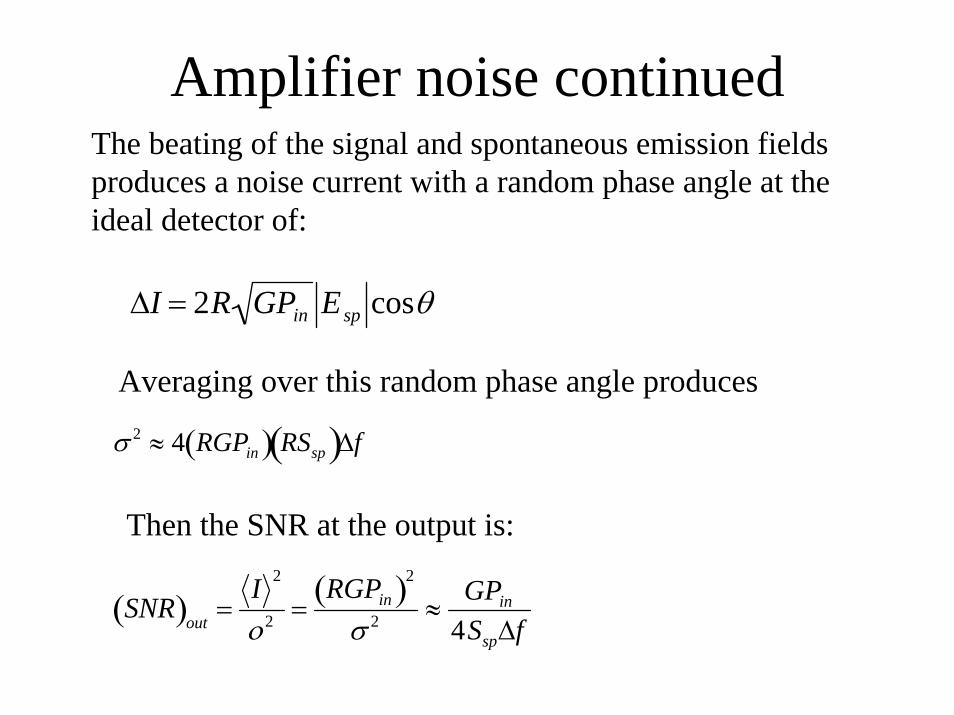
Amplifier noise continuedThe beating of the signal and spontaneous emission fields produces a noise current with a random phase angle at the ideal detector of:
∆I = 2R GPin Esp cosθ
Averaging over this random phase angle produces
σ 2 ≈ 4 RGPin( ) RSsp( )∆f
Then the SNR at the output is:
SNR( )out =I 2
ο2 =RGPin( )2
σ 2 ≈GPin
4Ssp∆f
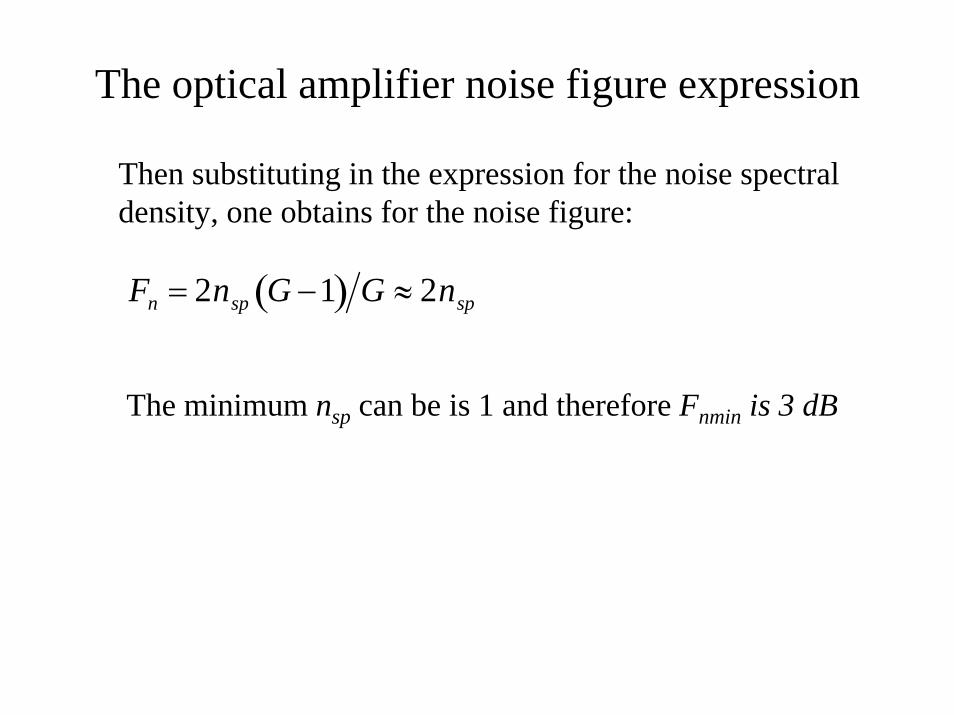
The optical amplifier noise figure expression
Then substituting in the expression for the noise spectral density, one obtains for the noise figure:
Fn = 2nsp G −1( ) G ≈ 2nsp
The minimum nsp can be is 1 and therefore Fnmin is 3 dB