opportunities in regional markets
TRANSCRIPT

CFA Institute
Opportunities in Regional MarketsAuthor(s): Paul F. Jessup and Roger B. UpsonSource: Financial Analysts Journal, Vol. 26, No. 2 (Mar. - Apr., 1970), pp. 75-79Published by: CFA InstituteStable URL: http://www.jstor.org/stable/4470657 .
Accessed: 18/06/2014 22:49
Your use of the JSTOR archive indicates your acceptance of the Terms & Conditions of Use, available at .http://www.jstor.org/page/info/about/policies/terms.jsp
.JSTOR is a not-for-profit service that helps scholars, researchers, and students discover, use, and build upon a wide range ofcontent in a trusted digital archive. We use information technology and tools to increase productivity and facilitate new formsof scholarship. For more information about JSTOR, please contact [email protected].
.
CFA Institute is collaborating with JSTOR to digitize, preserve and extend access to Financial AnalystsJournal.
http://www.jstor.org
This content downloaded from 91.229.248.104 on Wed, 18 Jun 2014 22:49:18 PMAll use subject to JSTOR Terms and Conditions
Opportunities in Regional Markets by PAUL F. JESSUP and ROGER B. UPSON
R ECENT financial research has focused on shares traded on the New York Stock Exchange (NYSE) or the widely-held stocks in such data files as the
Compustat tapes.' However, the many other securities markets in the United States have not been as extensive- ly analyzed. Such markets include the nine registered regional exchanges2 and the extensive over-the-counter market.
The over-the-counter market (OTC) has two princi- pal elements. One comprises stocks of national interest, listed daily in principal newspapers. The other element comprises local OTC stocks. Such regularly traded shares, often listed in major regional newspapers, have been of interest principally to investors and dealers in a limited geographical area.
The dual purpose of this paper is (1 ) to state why regional OTC markets merit the sustained interest of national analysts and portfolio managers, and (2) to delineate portfolio opportunities and limitations in a regional OTC market.
Potential Portfolio Opportunities: A Framework
Many financial analysts and investors seek shares of companies whose probable growth is not being largely anticipated in present share prices. However, important corporate affairs of nationally-traded firms are usually reported and discussed in the national press. Prospects of these firms are analyzed by various investment re- search staffs, and their analyses are available to many professional investors. Thus, the information network for listed stocks should be reasonably efficient so that present share prices are reasonably accurate, estimates of future corporate prospects.
In searching for above-average investment returns for a specific level of risk, the financial analyst may find growth stocks and turn-around situations in regional OTC markets. Firms whose shares are traded locally are not widely known. News of their corporate activities
often receives only regional coverage; and there is less likely to be a phalanx of analysts covering smaller, re- gional firms. By evaluating some of these companies in depth, an analyst may discover potentially under-valued issues.
Portfolio managers also may benefit from greater at- tention to regional markets. Portfolio theory indicates the importance of diversification in the construction of efficient portfolios, and inclusion of selected regional stocks may well improve portfolio performance. Al- though the firms whose shares are traded in regional OTC markets represent a broad spectrum of economic outlooks, from above-average growth through substan- tial decline, these outlooks are not necessarily strongly correlated with those of national firms. By seeking pro- fessional analyses of these diverse regional firms, port- folio managers will have opportunities to reduce total variance, thereby achieving better diversification and performance.
Thus, there are reasons to believe that analysts and portfolio managers will benefit from increased attention to the risk-return attributes of regional stocks. Past financial research in this area has been minimal. How- ever, new information about such markets can now be considered.
Analysis of a Regional Market Many metropolitan areas contain a regional OTC
market; and, as a sample, we have examined the Minne- sota OTC market.' The period covered by this analysis is 1946-67, during which time the common shares of 257 firms were traded. For 235 of these stocks data were obtained on prices, dividends, and capital changes. Twenty-two stocks were excluded because of inadequate information, but examination of the limited available data does not suggest that their exclusion biases the results of this study. Also, to be able to compare our results to those obtainable on the NYSE, shares of banks and insurance companies were excluded.
Returns
Among the 235 stocks in the Minnesota market were some that subsequently achieved a national following and demonstrated substantial price appreciation. Ex- amples include:
1. Footnotes appear at end of article.
PAUL F. JESsUP and ROGER B. UPSON are Associate Pro- fessors of Finance, School of Business Administration, University of Minnesota. They wish to acknowledge the re- search assistance of Donald J. Mingo and Michael L. Smith.
FINANCIAL ANALYSTS JOURNAL / MARCH-APRIL 1970 75
This content downloaded from 91.229.248.104 on Wed, 18 Jun 2014 22:49:18 PMAll use subject to JSTOR Terms and Conditions
cp >aoo&&LricHoS?or-toi 1.0 0s O O C\i RI 1F- 10 ni L?i CY _J Y ~"i oi (7z Lt N 0 -i A r-
- r -4-4 r-1 -4 r- r _l r_l r-I N N 1 r_1 r- CM mJ Rr ND
r- c R| c) ri O n _I cmS a, m ", r- qc r- 1 n r4 m c* Ln c> cj o N NN4r1 _ r1~lrl D
Nr4r_l r-1 C 4,-4
~o (cL\tcLiLi, c oc 6a,c)a )ri imoo b>ON N W)I)td0)O Ds0 >O N _ e r_ -1 r- ci r1_1 r-1 r1 r1l r_1 -1 _?4 1- 1 -1 _-1
LC) ILOeuo,OntOrOs~r-%a Ln N. - M1 )~ n9 ~o I~ 0 N r- bJnr r- r-..
r4~~~41-4r4 r~~~~~N c r-4
t O h-OOLflnKbHOU) . s0 00 00 00 _i C\i U)i U)i 'I '3 r- i- GO qc r 00 \i 10 U)i
H~~H HONO I e I
- C ',D |h - NI O C) O 4 L - M N N N 00 O 'D - e
La CA roo v
l C. m n1 -c r-1M \in C-1 L <
= . IIS
~o
ce ri r-i c) H o ri cc c) o s cm qO oC Ln w Ln nt a, .0 I- E o c J Jrqi 6 Noo 6 6 6 c La oo PN
-I OW x
0
Z - 0 0 1 O 1 -I u^ m ct m 0 o cr ) tM m - 0 0 6c ~c\ :a
. O:, A 6r~c > C | r-4a--._mW 40 l-I H C,-
.. :s ? ur as o o C
e JO
al r- u i , 6 u i r 0 L
W*.C 0
e~~~~~ m._ Ln al l O - m Os m-0 S C) O m\ > v >v ~~~~~~Ln 00 r.s oo
A cs
.r CN
A (7 A r clo U~~~~~~~~~~~~~~~r r a m m r_Nl S 0H
O COs0 C(ONoNcODoeUJm
Q~~~~~~L E z C6 a,, cri oo?^ oo siRioo
U N~~~~M r N4Mr- -4 ic
S~~~~~~~~ un M c nrco
Y~~~~~L c_ od c; 6d r.Jrz
F > t U) 1 n St as bi .U. O
Z O~ N t? 0
> G
u E 0 L o coo - >
0~~~ c s c
o (r11-Nr4a49
mi~~~~~ c. L. c . NOc MC).
C 0 0) Ln ,:j:ti I
Cl LAO
IE E o rv o .-a-o coNe?m? :aoHN teu
z c C r In -<~~~~~~~n ui q:
W C ~~~~LnCi S S ~ C
Z 0 0 ~~40 M m0 s-I
I ~~~~ U C ' r-- I"M
CO - 0C
OR. LU 01~~~~~I,n
CI0 L> N O-a
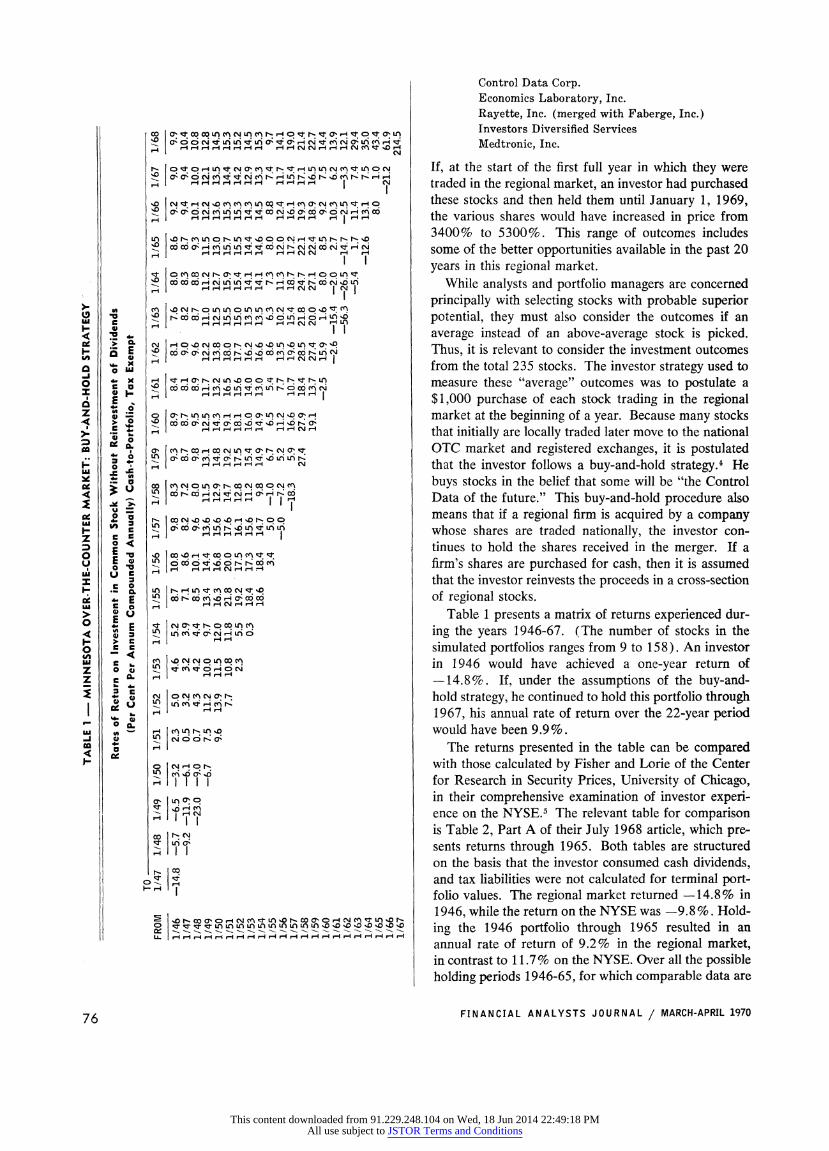
Control Data Corp. Economics Laboratory, Inc. Rayette, Inc. (merged with Faberge, Inc.) Investors Diversified Services Medtronic, Inc.
If, at the start of the first full year in which they were traded in the regional market, an investor had purchased these stocks and then held them until January 1, 1969, the various shares would have increased in price from 3400% to 5300%. This range of outcomes includes some of the better opportunities available in the past 20 years in this regional market.
While analysts and portfolio managers are concerned principally with selecting stocks with probable superior potential, they must also consider the outcomes if an average instead of an above-average stock is picked. Thus, it is relevant to consider the investment outcomes from the total 235 stocks. The investor strategy used to measure these "average" outcomes was to postulate a $1,000 purchase of each stock trading in the regional market at the beginning of a year. Because many stocks that initially are locally traded later move to the national OTC market and registered exchanges, it is postulated that the investor follows a buy-and-hold strategy.4 He buys stocks in the belief that some will be "the Control Data of the future." This buy-and-hold procedure also means that if a regional firm is acquired by a company whose shares are traded nationally, the investor con- tinues to hold the shares received in the merger. If a firm's shares are purchased for cash, then it is assumed that the investor reinvests the proceeds in a cross-section of regional stocks.
Table 1 presents a matrix of returns experienced dur- ing the years 1946-67. (The number of stocks in the simulated portfolios ranges from 9 to 158). An investor in 1946 would have achieved a one-year return of -14.8%. If, under the assumptions of the buy-and- hold strategy, he continued to hold this portfolio through 1967, his annual rate of return over the 22-year period would have been 9.9%.
The returns presented in the table can be compared with those calculated by Fisher and Lorie of the Center for Research in Security Prices, University of Chicago, in their comprehensive examination of investor experi- ence on the NYSE.5 The relevant table for comparison is Table 2, Part A of their July 1968 article, which pre- sents returns through 1965. Both tables are structured on the basis that the investor consumed cash dividends, and tax liabilities were not calculated for terminal port- folio values. The regional market returned -14.8% in 1946, while the return on the NYSE was -9.8 %. Hold- ing theZ 1946 plortfolio through 1965 resulted in an annual rate of return of 9.2% in the regional market, in contrast to 11.7% on the NYSE. Over all the possible holding periods 1946-65, for which comparable data are
76 FINANCIAL ANALYSTS JOURNAL / MARCH-APRIL 1970
This content downloaded from 91.229.248.104 on Wed, 18 Jun 2014 22:49:18 PMAll use subject to JSTOR Terms and Conditions
available, the returns from the NYSE exceeded those from the regional market in 159 of the 210 holding periods. Thus, the investor achieved higher returns from the NYSE in about threw out of four periods.
Although generally dominated by the NYSE returns, longer holding period returns were not absolutely un- attractive in the regional market. For example, there are 21 two-year holding periods in the table, and the median return for all these holding periods was 5.9%. For all five-year periods the median return was 10%, and for 10-year periods it was 13.5%. Furthermore, average returns in the regional market were superior for some base years and holding periods, such as those com- mencing in 1953, 1959 and 1960. Particularly striking was the return of 214.5% in 1967. Thus, while an "average" selection in the regional market usually would not have provided the superior results sought by an aggressive investor, it would not have been disastrous. These average returns confirm the need for selectivity in identifying stocks with probable superior returns for a given risk level.
Risk
A measure of risk is that average returns in the re- gional market have greater amplitude than returns on the NYSE. Over all holding periods, the range in the regional market was from -56.3% to 214.5% (Table 1 ). Over the longer time period ( 1926-65) examined by Fisher and Lorie, the NYSE range was from -47.6% to 108.8%. However, examination of one-year returns from 1946 through 1965, when comparable data are available, indicates no significant difference in the vari- ance of each market.6
Another risk measure is that, over all holding periods from 1946 through 1965, the probability of receiving lower average returns in the regional market has been .75. However, the probability of lower returns becomes less as the length of holding period increases. For one- year holding periods, the probability of the average portfolio of regional stocks providing a return less than that from the NYSE is .90; for five-year holding periods the probability decreases to .81, and for 10-year periods it is .64. Examination of the intervening holding periods confirms this observed trend, which is consistent with the earlier analysis that median returns were less for shorter holding periods.
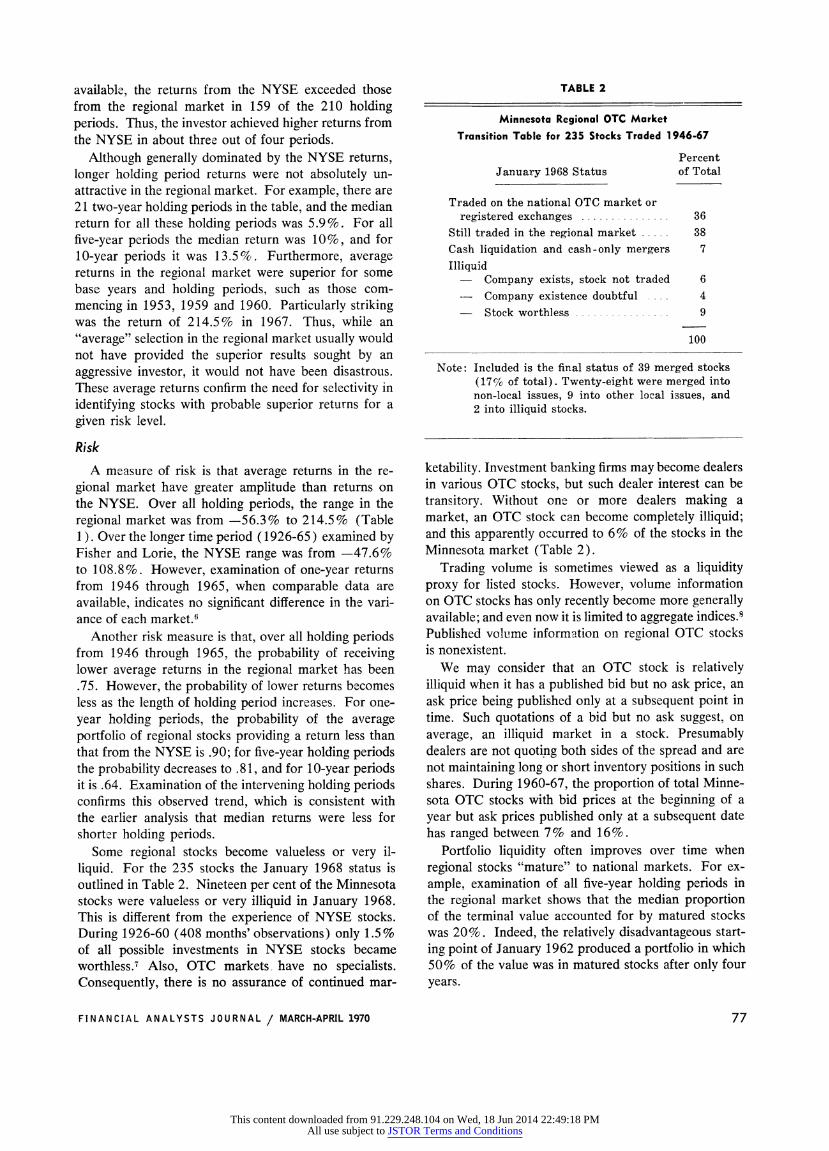
Some regional stocks become valueless or very il- liquid. For the 235 stocks the January 1968 status is outlined in Table 2. Nineteen per cent of the Minnesota stocks were valueless or very illiquid in January 1968. This is different from the experience of NYSE stocks. During 1926-60 (408 months' observations) only 1.5% of all possible investments in NYSE stocks became worthless.7 Also, OTC markets have no specialists. Consequently, there is no assurance of continued mar-
ketability. Investment banking firms may become dealers in various OTC stocks, but such dealer interest can be transitory. Without one or more dealers making a market, an OTC stock can become completely illiquid; and this apparently occurred to 6% of the stocks in the Minnesota market (Table 2).
Trading volume is sometimes viewed as a liquidity proxy for listed stocks. However, volume information on OTC stocks has only recently become more generally available; and even now it is limited to aggregate indices.8 Published volume information on regional OTC stocks is nonexistent.
We may consider that an OTC stock is relatively illiquid when it has a published bid but no ask price, an ask price being published only at a subsequent point in time. Such quotations of a bid but no ask suggest, on average, an illiquid market in a stock. Presumably dealers are not quoting both sides of the spread and are not maintaining long or short inventory positions in such shares. During 1960-67, the proportion of total Minne- sota OTC stocks with bid prices at the beginning of a year but ask prices published only at a subsequent date has ranged between 7% and 16%.
Portfolio liquidity often improves over time when regional stocks "mature" to national markets. For ex- ample, examination of all five-year holding periods in the regional market shows that the median proportion of the terminal value accounted for by matured stocks was 20%. Indeed, the relatively disadvantageous start- ing point of January 1962 produced a portfolio in which 50% of the value was in matured stocks after only four years.
TABLE 2
Minnesota Regional OTC Market Transition Table for 235 Stocks Traded 1946-67
Percent January 1968 Status of Total
Traded on the national OTC market or registered exchanges ........... .... 36
Still traded in the regional market ..... 38 Cash liquidation and cash-only mergers 7 Illiquid
Company exists, stock not traded 6 -- Company existence doubtful . 4
Stock worthless ................ 9
100
Note: Included is the final status of 39 merged stocks (17% of total). Twenty-eight were merged into non-local issues, 9 into other local issues, and 2 into illiquid stocks.
FINANCIAL ANALYSTS JOURNAL / MARCH-APRIL 1970 77
This content downloaded from 91.229.248.104 on Wed, 18 Jun 2014 22:49:18 PMAll use subject to JSTOR Terms and Conditions
Other Market Dimensions This section provides selected measures for compar-
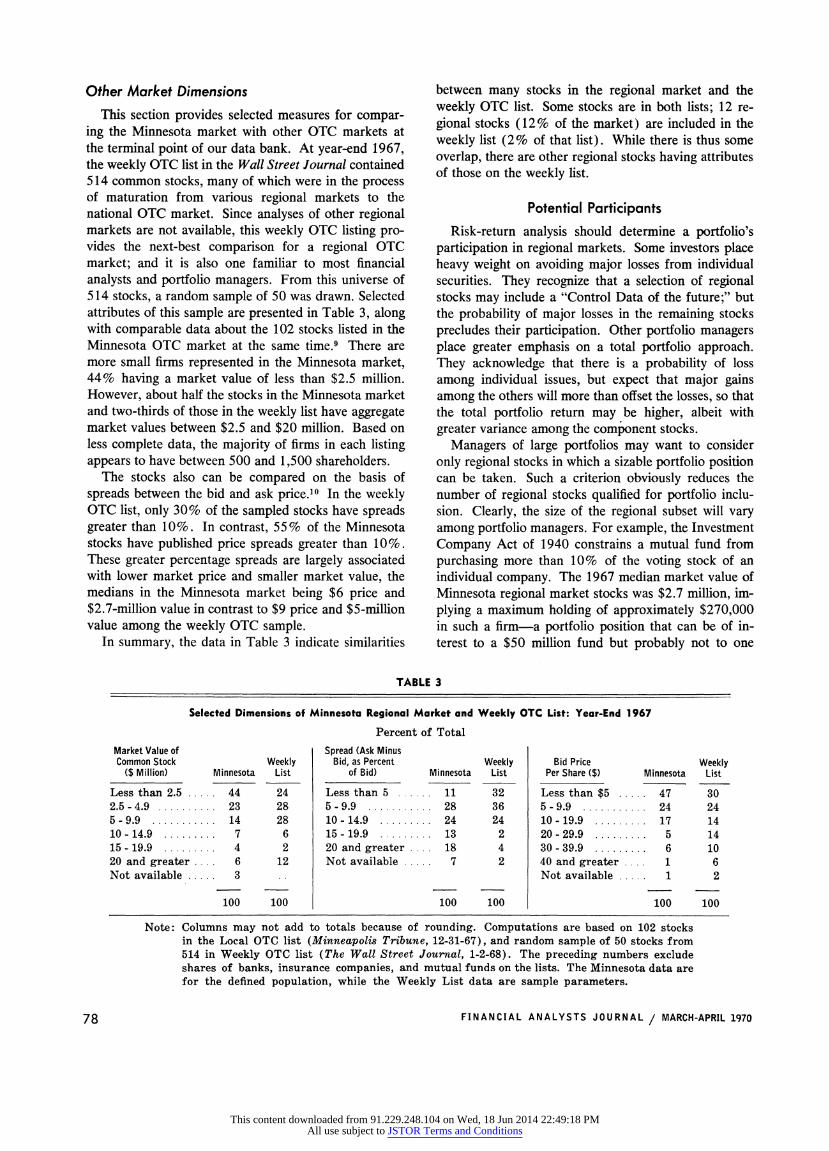
ing the Minnesota market with other OTC markets at the terminal point of our data bank. At year-end 1967, the weekly OTC list in the Wall Street Journal contained 514 common stocks, many of which were in the process of maturation from various regional markets to the national OTC market. Since analyses of other regional markets are not available, this weekly OTC listing pro- vides the next-best comparison for a regional OTC market; and it is also one familiar to most financial analysts and portfolio managers. From this universe of 514 stocks, a random sample of 50 was drawn. Selected attributes of this sample are presented in Table 3, along with comparable data about the 102 stocks listed in the Minnesota OTC market at the same time.9 There are more small firms represented in the Minnesota market, 44% having a market value of less than $2.5 million. However, about half the stocks in the Minnesota market and two-thirds of those in the weekly list have aggregate market values between $2.5 and $20 million. Based on less complete data, the majority of firms in each listing appears to have between 500 and 1,500 shareholders.
The stocks also can be compared on the basis of spreads between the bid and ask price.'0 In the weekly OTC list, only 30% of the sampled stocks have spreads greater than 10%. In contrast, 55% of the Minnesota stocks have published price spreads greater than 10%. These greater percentage spreads are largely associated with lower market price and smaller market value, the medians in the Minnesota market being $6 price and $2.7-million value in contrast to $9 price and $5-million value among the weekly OTC sample.
In summary, the data in Table 3 indicate similarities
between many stocks in the regional market and the weekly OTC list. Some stocks are in both lists; 12 re- gional stocks (12% of the market) are included in the weekly list (2% of that list). While there is thus some overlap, there are other regional stocks having attributes of those on the weekly list.
Potential Participants
Risk-return analysis should determine a portfolio's participation in regional markets. Some investors place heavy weight on avoiding major losses from individual securities. They recognize that a selection of regional stocks may include a "Control Data of the future;" but the probability of major losses in the remaining stocks precludes their participation. Other portfolio managers place greater emphasis on a total portfolio approach. They acknowledge that there is a probability of loss among individual issues, but expect that major gains among the others will more than offset the losses, so that the total portfolio return may be higher, albeit with greater variance among the component stocks.
Managers of large portfolios may want to consider only regional stocks in which a sizable portfolio position can be taken. Such a criterion obviously reduces the number of regional stocks qualified for portfolio inclu- sion. Clearly, the size of the regional subset will vary among portfolio managers. For example, the Investment Company Act of 1940 constrains a mutual fund from purchasing more than 10% of the voting stock of an individual company. The 1967 median market value of Minnesota regional market stocks was $2.7 million, im- plying a maximum holding of approximately $270,000 in such a firm-a portfolio position that can be of in- terest to a $50 million fund but probably not to one
TABLE 3
Selected Dimensions of Minnesota Regional Market and Weekly OTC List: Year-End 1967
Percent of Total
Market Value of Spread (Ask Minus Common Stock Weekly Bid, as Percent Weekly Bid Price Weekly
($ Million) Minnesota List of Bid) Minnesota List Per Share ($) Minnesota List
Less than 2.5 ..... 44 24 Less than 5 ...... 11 32 Less than $5 ..... 47 30 2.5 - 4.9 .23 28 5-.9........... 28 36 5 - 9.9 .24 24 5 - 9.9 .14 28 10-14........... 24 24 10 - 19.9 .17 14 10-14.9 .7 6 15-19.9 .13 2 20-29.9 .5 14 15 -19.9 .4 2 20 and greater 18 4 30 - 39.9 .6 10 20 and greater 6 12 Not available 7 2 40 and greater 1 6 Not available 3 .. Not available 1 2
100 100 100 100 100 100
Note: Columns may not add to totals because of rounding. Computations are based on 102 stocks in the Local OTC list (Minneapolis Tribune, 12-31-67), and random sample of 50 stocks from 514 in Weekly OTC list (The Wall Street Journal, 1-2-68). The preceding numbers exclude shares of banks, insurance companies, and mutual funds on the lists. The Minnesota data are for the defined population, while the Weekly List data are sample parameters.
78 FINANCIAL ANALYSTS JOURNAL / MARCH-APRIL 1970
This content downloaded from 91.229.248.104 on Wed, 18 Jun 2014 22:49:18 PMAll use subject to JSTOR Terms and Conditions
of $500 million. Selected market attributes of regional stocks, such as those in Table 3, provide initial infor- mation to portfolio managers and analysts in defining subsets of potentially suitable stocks.
Conclusions and Implications Based on this analysis, it is probable that regional
OTC markets provide extensive sets of stocks among which discerning financial analysts and portfolio man- agers can find promising opportunities, either in indi- vidual stocks or in portfolio timing. As demonstrated in this study, there have been some very successful stocks; and at times regional shares, on average, have outper- formed the shares traded on the NYSE. If selection is average, rather than superior, the investment return will probably be less than would result from an average selection of NYSE stocks. While this effect appears to decline with longer holding periods, it exists in the con- text of a greater range of outcomes for regional shares than for NYSE shares. This greater range includes the downside risk of stocks which become valueless or illiquid. This risk is not entirely unexpected since the market is composed of stocks of smaller companies, whose shares had a median market value of $2.7 million at year-end 1967.
Portfolio managers cannot keep informed about all regional stocks. They can, however, maintain informa- tion sources in research departments and analysts of investment firms that concentrate on regional stocks. By actively seeking and screening research reports from these sources, the portfolio manager will become aware of a broader array of portfolio opportunities, which should result in more efficient portfolios in terms of risk- return parameters.
When portfolio managers focus more on regional stocks, the role of financial analysts will shift. In evalu- ating stocks listed on the NYSE and other national markets, an analyst focuses principally on characteristics of the economy and industry as they are likely to affect a firm's future operations. His evaluation usually does not include estimates concerning the probable liquidity of such nationally-traded shares. Among regional stocks, he will be expected to provide estimates of the risk of illiquidity.
Until other regional markets are investigated, it cannot be known whether the market investigated in this paper is fully representative of such markets. Since this study represents the first comprehensive empirical analysis of a regional market, its results should provide insights for investors and stimulate awareness of and interest in other regional markets. *
FOOTNOTES
1. The literature is extensive and varied. The reader is referred to the articles included in the Journ.al of
Financial and Quantitative Analysis, September 1968 (a special issue devoted to the random-walk hypothe- sis) and those included in Cootner, Paul H., editor, The Random Character of Stock Market Prices, Re- vised Edition (Cambridge, Mass.: M.I.T. Press), 1964. Also useful is the "Bibliography on Risks and Rates of Return for Common Stocks" by Pratt, Shannon P., Financial Analysts Journal, May-June 1968, pp. 151 ff. For a recent thoughtful statement of interrelationships among financial research and portfolio management see Block, Frank E., "Elements of Portfolio Construc- tion," Financial Analysts Journal, May-June 1969, pp. 123-129.
2. This figure excludes the ASE, NYSE, National Stock Exchange, and the Chicago Board of Trade. Source: Securities and Exchange Commission, 34th Annual Report, 1968, p. 62.
3. For a comprehensive statement of the development of our regional data bank, the reader is referred to "Risk- Return Relationships in Regional Securities Markets," presented by us at the Fifth Annual Conference of the Western Finance Association, August 22, 1969, and scheduled for publication in the Journal of Financial and Quantitative Analysis, January 1970.
4. This strategy differs from the one we examined in "Risk - Return Relationships in Regional Securities Markets" (Footnote 3). In that study, in order to test a segmented-markets hypothesis, the strategy was for the investor to sell regional stocks as they matured to broader markets so that he always maintained a port- folio of exclusively local stocks.
5. Fisher, Lawrence, and Lorie, James H., "Rates of Re- turn on Investments in Common Stocks," The Journal of Business, January 1964, 37, pp. 1-21. Also, by the same authors, "Rates of Return on Investments in Common Stock: The Year-by-Year Record, 1926-65," The Journal of Business, July 1968, 41, pp. 291-316.
6. We recognize the existence of some intercorrelation between many of the portfolios. For example, shares of Control Data entered the regional portfolio in 1959 and, under the buy-and-hold assumption, remained in the portfolio through 1967. However, Control Data shares were listed on the NYSE in 1963. Thus the NYSE returns from 1964 through 1965 also reflect the performance of Control Data shares. Since shares of the same company can thus be represented in both markets for some periods greater than one year, the results are not completely independent; and this pre- cludes application of some statistical techniques to comparisons of longer holding periods.
7. Fisher, Lawrence, "Outcomes for 'Random' Invest- ments in Common Stocks Listed on the New York Stock Exchange," The Journal of Business, April 1965, 38, p. 154.
8. Reilly, Frank K., "A First Look at O-T-C Volume," Financial Analysts Journal, January-February 1969, pp. 124-128.
9. These figures exclude shares of banks, insurance com- panies, and mutual funds. Minneapolis Tribune, De- cember 31, 1967, p. 6C. The Wall Street Journal, January 2, 1968, p. 23.
10. Price spreads may be seen as a proxy measure of marketability. See, for example, Sauvain, Harry, Investment Management, Third Edition, (Englewood Cliffs, N. J.: Prentice-Hall, Inc.), 1967, pp. 226-228.
FINANCIAL ANALYSTS JOURNAL / MARCH-APRIL 1970 79
This content downloaded from 91.229.248.104 on Wed, 18 Jun 2014 22:49:18 PMAll use subject to JSTOR Terms and Conditions