opportunities and challenges for a sustainable energy future
TRANSCRIPT
1US Department of Energy, 1000 Independence Avenue SW, Washington DC 20585, USA.
The industrial revolution began in the mid-eighteenth century, and provided humans with capabilities well beyond animal and human power. Steam-powered trains and ships, and then inter-
nal combustion engines transformed how people moved and produced goods around the world. Electrification and related technologies contin-ued the revolution in the nineteenth and twentieth centuries. Today, a growing number of people keep their homes warm in the winter, cool in the summer and lit at night. They go to the local market in cars with the power of over a hundred horses and fly across continents in wide-body aeroplanes with the power of a hundred thousand horses. This power is derived largely from our ability to exploit fossil sources of energy. How-ever, in the transition from human and horse power to horsepower, the carbon emissions that result from the equivalent of over a billion horses working continuously have created significant climate-change risks.
At the beginning of the industrial revolution, the population of the world was 700 million. Today, the population is 7 billion and is estimated to grow to 9 billion by 2050, and about 10 billion by 2100 (ref. 1). Most of this population growth will be in Asia and Africa, where rapidly rising economic growth will place additional demands on energy supply. The International Energy Agency (IEA) based in Paris has projected that the world’s energy demand will increase from about 12 billion tonne oil equivalents (t.o.e.) in 2009 to either 18 billion t.o.e. or 17 billion t.o.e. by 2035 under their ‘current policies’ or ‘new policies’ scenarios, respectively2. Carbon-dioxide emissions are expected to increase from 29 gigatonnes per year to 43 Gt yr-1 or 36 Gt yr-1 under the current and new policies, respectively. The actual path we follow will depend on how efficiently and effectively we use existing and new sources of energy.
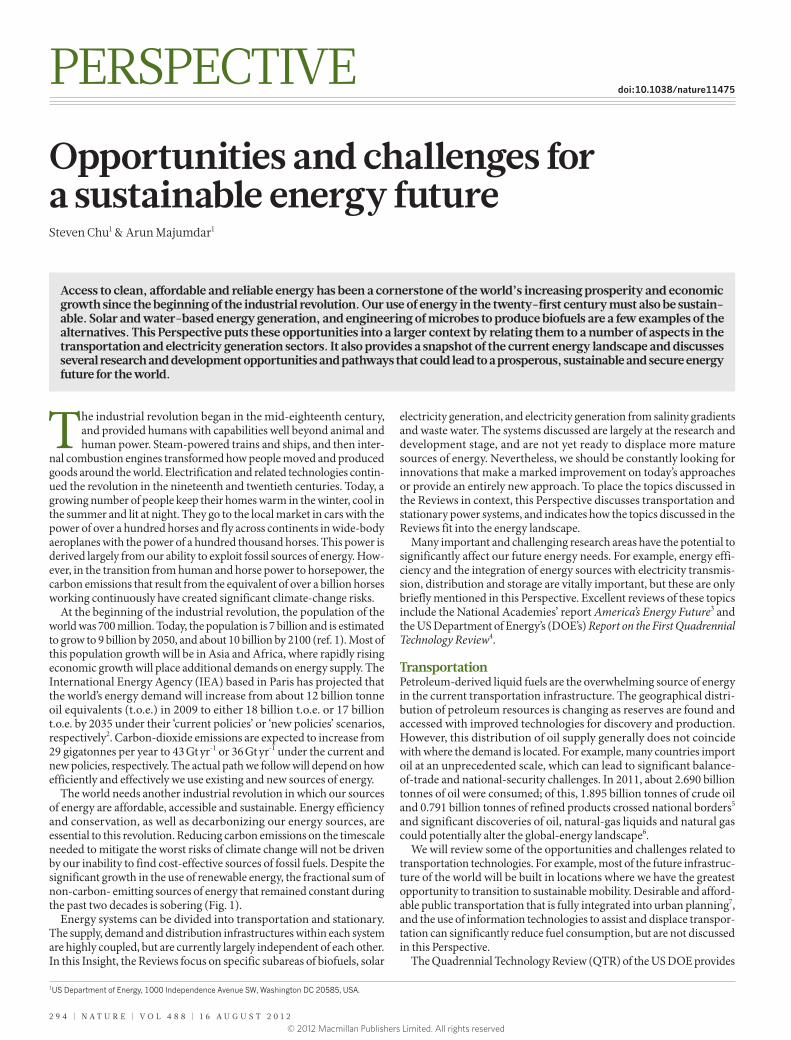
The world needs another industrial revolution in which our sources of energy are affordable, accessible and sustainable. Energy efficiency and conservation, as well as decarbonizing our energy sources, are essential to this revolution. Reducing carbon emissions on the timescale needed to mitigate the worst risks of climate change will not be driven by our inability to find cost-effective sources of fossil fuels. Despite the significant growth in the use of renewable energy, the fractional sum of non-carbon- emitting sources of energy that remained constant during the past two decades is sobering (Fig. 1).
Energy systems can be divided into transportation and stationary. The supply, demand and distribution infrastructures within each system are highly coupled, but are currently largely independent of each other. In this Insight, the Reviews focus on specific subareas of biofuels, solar
electricity generation, and electricity generation from salinity gradients and waste water. The systems discussed are largely at the research and development stage, and are not yet ready to displace more mature sources of energy. Nevertheless, we should be constantly looking for innovations that make a marked improvement on today’s approaches or provide an entirely new approach. To place the topics discussed in the Reviews in context, this Perspective discusses transportation and stationary power systems, and indicates how the topics discussed in the Reviews fit into the energy landscape.
Many important and challenging research areas have the potential to significantly affect our future energy needs. For example, energy effi-ciency and the integration of energy sources with electricity transmis-sion, distribution and storage are vitally important, but these are only briefly mentioned in this Perspective. Excellent reviews of these topics include the National Academies’ report America’s Energy Future3 and the US Department of Energy’s (DOE’s) Report on the First Quadrennial Technology Review4.
TransportationPetroleum-derived liquid fuels are the overwhelming source of energy in the current transportation infrastructure. The geographical distri-bution of petroleum resources is changing as reserves are found and accessed with improved technologies for discovery and production. However, this distribution of oil supply generally does not coincide with where the demand is located. For example, many countries import oil at an unprecedented scale, which can lead to significant balance-of-trade and national-security challenges. In 2011, about 2.690 billion tonnes of oil were consumed; of this, 1.895 billion tonnes of crude oil and 0.791 billion tonnes of refined products crossed national borders5 and significant discoveries of oil, natural-gas liquids and natural gas could potentially alter the global-energy landscape6.
We will review some of the opportunities and challenges related to transportation technologies. For example, most of the future infrastruc-ture of the world will be built in locations where we have the greatest opportunity to transition to sustainable mobility. Desirable and afford-able public transportation that is fully integrated into urban planning7, and the use of information technologies to assist and displace transpor-tation can significantly reduce fuel consumption, but are not discussed in this Perspective.
The Quadrennial Technology Review (QTR) of the US DOE provides
Access to clean, affordable and reliable energy has been a cornerstone of the world’s increasing prosperity and economic growth since the beginning of the industrial revolution. Our use of energy in the twenty-first century must also be sustain-able. Solar and water-based energy generation, and engineering of microbes to produce biofuels are a few examples of the alternatives. This Perspective puts these opportunities into a larger context by relating them to a number of aspects in the transportation and electricity generation sectors. It also provides a snapshot of the current energy landscape and discusses several research and development opportunities and pathways that could lead to a prosperous, sustainable and secure energy future for the world.
Opportunities and challenges for a sustainable energy futureSteven Chu1 & Arun Majumdar1
2 9 4 | N A T U R E | V O L 4 8 8 | 1 6 A U G U S T 2 0 1 2
PERSPECTIVEdoi:10.1038/nature11475
© 2012 Macmillan Publishers Limited. All rights reserved
a broad overview of state-of-the-art technologies and opportunities for future research8. Improvements in energy efficiency of vehicles can greatly reduce oil dependency. These improvements include increased use of light-weight materials, such as advanced ultra-high tensile strength steels, aluminium and magnesium alloys, polymers, and carbon-fibre reinforced composite materials9. The integration of lighter weight materials is especially important if more complex parts can be manufactured as a single unit. The potential for reducing the weight of vehicles has already been shown, and in the next 10–20 years, an additional 20–40% reduction in overall weight, without sacrificing safety, seems to be possible10. For every 10% weight reduction of the vehicle, an improvement in fuel consumption of 6–8% is expected11.
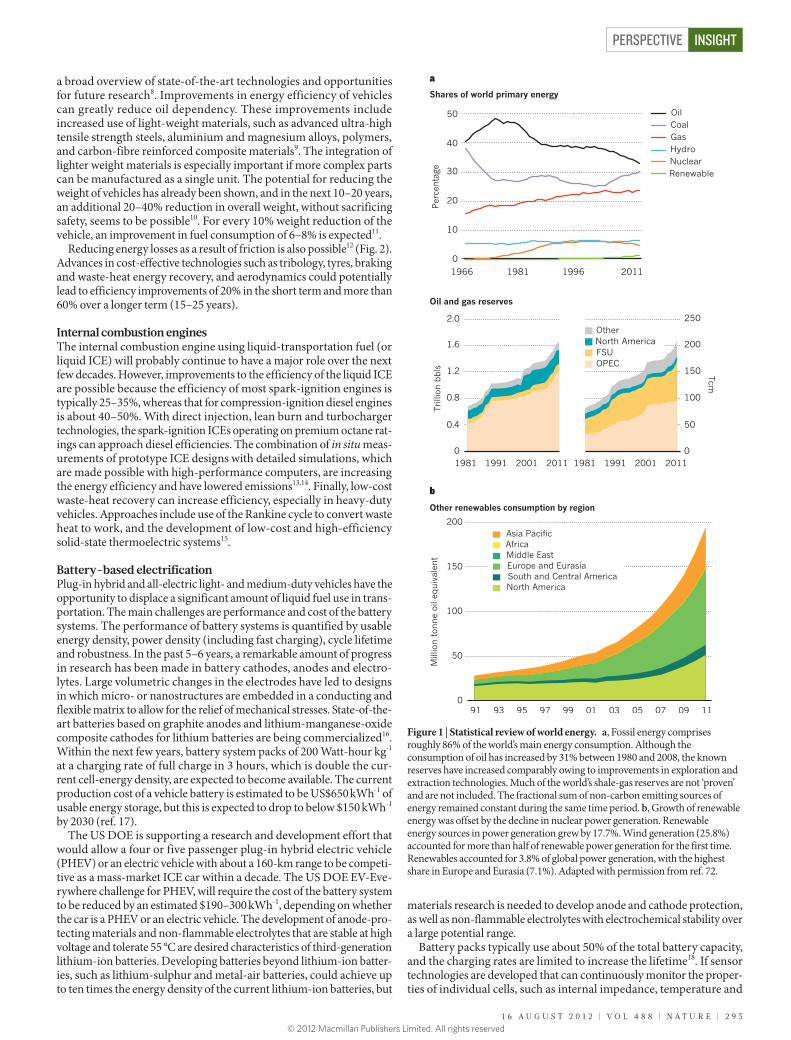
Reducing energy losses as a result of friction is also possible12 (Fig. 2). Advances in cost-effective technologies such as tribology, tyres, braking and waste-heat energy recovery, and aerodynamics could potentially lead to efficiency improvements of 20% in the short term and more than 60% over a longer term (15–25 years).
Internal combustion enginesThe internal combustion engine using liquid-transportation fuel (or liquid ICE) will probably continue to have a major role over the next few decades. However, improvements to the efficiency of the liquid ICE are possible because the efficiency of most spark-ignition engines is typically 25–35%, whereas that for compression-ignition diesel engines is about 40–50%. With direct injection, lean burn and turbocharger technologies, the spark-ignition ICEs operating on premium octane rat-ings can approach diesel efficiencies. The combination of in situ meas-urements of prototype ICE designs with detailed simulations, which are made possible with high-performance computers, are increasing the energy efficiency and have lowered emissions13,14. Finally, low-cost waste-heat recovery can increase efficiency, especially in heavy-duty vehicles. Approaches include use of the Rankine cycle to convert waste heat to work, and the development of low-cost and high-efficiency solid-state thermoelectric systems15.
Battery-based electrificationPlug-in hybrid and all-electric light- and medium-duty vehicles have the opportunity to displace a significant amount of liquid fuel use in trans-portation. The main challenges are performance and cost of the battery systems. The performance of battery systems is quantified by usable energy density, power density (including fast charging), cycle lifetime and robustness. In the past 5–6 years, a remarkable amount of progress in research has been made in battery cathodes, anodes and electro-lytes. Large volumetric changes in the electrodes have led to designs in which micro- or nanostructures are embedded in a conducting and flexible matrix to allow for the relief of mechanical stresses. State-of-the-art batteries based on graphite anodes and lithium-manganese-oxide composite cathodes for lithium batteries are being commercialized16. Within the next few years, battery system packs of 200 Watt-hour kg-1 at a charging rate of full charge in 3 hours, which is double the cur-rent cell-energy density, are expected to become available. The current production cost of a vehicle battery is estimated to be US$650 kWh-1 of usable energy storage, but this is expected to drop to below $150 kWh-1 by 2030 (ref. 17).
The US DOE is supporting a research and development effort that would allow a four or five passenger plug-in hybrid electric vehicle (PHEV) or an electric vehicle with about a 160-km range to be competi-tive as a mass-market ICE car within a decade. The US DOE EV-Eve-rywhere challenge for PHEV, will require the cost of the battery system to be reduced by an estimated $190–300 kWh-1, depending on whether the car is a PHEV or an electric vehicle. The development of anode-pro-tecting materials and non-flammable electrolytes that are stable at high voltage and tolerate 55 °C are desired characteristics of third-generation lithium-ion batteries. Developing batteries beyond lithium-ion batter-ies, such as lithium-sulphur and metal-air batteries, could achieve up to ten times the energy density of the current lithium-ion batteries, but
materials research is needed to develop anode and cathode protection, as well as non-flammable electrolytes with electrochemical stability over a large potential range.
Battery packs typically use about 50% of the total battery capacity, and the charging rates are limited to increase the lifetime18. If sensor technologies are developed that can continuously monitor the proper-ties of individual cells, such as internal impedance, temperature and
Figure 1 | Statistical review of world energy. a, Fossil energy comprises roughly 86% of the world’s main energy consumption. Although the consumption of oil has increased by 31% between 1980 and 2008, the known reserves have increased comparably owing to improvements in exploration and extraction technologies. Much of the world’s shale-gas reserves are not ‘proven’ and are not included. The fractional sum of non-carbon emitting sources of energy remained constant during the same time period. b, Growth of renewable energy was offset by the decline in nuclear power generation. Renewable energy sources in power generation grew by 17.7%. Wind generation (25.8%) accounted for more than half of renewable power generation for the first time. Renewables accounted for 3.8% of global power generation, with the highest share in Europe and Eurasia (7.1%). Adapted with permission from ref. 72.
Trill
ion
bbls Tcm
Oil and gas reserves
1981 1991 2001 2011 1981 1991 2001 20110
0.8
0.4
1.2
1.6
2.0
0
50
100
150
200
250OtherNorth AmericaFSUOPEC
0
10
20
30
40
50
1966
Per
cent
age
1981
Shares of world primary energy
1996 2011
OilCoalGasHydroNuclearRenewable
a
Mill
ion t
onne
oil e
quiv
alen
t
091 9593 9997 01 03 05 07 09 11
50
100
150
200Asia Paci�cAfricaMiddle EastEurope and EurasiaSouth and Central AmericaNorth America
Other renewables consumption by region
b
1 6 A U G U S T 2 0 1 2 | V O L 4 8 8 | N A T U R E | 2 9 5
PERSPECTIVE INSIGHT
© 2012 Macmillan Publishers Limited. All rights reserved
state of charge, the lifetime and useful capacity could be improved. Standardized battery cells that are designed to be integrated with the original equipment manufacturer’s thermal management systems could also reduce cost19.
Fuel-cell-based electrification The high efficiency of fuel-cell-powered electric vehicles makes this form of electrification a potentially viable option for the future. Invest-ment in this technology is driven by the potential of extended range and faster fuelling times of moderately low-priced cars. Fuel-cell cost has been lowered and their lifetime increased20, but further gains are needed. Platinum-group catalyst loading has been reduced fivefold since 2005; however, further reductions are needed4,21, or these catalysts need to be replaced with less costly alternatives. Costs can also be lowered and performance improved through robust higher-conductivity and higher-temperature membranes, improvements in balance-of-plant components, such as humidifiers and compressors, as well as thermo-fluid design and control.
There are inherent volumetric energy density issues for hydrogen-gas storage. To achieve a range of 480 km, fuel-cell electric vehicles need to store about 4–7 kg of hydrogen4,22. A carbon-fibre-composite tank pressurized to 700 bar is the best current option for personal vehicles, but this costs23 about $3,000. Research is under way to develop materials and manufacturing processes to reduce the cost of composite tanks. In parallel, researchers are searching for lower-pressure storage assisted by high-surface area materials that could physisorb or weakly chemisorb hydrogen and still maintain fast-fuelling times24,25.
The supply infrastructure and a low-carbon source of hydrogen are also a challenge. The technology advances in shale-gas production, and the possibility of large reserves in Europe and Asia, in addition to the considerable reserves in North America, could have a significant affect on the transportation sector. In addition to the direct use of natural gas as a fuel (see later), low-cost natural gas could spur the deployment of local reforming or hydrogen filling stations for near-term hydrogen production. Alternatively, commercial reforming plants, such as hybrid power plants that produce hydrogen as well as CO2, for enhanced oil recovery located near oil-field and refinery sites can serve as an eco-nomical source of hydrogen4,26. In regions that are close to a large com-mercial production plant, delivery to local filling stations can be made through high-pressure gaseous tube trailers, but in the long run, a cost-competitive method to produce hydrogen with considerably lower net carbon emissions is needed.
Natural gas for transportationThe projected low cost of natural gas in the United States in the next few decades compared with that of petrol is expected to lead to wider adoption of natural-gas vehicles. Displacing diesel fuel with liquefied
natural gas (LNG) for class 8 tractor-trailer trucks commonly used on long routes in the United States is already economically viable because a typical long-haul truck uses about 90,000 litres of fuel per year (about $80,000 per year in fuel costs, today). The incremental purchase price of LNG trucks can be up to $100,000 per truck for cryogenic tanks and related upgrades, as a result of low-volume market conditions. Even so, the payback period is currently 3–4 years on a net-present-value basis using a 7% discount rate, and would drop considerably with even modest increases in production volumes27. Developing a fuelling infrastructure for LNG long-haul trucks would require fuelling stations about every 240–320 km for a truck range of 800–960 km. Commer-cial viability is reinforced by plans in the private sector to make the required investments in infrastructure. LNG-powered freight trains are also being considered.
Compressed natural gas (CNG) has been used for buses, delivery trucks and light-duty vehicles. To make vehicles using CNG economi-cally viable without subsidies, low-cost CNG storage technologies are needed. In the United States, light-duty vehicles account for 75% of on-road fuel consumption. There are roughly 160,000 gasoline (petrol) service stations in the United States28; creating a similar nationwide infrastructure for CNG vehicles would be prohibitively expensive (more than $100 billion). However, about 60 million homes in the United States have natural-gas delivery. Economic viability for CNG cars and refuelling systems can be achieved if the payback period for the addi-tional system-level cost is typically 5 years or less; at present it is about 10–15 years for a vehicle with average mileage. For vehicles with high annual mileage and for vehicles with low kilometres per litre, natural-gas vehicles can have less than a 5-year payback, even today. Research into fibre-matrix composites for high-pressure light-weight tank materials is needed, as well as into natural-gas sorbents for low-pressure storage. Although seldom discussed, multifuel ICEs can be designed to operate on CNG for 30–60 km (the CNG–ICE hybrid equivalent of a PHEV) and then switch to petrol. Similar to a PHEV, a CNG–petrol–ICE vehicle could compensate for the partial coverage of CNG fuelling stations.
Natural gas can also be converted into liquid fuels using either the Fischer–Tropsch or the methanol process. The capital cost per barrel of liquid fuel reduces with increasing capacity of a Fischer–Tropsch plant according to scaling laws. However, with increasing capacity, capital costs are suggested to deviate and are higher than scaling law predictions, which increases the financial risk for gas-to-liquid plants. Research is needed to find alternative approaches for exciting the car-bon–hydrogen bond and synthesizing carbon–carbon bonds. Biologi-cal approaches that use organisms, such as methanotrophs, that can metabolize natural gas and produce long-chain hydrocarbons seem worth exploring. Even if this approach is successful at laboratory scales, it will need to be scalable to large-volume production. Large quanti-ties of methanol are already produced from natural gas for industrial
Fuelenergy100%
Exhaust33%
Cooling29%
Mechanicalpower38%
Frictionlosses33%
Air drag 5% Air drag 5%
Engine11.5%
Transmission 5%
Brakes 5%
Rollingresist 11.5%
Energy used to
move the car 21.5%
Thermodynamiclosses
Totalenergylosses
Figure 2 | Vehicle energy losses. Of the energy that fuel provides to vehicles a substantial proportion is lost. A breakdown of the average losses of internal-combustion-engine cars (fleet make up 70% petrol and 30% diesel) is shown. Heat lost constitutes 30–37% of the energy as a result of exhaust gases with lower energy content and convection. The other losses come from heat dissipation (25–33%), mechanical losses (33–40%), air drag (3–12%), rolling friction (12–45%) and brake losses (about 5%). These losses mean only about 21.5% of the energy is used to move the car. Adapted with permission from ref. 12.
2 9 6 | N A T U R E | V O L 4 8 8 | 1 6 A U G U S T 2 0 1 2
PERSPECTIVEINSIGHT
© 2012 Macmillan Publishers Limited. All rights reserved
purposes at costs that are roughly equivalent to petrol. Methanol could be used in a petrol–alcohol blend, much like ethanol in the United States. However, pure or high-percentage methanol-based transporta-tion could face distribution-infrastructure challenges.
Alternative liquid-transportation fuelsLiquid fuels derived from oil became the main form of energy for transportation largely because of their high energy densities. Associ-ated with their high energy content, the energy transfer rate during vehicle refuelling is about 6 MW; in contrast, electrical charging will be tens of kilowatts. Apart from inherent limitations in battery chemis-tries, there are practical limits to the size of the electrical connector that could accommodate megawatt-scale power transfer. However, a search for alternatives to oil for transportation energy is required to deal with the growing concerns over the rising and volatile price of oil, the vul-nerability to supply disruptions, and balance-of-trade issues. Biofuels, particularly those produced domestically at competitive prices, would strengthen a nation’s energy and economic security.
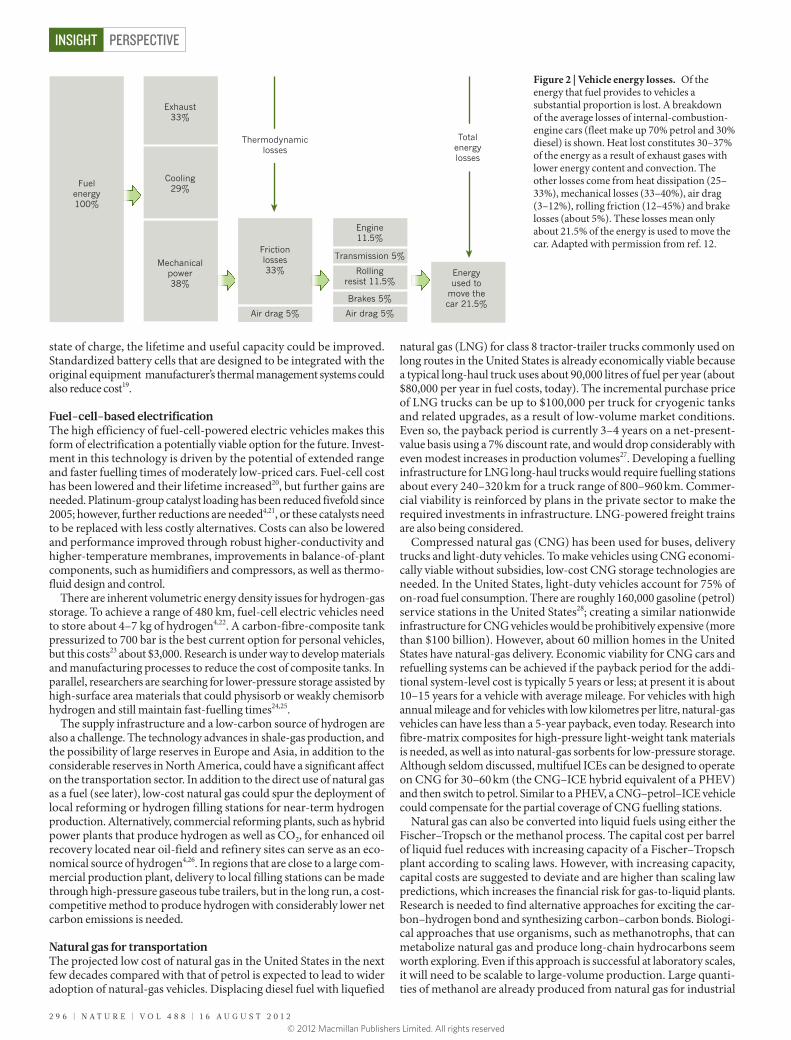
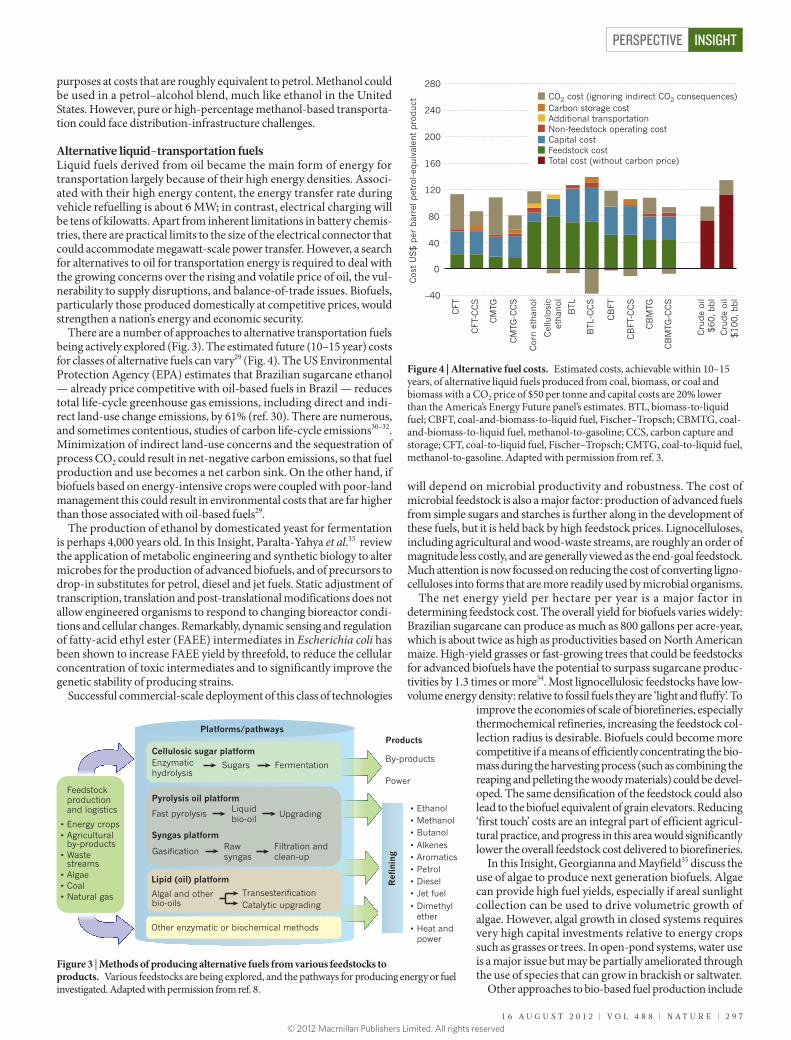
There are a number of approaches to alternative transportation fuels being actively explored (Fig. 3). The estimated future (10–15 year) costs for classes of alternative fuels can vary29 (Fig. 4). The US Environmental Protection Agency (EPA) estimates that Brazilian sugarcane ethanol — already price competitive with oil-based fuels in Brazil — reduces total life-cycle greenhouse gas emissions, including direct and indi-rect land-use change emissions, by 61% (ref. 30). There are numerous, and sometimes contentious, studies of carbon life-cycle emissions30–32. Minimization of indirect land-use concerns and the sequestration of process CO2 could result in net-negative carbon emissions, so that fuel production and use becomes a net carbon sink. On the other hand, if biofuels based on energy-intensive crops were coupled with poor-land management this could result in environmental costs that are far higher than those associated with oil-based fuels29.
The production of ethanol by domesticated yeast for fermentation is perhaps 4,000 years old. In this Insight, Paralta-Yahya et al.33 review the application of metabolic engineering and synthetic biology to alter microbes for the production of advanced biofuels, and of precursors to drop-in substitutes for petrol, diesel and jet fuels. Static adjustment of transcription, translation and post-translational modifications does not allow engineered organisms to respond to changing bioreactor condi-tions and cellular changes. Remarkably, dynamic sensing and regulation of fatty-acid ethyl ester (FAEE) intermediates in Escherichia coli has been shown to increase FAEE yield by threefold, to reduce the cellular concentration of toxic intermediates and to significantly improve the genetic stability of producing strains.
Successful commercial-scale deployment of this class of technologies
will depend on microbial productivity and robustness. The cost of microbial feedstock is also a major factor: production of advanced fuels from simple sugars and starches is further along in the development of these fuels, but it is held back by high feedstock prices. Lignocelluloses, including agricultural and wood-waste streams, are roughly an order of magnitude less costly, and are generally viewed as the end-goal feedstock. Much attention is now focussed on reducing the cost of converting ligno-celluloses into forms that are more readily used by microbial organisms.
The net energy yield per hectare per year is a major factor in determining feedstock cost. The overall yield for biofuels varies widely: Brazilian sugarcane can produce as much as 800 gallons per acre-year, which is about twice as high as productivities based on North American maize. High-yield grasses or fast-growing trees that could be feedstocks for advanced biofuels have the potential to surpass sugarcane produc-tivities by 1.3 times or more34. Most lignocellulosic feedstocks have low-volume energy density: relative to fossil fuels they are ‘light and fluffy’. To
improve the economies of scale of biorefineries, especially thermochemical refineries, increasing the feedstock col-lection radius is desirable. Biofuels could become more competitive if a means of efficiently concentrating the bio-mass during the harvesting process (such as combining the reaping and pelleting the woody materials) could be devel-oped. The same densification of the feedstock could also lead to the biofuel equivalent of grain elevators. Reducing ‘first touch’ costs are an integral part of efficient agricul-tural practice, and progress in this area would significantly lower the overall feedstock cost delivered to biorefineries.
In this Insight, Georgianna and Mayfield35 discuss the use of algae to produce next generation biofuels. Algae can provide high fuel yields, especially if areal sunlight collection can be used to drive volumetric growth of algae. However, algal growth in closed systems requires very high capital investments relative to energy crops such as grasses or trees. In open-pond systems, water use is a major issue but may be partially ameliorated through the use of species that can grow in brackish or saltwater.
Other approaches to bio-based fuel production include
Platforms/pathways
Feedstock production and logistics
• Energy crops • Agricultural
by-products • Waste
streams • Algae • Coal • Natural gas
• Ethanol • Methanol
Re�
ning
• Butanol • Alkenes• Aromatics • Petrol• Diesel • Jet fuel • Dimethyl
ether • Heat and
power
By-products
Power
Pyrolysis oil platform
Syngas platform
Liquidbio-oil
Enzymatichydrolysis
Sugars Fermentation
Cellulosic sugar platform Products
Fast pyrolysis
Gasi�cation Rawsyngas
Filtration andclean-up
Upgrading
Algal and other bio-oils
Transesteri�cationCatalytic upgrading
Lipid (oil) platform
Other enzymatic or biochemical methods
Figure 3 | Methods of producing alternative fuels from various feedstocks to products. Various feedstocks are being explored, and the pathways for producing energy or fuel investigated. Adapted with permission from ref. 8.
CO2 cost (ignoring indirect CO2 consequences)Carbon storage cost
280
240
200
160
Cos
t U
S$ p
er b
arre
l pet
rol-eq
uiv
alen
t pro
duct
CFT
CFT
-CC
S
CM
TG
CM
TG-C
CS
Cor
n e
than
ol
Cel
lulo
sic
ethan
ol
BTL
BTL
-CC
S
CB
FT
CB
FT-C
CS
CB
MTG
CB
MTG
-CC
S
Cru
de
oil
$60, b
bl
Cru
de
oil
$100, b
bl
120
80
40
0
–40
Additional transportationNon-feedstock operating costCapital costFeedstock costTotal cost (without carbon price)
Figure 4 | Alternative fuel costs. Estimated costs, achievable within 10–15 years, of alternative liquid fuels produced from coal, biomass, or coal and biomass with a CO2 price of $50 per tonne and capital costs are 20% lower than the America’s Energy Future panel’s estimates. BTL, biomass-to-liquid fuel; CBFT, coal-and-biomass-to-liquid fuel, Fischer–Tropsch; CBMTG, coal-and-biomass-to-liquid fuel, methanol-to-gasoline; CCS, carbon capture and storage; CFT, coal-to-liquid fuel, Fischer–Tropsch; CMTG, coal-to-liquid fuel, methanol-to-gasoline. Adapted with permission from ref. 3.
1 6 A U G U S T 2 0 1 2 | V O L 4 8 8 | N A T U R E | 2 9 7
PERSPECTIVE INSIGHT
© 2012 Macmillan Publishers Limited. All rights reserved
the manipulation of photosynthetic bacteria to produce biofuels, diverting high-energy Calvin-cycle intermediates upstream of glucose — for exam-ple energy-dense terpene (a biofuel precursor) production in trees or microbes — or developing alternatives to C3 and C4 carbon fixation.
Biological enzymes can synthesize carbon–carbon bonds with an unparalleled high specificity, but photosynthesis may not be the only approach to converting sunlight into hydrocarbon fuels36. Several non-photosynthetic alternatives are under investigation that could poten-tially overcome many of the limitations of photosynthesis. To appreciate the potential of such approaches, the energy conversion process can be divided into three steps. First is to identify what reducing equivalents, other than solar photons captured through photosystems I and II, can be accepted by various microorganisms. Several organisms are known to be capable of growth on hydrogen sulphide, hydrogen, electrons, ammonia and reduced ions such as iron (II). Second is to investigate opportunities to fix CO2 using pathways other than those used in C3 or C4 plants. Potential systems may include the reverse tricarboxylic-acid cycle (often called the reverse Krebs cycle), the Woods–Ljungdahl cycle used by acetogens, the hydroxypropionate–hydroxybutyrate cycle or newly designed biochemical pathways. The final step is to determine whether we can metabolically engineer direct carbon products into a molecule such as acetyl-CoA, which is a precursor for many energy-dense fuels. These three steps can be engineered into autotrophic organ-isms, an approach that is now being supported by a US DOE Advanced Research Projects Agency-Energy programme called Electrofuels37.
Finally, researchers are investigating highly efficient non-biological energy-conversion approaches that generate fuel from sunlight by the oxidation of water into hydrogen and oxygen and reduction of CO2 to fuel. The Joint Center for Artificial Photosynthesis, a US DOE funded Energy Innovation Research Center, was established to identify Earth-abundant, robust light absorbers with optimal bandgaps to harvest sun-light most effectively and efficiently, to accelerate the rate of catalyst discovery for solar energy-to-fuel conversion reactions and to provide system integration and scale-up so that laboratory experiments can quickly transition into prototypes for commercial development.
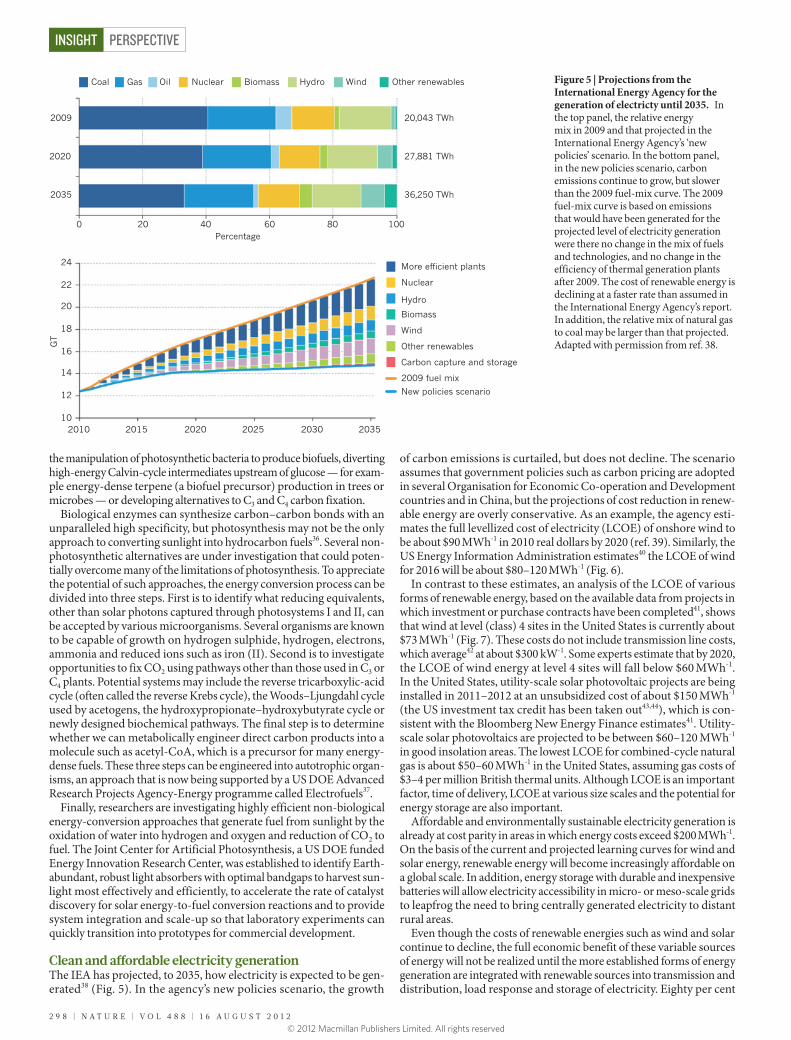
Clean and affordable electricity generationThe IEA has projected, to 2035, how electricity is expected to be gen-erated38 (Fig. 5). In the agency’s new policies scenario, the growth
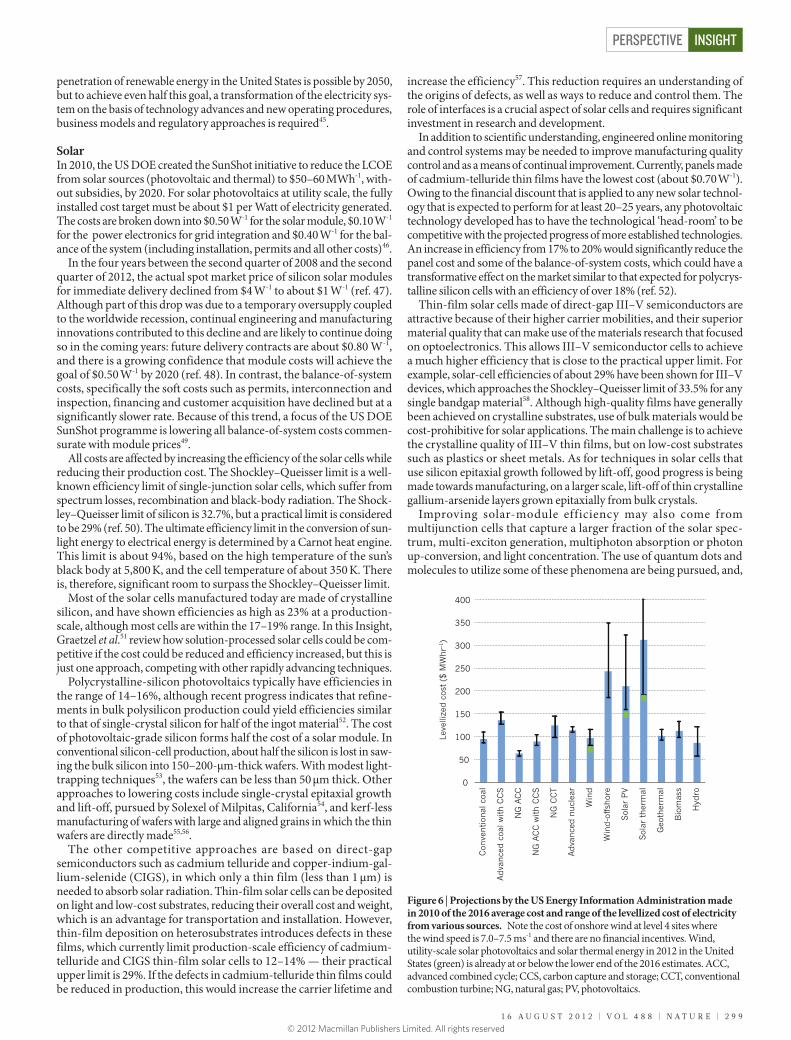
of carbon emissions is curtailed, but does not decline. The scenario assumes that government policies such as carbon pricing are adopted in several Organisation for Economic Co-operation and Development countries and in China, but the projections of cost reduction in renew-able energy are overly conservative. As an example, the agency esti-mates the full levellized cost of electricity (LCOE) of onshore wind to be about $90 MWh-1 in 2010 real dollars by 2020 (ref. 39). Similarly, the US Energy Information Administration estimates40 the LCOE of wind for 2016 will be about $80–120 MWh-1 (Fig. 6).
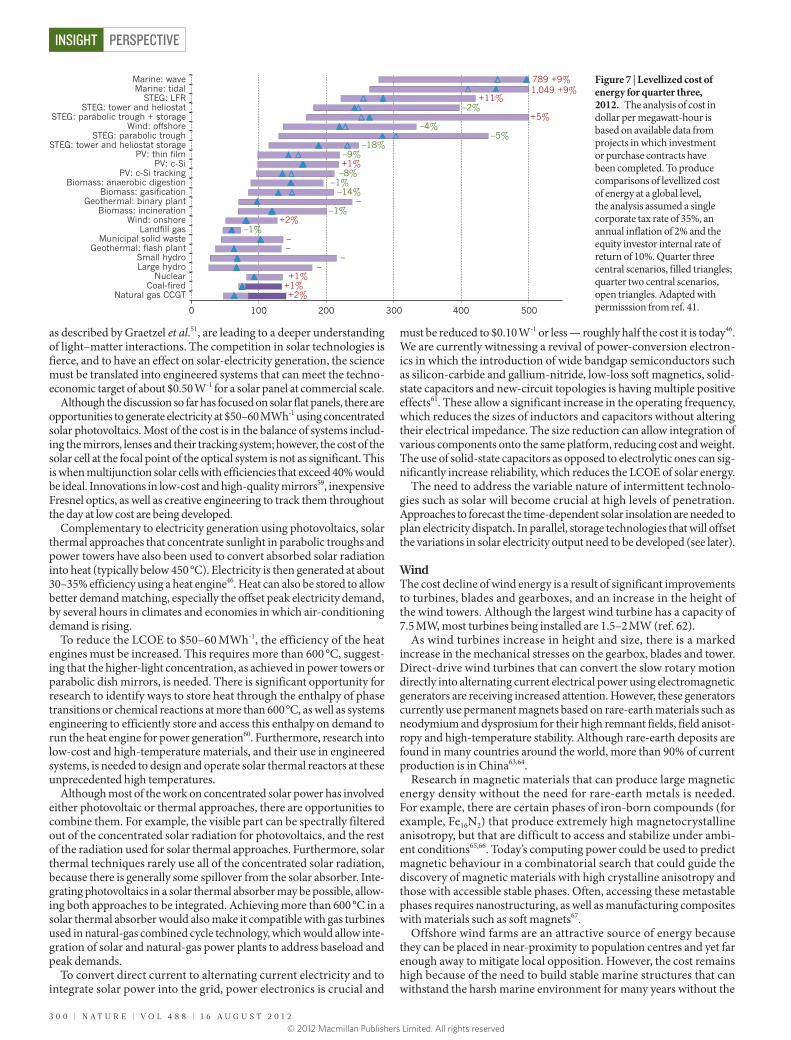
In contrast to these estimates, an analysis of the LCOE of various forms of renewable energy, based on the available data from projects in which investment or purchase contracts have been completed41, shows that wind at level (class) 4 sites in the United States is currently about $73 MWh-1 (Fig. 7). These costs do not include transmission line costs, which average42 at about $300 kW-1. Some experts estimate that by 2020, the LCOE of wind energy at level 4 sites will fall below $60 MWh-1. In the United States, utility-scale solar photovoltaic projects are being installed in 2011–2012 at an unsubsidized cost of about $150 MWh-1 (the US investment tax credit has been taken out43,44), which is con-sistent with the Bloomberg New Energy Finance estimates41. Utility-scale solar photovoltaics are projected to be between $60–120 MWh-1 in good insolation areas. The lowest LCOE for combined-cycle natural gas is about $50–60 MWh-1 in the United States, assuming gas costs of $3–4 per million British thermal units. Although LCOE is an important factor, time of delivery, LCOE at various size scales and the potential for energy storage are also important.
Affordable and environmentally sustainable electricity generation is already at cost parity in areas in which energy costs exceed $200 MWh-1. On the basis of the current and projected learning curves for wind and solar energy, renewable energy will become increasingly affordable on a global scale. In addition, energy storage with durable and inexpensive batteries will allow electricity accessibility in micro- or meso-scale grids to leapfrog the need to bring centrally generated electricity to distant rural areas.
Even though the costs of renewable energies such as wind and solar continue to decline, the full economic benefit of these variable sources of energy will not be realized until the more established forms of energy generation are integrated with renewable sources into transmission and distribution, load response and storage of electricity. Eighty per cent
24
0 20 40Percentage
60 80 100
20,043 TWh
27,881 TWh
36,250 TWh
2009
2020
2035
22
20
18
16
14
12
102010 2015
GT
2020 2025 2030 2035
More e�cient plants
Coal Gas Oil Nuclear Biomass Hydro Wind Other renewables
Nuclear
Hydro
Biomass
Wind
Other renewables
Carbon capture and storage
2009 fuel mix
New policies scenario
Figure 5 | Projections from the International Energy Agency for the generation of electricty until 2035. In the top panel, the relative energy mix in 2009 and that projected in the International Energy Agency’s ‘new policies’ scenario. In the bottom panel, in the new policies scenario, carbon emissions continue to grow, but slower than the 2009 fuel-mix curve. The 2009 fuel-mix curve is based on emissions that would have been generated for the projected level of electricity generation were there no change in the mix of fuels and technologies, and no change in the efficiency of thermal generation plants after 2009. The cost of renewable energy is declining at a faster rate than assumed in the International Energy Agency’s report. In addition, the relative mix of natural gas to coal may be larger than that projected. Adapted with permission from ref. 38.
2 9 8 | N A T U R E | V O L 4 8 8 | 1 6 A U G U S T 2 0 1 2
PERSPECTIVEINSIGHT
© 2012 Macmillan Publishers Limited. All rights reserved
penetration of renewable energy in the United States is possible by 2050, but to achieve even half this goal, a transformation of the electricity sys-tem on the basis of technology advances and new operating procedures, business models and regulatory approaches is required45.
SolarIn 2010, the US DOE created the SunShot initiative to reduce the LCOE from solar sources (photovoltaic and thermal) to $50–60 MWh-1, with-out subsidies, by 2020. For solar photovoltaics at utility scale, the fully installed cost target must be about $1 per Watt of electricity generated. The costs are broken down into $0.50 W-1 for the solar module, $0.10 W-1
for the power electronics for grid integration and $0.40 W-1 for the bal-ance of the system (including installation, permits and all other costs)46.
In the four years between the second quarter of 2008 and the second quarter of 2012, the actual spot market price of silicon solar modules for immediate delivery declined from $4 W-1 to about $1 W-1 (ref. 47). Although part of this drop was due to a temporary oversupply coupled to the worldwide recession, continual engineering and manufacturing innovations contributed to this decline and are likely to continue doing so in the coming years: future delivery contracts are about $0.80 W-1, and there is a growing confidence that module costs will achieve the goal of $0.50 W-1 by 2020 (ref. 48). In contrast, the balance-of-system costs, specifically the soft costs such as permits, interconnection and inspection, financing and customer acquisition have declined but at a significantly slower rate. Because of this trend, a focus of the US DOE SunShot programme is lowering all balance-of-system costs commen-surate with module prices49.
All costs are affected by increasing the efficiency of the solar cells while reducing their production cost. The Shockley–Queisser limit is a well-known efficiency limit of single-junction solar cells, which suffer from spectrum losses, recombination and black-body radiation. The Shock-ley–Queisser limit of silicon is 32.7%, but a practical limit is considered to be 29% (ref. 50). The ultimate efficiency limit in the conversion of sun-light energy to electrical energy is determined by a Carnot heat engine. This limit is about 94%, based on the high temperature of the sun’s black body at 5,800 K, and the cell temperature of about 350 K. There is, therefore, significant room to surpass the Shockley–Queisser limit.
Most of the solar cells manufactured today are made of crystalline silicon, and have shown efficiencies as high as 23% at a production-scale, although most cells are within the 17–19% range. In this Insight, Graetzel et al.51 review how solution-processed solar cells could be com-petitive if the cost could be reduced and efficiency increased, but this is just one approach, competing with other rapidly advancing techniques.
Polycrystalline-silicon photovoltaics typically have efficiencies in the range of 14–16%, although recent progress indicates that refine-ments in bulk polysilicon production could yield efficiencies similar to that of single-crystal silicon for half of the ingot material52. The cost of photovoltaic-grade silicon forms half the cost of a solar module. In conventional silicon-cell production, about half the silicon is lost in saw-ing the bulk silicon into 150–200-μm-thick wafers. With modest light-trapping techniques53, the wafers can be less than 50 μm thick. Other approaches to lowering costs include single-crystal epitaxial growth and lift-off, pursued by Solexel of Milpitas, California54, and kerf-less manufacturing of wafers with large and aligned grains in which the thin wafers are directly made55,56.
The other competitive approaches are based on direct-gap semiconductors such as cadmium telluride and copper-indium-gal-lium-selenide (CIGS), in which only a thin film (less than 1 μm) is needed to absorb solar radiation. Thin-film solar cells can be deposited on light and low-cost substrates, reducing their overall cost and weight, which is an advantage for transportation and installation. However, thin-film deposition on heterosubstrates introduces defects in these films, which currently limit production-scale efficiency of cadmium-telluride and CIGS thin-film solar cells to 12–14% — their practical upper limit is 29%. If the defects in cadmium-telluride thin films could be reduced in production, this would increase the carrier lifetime and
increase the efficiency57. This reduction requires an understanding of the origins of defects, as well as ways to reduce and control them. The role of interfaces is a crucial aspect of solar cells and requires significant investment in research and development.
In addition to scientific understanding, engineered online monitoring and control systems may be needed to improve manufacturing quality control and as a means of continual improvement. Currently, panels made of cadmium-telluride thin films have the lowest cost (about $0.70 W-1). Owing to the financial discount that is applied to any new solar technol-ogy that is expected to perform for at least 20–25 years, any photovoltaic technology developed has to have the technological ‘head-room’ to be competitive with the projected progress of more established technologies. An increase in efficiency from 17% to 20% would significantly reduce the panel cost and some of the balance-of-system costs, which could have a transformative effect on the market similar to that expected for polycrys-talline silicon cells with an efficiency of over 18% (ref. 52).
Thin-film solar cells made of direct-gap III–V semiconductors are attractive because of their higher carrier mobilities, and their superior material quality that can make use of the materials research that focused on optoelectronics. This allows III–V semiconductor cells to achieve a much higher efficiency that is close to the practical upper limit. For example, solar-cell efficiencies of about 29% have been shown for III–V devices, which approaches the Shockley–Queisser limit of 33.5% for any single bandgap material58. Although high-quality films have generally been achieved on crystalline substrates, use of bulk materials would be cost-prohibitive for solar applications. The main challenge is to achieve the crystalline quality of III–V thin films, but on low-cost substrates such as plastics or sheet metals. As for techniques in solar cells that use silicon epitaxial growth followed by lift-off, good progress is being made towards manufacturing, on a larger scale, lift-off of thin crystalline gallium-arsenide layers grown epitaxially from bulk crystals.
Improving solar-module efficiency may also come from multijunction cells that capture a larger fraction of the solar spec-trum, multi-exciton generation, multiphoton absorption or photon up-conversion, and light concentration. The use of quantum dots and molecules to utilize some of these phenomena are being pursued, and,
0
50
100
150
200
250
300
350
400
Con
ventio
nal
coa
l
Adva
nce
d c
oal w
ith C
CS
NG
AC
C
NG
AC
C w
ith C
CS
NG
CC
T
Adva
nce
d n
ucl
ear
Win
d
Win
d-o
�sh
ore
Sol
ar P
V
Sol
ar t
her
mal
Geo
ther
mal
Bio
mas
s
Hyd
ro
Leve
llize
d c
ost
($ M
Whr–1
)
Figure 6 | Projections by the US Energy Information Administration made in 2010 of the 2016 average cost and range of the levellized cost of electricity from various sources. Note the cost of onshore wind at level 4 sites where the wind speed is 7.0–7.5 ms-1 and there are no financial incentives. Wind, utility-scale solar photovoltaics and solar thermal energy in 2012 in the United States (green) is already at or below the lower end of the 2016 estimates. ACC, advanced combined cycle; CCS, carbon capture and storage; CCT, conventional combustion turbine; NG, natural gas; PV, photovoltaics.
1 6 A U G U S T 2 0 1 2 | V O L 4 8 8 | N A T U R E | 2 9 9
PERSPECTIVE INSIGHT
© 2012 Macmillan Publishers Limited. All rights reserved
as described by Graetzel et al.51, are leading to a deeper understanding of light–matter interactions. The competition in solar technologies is fierce, and to have an effect on solar-electricity generation, the science must be translated into engineered systems that can meet the techno-economic target of about $0.50 W-1 for a solar panel at commercial scale.
Although the discussion so far has focused on solar flat panels, there are opportunities to generate electricity at $50–60 MWh-1 using concentrated solar photovoltaics. Most of the cost is in the balance of systems includ-ing the mirrors, lenses and their tracking system; however, the cost of the solar cell at the focal point of the optical system is not as significant. This is when multijunction solar cells with efficiencies that exceed 40% would be ideal. Innovations in low-cost and high-quality mirrors59, inexpensive Fresnel optics, as well as creative engineering to track them throughout the day at low cost are being developed.
Complementary to electricity generation using photovoltaics, solar thermal approaches that concentrate sunlight in parabolic troughs and power towers have also been used to convert absorbed solar radiation into heat (typically below 450 °C). Electricity is then generated at about 30–35% efficiency using a heat engine46. Heat can also be stored to allow better demand matching, especially the offset peak electricity demand, by several hours in climates and economies in which air-conditioning demand is rising.
To reduce the LCOE to $50–60 MWh-1, the efficiency of the heat engines must be increased. This requires more than 600 °C, suggest-ing that the higher-light concentration, as achieved in power towers or parabolic dish mirrors, is needed. There is significant opportunity for research to identify ways to store heat through the enthalpy of phase transitions or chemical reactions at more than 600 °C, as well as systems engineering to efficiently store and access this enthalpy on demand to run the heat engine for power generation60. Furthermore, research into low-cost and high-temperature materials, and their use in engineered systems, is needed to design and operate solar thermal reactors at these unprecedented high temperatures.
Although most of the work on concentrated solar power has involved either photovoltaic or thermal approaches, there are opportunities to combine them. For example, the visible part can be spectrally filtered out of the concentrated solar radiation for photovoltaics, and the rest of the radiation used for solar thermal approaches. Furthermore, solar thermal techniques rarely use all of the concentrated solar radiation, because there is generally some spillover from the solar absorber. Inte-grating photovoltaics in a solar thermal absorber may be possible, allow-ing both approaches to be integrated. Achieving more than 600 °C in a solar thermal absorber would also make it compatible with gas turbines used in natural-gas combined cycle technology, which would allow inte-gration of solar and natural-gas power plants to address baseload and peak demands.
To convert direct current to alternating current electricity and to integrate solar power into the grid, power electronics is crucial and
must be reduced to $0.10 W-1 or less — roughly half the cost it is today46. We are currently witnessing a revival of power-conversion electron-ics in which the introduction of wide bandgap semiconductors such as silicon-carbide and gallium-nitride, low-loss soft magnetics, solid-state capacitors and new-circuit topologies is having multiple positive effects61. These allow a significant increase in the operating frequency, which reduces the sizes of inductors and capacitors without altering their electrical impedance. The size reduction can allow integration of various components onto the same platform, reducing cost and weight. The use of solid-state capacitors as opposed to electrolytic ones can sig-nificantly increase reliability, which reduces the LCOE of solar energy.
The need to address the variable nature of intermittent technolo-gies such as solar will become crucial at high levels of penetration. Approaches to forecast the time-dependent solar insolation are needed to plan electricity dispatch. In parallel, storage technologies that will offset the variations in solar electricity output need to be developed (see later).
WindThe cost decline of wind energy is a result of significant improvements to turbines, blades and gearboxes, and an increase in the height of the wind towers. Although the largest wind turbine has a capacity of 7.5 MW, most turbines being installed are 1.5–2 MW (ref. 62).
As wind turbines increase in height and size, there is a marked increase in the mechanical stresses on the gearbox, blades and tower. Direct-drive wind turbines that can convert the slow rotary motion directly into alternating current electrical power using electromagnetic generators are receiving increased attention. However, these generators currently use permanent magnets based on rare-earth materials such as neodymium and dysprosium for their high remnant fields, field anisot-ropy and high-temperature stability. Although rare-earth deposits are found in many countries around the world, more than 90% of current production is in China63,64.
Research in magnetic materials that can produce large magnetic energy density without the need for rare-earth metals is needed. For example, there are certain phases of iron-born compounds (for example, Fe16N2) that produce extremely high magnetocrystalline anisotropy, but that are difficult to access and stabilize under ambi-ent conditions65,66. Today’s computing power could be used to predict magnetic behaviour in a combinatorial search that could guide the discovery of magnetic materials with high crystalline anisotropy and those with accessible stable phases. Often, accessing these metastable phases requires nanostructuring, as well as manufacturing composites with materials such as soft magnets67.
Offshore wind farms are an attractive source of energy because they can be placed in near-proximity to population centres and yet far enough away to mitigate local opposition. However, the cost remains high because of the need to build stable marine structures that can withstand the harsh marine environment for many years without the
0 100 200 300 400 500
Marine: waveMarine: tidal
STEG: LFRSTEG: tower and heliostat
STEG: parabolic trough + storageWind: o�shore
STEG: parabolic troughSTEG: tower and heliostat storage
PV: thin �lmPV: c-Si
PV: c-Si trackingBiomass: anaerobic digestion
Biomass: gasi�cationGeothermal: binary plant
Biomass: incinerationWind: onshore
Land�ll gasMunicipal solid waste
Geothermal: �ash plantSmall hydroLarge hydro
NuclearCoal-�red
Natural gas CCGT
789 +9%1,049 +9%
+11%–2%
+5%–4%
–5%–18%
–9%+1%–8%
–1%–14%
––1%
+2%–1%
––
––
+1%+1%+2%
Figure 7 | Levellized cost of energy for quarter three, 2012. The analysis of cost in dollar per megawatt-hour is based on available data from projects in which investment or purchase contracts have been completed. To produce comparisons of levellized cost of energy at a global level, the analysis assumed a single corporate tax rate of 35%, an annual inflation of 2% and the equity investor internal rate of return of 10%. Quarter three central scenarios, filled triangles; quarter two central scenarios, open triangles. Adapted with permisssion from ref. 41.
3 0 0 | N A T U R E | V O L 4 8 8 | 1 6 A U G U S T 2 0 1 2
PERSPECTIVEINSIGHT
© 2012 Macmillan Publishers Limited. All rights reserved
need for replacement. Furthermore, because heavy-duty maintenance currently needs calm seas, offshore wind turbines have to be highly reli-able. One approach to servicing the highest wind turbines is to design cranes that can ‘inch worm’ themselves up the towers, analogous to the self-lifting cranes used to build tall buildings.
Decarbonizing fossil-fuel emissionsIf the world is to continue to generate electricity from fossil fuels, the carbon emissions from the major stationary ‘point’ sources will have to be significantly reduced in the coming decades. Achieving higher primary energy use through cost-effective improvements in thermo-dynamic efficiency, co-generation of power and heat, and use of waste heat can reduce carbon emissions. However, maximizing efficiency is not sufficient. Carbon capture and storage (CCS) from coal and natural-gas power plants and other major emitters, such as cement and steel plants, will be necessary.
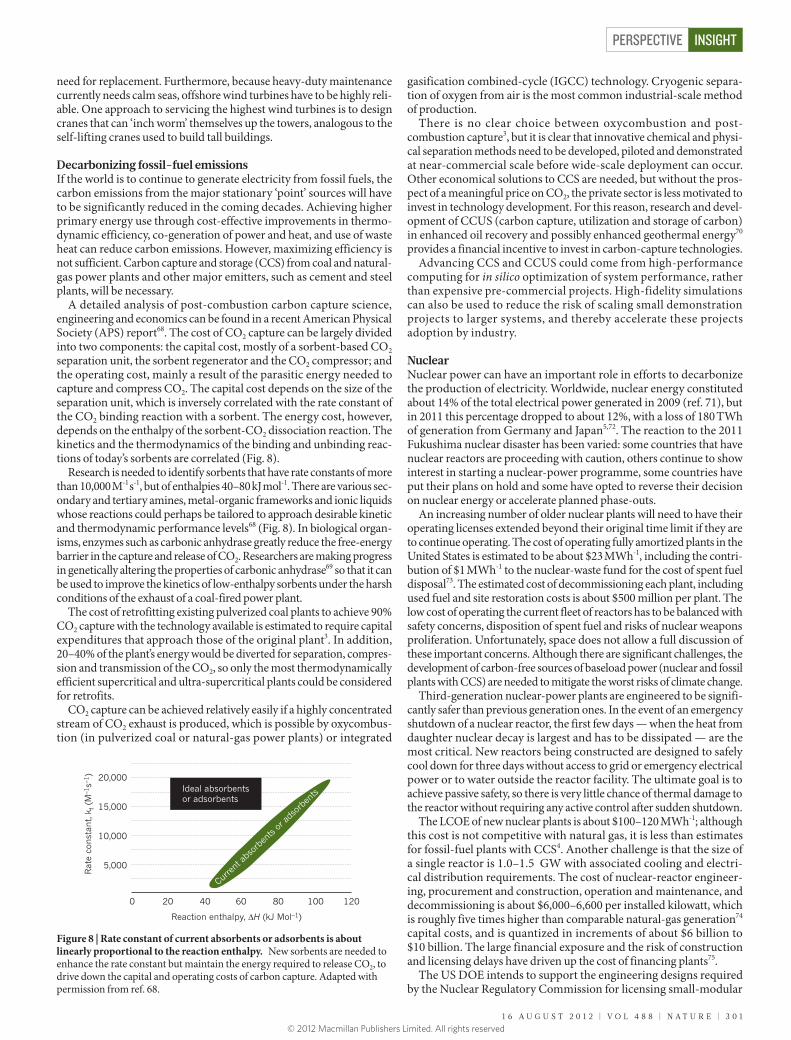
A detailed analysis of post-combustion carbon capture science, engineering and economics can be found in a recent American Physical Society (APS) report68. The cost of CO2 capture can be largely divided into two components: the capital cost, mostly of a sorbent-based CO2 separation unit, the sorbent regenerator and the CO2 compressor; and the operating cost, mainly a result of the parasitic energy needed to capture and compress CO2. The capital cost depends on the size of the separation unit, which is inversely correlated with the rate constant of the CO2 binding reaction with a sorbent. The energy cost, however, depends on the enthalpy of the sorbent-CO2 dissociation reaction. The kinetics and the thermodynamics of the binding and unbinding reac-tions of today’s sorbents are correlated (Fig. 8).
Research is needed to identify sorbents that have rate constants of more than 10,000 M-1 s-1, but of enthalpies 40–80 kJ mol-1. There are various sec-ondary and tertiary amines, metal-organic frameworks and ionic liquids whose reactions could perhaps be tailored to approach desirable kinetic and thermodynamic performance levels68 (Fig. 8). In biological organ-isms, enzymes such as carbonic anhydrase greatly reduce the free-energy barrier in the capture and release of CO2. Researchers are making progress in genetically altering the properties of carbonic anhydrase69 so that it can be used to improve the kinetics of low-enthalpy sorbents under the harsh conditions of the exhaust of a coal-fired power plant.
The cost of retrofitting existing pulverized coal plants to achieve 90% CO2 capture with the technology available is estimated to require capital expenditures that approach those of the original plant3. In addition, 20–40% of the plant’s energy would be diverted for separation, compres-sion and transmission of the CO2, so only the most thermodynamically efficient supercritical and ultra-supercritical plants could be considered for retrofits.
CO2 capture can be achieved relatively easily if a highly concentrated stream of CO2 exhaust is produced, which is possible by oxycombus-tion (in pulverized coal or natural-gas power plants) or integrated
gasification combined-cycle (IGCC) technology. Cryogenic separa-tion of oxygen from air is the most common industrial-scale method of production.
There is no clear choice between oxycombustion and post-combustion capture3, but it is clear that innovative chemical and physi-cal separation methods need to be developed, piloted and demonstrated at near-commercial scale before wide-scale deployment can occur. Other economical solutions to CCS are needed, but without the pros-pect of a meaningful price on CO2, the private sector is less motivated to invest in technology development. For this reason, research and devel-opment of CCUS (carbon capture, utilization and storage of carbon) in enhanced oil recovery and possibly enhanced geothermal energy70 provides a financial incentive to invest in carbon-capture technologies.
Advancing CCS and CCUS could come from high-performance computing for in silico optimization of system performance, rather than expensive pre-commercial projects. High-fidelity simulations can also be used to reduce the risk of scaling small demonstration projects to larger systems, and thereby accelerate these projects adoption by industry.
NuclearNuclear power can have an important role in efforts to decarbonize the production of electricity. Worldwide, nuclear energy constituted about 14% of the total electrical power generated in 2009 (ref. 71), but in 2011 this percentage dropped to about 12%, with a loss of 180 TWh of generation from Germany and Japan5,72. The reaction to the 2011 Fukushima nuclear disaster has been varied: some countries that have nuclear reactors are proceeding with caution, others continue to show interest in starting a nuclear-power programme, some countries have put their plans on hold and some have opted to reverse their decision on nuclear energy or accelerate planned phase-outs.
An increasing number of older nuclear plants will need to have their operating licenses extended beyond their original time limit if they are to continue operating. The cost of operating fully amortized plants in the United States is estimated to be about $23 MWh-1, including the contri-bution of $1 MWh-1 to the nuclear-waste fund for the cost of spent fuel disposal73. The estimated cost of decommissioning each plant, including used fuel and site restoration costs is about $500 million per plant. The low cost of operating the current fleet of reactors has to be balanced with safety concerns, disposition of spent fuel and risks of nuclear weapons proliferation. Unfortunately, space does not allow a full discussion of these important concerns. Although there are significant challenges, the development of carbon-free sources of baseload power (nuclear and fossil plants with CCS) are needed to mitigate the worst risks of climate change.
Third-generation nuclear-power plants are engineered to be signifi-cantly safer than previous generation ones. In the event of an emergency shutdown of a nuclear reactor, the first few days — when the heat from daughter nuclear decay is largest and has to be dissipated — are the most critical. New reactors being constructed are designed to safely cool down for three days without access to grid or emergency electrical power or to water outside the reactor facility. The ultimate goal is to achieve passive safety, so there is very little chance of thermal damage to the reactor without requiring any active control after sudden shutdown.
The LCOE of new nuclear plants is about $100–120 MWh-1; although this cost is not competitive with natural gas, it is less than estimates for fossil-fuel plants with CCS4. Another challenge is that the size of a single reactor is 1.0–1.5 GW with associated cooling and electri-cal distribution requirements. The cost of nuclear-reactor engineer-ing, procurement and construction, operation and maintenance, and decommissioning is about $6,000–6,600 per installed kilowatt, which is roughly five times higher than comparable natural-gas generation74 capital costs, and is quantized in increments of about $6 billion to $10 billion. The large financial exposure and the risk of construction and licensing delays have driven up the cost of financing plants75.
The US DOE intends to support the engineering designs required by the Nuclear Regulatory Commission for licensing small-modular
Ideal absorbentsor adsorbents
0 20
20,000
Rat
e co
nst
ant,
k f (
M–1
s–1)
Reaction enthalpy, ΔH (kJ Mol–1)
15,000
10,000
5,000
40 60 80 100 120
Curre
nt ab
sorb
ents
or ad
sorb
ents
Figure 8 | Rate constant of current absorbents or adsorbents is about linearly proportional to the reaction enthalpy. New sorbents are needed to enhance the rate constant but maintain the energy required to release CO2, to drive down the capital and operating costs of carbon capture. Adapted with permission from ref. 68.
1 6 A U G U S T 2 0 1 2 | V O L 4 8 8 | N A T U R E | 3 0 1
PERSPECTIVE INSIGHT
© 2012 Macmillan Publishers Limited. All rights reserved
reactors between 80 MW and 300 MW (refs. 76, 77). It is possible that safe nuclear power can be made more accessible through the economy of constructing dozens of reactors in a factory rather than one at a time at each site. Also, with the risk of licensing and construction delays reduced, small-modular reactors may represent a new paradigm in nuclear construction. The US DOE has also established an Energy Innovation Hub to develop multiphysics computational simulation tools to reduce the time needed to design and certify many aspects of both conventional reactors and small-modular reactors78.
Grid energy storageThe reliability and efficiency of the transmission and distribution system is improved by grid energy storage. Balancing and optimizing power flow and generation are challenges that need improved tech-nology, and business and regulatory vision. Significant improvements would help to realize more efficient energy markets, a lower cost of energy, increased reliability and security, and penetration of renewable energy beyond 20%.
The mismatch between an intermittent electricity supply and demand occurs over multiple time and energy scales. For seconds-to-minutes scales, voltage and frequency stabilization is currently achieved by grid-ancillary services that mostly use large banks of capacitors and hot-spinning reserves from fossil-fuel plants, but also banks of batteries and mechanical fly wheels. Hot-spinning reserves are also used to shore-up generation from minutes to hours. Modern natural-gas carbon-cycle plants are designed to ramp up rapidly at about 50 MW min-1, which, when combined with improved sensing and control of the grid, will be sufficient to accommodate most of the intermittency problems of renewable energy. For hours-to-overnight scales, power and energy capacities of hundreds to thousands of megawatt and megawatt hour will be needed, alternatively many smaller (hundreds to thousands of kilowatts) of distributed energy storage sites can be used.
The most inexpensive method to store electricity for the medium- and long-term is to use pumped hydroelectric and compressed air in air-tight caverns, for which the capital cost is about $100 kWh-1. How-ever, geographical constraints warrant alternative approaches. New electrochemical and modular and low-cost fabricated compressed-air systems are promising79.
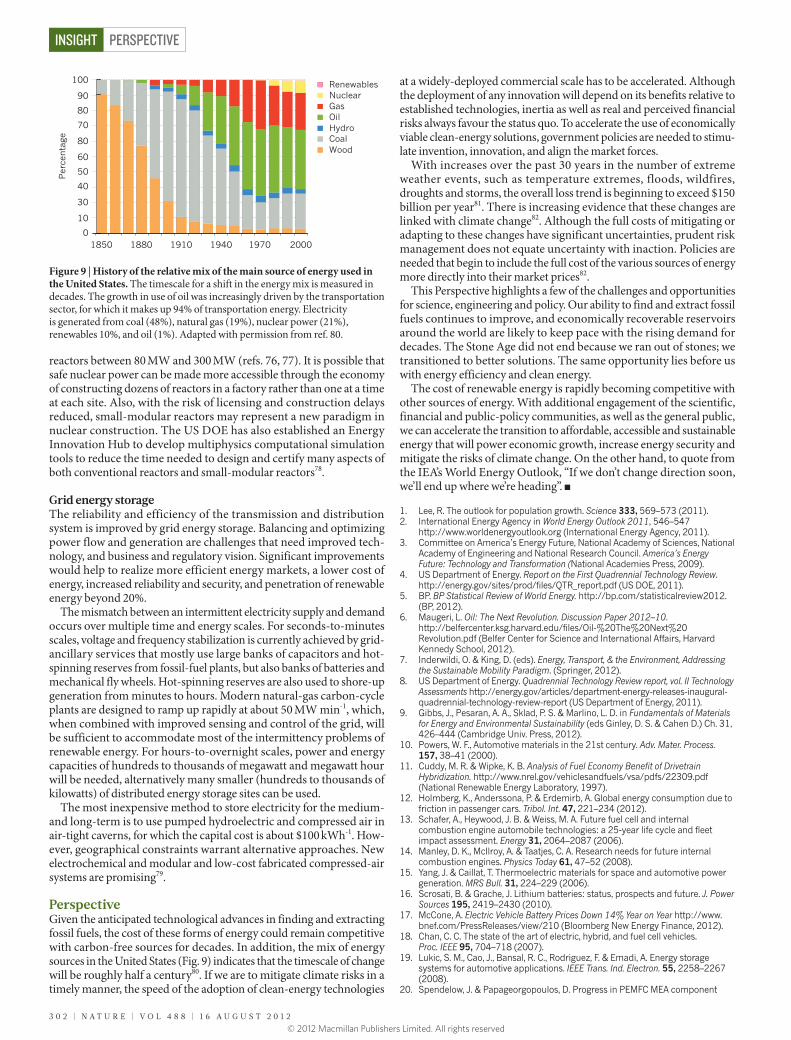
PerspectiveGiven the anticipated technological advances in finding and extracting fossil fuels, the cost of these forms of energy could remain competitive with carbon-free sources for decades. In addition, the mix of energy sources in the United States (Fig. 9) indicates that the timescale of change will be roughly half a century80. If we are to mitigate climate risks in a timely manner, the speed of the adoption of clean-energy technologies
at a widely-deployed commercial scale has to be accelerated. Although the deployment of any innovation will depend on its benefits relative to established technologies, inertia as well as real and perceived financial risks always favour the status quo. To accelerate the use of economically viable clean-energy solutions, government policies are needed to stimu-late invention, innovation, and align the market forces.
With increases over the past 30 years in the number of extreme weather events, such as temperature extremes, floods, wildfires, droughts and storms, the overall loss trend is beginning to exceed $150 billion per year81. There is increasing evidence that these changes are linked with climate change82. Although the full costs of mitigating or adapting to these changes have significant uncertainties, prudent risk management does not equate uncertainty with inaction. Policies are needed that begin to include the full cost of the various sources of energy more directly into their market prices82.
This Perspective highlights a few of the challenges and opportunities for science, engineering and policy. Our ability to find and extract fossil fuels continues to improve, and economically recoverable reservoirs around the world are likely to keep pace with the rising demand for decades. The Stone Age did not end because we ran out of stones; we transitioned to better solutions. The same opportunity lies before us with energy efficiency and clean energy.
The cost of renewable energy is rapidly becoming competitive with other sources of energy. With additional engagement of the scientific, financial and public-policy communities, as well as the general public, we can accelerate the transition to affordable, accessible and sustainable energy that will power economic growth, increase energy security and mitigate the risks of climate change. On the other hand, to quote from the IEA’s World Energy Outlook, “If we don’t change direction soon, we’ll end up where we’re heading”. ■
1. Lee, R. The outlook for population growth. Science 333, 569–573 (2011). 2. International Energy Agency in World Energy Outlook 2011, 546–547
http://www.worldenergyoutlook.org (International Energy Agency, 2011). 3. Committee on America’s Energy Future, National Academy of Sciences, National
Academy of Engineering and National Research Council. America’s Energy Future: Technology and Transformation (National Academies Press, 2009).
4. US Department of Energy. Report on the First Quadrennial Technology Review. http://energy.gov/sites/prod/files/QTR_report.pdf (US DOE, 2011).
5. BP. BP Statistical Review of World Energy. http://bp.com/statisticalreview2012. (BP, 2012).
6. Maugeri, L. Oil: The Next Revolution. Discussion Paper 2012–10. http://belfercenter.ksg.harvard.edu/files/Oil-%20The%20Next%20Revolution.pdf (Belfer Center for Science and International Affairs, Harvard Kennedy School, 2012).
7. Inderwildi, O. & King, D. (eds). Energy, Transport, & the Environment, Addressing the Sustainable Mobility Paradigm. (Springer, 2012).
8. US Department of Energy. Quadrennial Technology Review report, vol. II Technology Assessments http://energy.gov/articles/department-energy-releases-inaugural-quadrennial-technology-review-report (US Department of Energy, 2011).
9. Gibbs, J., Pesaran, A. A., Sklad, P. S. & Marlino, L. D. in Fundamentals of Materials for Energy and Environmental Sustainability (eds Ginley, D. S. & Cahen D.) Ch. 31, 426–444 (Cambridge Univ. Press, 2012).
10. Powers, W. F., Automotive materials in the 21st century. Adv. Mater. Process. 157, 38–41 (2000).
11. Cuddy, M. R. & Wipke, K. B. Analysis of Fuel Economy Benefit of Drivetrain Hybridization. http://www.nrel.gov/vehiclesandfuels/vsa/pdfs/22309.pdf (National Renewable Energy Laboratory, 1997).
12. Holmberg, K., Anderssona, P. & Erdemirb, A. Global energy consumption due to friction in passenger cars. Tribol. Int. 47, 221–234 (2012).
13. Schafer, A., Heywood, J. B. & Weiss, M. A. Future fuel cell and internal combustion engine automobile technologies: a 25-year life cycle and fleet impact assessment. Energy 31, 2064–2087 (2006).
14. Manley, D. K., McIlroy, A. & Taatjes, C. A. Research needs for future internal combustion engines. Physics Today 61, 47–52 (2008).
15. Yang, J. & Caillat, T. Thermoelectric materials for space and automotive power generation. MRS Bull. 31, 224–229 (2006).
16. Scrosati, B. & Grache, J. Lithium batteries: status, prospects and future. J. Power Sources 195, 2419–2430 (2010).
17. McCone, A. Electric Vehicle Battery Prices Down 14% Year on Year http://www.bnef.com/PressReleases/view/210 (Bloomberg New Energy Finance, 2012).
18. Chan, C. C. The state of the art of electric, hybrid, and fuel cell vehicles. Proc. IEEE 95, 704–718 (2007).
19. Lukic, S. M., Cao, J., Bansal, R. C., Rodriguez, F. & Emadi, A. Energy storage systems for automotive applications. IEEE Trans. Ind. Electron. 55, 2258–2267 (2008).
20. Spendelow, J. & Papageorgopoulos, D. Progress in PEMFC MEA component
100
90
80
70
80
60
50
40
30
10
01850 1970194019101880
Per
centa
ge
2000
RenewablesNuclearGasOilHydroCoalWood
Figure 9 | History of the relative mix of the main source of energy used in the United States. The timescale for a shift in the energy mix is measured in decades. The growth in use of oil was increasingly driven by the transportation sector, for which it makes up 94% of transportation energy. Electricity is generated from coal (48%), natural gas (19%), nuclear power (21%), renewables 10%, and oil (1%). Adapted with permission from ref. 80.
3 0 2 | N A T U R E | V O L 4 8 8 | 1 6 A U G U S T 2 0 1 2
PERSPECTIVEINSIGHT
© 2012 Macmillan Publishers Limited. All rights reserved

R&D at the DOE fuel cell technologies program. Fuel Cells 11, 775–786 (2011).21. Debe, M. K. Electrocatalyst approaches and challenges for automotive fuel cells.
Nature 486, 43–51 (2012).22. Yang, J., Sudik, A., Wolverton, C. & Siegel, D. J. High capacity hydrogen storage
materials: attributes for automotive applications and techniques for materials discovery. Chem. Soc. Rev. 39, 656–675 (2010).
23. Paster, M. D. et al. Hydrogen storage technology options for fuel cell vehicles: well-to-wheel costs, energy efficiencies, and greenhouse gas emissions. Int. J. Hydrogen Energy 36, 14534–14551 (2011).
24 . David, E. An overview of advanced materials for hydrogen storage. J. Mater. Process. Technol. 162–163, 169–177 (2005).
25. Murray, L. J., Dincă, M. & Long, J. R. Hydrogen storage in metal–organic frameworks. Chem. Soc. Rev. 38, 1294–1314 (2009).
26. Abbas, H. F. & Wan Daud, W. M. A. Hydrogen production by methane decomposition: A review. Int. J. Hydrogen Energy 35, 1160–1190 (2010).
27. Krupnick, A. J. Will Natural Gas Vehicles be in Our Future. http://www.rff.org/RFF/Documents/RFF-IB-11-06.pdf (Resources for the Future, 2011).
28. NACS. Key Facts and Figures. http://www.nacsonline.com/NACS/Resources/campaigns/GasPrices_2011/Pages/default.aspx (NACS, 2011).
29. America’s Energy Future Panel. Liquid Transportation Fuels. (National Academies Press, 2009).
30. Environmental Protection Agency. Renewable Fuel Standard Program (RFS2): Final Rulemaking http://www.epa.gov/otaq/fuels/renewablefuels/regulations.htm (US Environmental Protection Agency, 2010).
31. United Nations Environment Programme. Towards Sustainable Production of and use of resources: Assessing Biofuels http://www.unep.org/publications/contents/pub_details_search.asp?ID=4082 (United Nations Environment Programme, 2009).
32. Stratton, R. W., Wong, H. M. & Hileman, J. I. Quantifying variability in life cycle greenhouse gas inventories of alternative middle distillate transportation fuels. Environ. Sci. Technol. 45, 4637–4644 (2011).
33. Peralta-Yahya, P. P., Zhang, F., del Cardayre, S. B. & Keasling, J. D. Progress in the microbial production of advanced biofuels: from feedstocks to fuels. Nature 488, 320–328 (2012).
34. Worldwatch Institute. Biofuels for Transport (Routledge, 2007).35. Georgianna, D. R. & Mayfield, S. P. Exploiting diversity and synthetic biology for
the production algae biofuels, Nature 488, 329–335 (2012).36. Zhu, X-, G., Long, S. P. & Ort, D. R. What is the maximum efficiency with
which photosynthesis can convert solar energy into biomass? Curr. Opin. Biotechnol. 19, 153–159 (2008).
37. Conrado, R. J. et al. in Electrofuels: A new paradigm for renewable fuels. Advanced Biofuels and Bioproducts (Lee, J. ed.) (Springer, 2012).
38. International Energy Agency. World Energy Outlook 2011 179,186 http://www.worldenergyoutlook.org/ (International Energy Agency, 2011).
39. International Energy Agency. World Energy Outlook 2011, 180 http://www.worldenergyoutlook.org/ (International Energy Agency, 2011).
40. US Energy Information Administration. Annual Energy Outlook 2011 Levelized Cost Supplement http://www.eia.gov/forecasts/archive/aeo11/electricity_generation.cfm (US Energy Information Administration, 2011)
41. Bloomberg New Energy Finance. Levelised Cost of Energy Update, Q3 2012 http://www.bnef.com/WhitePapers/download/114 (Bloomberg New Energy Finance, 2012).
42. Wiser, R., Lantz E., Bolinger, M. & Hand, M. Recent Developments in the Levelized Cost of Energy from U.S. Wind Power Projects. http://eetd.lbl.gov/ea/ems/reports/wind-energy-costs-2-2012.pdf (US Department of Energy, 2012).
43. Galen Barbose, G. Darghouth, N., Wiser, R. & Seel, J. Tracking the Sun: An Historical Summary of the Installed Cost of Photovoltaics in the United States from 1998 to 2010 http://eetd.lbl.gov/ea/ems/reports/lbnl-5047e.pdf (Lawrence Berkeley National Laboratory report, 2011).
44. Solar Energy Industries Association. US Solar Market Insight Report Q1 2012 http://www.seia.org/research-resources/us-solar-market-insight (Solar Energy Industries Association, 2012).
45. Hand, M. M. et al. Renewable Electricity Futures Study http://www.nrel.gov/analysis/re_futures/ (National Renewable Energy Laboratory, 2012).
46. US Department of Energy. SunShot Vision Study http://www1.eere.energy.gov/solar/pdfs/47927.pdf (US Department of Energy, 2012).
47. Baziliana, M. et al. Re-considering the Economics of Photovoltiac Power www.bnef.com/WhitePapers/download/82 (Bloomberg New Energy Finance, 2012).
48. Swanson, R. M. Plenary talk at the DOE SunShot Grand Challenge: Summit and Technology Forum on June 14, 2012 https://www.eeremultimedia.energy.gov/solar/videos/sunshot_summit_richard_swanson_plenary_session (US Department of Energy, 2012).
49. US Department of Energy. SunShot Initiative http://www1.eere.energy.gov/solar/sunshot/accelerating_deployment.html (US Department of Energy, 2012).
50. Swanson, R. M. Proc. 31st IEEE Photovoltaic Specialists Conf. 889–894 (2005).51. Graetzel M. Jannsen, R. A., Mitzi, D. B. & Sargent, E. H. Materials interface
engineering for solution-processed photovoltaics, Nature 488, 304–312 (2012).52. Stoddard, N., Wu B., Maisano, L., Russell, Clark, R. & Fernandez, J. M. The
Leading Edge of Silicon Casting Technology and BP Solar’s Mono2 Wafers, in 18th Workshop on Crystalline Silicon Solar Cells & Modules: Materials and Processes. pp. 7–14. http://www.nrel.gov/docs/fy08osti/45745.pdf (National Renewable Energy Laboratory, 2008).
53. Mavrokefalos, A., Han, S. E., Yerci, S., Branham, M. S. & Chen, G. Efficient light trapping in inverted nanopyramid thin crystalline silicon membranes for solar cell applications. Nano Lett. 12, 2792–2796 (2012).
54. Solexel. Solexel unveils ultra-thin, high-performance silicon solar cell at Intersolar.
http://www.solexel.com/IntersolarNA2012.php (Solexel, 2012).55. Rao, R. A. et al. Proc. 37th IEEE Photovoltaic Specialists Conf. 1504–1507 (2011). 56. Sachs, E. M., Wallace R. L., Hantsoo, E. T., Lorenz, A. M., Hudelson S.G.D.
& Jonczyk, R. Methods for efficiently making thin semiconductor bodies from molten material for solar cells and the like, US Patent Application 20120067273 (2012).
57. Garland J. W., Biegala, T., Carmody, M., Gilmore, C. & Sivananthan, S. Next-generation multijunction solar cells: The promise of II-VI materials. J. Appl. Phys. 109, 102423 (2011).
58. Miller, O. D., Yablonovitch, E. & Kurtz, S. R. Strong internal and external luminescence as solar cells approach the Shockley–Queisser limit. IEEE J. Photovolt. 2, 303–311 (2012).
59. Angel, R. & Olbert, B. H. Method of manufacturing large dish reflectors for a solar concentrator apparatus. US Patent Application 20120125400 (2011).
60. Gur, I., Sawyer, K. & Prasher, R. Searching for a better thermal battery. Science 335, 1454–1455 (2012).
61. Advanced Research Projects Agency-Energy. ARPA-E Efficient Power Conversion Factsheet. http://arpa-e.energy.gov/Portals/0/Documents/FundedProjects/ADEPT%20Slicksheets/ADEPT_Program_Final_One%20Pager.pdf (Advanced Research Projects Agency-Energy, 2010).
62. Bolinger, M. & Wiser, R. Understanding wind turbine price trends in the U.S. over the past decade. Energy Pol. 42, 628–641 (2012).
63. US Department of Energy. Critical Materials Strategy. http://energy.gov/sites/prod/files/piprod/documents/cms_dec_17_full_web.pdf (US Department of Energy, 2010)
64. National Research Council. Minerals, Critical Minerals, and the U.S. Economy (National Academies Press, 2008).
65. Komuro, M., Kozono Y., Hanazono, M. & Yutaka, S. Epitaxial growth and magnetic properties of Fe16N2 films with high saturation magnetic flux density. J. Appl. Phys. 67, 5126–5130 (1990).
66. Nian, J., Lawrence F. A., Edgar L. C., &Wang, J.-P. N-site ordering effect on partially ordered Fe16N2. Appl. Phys. Lett. 98, 092506 (2011).
67. Bader, S. J. Opportunities in nanomagnetism. Rev. Mod. Phys. 78, 1–15 (2006).68. American Physical Society. Direct air capture of CO2 with chemicals: a Technology
Assessment for the APS Panel on Public Affairs. www.aps.org/policy/reports/assessments/upload/dac2011.pdf (American Physical Society, 2011).
69. Turner, N. J. Directed evolution drives the next generation of biocatalysts. Nature Chem. Biol. 5, 567–573 (2009).
70. Pruess, K. Enhanced geothermal systems (EGS) using CO2 as working fluid — a novel approach for generating renewable energy with simultaneous sequestration of carbon. Geothermics 35, 351–367 (2006).
71. International Energy Agency. Technology Roadmap — Nuclear Energy http://www.iea.org/papers/2010/nuclear_roadmap.pdf (International Energy Agency, 2010).
72. Ruhl, C. Energy in 2011 — disruption and continuity BP Statistical Review of World Energy http://www.bp.com/sectiongenericarticle800.do?categoryId=9037130&contentId=7068669 (BP, 2012).
73. Nuclear Energy Institute. Costs: Fuel, Operation and Waste Disposal http://www.nei.org/resourcesandstats/nuclear_statistics/costs/ (National Energy Institute, 2012).
74. Nuclear Energy Institute. The Cost of New Generating Capacity in Perspective http://www.nei.org/resourcesandstats/documentlibrary/newplants/graphicsandcharts/the-cost-of-new-generating-capacity-in-perspective (Nuclear Energy Institute, 2012).
75. Massachusetts Institute of Technology. Update of the MIT 2003 Future of Nuclear Power Study http://web.mit.edu/nuclearpower/pdf/nuclearpower-update2009.pdf (Massachusetts Institute of Technology, 2009).
76. Chu, S. America’s new nuclear option. Wall Street J. (March 23, 2010).77. US Department of Energy. Small Modular Reactor Fact Sheet http://www.ne.doe.
gov/pdfFiles/factSheets/2012_SMR_Factsheet_final.pdf (US Department of Energy, 2012).
78. US Department of Energy. Consortium for Advanced Simulation of LWRs Project Summary. http://www.ornl.gov/sci/nsed/docs/CASL_Project_Summary.pdf (US Department of Energy).
79. Advanced Research Projects Agency-Energy. Grid-scale renewable energy storage factsheet. http://arpa-e.energy.gov/Portals/0/Documents/FundedProjects/GRIDS%20Slicks/_GRIDS_ProgramSheet_Final.pdf (Advanced Research Projects Agency-Energy, 2010).
80. Energy Information Administration. Annual Energy Review 2010. Report No. DOE/EIA-0384(2010) www.eia.gov/totalenergy/data/annual/pdf/aer.pdf (Energy Information Administration, 2010).
81. Munich Re. Topics Geo. http://www.munichre.com/publications/302-07225_en.pdf (Munich Re, 2012).
82. Intergovernmental Panel on Climate Change. Managing the Risks of Extreme Events and Disasters to Advance Climate Change Adaptation. http://www.ipcc-wg2.gov/SREX/images/uploads/SREX-All_FINAL.pdf (Cambridge Univ. Press, 2012).
Acknowledgements The authors wish to acknowledge T. J. Augustine, P. Davis, H. Gruenspecht, M. Le, P. Lyons, R. Ramamoorthy, D. Sandalow, S. Satyapal and E. Toone for suggestions.
Author Information Reprints and permissions information is available at www.nature.com/reprints. The authors declare no competing financial interests. Readers are welcome to comment on the online version of this article at go.nature.com/7pb7ff. Correspondence should be addressed to S.C. ([email protected]) and A.M. ([email protected]).
1 6 A U G U S T 2 0 1 2 | V O L 4 8 8 | N A T U R E | 3 0 3
PERSPECTIVE INSIGHT
© 2012 Macmillan Publishers Limited. All rights reserved