operations desert shield/ desert storm - dtic · operations desert shield/desert storm: results...
TRANSCRIPT
DMDC Report No. 97-004April 1997
Operations Desert Shield/Desert Storm:
Results from the 1992 DoD Surveysof Officers and Enlisted Personnel and
Military Spouses
i997O5O5 ioe
Defense Manpower Data CenterSurvey & Program Evaluation Division
1600 Wilson Boulevard, Suite 400Arlington, Va. 22209-2593

1OTForm ApprovedREPORT DOCUMENTATION PAGE 0OMB No. 0704-0188
Public reporting burden for this collection of information is estimated to average 1 hour per response, including the time for reviewing instructions searching existing data sources,gathering and maintaining the data needed, and completing and reviewing the collection of information. Send comments regarding this burden estimate or any other aspect of thiscollection of information, including suggestions for reducing this burden, to Washington Headquarters, Services, Directorate for Information Operations and Reports, 1215 JeffersonDavis Highway, Suite 1204, Arlington, VA 22202-4302, and to the Office of Management and Budget, Paperwork Reduction Project (0704-0188), Washington, DC 20503.
1. AGENCY USE ONLY (Leave Blank) 2. REPORT DATE 3. REPORT TYPE AND DATES COVERED
April 1997 Final Report -- January 1996 to April 19974. TITLE AND SUBTITLE 5. FUNDING NUMBERS
Operations Desert Shield/Desert Storm: Results from the 1992 DoDSurveys of Officers and Enlisted Personnel and Military Spouses
6. AUTHOR(S)
Daniel M. Aldridge, Tracy T. Sturdivant, Charles L. Smith, and Josefina A.Lago (WCG) and Betty D. Maxfield (DMDC)
7. PERFORMING ORGANIZATION NAME(S) AND ADDRESS(ES) 8. PERFORMING ORGANIZATIONREPORT NUMBER
Washington Consulting Group4330 East-West Highway, Suite 1010Bethesda, Maryland 20814
9. SPONSORING/MONITORING AGENCY NAME(S) AND ADDRESS(ES) 10. SPONSORING/MONITORINGAGENCY REPORT NUMBER
Defense Manpower Data Center1600 Wilson Boulevard, Suite 400 97-004Arlington, Virginia 22209
11. SUPPLEMENTARY NOTES
12a. DISTRIBUTIONJAVAILABILITY STATEMENT 12b. DISTRIBUTION CODE
Approved for public release; distribution is unlimited.
13. ABSTRACT (Maximum 200 words)
To better understand and plan for the needs of a changing military force, the Defense Manpower DataCenter (DMDC) conducted the 1992 Surveys of Officers and Enlisted Personnel and Their Spouses.Specifically, this study was designed to assess whether certain groups of military personnel have moredifficulty responding quickly to alerts/deployments such as the Gulf War, and how separations from theirfamily affect the Service members and their families. Major findings of the study were: a) more than half ofthe officers and enlisted personnel who were deployed during Operations Desert Shield/Desert Storm(ODS/S) had dependents; b) officers with dependents were more likely to report problems responding toODS/S than were officers without dependents; c) males were less likely to report difficulties in respondingquickly to recall or alert than were females, however, males reported more concerns about their familieswhen separated from them than did females; d) officers and enlisted personnel with more education andhigher pay were less likely to report difficulties responding quickly to alerts/deploymenfs;- and e) enlistedpersonnel who had higher levels of satisfaction with military life were less likely to report concerns abouttheir families while they were separated from their family.
14. SUBJECT TERMS 15. NUMBER OF PAGES98
deployment, alerts, Persian Gulf War, unit readiness, families, child care16. PRICE CODE
17. SECURITY CLASSIFICATON 18. SECURITY CLASSIFICATION 19. SECURITY CLASSIFICATION 20. LIMITATION OF ABSTRACTOF REPORT OF THE PAGE OF ABSTRACT
Unclassified Unclassified Unclassified Unlimited
SF298 (Rev 7/95)
DMDC Report No. 97-004April 1997
OPERATIONS DESERT SHIELD/DESERT STORM:
RESULTS FROM THE 1992 DOD SURVEYS OF OFFICERS ANDENLISTED PERSONNEL AND MILITARY SPOUSES
Daniel M. Aldridge, Tracy T. Sturdivant, Charles L. Smith, and Josefina A. LagoWashington Consulting Group
Betty D. Maxfield, Project DirectorDefense Manpower Data Center
Defense Manpower Data CenterSurvey & Program Evaluation Division
1600 Wilson Boulevard Suite 400, Arlington, VA 22209
Executive Summary
Introduction
To maintain efficiency and effectiveness, the Department of Defense (DoD) must be a responsiveemployer. As the military becomes more gender-integrated and more family-oriented, DoD mustunderstand and plan for the needs of the changing Service force. To provide input for policies that relateto military families, the Defense Manpower Data Center (DMDC) conducted the 1992 Department ofDefense Surveys of Officers and Enlisted Personnel. The surveys were designed to provide an analysisof issues such as the impact of changing family structures, to guide updates of current policies toaccommodate changing needs, and to assist in the development of new policies.
The 1992 surveys included active-duty personnel in all four military Services. They were based onstratified samples of 40,812 officers and 56,015 enlisted personnel, for a total of 96,827 Servicemembers. Responses were received from 59,930 Service members (27,684 officers and 32,246 enlistedpersonnel). Response rates, based on the number of completed survey returns and the number of eligiblemembers, were 71.6 percent for officers, 62.3 percent for enlisted personnel, and 66.3 percent overall.The stratified samples were drawn from four different sources:
"* A longitudinal database consisting of a subsample from the 1985 survey sample,
"* A sample of recruiters,
"• A sample of active-duty members, and
"* A sample of Active Guard/Reserve or Training and Administration of the Reserve (AGR/TAR)members.
The survey questionnaire gathered information on demographics, military background and lifestyles,deployments, retention and career intentions, dependents and child care issues, military compensation,benefits and programs, and family resources.
This report is the third in a series of five analyses based on the 1992 survey results. The objectiveof the report is to analyze barriers to individual and unit readiness for troops deployed during OperationsDesert Shield/Desert Storm (ODS/S). Unit readiness has typically been measured using the Status ofResources and Training System (SORTS), which assesses unit readiness but does not incorporate theinfluence of outside factors (e.g., the family) on individual readiness. The 1992 surveys were intendedto supplement measures of unit readiness used by the Joint Chiefs of Staff and studies by groups suchas the Presidential Commission on Assignment of Women to the Armed Forces, The work of Kelley(1994) and others gave some insight into the influence of stressors associated with deployments onindividual readiness and family well-being. Still, the body of literature does not adequately address suchissues as whether certain groups have more difficulty responding quickly to alerts in general (anddeployments such as the Gulf War in particular) or how separations affect Service members and theirfamilies.
Central questions that remain unanswered by previous studies include whether some of the Servicemembers deployed in ODS/S were more likely than others to experience difficulty in responding quicklyto recalls, alerts, or changes in work schedule, and whether some of the ODS/S deployed Servicemembers worried more than others about their families while they were away on assignment. Based onresponses to the 1992 surveys, this report describes the kinds of barriers to readiness that ODS/S Servicemembers reported, and presents findings that can guide policy changes to reduce such barriers for thechanging Service force.
Analysis Methodology
A systematic approach was used for the analysis of the 1992 survey results: developing questions,determining descriptive statistics to test interrelationships among the survey variables, and constructinga series of multivariate models based on relationships identified by the descriptive tests. The questionsto be addressed in this report were as follows:
" Among those deployed in ODS/S, were some Service members more likely than others toexperience difficulty in responding quickly to recalls, alerts, or changes in work schedule ingeneral (not specifically related to ODS/S)?
"* Among those deployed in ODS/S, were some Service members more likely than others toexperience deployment difficulties with ODS/S specifically?
"• Among those deployed in ODS/S, did some Service members worry more than others about theirfamilies while they were away on assignment?
"* Among spouses of those deployed in ODS/S, were some more likely than others to experienceproblems dealing with changes caused by the deployment?
Explanatory variables (developed from the survey responses) included the following: 1) individual,military, and family demographics; 2) whether emergency provisions were in place; 3) satisfaction withmilitary life; 4) whether the spouse was upset with the ODS/S mobilization; and 5) other attitudinalvariables that measured satisfaction with various aspects of military life. Simple descriptive tests (e.g.,frequency tables and Chi-square tests) were used to explore the interrelationships among the explanatoryvariables themselves and the relationships between explanatory variables and dependent measures. Aseries of more complex multivariate models (i.e., regressions) were used to examine directionalinterrelationships between the explanatory and dependent variables. The objective was to provideinformation for DoD deployment programs and policies and thereby make individual Service members,as well as their units, more combat-ready.
Findings
The following are highlights of the findings:
"• More than half of the enlisted (53.7 percent) and officer (59.3 percent) personnel who weredeployed during ODS/S had dependents.
"• For both enlisted and officer personnel, those with dependents experienced more problemsresponding quickly to recall/alert than those without dependents. The one exception was for single
Hi
enlisted Service members with dependents. These individuals were no more likely to reportdifficulties in responding quickly than were married Service members without dependents.
"• Officers with dependents were more likely to report problems responding to ODS/S than wereofficers without dependents. For enlisted personnel, however, single personnel with dependentsand married personnel with a military spouse and dependents were no more likely to reportproblems than were enlisted personnel who were married to a civilian and had no dependents.
"° With the exception of dual-military couples, Service members with dependents tended to worrymore about their families while separated than did married Service members without dependents.
"• Males were less likely to report difficulties in responding quickly to recall or alert than werefemales.
"• In general, males reported more concerns about their families when separated than did females.
"• Among enlisted personnel and officers, those with more education and higher pay were less likelyto report difficulties with quick response.
"* Among officers, those with higher levels of education reported fewer concerns about their familieswhile they were deployed/mobilized.
"° Service members who were in families with higher total incomes tended to report fewer concernsabout their families while they were away from home.
"• More experienced personnel (enlisted and officers) had an easier time coping with the ODS/Sdeployment. Higher ranking personnel were also less likely to indicate that they experiencedproblems in responding to ODS/S.
"° For enlisted personnel, those who had higher levels of satisfaction with military life reported fewerconcerns about their families while separated.
"* The longer the advance notice given regarding deployment, the less likely the spouses of deployedService members were to indicate problems associated with ODS/S.
"• Spouses (both officers' spouses and those married to enlisted personnel) who reported that theywere upset by the ODS/S mobilization and experienced high levels of stress as a result of ODS/Swere more likely to report problems dealing with the deployment than were those who did not.
"• When the job of the non-mobilized spouse was unaffected by the ODS/S deployment, the spousewas less likely to report problems dealing with changes created by the deployment.
ContentsPage
Introduction .. ........................................................... 1Background .. ...................................................... 1Literature Review . .................................................. 1
Families and Readiness . ......................................... 3Personnel Programs .. ............................................ 5
Survey Sam ple . .................................................... 5
Demographic Profile of the ODS/S Service Force ................................ 7Analysis M ethodology ................................................ 7Results .. .......................................................... 7
Barriers to Readiness . .................................................... 13Difficulties in Responding to Recall/Alert .................................. 19
Analysis M ethodology . .......................................... 19R esults . ..................................................... 22
Problems in Responding to the ODS/S Deployment ........................... 26Analysis M ethodology . .......................................... 26R esults . ................................................. .... 27
Family Concerns W hile Separated ........................................ 30Analysis M ethodology . .......................................... 30R esults . ..................................................... 32
Spouse's Perception of Problems Due to Changes Created by ODS/S ...... : ....... 36Analysis M ethodology . .......................................... 36R esults . ..................................................... 37
Summary and Conclusions ................................................. 40Profile of the ODS/S Deployed Force .................................... 40Barriers to Readiness ................................................ 40
Difficulties in Responding to Recall/Alert ............................ 40Problems Responding to ODS/S Deployment ........................... 45Family Concerns While Separated .................................. 45Spouse's Perception of Problems Due to Changes Created by ODS/S ......... 46
Conclusions . ...................................................... 46
R eferences ............................................... ................ 49
Appendix A. Study Design . ................................................ 51Appendix B. Analysis M ethodology ......................................... 55Appendix C. Survey Questionnaire ......................................... 65
V
List of Tables Page
1. Demographic Characteristics of Enlisted Personnel by ODS/S Deployment Status ........ 72. Demographic Characteristics of Officers by ODS/S Deployment Status ............... 103. Items Included in the Analyses . ........................................... 134. Correlation Between Observed and Predicted Values of the Dependent Variable
(DIFFICULTY) in the Sequential Model for Enlisted Service MembersDeployed in ODS/S . ................................................... 22
5. Relative Odds of Experiencing Difficulties in Responding to Recall/Alertfor Enlisted Personnel . ................................................. 23
6. Correlation Between Observed and Predicted Values of the Dependent Variable(DIFFICULTY) in the Sequential Model for Officers ............................ 24
7. Relative Odds of Experiencing Difficulties in Responding to Recall/Alert for Officers ..... 258. Correlation Between Observed and Predicted Values of the Dependent Variable
(PROBLEMS) in the Sequential Model for Enlisted Service Members ................ 279. Relative Odds of Experiencing Problems in Responding to ODS/S Deployment
for Enlisted Personnel . ................................................. 2810. Correlation Between Observed and Predicted Values of the Dependent Variable
(PROBLEMS) in the Sequential Model for Officers ............................. 2911. Relative Odds of Experiencing Problems in Responding to ODS/S Deployment
for O fficers . ......................................................... 2912. Variance in the Dependent Variable (CONCERN) in the Sequential Model
for Enlisted Service Members . ............................................ 3213. Relative Effects of Independent Variables on Family Concerns While Separated
for Enlisted Personnel . ................................................. 3314. Variance in the Dependent Variable (CONCERN) in the Sequential Model for Officers .... 3415. Relative Effects of Independent Variables on Family Concerns While Separated
for Officers . ......................................................... 3516. Variance in the Dependent Variable (SPOUSE PROBLEMS) in the Sequential Model
for Spouses of Enlisted Service Members ..................................... 3717. Relative Effects of Independent Variables on Problems Experienced Because of Changes
Created by ODS/S for Spouses of Enlisted Personnel ............................ 3818. Variance in the Dependent Variable (SPOUSE PROBLEMS) in the Sequential Model
for Spouses of Officers . ................................................. 3919. Relative Effects of Independent Variables on Problems Experienced Because of Changes
Created by ODS/S for Spouses of Officers .................................... 39Al. Questionnaire Completion and Response Rates by Status, Gender, and Service Branch .... 54B1. Factors Identified as Problems Associated with Members' Most Recent PCS Moves ...... 57B2. Logistic Regression Results for Difficulties in Quick Response
(Dependent Variable = DIFFICULTY): Enlisted Personnel ....................... 60B3. Logistic Regression Results for Difficulties in Quick Response
(Dependent Variable = DIFFICULTY): Officers ............................... 61B4. Logistic Regression Results for Problems in Responding to ODS/S Deployment
(Dependent Variable = PROBLEMS): Enlisted Personnel ........................ 62B5. Logistic Regression Results for Problems in Responding to ODS/S Deployment
(Dependent Variable = PROBLEMS): Officers ............................... 62
vi
List of Tables (Continued) Page
B6. Multiple Regression Results for Family Concerns While Separated(Dependent Variable = CONCERN): Enlisted Personnel .......................... 63
B7. Multiple Regression Results for Family Concerns While Separated(Dependent Variable = CONCERN): Officers ................................. 63
B8. Multiple Regression Results for Spouse's Perception of Problems Due to ChangesCreated by ODS/S (Dependent Variable = SPOUSE PROBLEMS): Enlisted Personnel .... 64
B9. Multiple Regression Results for Spouse's Perception of Problems Due to ChangesCreated by ODS/S (Dependent Variable = SPOUSE PROBLEMS): Officers ........... 64
List of Figures
1. Percentage of Service Members Deployed in Operations Desert Shield/Desert Stormby G ender . .......................................................... 41
2. Percentage of Service Members Deployed in Operations Desert Shield/Desert Stormby Race/Ethnicity . .................................................... 41
3. Percentage of Service Members Deployed in Operations Desert Shield/Desert Stormby Age Group . ....................................................... 42
4. Percentage of Service Members Deployed in Operations Desert Shield/Desert Stormby Years of Education ................................................. 42
5. Percentage of Service Members Deployed in Operations Desert Shield/Desert Stormby Pay Grade . ....................................................... 43
6. Percentage of Service Members Deployed in Operations Desert Shield/Desert Stormby Fam ily Type . ...................................................... 43
7. Percentage of Service Members Deployed in Operations Desert Shield/Desert Stormby Location of Assignment ............................................... 44
vii
Introduction
Background
To maintain efficiency and effectiveness, the Department of Defense (DoD) must be a responsiveemployer. Toward this end, DoD periodically assesses the characteristics, behaviors, attitudes, values,expectations, career intentions, and satisfaction of military Service members and their families andidentifies potential areas for improvements in personnel policy. As the military work force becomesmore gender-integrated and more family-oriented, DoD must understand and plan for the needs of thechanging force. Yesteryear's troops were predominantly single men; in contrast, today's volunteersconsist of married men and women, mothers and fathers, dual-military couples, and single parents, aswell as single men and women.
Because the military is no longer primarily single individuals, personnel policies, services, andprograms must be offered to enable the changing military personnel to manage the burdens of bothfamily life and the bearing of arms. Such policies and programs can contribute to recruitment, morale,readiness, performance, and personnel retention.
A variety of research studies have provided input for structuring DoD policies and programs. Manyof those studies, however, have focused on the combat readiness of military units rather than individualreadiness. Also, issues such as the influence of outside factors (e.g., the family) on the ability of Servicemembers to respond quickly to recalls or alerts have not been adequately addressed. In addition, thedeployment problems experienced by Service members and their families, particularly during crises suchas the Persian Gulf War, have not been fully explored.
To provide further input on family policies (e.g., child care), the Defense Manpower Data Center(DMDC) conducted the 1992 Department of Defense Surveys of Officers and Enlisted Personnel, whichfocused extensively on military families. Development of the surveys was coordinated through theOffice of the Under Secretary of Defense for Personnel and Readiness (Personnel Support, Families &Education, Office of Family Policy, Support & Services). The surveys were administered to active-dutypersonnel in all four military Services. They included items on demographics, military background andlifestyle, deployments, retention and career intentions, dependents, military compensation, benefits andprograms, civilian labor force experience, and family resources.
To aid in the dissemination and utilization of findings from the 1992 surveys, DMDC has publishedfive topical reports. Other reports in this series address background and characteristics of militaryfamilies, individual and family readiness for separation and deployment, child care, and the military asa career. This report presents findings concerning separation and deployment for the Service membersdeployed in ODS/S. The remaining sections of this introduction are a literature review, which describesissues surrounding ODS/S and earlier studies related to deployment and combat readiness, and a surveymethodology section, which describes the development of the 1992 surveys.
Literature Review
Operations Desert Shield and Desert Storm together comprised the largest showing of Americanmilitary power since the Vietnam conflict. In the face of the invasion of Kuwait by Iraqi forces,American and other allied troops began to be deployed to the Middle East in August 1990 under the
auspices of Operation Desert Shield. The buildup of personnel and equipment continued over the nextseveral months, culminating in the launching of Operation Desert Storm in late February 1991. Aftera period of heavy air assaults, ground troops finally began their offensive movement into Kuwait andIraq, an effort that took only 5 days before the enemy was considered defeated.
Over the seven months of Operations Desert Shield/Desert Storm (ODS/S), more than a half millionAmerican servicemen and servicewomen were sent to the theater of operations. Although projectionsof the number who would become casualties in the event of war were generally quite high, in the finalanalysis 375 Americans lost their lives in turning back the Iraqis. Although any loss of life is tragic,the small number of casualties surprised even some experts who feared that a far greater number of liveswould be lost.
With the advent of 24-hour and international video news sources, ODS/S may have been the mostvisible military operation in history. Americans were bombarded with stories covering every aspect ofthe mobilization, efforts to avoid a direct confrontation, the devastating accuracy of the air assault, andthe rapid advancement of troops that brought the whole stalemate to a close. With all the mediacoverage, it is not surprising that the American people became more familiar with the Service memberswho make up their military and, in the process, some of the issues that confront the military.
Several demographic trends that occurred within the military following the transfer to an AllVolunteer Force (AVF) Were quite evident during ODS/S. For instance, there was (and continues to be)more emphasis placed on retaining military personnel for a longer period of time, and thereby buildingupon the steady base of the career force. Thus, the personnel deployed in ODS/S tended to be older thanthose in past mobilizations, in which there was a greater reliance on 17- and 18-year-old draftees. Also,a concerted effort had been made to enlist more women, and to allow them to serve in a wider varietyof roles than had typically been the case in the past. Although the percentage of women was stillrelatively small compared to the total population of soldiers during ODS/S, their visibility was highbecause they served in a range of nontraditional occupations.
Any type of deployment of military personnel has the potential of separating children from theirparents. With the older ODS/S force, however, this problem became more prevalent because moreService members had children. This situation was exacerbated when it was the mother who was sentoverseas, particularly in the cases of single-parent or dual-military households. As stated by thePresidential Commission on the Assignment of Women to the Armed Forces (1992), "The Americanpublic and military faced the problems of deploying large numbers of single and dual-service parentsfor the first time during the Persian Gulf War." Some 32,000 children were separated from single-parenthouseholds during ODS/S deployment.
Another reality that was evident during the Gulf War was that being away from the front lines wasno guarantee of safety. ODS/S ushered in long-range missiles and other high-tech weapons thatpresented new challenges in military tactics and endangered support personnel operating behind the lines.In fact, 56 percent of the deaths in ODS/S occurred in support operations. Consequently, even womenand/or single parents who were not assigned directly to combat positions remained very much in harm'sway.
A survey commissioned by the President's Commission on the Assignment of Women in the ArmedForces indicated that there is a high degree of sensitivity to the potential problems associated with dual-military couples or single-parent Service members serving in combat. Among the civilian survey
2
respondents, 69 percent stated that they believed that single women with children should not be askedto serve under combat conditions, while 48 percent said that the same should be true for men in thissituation. When asked about families where both the father and mother are in the military, 55 percentof civilians felt that the female should be exempt from combat duty. The responses of military membersto the same questions were similar.
Virtually all of the factors cited above affect troop readiness. An older force with more women,single parents and dependents, and dual-military couples is more difficult to mobilize. Issues such aswhether women and single parents should serve on the front lines further complicate the process, becausethe military must be sensitive to family considerations and public opinion. In addition, the blurring oftraditional battle distinctions (front lines versus behind the lines) places far more military personnel inharm's way. Although past studies on the influence of the family on unit and individual readiness maybe inadequate in the face of the new realities, they do provide some clues as to what those influencesare and how military programs might be structured to accommodate them.
Families and Readiness
Researchers have used a variety of methods to measure individual and unit readiness, but none hasaddressed all aspects of readiness. The most commonly cited measure of unit readiness (used by theJoint Chiefs of Staff) is the Status of Resources and Training System (SORTS). This index includeselements such as the amount and condition of equipment allotted to a unit, the number and type ofpersonnel who make up the unit's ranks, and the amount of training that those personnel have undergone.The factors that influence SORTS account for unit-level readiness, but they give no indication of howoutside factors, such as the family, influence individual readiness.
Several studies have examined the impact of families on individual readiness. More detail on thosestudies can be found in the second report of this series, Individual and Family Readiness for Separationand Deployment (Aldridge, Sturdivant, Smith & Lago, 1996). In summary, it has been found thatsoldiers' perception of how much support the unit leaders have provided their families and how confidentthey feel about how responsibilities are being handled at home tend to affect their combat readiness.Essentially, family status was found to have a significant impact on the combat readiness of individualService members.
Deployments in response to crises such as the Persian Gulf War are unscheduled, and the numberand type of units involved are determined by the situation. Typically, certain units are placed on standbyso that they can respond rapidly if additional personnel are needed. In deployments for a continuingcrisis, the Services must replace or rotate troops. For such arrangements, an attempt is made to providenotice of 2 weeks to 2 months in order to prepare for deployment. The ways in which the Servicesmanage their deployments and the differences in predictability of the advance notice make it difficultto generalize findings across branches. In addition, the demands placed on Service members varytremendously in terms of preparation, length of separation from the family, and degree of dangerinvolved.
A key element in deployment readiness is the preparedness of the military spouse "to assume therole and duties of household head to ensure family functioning during deployment" (Campbell et al.,1991, p. 168). Segal and Harris (1993) reported that family problems at home are the primary reasonfor absent without leave (AWOL) soldiers and for soldiers' concerns while they are separated from their
3

families. These findings suggest that the level of family support that the unit leaders provide has animpact on the members' perceptions that their families are functioning well while they are away.
A spouse's level of readiness and self-sufficiency is affected by concerns about his/her ability toaccess legal documents and power of attorney. The spouse must also know how to access and useservices such as child care, employment assistance, and financial counseling. She or he must beemotionally prepared to manage the family and to make independent decisions. These aspects of spousalreadiness assume that the spouse is also physically able to handle the responsibilities effectively(Campbell et al., 1991). When a Service member perceives that his/her spouse is prepared to face thesechallenges and to function independently during the deployment or separation, the member's level ofindividual readiness improves.
Regardless of how well the individual is prepared for separation, there are likely to be problems andstresses encountered during his/her deployment. Even in situations in which the spouse effectivelyhandles family matters, dealing with the separation tends to be difficult for all involved. For example,one primary problem with deployment involves the amount and accuracy of information received by aspouse or family, especially when the member is deployed to a hostile area. During ODS/S, familiesoften were unable to speak to Service members and, at times, received inaccurate information about thecombat situation. In turn, Service members were unable to provide input regarding problems with childcare, finances, behavioral difficulties among children, and additional family responsibilities (Departmentof Defense, 1993, p. 7-4).
Studies of the actual effects of deployment have largely been confined to peacetime situations.Generally, such studies have shown a pattern of depression on the part of family members prior to andduring the period of separation (Beckman, Marsella, & Finney, 1979). Various factors play a role inwhether and to what extent such depression is experienced, including support from others with absentspouses (Rosen & Moghadam, 1990) and positive attitudes regarding deployment (Archer & Cauthorne,1986).
As might be expected, the effects of deployment tend to be exacerbated when the separated spouseor parent is entering a potentially dangerous environment, such as ODS/S. Navy families separated bydeployment prior to, during, and following ODS/S were the subject of a recent study (Kelley, 1994).Kelley noted that the wives and children of deployed sailors showed signs of stress that were exacerbatedwhen the sailors were assigned to a location in or near the Persian Gulf. The behaviors of mothers andchildren followed slightly different patterns. Wives experienced more depressive symptoms before andduring deployment, but such symptoms disappeared near the end of the separation. The deployedmembers' children showed behavioral problems before, during, and after the deployment. Anecdotalevidence suggested that the children were particularly sensitive to the separation because they did notunderstand all the information they received about activities in the Gulf. The high levels of stressreported in Kelley's study suggest the need for additional support services and, possibly, the availabilityof counseling services.
A similar study by Milgram and Bar (1993) examined the reactions of Israeli soldiers' wives to theirhusbands' hazardous duty deployments. Although the conditions of the Israeli soldiers' deploymentsvaried considerably from those of U.S. soldiers, several useful recommendations for stress reduction weremade that can be generalized for U.S. soldiers and their families. One recommendation was to providereliable and frequent communication between the deployed soldier and his/her family. This process helpsease the family's concerns over the soldier's well-being and safety. In addition, the soldier can be
4
involved in problem-solving regarding minor crises at home. Another recommendation was to encouragethe use of family support and assistance centers.
Financial problems associated with deployment often result from a spouse's lack of experience indealing with budgets. This problem becomes more pronounced when additional expenses (e.g., telephonecharges for calls to deployed Service members and increased child care costs) occur because one parentis absent.
Personnel Programs
Recognizing that the demands of military life (e.g., frequent relocations, separations) are likely toplace extra stress on families, each of the Services has implemented programs designed to supportspouses, children, and Service members as they attempt to cope. For example, the increasing numberof households with dependents has prompted the Services to provide child care through ChildDevelopment Services. Commanders and supervisors who testified before the Presidential Commissionon the Assignment of Women in the Armed Forces indicated that the deployment of single parents anddual-military parents did not pose problems for those individuals. This evidence suggested that theprograms may have served their purpose.
Around the time of ODS/S, however, some problems with the programs became apparent. Forinstance, guidelines concerning the assessment of the welfare of the children of military families werelacking, and no formal outreach programs were in place to offer assistance to care providers. It was notuntil 1992 (after ODS/S) that DoD began to require thorough documentation and verification of FamilyCare Plans, stipulating measures to be taken to ensure the continued viability of the Service member'sfamily in his or her absence.
The importance of the influence of families-and programs to assist families-on military personnelcannot be overstated. ODS/S was unique, among other reasons, because of the policy challenges itpresented. With a more mature cadre of Service members, family responsibilities (especially parenthoodand single parenthood) made the impact of deployment more severe and more complicated to address.The experiences of military families during ODS/S provide information that could be crucial in thedesign and maintenance of support services to strengthen military families in the future and, thereby,increase the commitment and performance of the Service members themselves.
The DoD and the individual Services have added to the body of literature with the 1992 Surveys ofOfficers and Enlisted Personnel and the associated reports. In so doing, they have extended efforts toprepare for deployment contingencies and to prepare troops for quick and smooth departures. The degreeof readiness that actually exists, however, can be determined only in times of actual deployment, suchas during ODS/S. Therefore, the data from the 1992 surveys should provide useful indications as to thetypes of problems military families experienced in a combat situation and, possibly, suggestions formitigating such problems during future operations.
Survey Sample
The 1992 surveys were based on a probability sample of military personnel on active duty as ofDecember 1991. The sample included 40,812 officers and 56,015 enlisted personnel (a total of 96,827members) and was stratified by Service, status (officer or enlisted), and gender. Responses werereceived from 27,684 officers and 32,246 enlisted personnel (59,930 total), which represented a 66
5

percent overall response rate (respondents as a percentage of eligible members). Surveys similar to the1992 surveys were also conducted in 1978 and 1985.
The survey sample included four separate samples: (1) longitudinal, (2) recruiters, (3) members, and(4) Active Guard/Reserve or Training and Administration of the Reserve (AGR/TAR) members.
The stratification scheme, sample sizes, and sample selection approach for each of the four sampleswere similar. All four samples were selected using probability methods; that is, each eligible individualhad a non-zero, known probability of selection. Probability sampling allowed for the projection of thesurvey results to the target population (Service members), using weights developed to reflect variableprobabilities of selection and nonresponse bias. The database used in the analyses for this reportincluded all four samples combined, and all analyses were conducted with the weighted data (seeAppendix A for more detail on sampling, databases, and weighting).
The sampling frames, sample sizes, and stratification corresponding to each of the four samplesselected for the 1992 surveys were as follows:
"The longitudinal sample consisted of a subsample of 11,999 from the personnel selected for the1985 Department of Defense Survey of Officer and Enlisted Personnel who were still in themilitary as of December 1991. The sample maintained the stratification of the 1985 survey (i.e.,Service, officer/enlisted status, and gender).
"• The recruiter sample consisted of 3,999 recruiters, approximately 1,000 per Service.
" The member sample consisted of members on active duty as of December 1991 who had been inthe Service for 4 months or more and were neither recruiters nor included in the 1985 survey. Thesample of 75,345 active military personnel was derived by selecting approximately 5,000 membersfrom each of the 16 cells defined by Service, officer/enlisted status, and gender.
" The AGR/TAR sample included approximately 500 AGR/TAR from each of the 14 cells definedby seven levels of Reserve Component and officer/enlisted status. Some cells had fewer than 500members. A total of 5,484 full-time, support AGR/TAR members were selected.
6
Demographic Profile of the ODS/S Service Force
Analysis Methodology
To compare the population of Service members deployed in ODS/S with the entire force and withthose not deployed, a series of weighted cross-tabulations were first run to determine the proportionsdeployed and not deployed out of the totals for various demographic groups. Categorical variablesrepresenting the demographic groups were available in the data set provided by the DoD, so that novariable creation or combination was required. Chi-square tests were performed to identify significantdifferences between deployed Service members and those not deployed, by gender, race/ethnicity, age,education, pay grade, location of assignment, and family type at the time of the 1992 surveys.
Results
The following are demographic profiles of enlisted personnel and officers who were deployed inODS/S, as compared with those who were not deployed. The demographic characteristics examinedinclude gender, race/ethnicity, age group, education, pay grade, location, and family type.
Enlisted Personnel
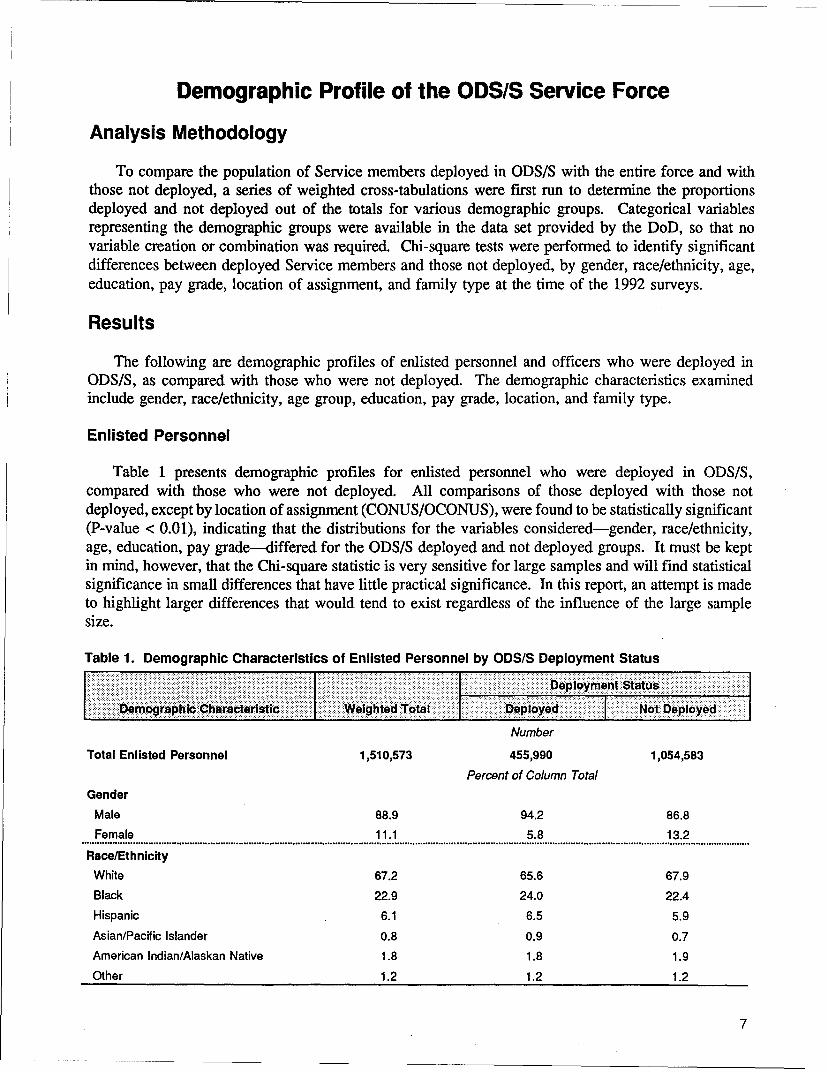
Table 1 presents demographic profiles for enlisted personnel who were deployed in ODS/S,compared with those who were not deployed. All comparisons of those deployed with those notdeployed, except by location of assignment (CONUS/OCONUS), were found to be statistically significant(P-value < 0.01), indicating that the distributions for the variables considered-gender, race/ethnicity,age, education, pay grade---differed for the ODS/S deployed and not deployed groups. It must be keptin mind, however, that the Chi-square statistic is very sensitive for large samples and will find statisticalsignificance in small differences that have little practical significance. In this report, an attempt is madeto highlight larger differences that would tend to exist regardless of the influence of the large samplesize.
Table 1. Demographic Characteristics of Enlisted Personnel by ODS/S Deployment Status
e eploye nt Notat epoyeDemographic Characteristic Weighted Total Deloeplym Not Dtepoe
Number
Total Enlisted Personnel 1,510,573 455,990 1,054,583
Percent of Column Total
GenderMale 88.9 94.2 86.8Female 11.1 5.8 13.2S........ ,...,•°................ ° .......o..°° ........ , ........................ ,°....... °............................... ...............................................................................................................................................
Race/Ethnicity
White 67.2 65.6 67.9
Black 22.9 24.0 22.4
Hispanic 6.1 6.5 5.9Asian/Pacific Islander 0.8 0.9 0.7American Indian/Alaskan Native 1.8 1.8 1.9Other 1.2 1.2 1.2
7

Table 1. Demographic Characteristics of Enlisted Personnel by ODS/S Deployment Status (Continued)
I epl ~oym nt Status
Number
Total Enlisted Personnel 1,510,573 455,990 1,054,583Percent of Column Total
Age Group
21 Years or Younger 18.6 19.4 18.3
22-25 Years 25.8 30.6 23.7
26-34 Years 36.5 35.0 37.2
35-44 Years 17.3 14.0 18.7
45-54 Years 1.7 1.0 2.0
55 Years or Older 0.1 0.0 0.0*S.................................................................................................... ................................. ................ ,................................ •................................................ ............................
Education
Less Than 12 Years 0.3 0.4 0.3
GED or Other Equivalency Certificate 3.3 4.2 2.9
High School Diploma 38.6 45.7 35.5
Some College 42.5 38.3 44.3
Two-Year College Degree 10.0 7.9 10.9
Four-Year College Degree 3.5 2.4 4.0
Some Graduate Schoolor Other Degree Not Listed 1.4 0.9 1.6
Masters Degree 0.4 0.2 0.5
Doctoral Degree 0.0* 0.0* 0.0*............................. ..... ..................... ........................................................o0 " ................................................00" ................................................0 o *.....................Pay Grade
El to E4 47.9 52.7 45.8
E5 to E6 39.1 36.9 40.1
E7 to E9 13,0 10.4 14.1
Location
CONUS 70.4 72.8 69.4
OCONUS 29.6 27.2 30.6
Family Type
Single, No Dependents 29.8 32.9 28.5
Single with Dependents 6.4 5.4 6.8
Dual-Military, No Dependents 3.1 2.5 3.3
Dual-Military with Dependents 5.1 3.9 5.7
Civilian Spouse, No Dependents 11.3 10.9 11.4
Civilian Spouse with Dependents 44.3 44.4 44.3*Less than 0.05 percent.
Notes: Weighted percentages were computed as the proportion of the estimated totals shown in the first data row. Totalsmay differ slightly across tables because of missing data and rounding.
8

Gender. As has been the case historically, women remain under-represented throughout the enlistedpersonnel ranks as compared with the total U.S. population. This result was even more evident withinthe ODS/S deployed forces. Although women represented 13.2 percent of enlisted personnel notdeployed for ODS/S, they represented only 5.8 percent of those deployed. Perhaps this discrepancy isdue in part to the military's reluctance to place women in situations where they could be in harm's way.
Race/ethnicity. The estimated proportion of Blacks among all enlisted personnel (22.9 percent) andamong those deployed in ODS/S is notably high (24.0 percent) and consistent with a wealth ofdocumentation on the over-representation of this minority group in the military. Hispanics are presentin a slightly higher proportion among those deployed in ODS/S than among those not deployed (6.5percent and 5.9 percent, respectively). In general, however, the percentages of different racial/ethnicgroups among those deployed are similar to the percentages among those not deployed.
Age. The age distribution of enlisted personnel shown in Table 1 indicates that the most significantdifference between deployed and not deployed personnel was that the deployed forces had a higherproportion of 22- to 25-year-olds (30.6 percent) and a lower proportion of 35- to 44-year-olds (14.0percent) than those not deployed (23.7 percent and 18.7 percent, respectively).
Education. Nearly all enlisted personnel possess at least a high school diploma, which appears to reflectthe military's commitment to education. However, those with education higher than a high schooldiploma were a smaller proportion of those deployed in ODS/S (49.7 percent) than of those not deployed(61.3 percent).
Pay grade. The majority (52.7 percent) of those deployed were in the lowest pay grades (El toE4)-significantly higher than the proportion of all enlisted personnel in those pay grades. In contrast,only 45.8 percent of those not deployed were in pay grades El to E4. This result is consistent with theresults for education, since college graduates, who tended to be in the higher pay grades, were under-represented among those deployed.
Location. At the time of the 1992 surveys, the majority (about 70 percent) of all enlisted personnel wereserving within the continental United States (CONUS). The percentages of CONUS personnel weresimilar for the deployed and not deployed forces (73 percent and 69 percent, respectively).
Family type. Among enlisted personnel who were not deployed in ODS/S, the most common family typewas member married to civilian spouse with dependents (44.3 percent), followed by single member withno dependents (28.5 percent). Corresponding figures were about the same for those deployed in ODS/S,at 44.4 percent and 32.9 percent, respectively. An interesting result was that single Service memberswith dependents and Service members in dual-military families with dependents were under-represented(relative to the overall enlisted population) among the ODS/S deployed group. This result suggests thatthe military sought to protect these vulnerable and hard-to-mobilize groups by not sending them to thePersian Gulf in large numbers.
9
Officers
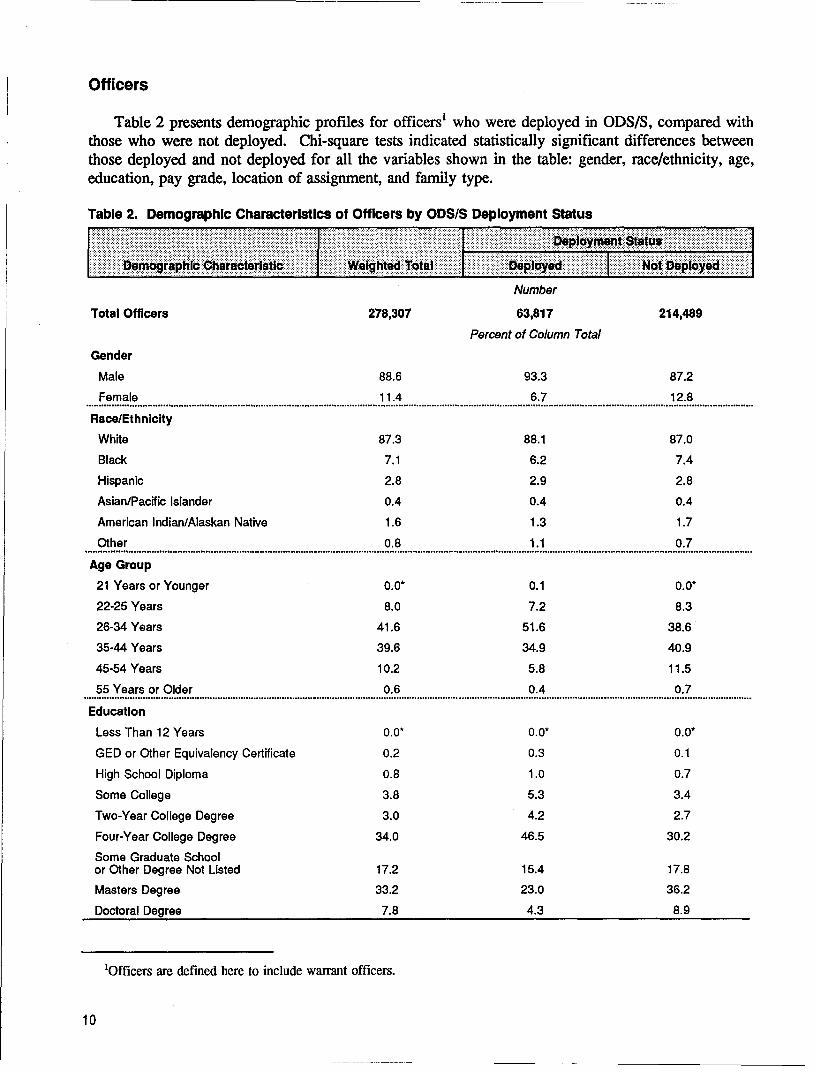
Table 2 presents demographic profiles for officers' who were deployed in ODS/S, compared withthose who were not deployed. Chi-square tests indicated statistically significant differences betweenthose deployed and not deployed for all the variables shown in the table: gender, race/ethnicity, age,education, pay grade, location of assignment, and family type.
Table 2. Demographic Characteristics of Officers by ODS/S Deployment Status
I .. i i .. t..t...
Number
Total Officers 278,307 63,817 214,489
Percent of Column Total
Gender
Mate 88.6 93.3 87.2
Female 11.4 6.7 12.8
Race/Ethnicity
White 87.3 88.1 87.0
Black 7.1 6.2 7.4
Hispanic 2.8 2.9 2.8
Asian/Pacific Isiander 0.4 0.4 0.4
American Indian/Alaskan Native 1.6 1.3 1.7
Other 0.8 1.1 0.7
Age Group
21 Years or Younger 0.0* 0.1 0.0*
22-25 Years 8.0 7.2 8.3
26-34 Years 41.6 51.6 38.6
35-44 Years 39.6 34.9 40.9
45-54 Years 10.2 5.8 11.5
55 Years or Older 0.6 0.4 0.7
Education
Less Than 12 Years 0.0* 0.0* 0.0"
GED or Other Equivalency Certificate 0.2 0.3 0.1
High School Diploma 0.8 1.0 0.7
Some College 3.8 5.3 3.4
Two-Year College Degree 3.0 4.2 2.7
Four-Year College Degree 34.0 46.5 30.2
Some Graduate Schoolor Other Degree Not Listed 17.2 15.4 17.8
Masters Degree 33.2 23.0 36.2
Doctoral Degree 7.8 4.3 8.9
'Officers are defined here to include warrant officers.
10
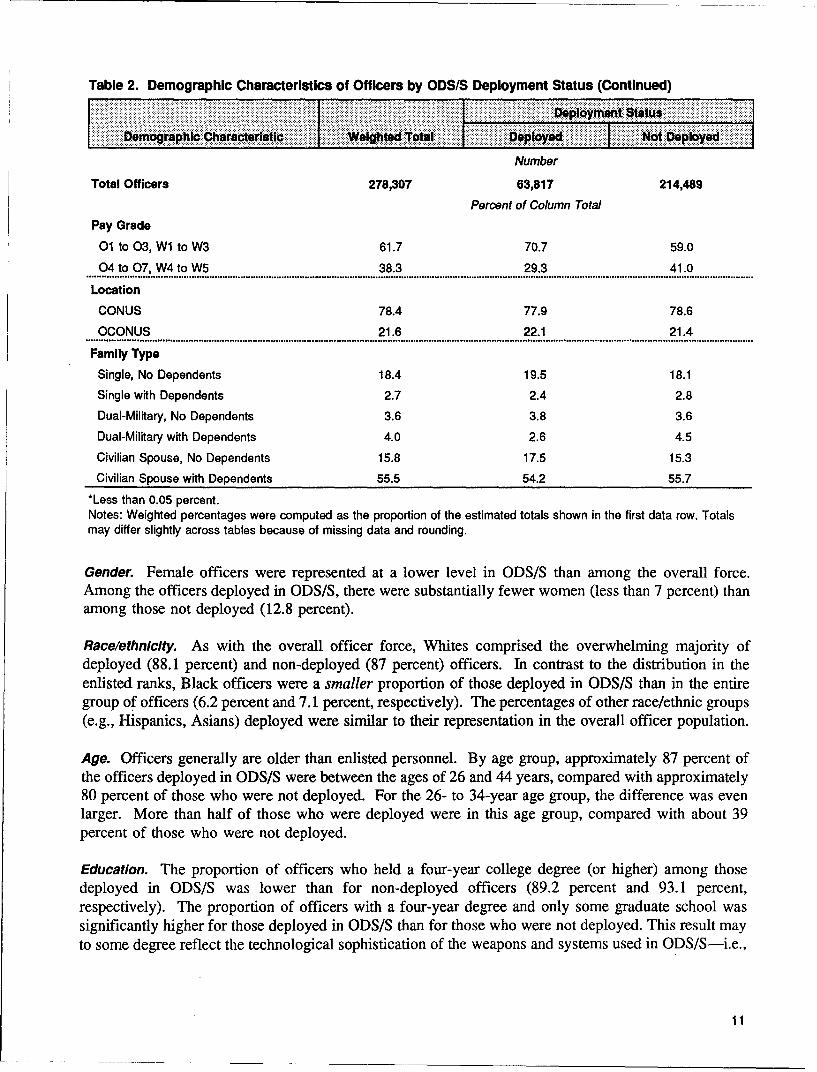
Table 2. Demographic Characteristics of Officers by ODS/S Deployment Status (Continued)
Number
Total Officers 278,307 63,817 214,489
Percent of Column Total
Pay Grade
01 to 03, Wi to W3 61.7 70.7 59.0
04 to 07, W4 to W5 38.3 29.3 41.0
Location
CONUS 78.4 77.9 78.6
OCONUS 21.6 22.1 21.4
Famiiy Type
Single, No Dependents 18.4 19.5 18.1
Single with Dependents 2.7 2.4 2.8
Dual-Military, No Dependents 3.6 3.8 3.6
Dual-Military with Dependents 4.0 2.6 4.5
Civilian Spouse, No Dependents 15.8 17.5 15.3
Civilian Spouse with Dependents 55.5 54.2 55.7*Less than 0.05 percent.
Notes: Weighted percentages were computed as the proportion of the estimated totals shown in the first data row. Totalsmay differ slightly across tables because of missing data and rounding.
Gender. Female officers were represented at a lower level in ODS/S than among the overall force.Among the officers deployed in ODS/S, there were substantially fewer women (less than 7 percent) thanamong those not deployed (12.8 percent).
Race/ethnicity. As with the overall officer force, Whites comprised the overwhelming majority ofdeployed (88.1 percent) and non-deployed (87 percent) officers. In contrast to the distribution in theenlisted ranks, Black officers were a smaller proportion of those deployed in ODS/S than in the entiregroup of officers (6.2 percent and 7.1 percent, respectively). The percentages of other race/ethnic groups(e.g., Hispanics, Asians) deployed were similar to their representation in the overall officer population.
Age. Officers generally are older than enlisted personnel. By age group, approximately 87 percent ofthe officers deployed in ODS/S were between the ages of 26 and 44 years, compared with approximately
80 percent of those who were not deployed. For the 26- to 34-year age group, the difference was evenlarger. More than half of those who were deployed were in this age group, compared with about 39percent of those who were not deployed.
Education. The proportion of officers who held a four-year college degree (or higher) among thosedeployed in ODS/S was lower than for non-deployed officers (89.2 percent and 93.1 percent,respectively). The proportion of officers with a four-year degree and only some graduate school wassignificantly higher for those deployed in ODS/S than for those who were not deployed. This result mayto some degree reflect the technological sophistication of the weapons and systems used in ODS/S--i.e.,
11
officers with a four-year degrees in technical fields were needed to man the complex array of missiles,telecommunications gear, and other high-technology equipment.
Pay grade. Almost three-quarters (approximately 71 percent) of deployed officers were in the lower paygrades (01 through 03). In contrast, only 59 percent of those not deployed were in the lower paygrades.
Location. As with the enlisted force, the majority of officers were in CONUS locations in 1992. Therewere, however, no significant differences in CONUS/OCONUS assignment locations for officers whowere deployed in ODS/S and those who were not deployed.
Family type. As seen for enlisted personnel, the most common family type among officers in 1992 wasmember with civilian spouse and dependents (55.5 percent), followed by single member with nodependents (18.4 percent). In the deployed group, the family types that included dependents were under-represented. Officers with dependents, particularly those who also had a military spouse, were sent inproportionately smaller numbers than those without dependents.
12
Barriers to Readiness
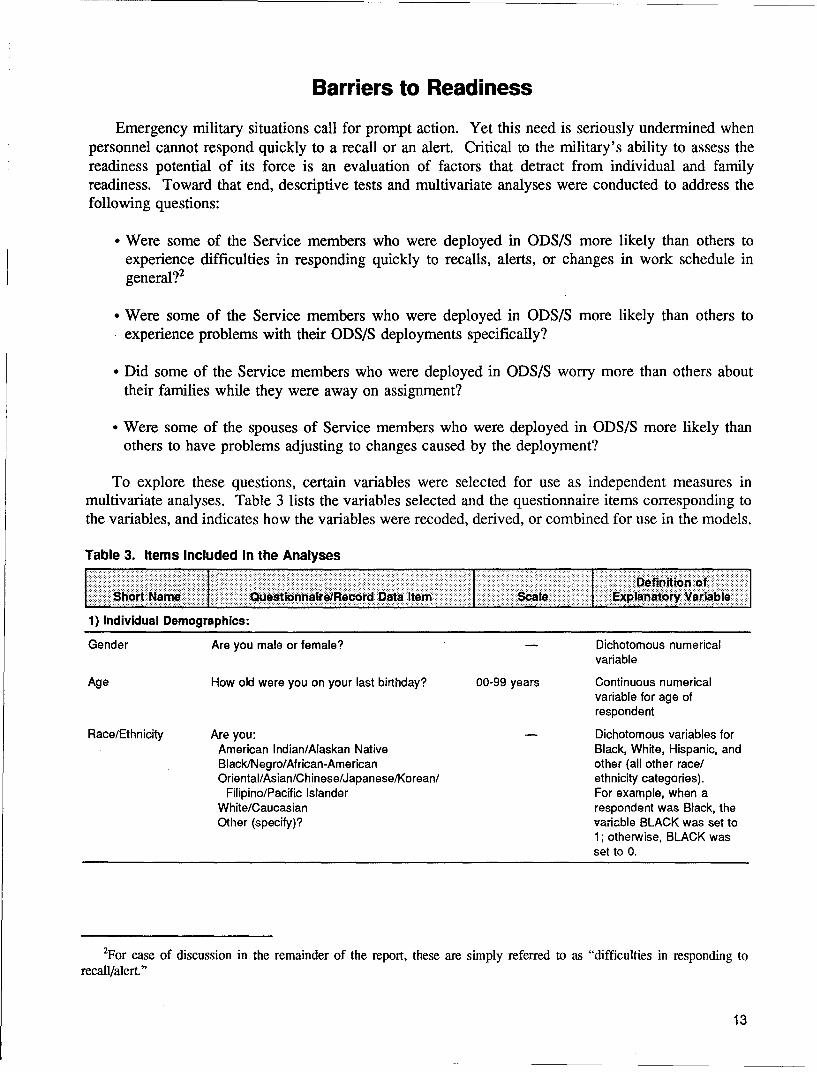
Emergency military situations call for prompt action. Yet this need is seriously undermined whenpersonnel cannot respond quickly to a recall or an alert. Critical to the military's ability to assess thereadiness potential of its force is an evaluation of factors that detract from individual and familyreadiness. Toward that end, descriptive tests and multivariate analyses were conducted to address thefollowing questions:
Were some of the Service members who were deployed in ODS/S more likely than others toexperience difficulties in responding quickly to recalls, alerts, or changes in work schedule ingeneral?2
• Were some of the Service members who were deployed in ODS/S more likely than others toexperience problems with their ODS/S deployments specifically?
• Did some of the Service members who were deployed in ODS/S worry more than others abouttheir families while they were away on assignment?
* Were some of the spouses of Service members who were deployed in ODS/S more likely thanothers to have problems adjusting to changes caused by the deployment?
To explore these questions, certain variables were selected for use as independent measures inmultivariate analyses. Table 3 lists the variables selected and the questionnaire items corresponding tothe variables, and indicates how the variables were recoded, derived, or combined for use in the models.
Table 3. Items Included in the Analyses
I I I Definition ofShort Name- I Questionnaire/Record Data Item Sae.Explanatory Variable
1) Individual Demographics:
Gender Are you male or female? - Dichotomous numericalvariable
Age How old were you on your last birthday? 00-99 years Continuous numericalvariable for age ofrespondent
Race/Ethnicity Are you: Dichotomous variables forAmerican Indian/Alaskan Native Black, White, Hispanic, andBlack/Negro/African-American other (all other race/Oriental/Asian/Chinese/Japanese/Korean/ ethnicity categories).
Filipino/Pacific Islander For example, when aWhite/Caucasian respondent was Black, theOther (specify)? variable BLACK was set to
1; otherwise, BLACK wasset to 0.
2For ease of discussion in the remainder of the report, these are simply referred to as "difficulties in responding torecall/alert."
13
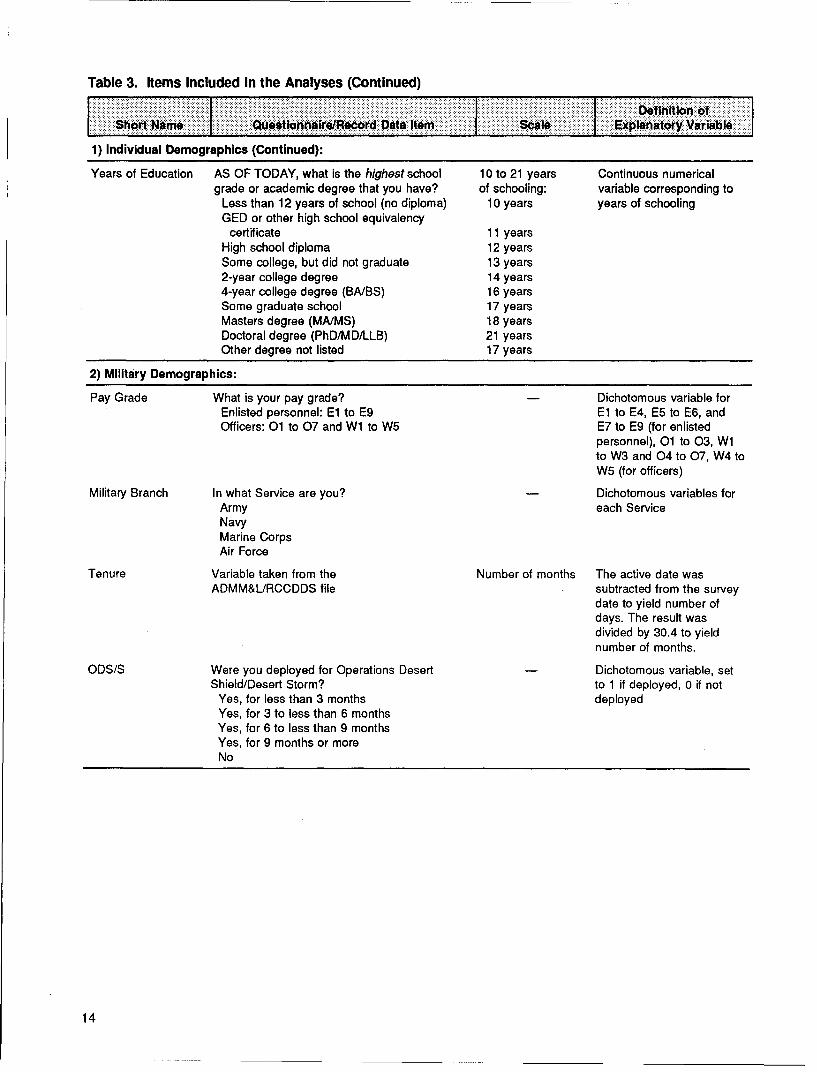
Table 3. Items Included In the Analyses (Continued)
Definition ofNhr:amn Questionnaire/Rcord Date Itale Explanatory Variable
1) Individual Demographics (Continued):
Years of Education AS OF TODAY, what is the highest school 10 to 21 years Continuous numericalgrade or academic degree that you have? of schooling: variable corresponding to
Less than 12 years of school (no diploma) 10 years years of schoolingGED or other high school equivalency
certificate 11 yearsHigh school diploma 12 yearsSome college, but did not graduate 13 years2-year college degree 14 years4-year college degree (BA/BS) 16 yearsSome graduate school 17 yearsMasters degree (MA/MS) 18 yearsDoctoral degree (PhD/MD/LLB) 21 yearsOther degree not listed 17 years
2) Military Demographics:
Pay Grade What is your pay grade? - Dichotomous variable forEnlisted personnel: El to E9 El to E4, E5 to E6, andOfficers: 01 to 07 and W1 to W5 E7 to E9 (for enlisted
personnel), 01 to 03, W1to W3 and 04 to 07, W4 toW5 (for officers)
Military Branch In what Service are you? Dichotomous variables forArmy each ServiceNavyMarine CorpsAir Force
Tenure Variable taken from the Number of months The active date wasADMM&L/RCCDDS file subtracted from the survey
date to yield number ofdays. The result wasdivided by 30.4 to yieldnumber of months.
ODS/S Were you deployed for Operations Desert Dichotomous variable, setShield/Desert Storm? to 1 if deployed, 0 if not
Yes, for less than 3 months deployedYes, for 3 to less than 6 monthsYes, for 6 to less than 9 monthsYes, for 9 months or moreNo
14
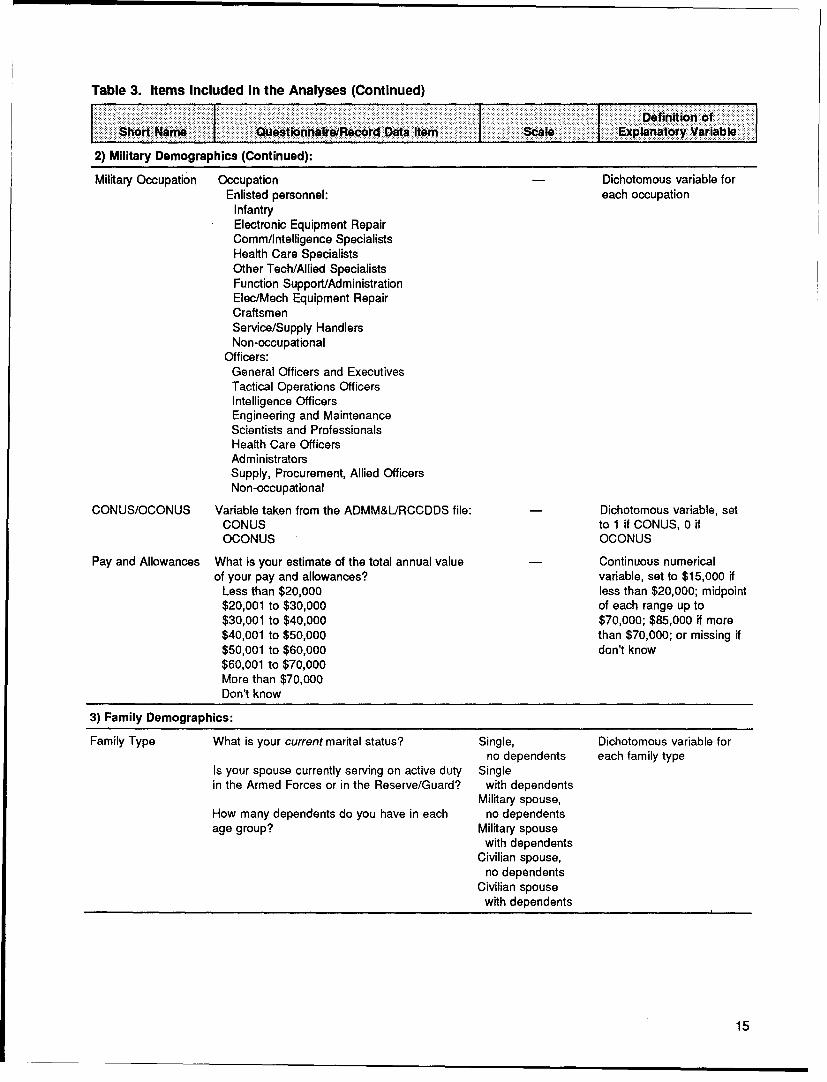
Table 3. Items Included in the Analyses (Continued)
I I Definlition ofShort N .me, uestionnalra/Record :Data Item SaeEpaaoyVral
2) Military Demographics (Continued):
Military Occupation Occupation Dichotomous variable forEnlisted personnel: each occupation
InfantryElectronic Equipment RepairComm/Intelligence SpecialistsHealth Care SpecialistsOther Tech/Allied SpecialistsFunction Support/AdministrationElec/Mech Equipment RepairCraftsmenService/Supply HandlersNon-occupational
Officers:General Officers and ExecutivesTactical Operations OfficersIntelligence OfficersEngineering and MaintenanceScientists and ProfessionalsHealth Care OfficersAdministratorsSupply, Procurement, Allied OfficersNon-occupational
CONUS/OCONUS Variable taken from the ADMM&LIRCCDDS file: Dichotomous variable, setCONUS to 1 if CONUS, 0 ifOCONUS OCONUS
Pay and Allowances What is your estimate of the total annual value Continuous numericalof your pay and allowances? variable, set to $15,000 if
Less than $20,000 less than $20,000; midpoint$20,001 to $30,000 of each range up to$30,001 to $40,000 $70,000; $85,000 if more$40,001 to $50,000 than $70,000; or missing if$50,001 to $60,000 don't know$60,001 to $70,000More than $70,000Don't know
3) Family Demographics:
Family Type What is your current marital status? Single, Dichotomous variable forno dependents each family type
Is your spouse currently serving on active duty Singlein the Armed Forces or in the Reserve/Guard? with dependents
Military spouse,How many dependents do you have in each no dependentsage group? Military spouse
with dependentsCivilian spouse,
no dependentsCivilian spouse
with dependents
15
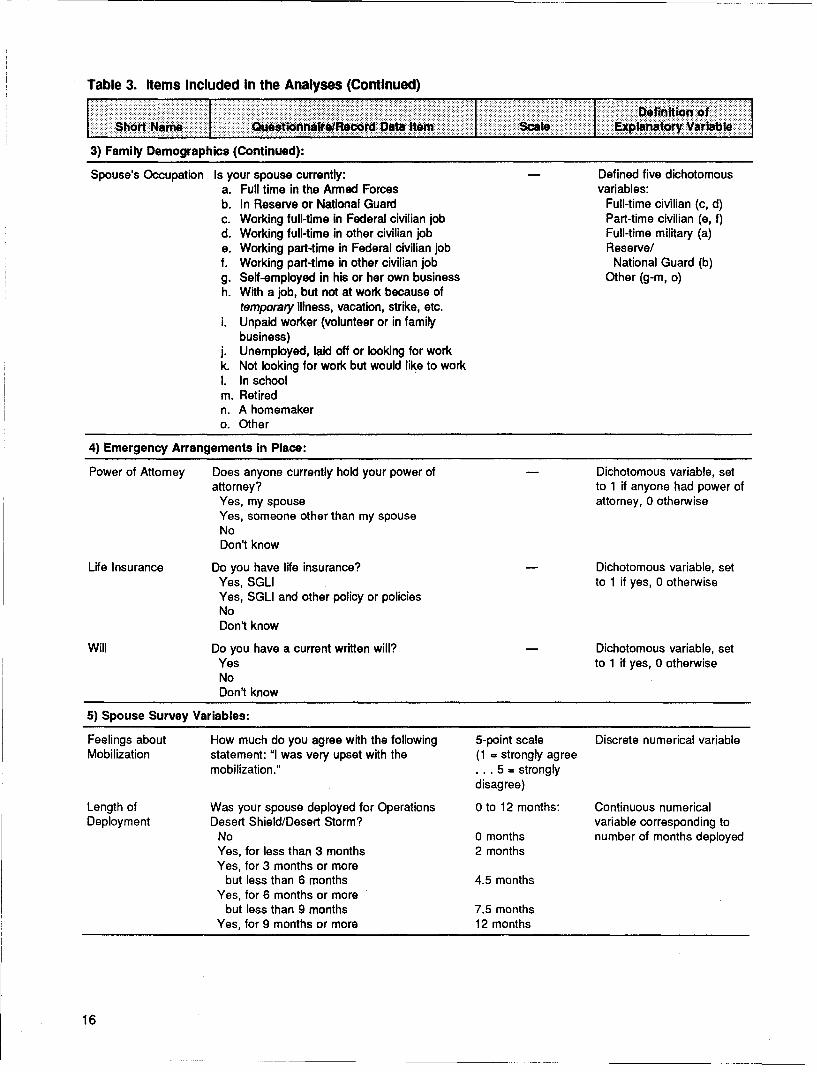
Table 3. Items Included In the Analyses (Continued)
II Definition of.:Short Niame j Quostionnalrelflecord' Dtater scale Explan~atory Variable
3) Family Demographics (Continued):
Spouse's Occupation Is your spouse currently: Defined five dichotomousa. Full time in the Armed Forces variables:b. In Reserve or National Guard Full-time civilian (c, d)c. Working full-time in Federal civilian job Part-time civilian (e, f)d. Working full-time in other civilian job Full-time military (a)e. Working part-time in Federal civilian job Reserve/f. Working part-time in other civilian job National Guard (b)g. Self-employed in his or her own business Other (g-m, o)h. With a job, but not at work because of
temporary illness, vacation, strike, etc.i. Unpaid worker (volunteer or in family
business)j. Unemployed, laid off or looking for workk. Not looking for work but would like to workI. In schoolm. Retiredn. A homemakero. Other
4) Emergency Arrangements in Place:
Power of Attorney Does anyone currently hold your power of - Dichotomous variable, setattorney? to 1 if anyone had power of
Yes, my spouse attorney, 0 otherwiseYes, someone other than my spouseNoDon't know
Life Insurance Do you have life insurance? Dichotomous variable, setYes, SGLI to 1 if yes, 0 otherwiseYes, SGLI and other policy or policiesNoDon't know
Will Do you have a current written will? Dichotomous variable, setYes to 1 if yes, 0 otherwiseNoDon't know
5) Spouse Survey Variables:
Feelings about How much do you agree with the following 5-point scale Discrete numerical variableMobilization statement: "I was very upset with the (1 = strongly agree
mobilization." ... 5 = stronglydisagree)
Length of Was your spouse deployed for Operations 0 to 12 months: Continuous numericalDeployment Desert Shield/Desert Storm? variable corresponding to
No 0 months number of months deployedYes, for less than 3 months 2 monthsYes, for 3 months or more
but less than 6 months 4.5 monthsYes, for 6 months or more
but less than 9 months 7.5 monthsYes, for 9 months or more 12 months
16
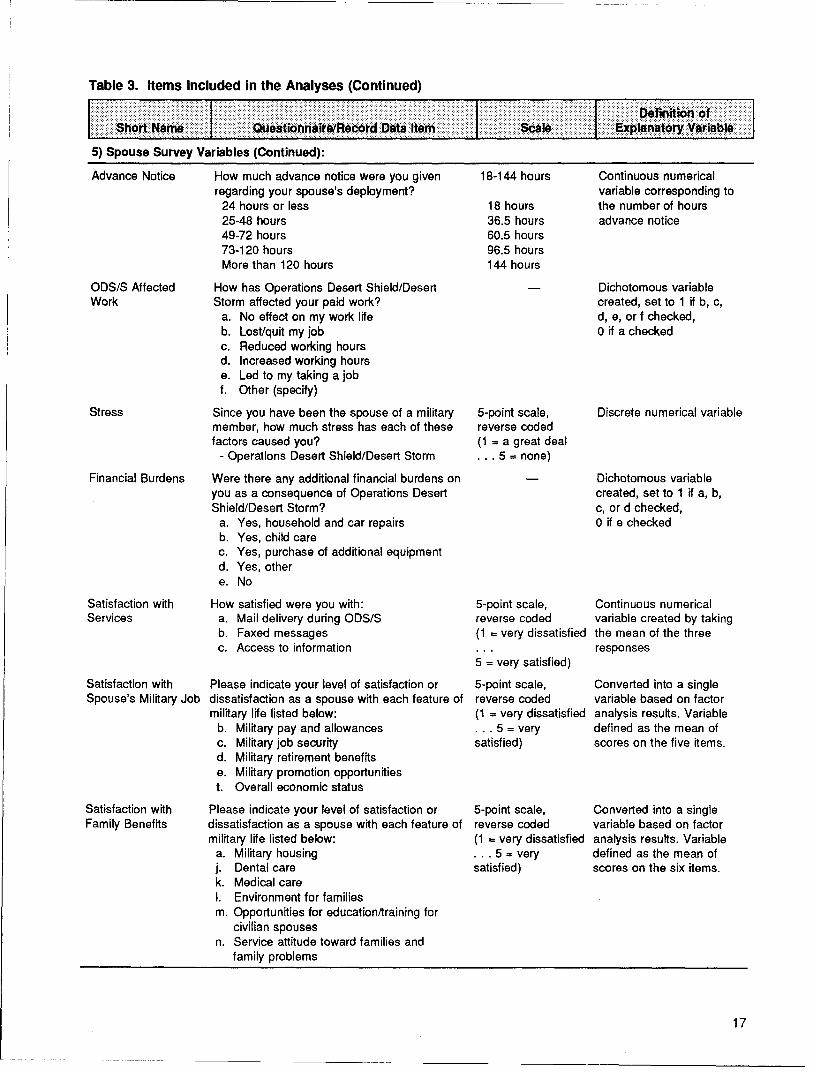
Table 3. Items Included in the Analyses (Continued)
I I I Definition ofShort ,Name Questionnairu/Roccord Data IeSaeEXpnaoyVrbl
5) Spouse Survey Variables (Continued):
Advance Notice How much advance notice were you given 18-144 hours Continuous numericalregarding your spouse's deployment? variable corresponding to
24 hours or less 18 hours the number of hours25-48 hours 36.5 hours advance notice49-72 hours 60.5 hours73-120 hours 96.5 hoursMore than 120 hours 144 hours
ODS/S Affected How has Operations Desert Shield/Desert Dichotomous variableWork Storm affected your paid work? created, set to 1 if b, c,
a. No effect on my work life d, e, or f checked,b. Lost/quit my job 0 if a checkedc. Reduced working hoursd. Increased working hourse. Led to my taking a jobf. Other (specify)
Stress Since you have been the spouse of a military 5-point scale, Discrete numerical variablemember, how much stress has each of these reverse codedfactors caused you? (1 = a great deal
- Operations Desert Shield/Desert Storm ... 5 = none)
Financial Burdens Were there any additional financial burdens on Dichotomous variableyou as a consequence of Operations Desert created, set to 1 if a, b,Shield/Desert Storm? c, or d checked,
a. Yes, household and car repairs 0 if e checkedb. Yes, child carec. Yes, purchase of additional equipmentd. Yes, othere. No
Satisfaction with How satisfied were you with: 5-point scale, Continuous numericalServices a. Mail delivery during ODS/S reverse coded variable created by taking
b. Faxed messages (1 = very dissatisfied the mean of the threec. Access to information ... responses
5 = very satisfied)
Satisfaction with Please indicate your level of satisfaction or 5-point scale, Converted into a singleSpouse's Military Job dissatisfaction as a spouse with each feature of reverse coded variable based on factor
military life listed below: (1 = very dissatisfied analysis results. Variableb. Military pay and allowances ... 5 = very defined as the mean ofc. Military job security satisfied) scores on the five items.d. Military retirement benefitse. Military promotion opportunitiest. Overall economic status
Satisfaction with Please indicate your level of satisfaction or 5-point scale, Converted into a singleFamily Benefits dissatisfaction as a spouse with each feature of reverse coded variable based on factor
military life listed below: (1 = very dissatisfied analysis results. Variablea. Military housing ... 5 = very defined as the mean ofj. Dental care satisfied) scores on the six items.k. Medical careI. Environment for familiesm. Opportunities for education/training for
civilian spousesn. Service attitude toward families and
family problems
17
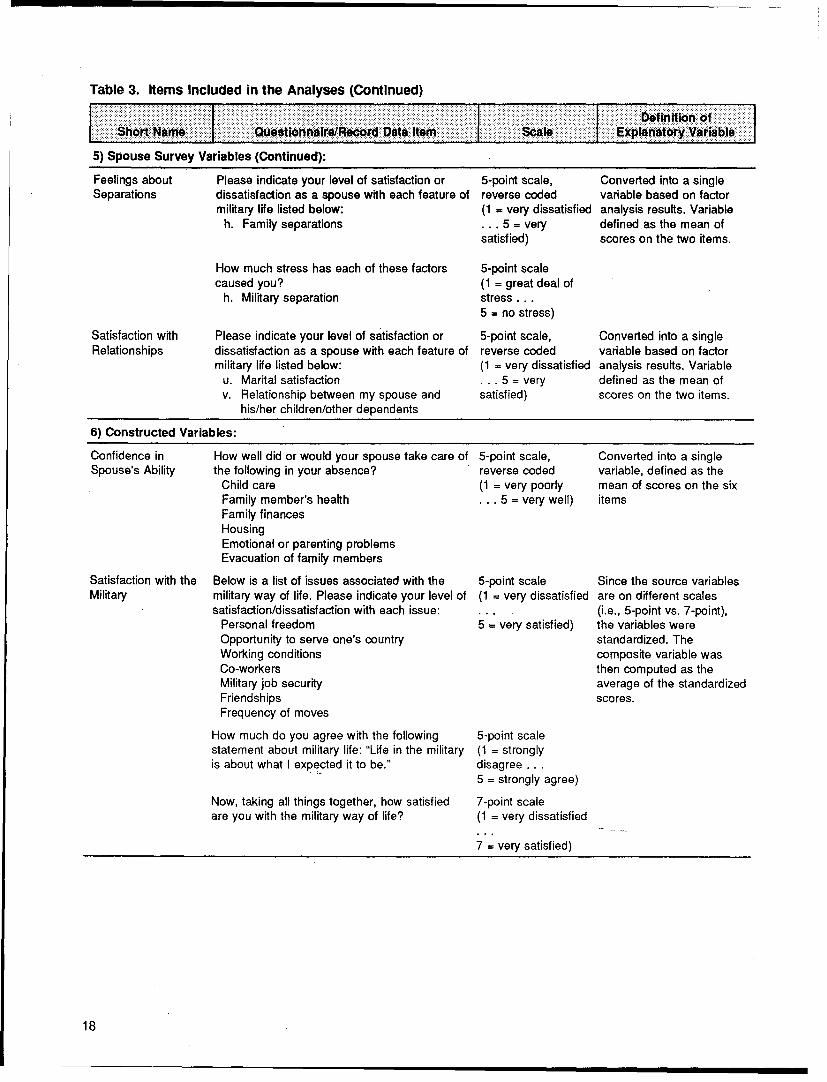
Table 3. Items Included in the Analyses (Continued)
Definition ofShortt Name QusinileRcr aaItem Scale Explanatory Variable
5) Spouse Survey Variables (Continued):
Feelings about Please indicate your level of satisfaction or 5-point scale, Converted into a singleSeparations dissatisfaction as a spouse with each feature of reverse coded variable based on factor
military life listed below: (1 = very dissatisfied analysis results. Variableh. Family separations ... 5 = very defined as the mean of
satisfied) scores on the two items.
How much stress has each of these factors 5-point scalecaused you? (1 = great deal of
h. Military separation stress...5 = no stress)
Satisfaction with Please indicate your level of satisfaction or 5-point scale, Converted into a singleRelationships dissatisfaction as a spouse with each feature of reverse coded variable based on factor
military life listed below: (1 = very dissatisfied analysis results. Variableu. Marital satisfaction ... 5 = very defined as the mean ofv. Relationship between my spouse and satisfied) scores on the two items.
his/her children/other dependents
6) Constructed Variables:
Confidence in How well did or would your spouse take care of 5-point scale, Converted into a singleSpouse's Ability the following in your absence? reverse coded variable, defined as the
Child care (1 = very poorly mean of scores on the sixFamily member's health ... 5 = very well) itemsFamily financesHousingEmotional or parenting problemsEvacuation of family members
Satisfaction with the Below is a list of issues associated with the 5-point scale Since the source variablesMilitary military way of life. Please indicate your level of (1 = very dissatisfied are on different scales
satisfaction/dissatisfaction with each issue: ... (i.e., 5-point vs. 7-point),Personal freedom 5 = very satisfied) the variables wereOpportunity to serve one's country standardized. TheWorking conditions composite variable wasCo-workers then computed as theMilitary job security average of the standardizedFriendships scores.Frequency of moves
How much do you agree with the following 5-point scalestatement about military life: "Life in the military (1 = stronglyis about what I expected it to be." disagree ...
5 = strongly agree)
Now, taking all things together, how satisfied 7-point scaleare you with the military way of life? (1 = very dissatisfied
7 = very satisfied)
18
Difficulties in Responding to Recall/Alert
Analysis Methodology
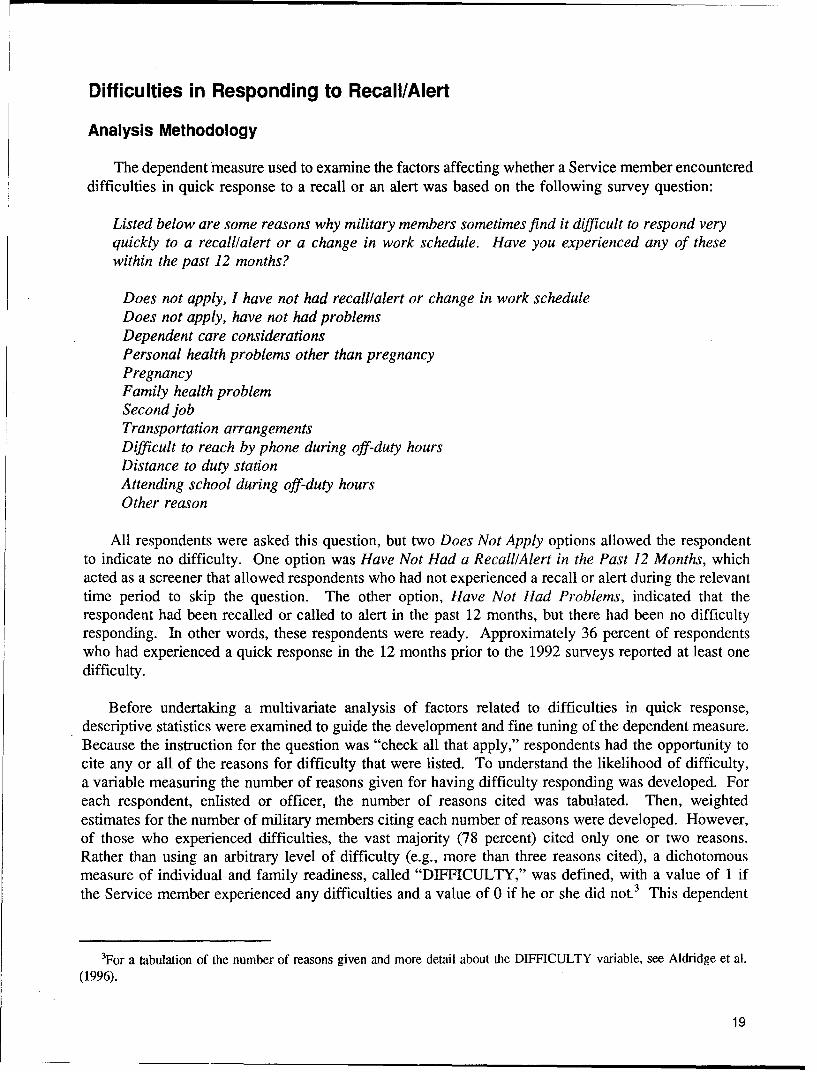
The dependent measure used to examine the factors affecting whether a Service member encountereddifficulties in quick response to a recall or an alert was based on the following survey question:
Listed below are some reasons why military members sometimes find it difficult to respond veryquickly to a recall/alert or a change in work schedule. Have you experienced any of thesewithin the past 12 months?
Does not apply, I have not had recall/alert or change in work scheduleDoes not apply, have not had problemsDependent care considerationsPersonal health problems other than pregnancyPregnancyFamily health problemSecond jobTransportation arrangementsDifficult to reach by phone during off-duty hoursDistance to duty stationAttending school during off-duty hoursOther reason
All respondents were asked this question, but two Does Not Apply options allowed the respondentto indicate no difficulty. One option was Have Not Had a Recall/Alert in the Past 12 Months, whichacted as a screener that allowed respondents who had not experienced a recall or alert during the relevanttime period to skip the question. The other option, Have Not Had Problems, indicated that therespondent had been recalled or called to alert in the past 12 months, but there had been no difficultyresponding. In other words, these respondents were ready. Approximately 36 percent of respondentswho had experienced a quick response in the 12 months prior to the 1992 surveys reported at least onedifficulty.
Before undertaking a multivariate analysis of factors related to difficulties in quick response,descriptive statistics were examined to guide the development and fine tuning of the dependent measure.Because the instruction for the question was "check all that apply," respondents had the opportunity tocite any or all of the reasons for difficulty that were listed. To understand the likelihood of difficulty,a variable measuring the number of reasons given for having difficulty responding was developed. Foreach respondent, enlisted or officer, the number of reasons cited was tabulated. Then, weightedestimates for the number of military members citing each number of reasons were developed. However,of those who experienced difficulties, the vast majority (78 percent) cited only one or two reasons.Rather than using an arbitrary level of difficulty (e.g., more than three reasons cited), a dichotomousmeasure of individual and family readiness, called "DIFFICULTY," was defined, with a value of 1 ifthe Service member experienced any difficulties and a value of 0 if he or she did not.3 This dependent
3For a tabulation of the number of reasons given and more detail about the DIFFICULTY variable, see Aldridge et al.(1996).
19
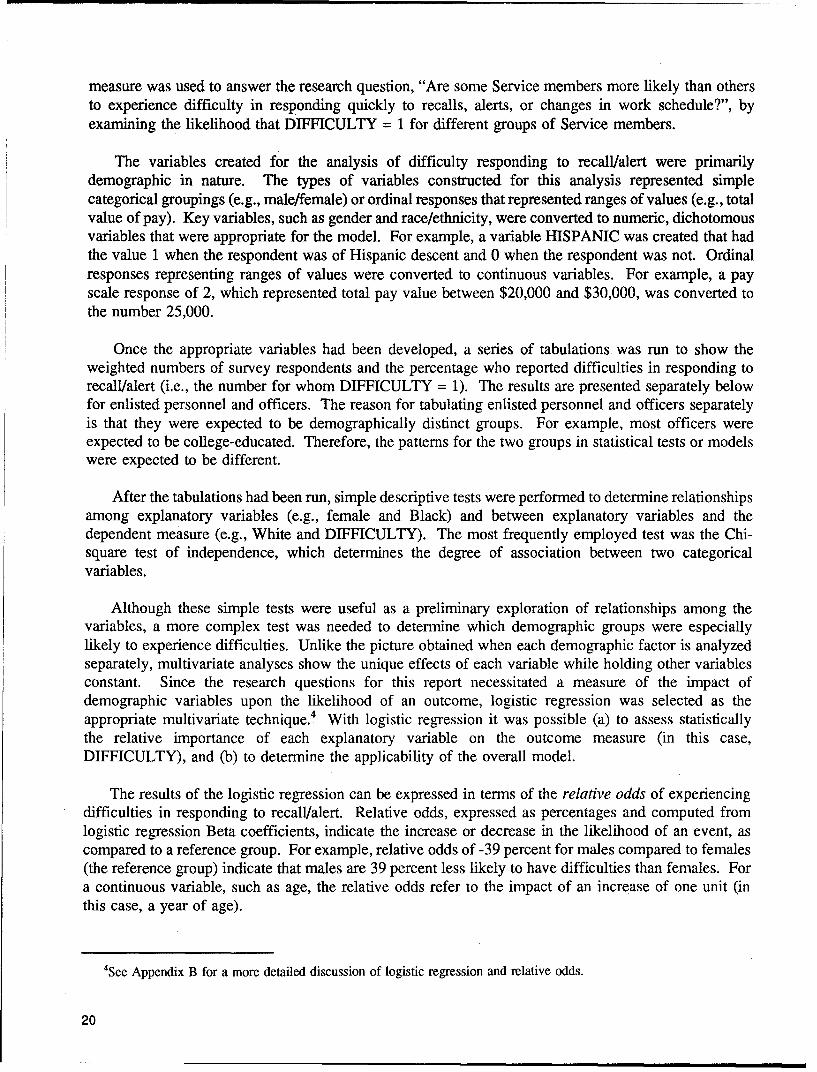
measure was used to answer the research question, "Are some Service members more likely than othersto experience difficulty in responding quickly to recalls, alerts, or changes in work schedule?", byexamining the likelihood that DIFFICULTY = 1 for different groups of Service members.
The variables created for the analysis of difficulty responding to recall/alert were primarilydemographic in nature. The types of variables constructed for this analysis represented simplecategorical groupings (e.g., male/female) or ordinal responses that represented ranges of values (e.g., totalvalue of pay). Key variables, such as gender and race/ethnicity, were converted to numeric, dichotomousvariables that were appropriate for the model. For example, a variable HISPANIC was created that hadthe value 1 when the respondent was of Hispanic descent and 0 when the respondent was not. Ordinalresponses representing ranges of values were converted to continuous variables. For example, a payscale response of 2, which represented total pay value between $20,000 and $30,000, was converted tothe number 25,000.
Once the appropriate variables had been developed, a series of tabulations was run to show theweighted numbers of survey respondents and the percentage who reported difficulties in responding torecall/alert (i.e., the number for whom DIFFICULTY = 1). The results are presented separately belowfor enlisted personnel and officers. The reason for tabulating enlisted personnel and officers separatelyis that they were expected to be demographically distinct groups. For example, most officers wereexpected to be college-educated. Therefore, the patterns for the two groups in statistical tests or modelswere expected to be different.
After the tabulations had been run, simple descriptive tests were performed to determine relationshipsamong explanatory variables (e.g., female and Black) and between explanatory variables and thedependent measure (e.g., White and DIFFICULTY). The most frequently employed test was the Chi-square test of independence, which determines the degree of association between two categoricalvariables.
Although these simple tests were useful as a preliminary exploration of relationships among thevariables, a more complex test was needed to determine which demographic groups were especiallylikely to experience difficulties. Unlike the picture obtained when each demographic factor is analyzedseparately, multivariate analyses show the unique effects of each variable while holding other variablesconstant. Since the research questions for this report necessitated a measure of the impact ofdemographic variables upon the likelihood of an outcome, logistic regression was selected as theappropriate multivariate technique.4 With logistic regression it was possible (a) to assess statisticallythe relative importance of each explanatory variable on the outcome measure (in this case,DIFFICULTY), and (b) to determine the applicability of the overall model.
The results of the logistic regression can be expressed in terms of the relative odds of experiencingdifficulties in responding to recall/alert. Relative odds, expressed as percentages and computed fromlogistic regression Beta coefficients, indicate the increase or decrease in the likelihood of an event, ascompared to a reference group. For example, relative odds of -39 percent for males compared to females(the reference group) indicate that males are 39 percent less likely to have difficulties than females. Fora continuous variable, such as age, the relative odds refer to the impact of an increase of one unit (inthis case, a year of age).
4See Appendix B for a more detailed discussion of logistic regression and relative odds.
20
Results of the simple descriptive tests were useful to guide development of the logistic regressionmodel. Chi-square analysis indicated that certain sets of demographic variables were related statisticallyand therefore could be grouped together for analysis purposes. These groupings provided for asystematic approach to building the model, rather than randomly picking explanatory variables forinclusion. The groupings had the additional benefit of being able to distinguish between individualfactors related to readiness, which earlier studies had focused upon, and family factors, for which the1992 surveys could offer more comprehensive analysis.
Three sets of explanatory (independent) demographic variables--individual, military, and family-were used to develop a sequential, or hierarchical, model. The following variables were used: individualdemographics-gender, age, race/ethnicity, and years of education; military demographics-pay grade,military branch, tenure, deployment in Operations Desert Shield/Desert Storm (ODS/S), and militaryoccupation;5 and family demographics--family type (derived from marital status, spouse type[civilian/military], and dependents). Detailed definitions of the variables are provided in Table 3.
The sequential approach first involved regressing the set of individual demographic variables(independent variables) against DIFFICULTY (the dependent variable) and retaining in the model thosethat were statistically significant. Although the variables were added in sets, the regression results alsopermitted an analysis of the impact of single variables by examining the t statistics and their associatedP (probability) values.6 As each set of demographics was added to the model, the incremental strengthof the new model in explaining variance in the DIFFICULTY measure was assessed, and insignificantvariables were dropped. The goal was to determine the increase in the correlation between the predictedand observed values of the dependent measure (DIFFICULTY), using the weighted simple correlationbetween the observed and predicted values of the dependent variable, as additional demographic variableswere included in the model. The logistic model generated a predicted value between 0 and 1 that couldbe compared with the actual 0 (no reported difficulties) or 1 (at least one reported difficulty) outcome.The higher the correlation between the two, the better the model was at explaining the factors causingdifficulties in responding to recall/alert.
The explanatory power of the overall model was difficult to assess for two reasons. First, there isno global "goodness of fit" measure for logistic regression (such as R2 for an ordinary least squaresregression). Second, because of the large number of observations in the sample, even a small increasein the correlation between observed and predicted values of the dependent variable could have beenstatistically significant. Therefore, a variant of the Chi-square test was used to test the true statisticalsignificance of the increase in model fit (see Appendix B).
The methodology described above for the development of the DIFFICULTY model used in thisanalysis is identical to that used for a similar model described in the previous report in this series(Aldridge et al., 1996), except that in this case the model was run only for the subset of respondents whowere deployed in ODS/S.
The DIFFICULTY variable was used as a measure of the extent to which soldiers experienceddifficulties in responding quickly to recall/alert in general. Respondents were not asked about theirresponses to specific deployments or to any particular recall. By examining the responses of the
-Military occupation was defined as the first digit of the DoD occupation code, as described in the OccupationalConversion Manual, 1991 (DoD 1312.1-M),.
"6These statistics are presented in Appendix B.
21
subgroups of enlisted personnel and officers who were deployed in ODS/S and comparing them with theoverall survey population, it was anticipated that some insight could be gained into their general stateof readiness. Another survey question, which was analyzed with the regression models for enlistedpersonnel and officers described in the next section of this report, was designed to examine problemsspecifically related to the ODS/S deployment.
Results
The following sections present results from the analysis of overall difficulties in responding torecall/alert for enlisted personnel and officers who were deployed in ODS/S. Results of a similaranalysis for the entire populations of enlisted personnel and officers are shown for comparison.
Enlisted Personnel
Approximately 35 percent of the enlisted personnel who were deployed in ODS/S reporteddifficulties in responding to recall/alert (in the 12 months prior to the survey and prior to their ODS/Sdeployments). The comparable proportion for the entire enlisted population was similar, atapproximately 38 percent (Aldridge et al., 1996). In view of the similarity of the proportions fordemographic subgroups, a logistic regression model was used for the analysis.
Logistic regression provided information on the model's "goodness of fit," which served as ameasure of the extent to which individual, military, and family demographics accounted for thedifficulties experienced by enlisted personnel. Table 4 shows the correlations between the observed andpredicted values of the dependent variable resulting from the inclusion of each set of variables.
As shown in Table 4, individual demographics accounted for only about 1 percent of the variabilityin DIFFICULTY, the dependent measure. The correlation increased slightly when military demographicswere introduced into the model, and then increased again when family demographics were added. Itmust be noted, however, that all of these correlations indicate that the overall model accounted for onlya small proportion of the variability in DIFFICULTY.
Table 4. Correlation Between Observed and Predicted Values of the Dependent Variable (DIFFICULTY)
in the Sequential Model for Enlisted Service Members Deployed In ODS/S
Varia~ble Set in the Sequential Model T Correlation1. Individual Demographics 0.01
2. Set 1 + Military Demographics 0.02
3. Set 2 + Family Demographics 0.05
Note: A statistically significant increase in the correlation between observed and predicted values of the dependent variablewas achieved with the addition of each set of explanatory variables.
Although the overall correlation is small, the directional impact of demographic characteristics onthe dependent measure is important. Thus, the model can be used to answer such questions as: Didbeing unmarried and having dependents (e.g., children, grandparents) in the home result in an ODS/Sdeployed Service member's being more or less able to respond quickly to an alert (any alert, notnecessarily related to ODS/S)?
22
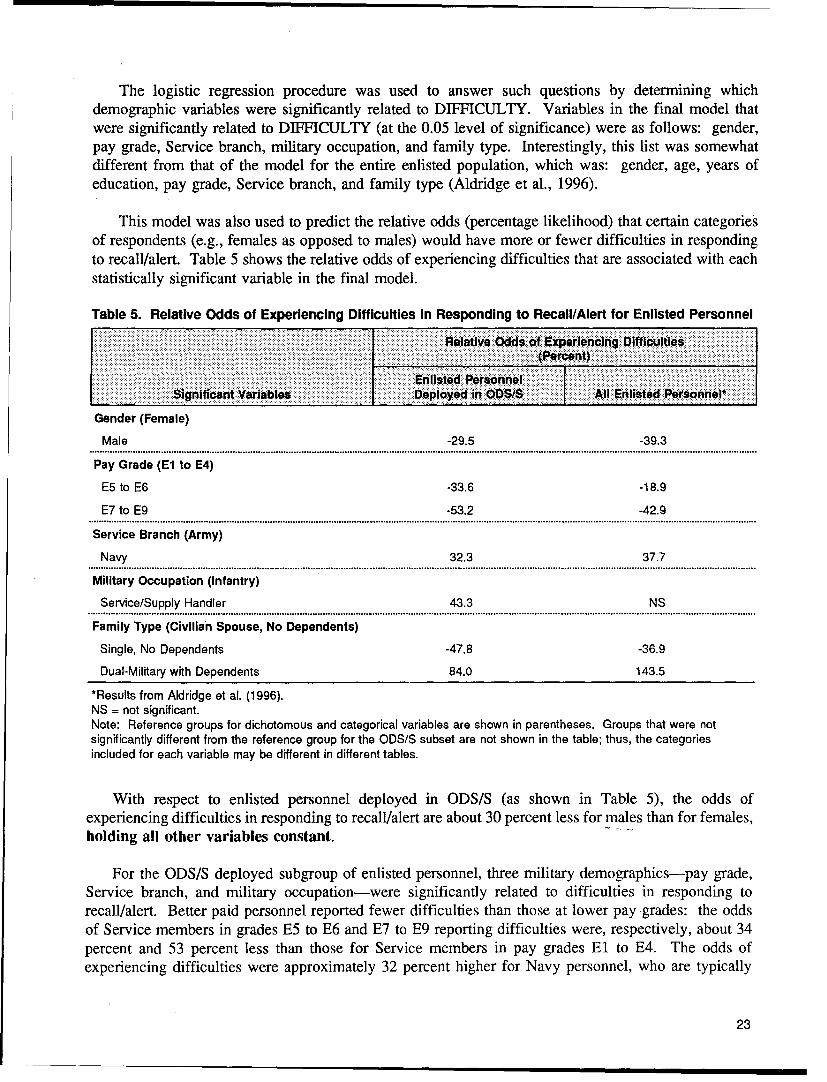
The logistic regression procedure was used to answer such questions by determining whichdemographic variables were significantly related to DIFFICULTY. Variables in the final model thatwere significantly related to DIFFICULTY (at the 0.05 level of significance) were as follows: gender,pay grade, Service branch, military occupation, and family type. Interestingly, this list was somewhatdifferent from that of the model for the entire enlisted population, which was: gender, age, years ofeducation, pay grade, Service branch, and family type (Aldridge et al., 1996).
This model was also used to predict the relative odds (percentage likelihood) that certain categoriesof respondents (e.g., females as opposed to males) would have more or fewer difficulties in respondingto recall/alert. Table 5 shows the relative odds of experiencing difficulties that are associated with eachstatistically significant variable in the final model.
Table 5. Relative Odds of Experiencing Difficulties in Responding to Recall/Alert for Enlisted Personnel
Relaetive Odd$** of Experiencing Difficulties(Percent)
Enlisted PersonnelSinificant Variables Deployed in OD .SJS All Entlisted Personnel*
Gender (Female)
Male -29.5 -39.3
Pay Grade (El to E4)
E5 to E6 -33.6 -18.9
E7 to E9 -53.2 -42.9S................. ............................................................................... ,...................................................................................................................................................................
Service Branch (Army)
Navy 32.3 37.7S...................................................................................................................................................................................................................................................................Military Occupation (infantry)
Service/Supply Handler 43.3 NS
Family Type (Civilian Spouse, No Dependents)
Single, No Dependents -47.8 -36.9
Dual-Military with Dependents 84.0 143.5*Results from Aldridge et al. (1996).
NS = not significant.Note: Reference groups for dichotomous and categorical variables are shown in parentheses. Groups that were notsignificantly different from the reference group for the ODS/S subset are not shown in the table; thus, the categoriesincluded for each variable may be different in different tables.
With respect to enlisted personnel deployed in ODS/S (as shown in Table 5), the odds ofexperiencing difficulties in responding to recall/alert are about 30 percent less for males than for females,holding all other variables constant.
For the ODS/S deployed subgroup of enlisted personnel, three military demographics-pay grade,Service branch, and military occupation-were significantly related to difficulties in responding torecall/alert. Better paid personnel reported fewer difficulties than those at lower pay grades: the oddsof Service members in grades E5 to E6 and E7 to E9 reporting difficulties were, respectively, about 34percent and 53 percent less than those for Service members in pay grades El to E4. The odds ofexperiencing difficulties were approximately 32 percent higher for Navy personnel, who are typically
23

away from home for longer periods than other Service members, than for Army Service members. Therewas no significant difference in the odds for Marine Corps, Air Force, and Army enlisted personnel inthis regard. Service and supply handlers reported more difficulties than those in other militaryoccupations; however, the reason for this result is unclear.
As anticipated, family factors were also related to difficulties experienced in responding torecall/alert. Specifically, the odds of experiencing difficulties were about 48 percent less for singleenlisted personnel with no dependents than for those with civilian spouses and no dependents (thereference group). Enlisted personnel in dual-military marriages with dependents were 84 percent morelikely to have difficulties than the reference group. Those who were married to civilians and haddependents were more likely to have difficulties, but this result was not statistically significant and,therefore, is not shown in Table 5. For all enlisted personnel, the effects seen for the same family typeswere similar in direction to those seen for the ODS/S subgroup, but stronger (higher relative odds).Perhaps the subset of personnel deployed in ODS/S were more accustomed to responding to recalls andalerts than were enlisted personnel overall.
Officers
The same analyses, using the same variables for the model, were conducted for officers.7 Amongthose who were deployed in ODS/S, officers were less likely to report difficulties than were enlistedpersonnel. Approximately 22 percent of ODS/S deployed officers reported difficulties in responding torecall/alert, as compared with 24.4 percent of officers overall (Aldridge et al., 1996).
Results of the logistic regression model for officers were similar to those for enlisted personnel whenidentical sets of explanatory variables were added sequentially to the model. Table 6 shows thecorrelation between observed and predicted values of the dependent measure (the incremental goodnessof fit indicator) for each step in the sequential model. As was the case with the results for enlistedpersonnel, variable sets had to be combined to increase the significance of the overall model. Thefollowing variables were significantly related to the likelihood that officers would experience difficultiesin responding to recall/alert: gender, years of education, pay grade, Service branch, military occupation,and family type. Not surprisingly, many of the variables that were significant for enlisted personnelwere also significant for officers. Education was an exception. Because the vast majority of officersare college graduates, there is much less variance in the level of education among officers than amongenlisted personnel.
Table 6. Correlation Between Observed and Predicted Values of the Dependent Variable (DIFFICULTY)
in the Sequential Model for Officers
Variable Set in the Sequent!i6l Model Correlation1. Individual Demographics 0.004
2. Set 1 + Military Demographics 0.02
3. Set 2 + Family Demographics 0.05
Note: A statistically significant increase in the correlation between observed and predicted values of the dependent variablewas achieved with the addition of each set of explanatory variables.
7Officers are defined here to include warrant officers.
24

Table 7 shows the relative odds of experiencing difficulties that were associated with eachstatistically significant variable in the final model for officers. The odds of experiencing difficulties inresponding to recall/alert were 45 percent lower for male officers than for female officers in the ODS/Ssubgroup, holding all other variables in the model constant. By pay grade, officers in the ODS/Ssubgroup in grades 04 through 07 were about 49 percent less likely to report difficulties than those ingrades 01 through 03. In comparison, for the entire officer population, those in grades 04 through 07were only about 17 percent less likely to report difficulties than those in grades 01 through 03. ByService branch, Marine Corps officers in the ODS/S subgroup were approximately 29 percent less likelyto report difficulties than were officers in the Army, whereas Navy and Air Force officers were notsignificantly different from Army officers in this regard.
Table 7. Relative Odds of Experiencing Difficulties in Responding to Recall/Alert for Officers
... Relative Oddsobf Experiencing Diffliculti's(Percentl)
sgnificant YtaiSOfficers Deployed in 005/S All Officoer*
Gender (Female)
Male -45.1 -46.2S.................................................................... ......... o............................................ ,..................................................... ,...................................................................................
Pay Grade (01 to 03)
04 to 07 -48.8 -17.3
Service Branch (Army)
Marines -28.8 -18.1S...................................... o............................................................................................................................................................................................................................
Military Occupation (Engineering and Maintenance)
Health Care Officers 61.6 53.7
Family Type (Civilian Spouse, No Dependents)
Single with Dependents 281.9 242.1
Dual-Military, No Dependents -56.0 -13.9
Dual-Military with Dependents 361.8 326.3
Civilian Spouse with Dependents 93.5 85.9*Results from Aldridge et al. (1996).
Note: Reference groups for dichotomous and categorical variables are shown in parentheses. Groups that were notsignificantly different from the reference group for the ODS/S subset are not shown in the table; thus, the categoriesincluded for each variable may be different in different tables.
Military occupation also emerged as a significant predictor of DIFFICULTY for officers in theODS/S group. Health care officers were approximately 62 percent more likely to report difficulties inresponding to recall/alert than were engineering and maintenance officers. With respect to the odds ofexperiencing difficulties, all other officer occupational groups were similar to engineering andmaintenance officers.
As was seen for enlisted personnel, family demographics for officers in the ODS/S subgroup wererelated to the odds of experiencing difficulties in responding to recall/alert. Single officers with nodependents were similar to officers with civilian spouses and no dependents (unlike the results forenlisted personnel, where single personnel with no dependents were less likely to experience difficulties).The odds of officers in dual-military marriages with no dependents experiencing difficulties were about14 percent less than those for officers with civilian spouses and no dependents. The odds for officers
25

with civilian spouses and dependents were about 86 percent greater than those for officers with civilianspouses and no dependents. Both single officers with dependents and officers in dual-military marriageswith dependents were far more likely than the reference group to experience difficulties-approximately4 and 4.5 times more likely, respectively.! These differences were even more pronounced than thecorresponding odds ratios for the entire officer population. Ranked from highest to lowest odds, thefamily types for officers in the ODS/S subgroup most likely to experience difficulties in responding torecall/alert were (1) dual-military with dependents, (2) single with dependents, (3) civilian spouse withdependents, (4) civilian spouses, no dependents, (5) single, no dependents, and (6) dual-military, nodependents.
Problems in Responding to the ODS/S Deployment
Analysis Methodology
The dependent measure used to examine the factors affecting whether a Service member encounteredproblems responding to the ODS/S deployment was based on the following survey question:
If you were deployed for Operation Desert Shield/Desert Storm, what kinds of problems did youhave responding?
"• Does not apply, I was not deployed"• Does not apply, did not have problems"• Dependent care considerations"• Personal health problems other than pregnancy"• Pregnancy"• Family health problem"• Second job"• Attending school during off-duty hours"• Other problem
A dichotomous variable, PROBLEMS, was developed as the dependent measure in the model.Tabulations were produced to characterize demographic variables and their relationships withPROBLEMS, and Chi-square tests were used to guide development of the regression model. The samesets of explanatory variables were used in the PROBLEMS model as in the DIFFICULTY model.
The PROBLEMS variable was used to examine a different but related problem to that in theprevious section: What groups of Service members were more likely to experience problems inresponding specifically to the ODS/S deployment?
'This estimate is derived as follows: [1 + (relative odds / 100)]. Zero percent relative odds would be equivalent to avalue of 1, indicating equal likelihood or odds.
26
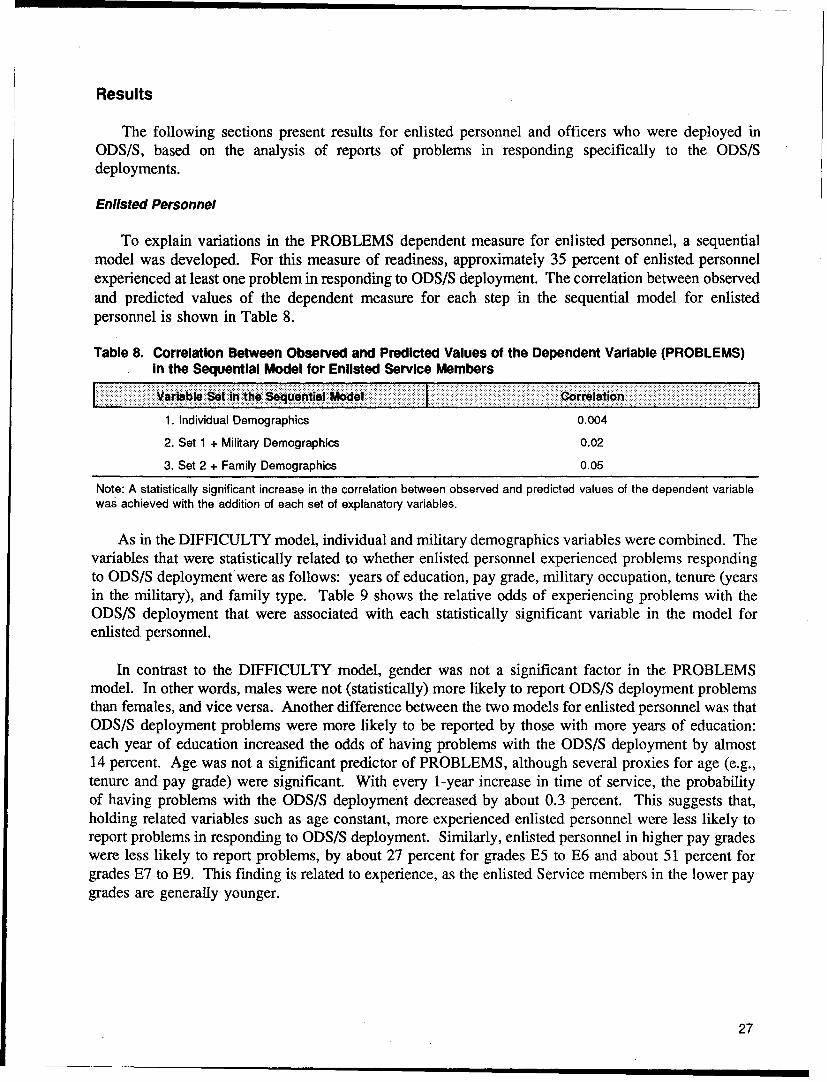
Results
The following sections present results for enlisted personnel and officers who were deployed inODS/S, based on the analysis of reports of problems in responding specifically to the ODS/Sdeployments.
Enlisted Personnel
To explain variations in the PROBLEMS dependent measure for enlisted personnel, a sequentialmodel was developed. For this measure of readiness, approximately 35 percent of enlisted personnelexperienced at least one problem in responding to ODS/S deployment. The correlation between observedand predicted values of the dependent measure for each step in the sequential model for enlistedpersonnel is shown in Table 8.
Table 8. Correlation Between Observed and Predicted Values of the Dependent Variable (PROBLEMS)
in the Sequential Model for Enlisted Service Members
Variable Sinthe Sequential Model::. Correlation
1. Individual Demographics 0.004
2. Set 1 + Military Demographics 0.02
3. Set 2 + Family Demographics 0.05
Note: A statistically significant increase in the correlation between observed and predicted values of the dependent variablewas achieved with the addition of each set of explanatory variables.
As in the DIFFICULTY model, individual and military demographics variables were combined. Thevariables that were statistically related to whether enlisted personnel experienced problems respondingto ODS/S deployment were as follows: years of education, pay grade, military occupation, tenure (yearsin the military), and family type. Table 9 shows the relative odds of experiencing problems with theODS/S deployment that were associated with each statistically significant variable in the model forenlisted personnel.
In contrast to the DIFFICULTY model, gender was not a significant factor in the PROBLEMSmodel. In other words, males were not (statistically) more likely to report ODS/S deployment problemsthan females, and vice versa. Another difference between the two models for enlisted personnel was thatODS/S deployment problems were more likely to be reported by those with more years of education:each year of education increased the odds of having problems with the ODS/S deployment by almost14 percent. Age was not a significant predictor of PROBLEMS, although several proxies for age (e.g.,tenure and pay grade) were significant. With every 1-year increase in time of service, the probabilityof having problems with the ODS/S deployment decreased by about 0.3 percent. This suggests that,holding related variables such as age constant, more experienced enlisted personnel were less likely toreport problems in responding to ODS/S deployment. Similarly, enlisted personnel in higher pay gradeswere less likely to report problems, by about 27 percent for grades E5 to E6 and about 51 percent forgrades E7 to E9. This finding is related to experience, as the enlisted Service members in the lower paygrades are generally younger.
27
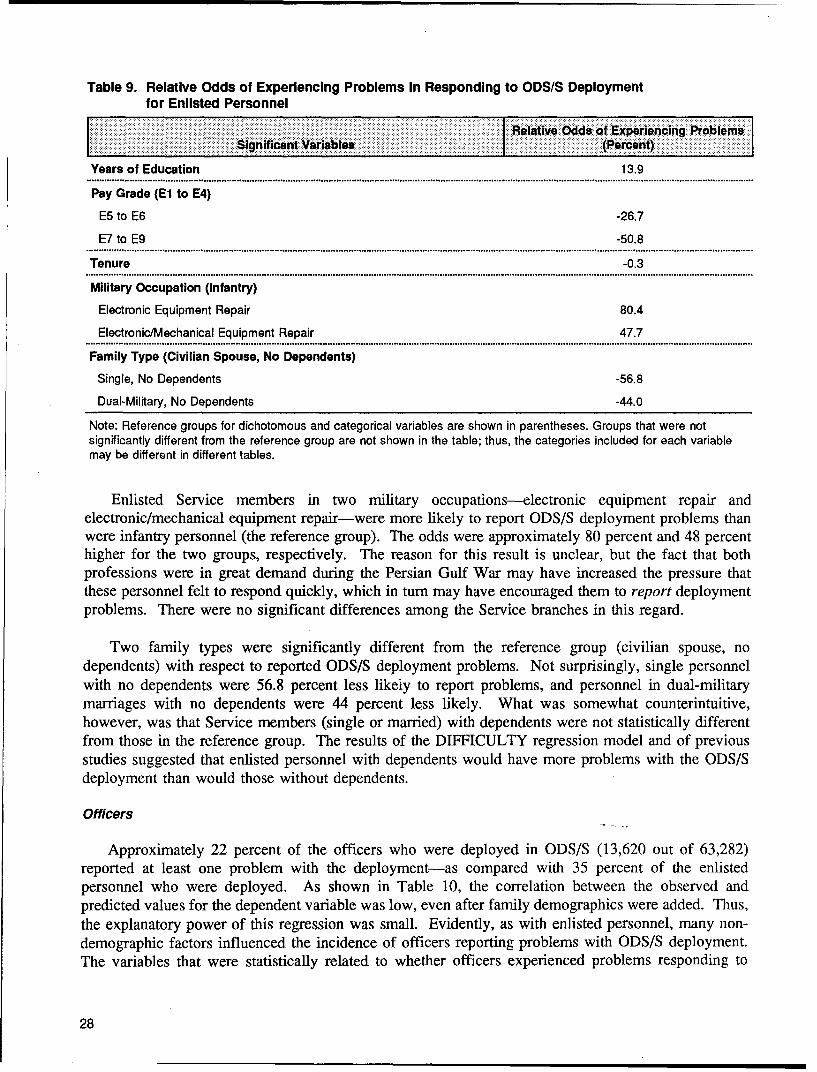
Table 9. Relative Odds of Experiencing Problems In Responding to ODS/S Deploymentfor Enlisted Personnel
Relative Odds of Experiencing Problems:::Significant::Variables (Percent)
Years of Education 13.9S................... ............................................................................ o .......o.°o ...°.............................. °.................... o....................................... ,.............................................................
Pay Grade (El to E4)
E5 to E6 -26.7
E7 to E9 -50.8S.............................. ............... o.............................................. ............... •........................................................................................... ,............................................. ................ .
Tenure -0.3
Military Occupation (Infantry)
Electronic Equipment Repair 80.4
Electronic/Mechanical Equipment Repair 47.7
Family Type (Civilian Spouse, No Dependents)
Single, No Dependents -56.8
Dual-Military, No Dependents -44.0
Note: Reference groups for dichotomous and categorical variables are shown in parentheses. Groups that were notsignificantly different from the reference group are not shown in the table; thus, the categories included for each variablemay be different in different tables.
Enlisted Service members in two military occupations--electronic equipment repair andelectronic/mechanical equipment repair-were more likely to report ODS/S deployment problems thanwere infantry personnel (the reference group). The odds were approximately 80 percent and 48 percenthigher for the two groups, respectively. The reason for this result is unclear, but the fact that bothprofessions were in great demand during the Persian Gulf War may have increased the pressure thatthese personnel felt to respond quickly, which in turn may have encouraged them to report deploymentproblems. There were no significant differences among the Service branches in this regard.
Two family types were significantly different from the reference group (civilian spouse, nodependents) with respect to reported ODS/S deployment problems. Not surprisingly, single personnelwith no dependents were 56.8 percent less likely to report problems, and personnel in dual-militarymarriages with no dependents were 44 percent less likely. What was somewhat counterintuitive,however, was that Service members (single or married) with dependents were not statistically differentfrom those in the reference group. The results of the DIFFICULTY regression model and of previousstudies suggested that enlisted personnel with dependents would have more problems with the ODS/Sdeployment than would those without dependents.
Officers
Approximately 22 percent of the officers who were deployed in ODS/S (13,620 out of 63,282)reported at least one problem with the deployment-as compared with 35 percent of the enlistedpersonnel who were deployed. As shown in Table 10, the correlation between the observed andpredicted values for the dependent variable was low, even after family demographics were added. Thus,the explanatory power of this regression was small. Evidently, as with enlisted personnel, many non-demographic factors influenced the incidence of officers reporting problems with ODS/S deployment.The variables that were statistically related to whether officers experienced problems responding to
28
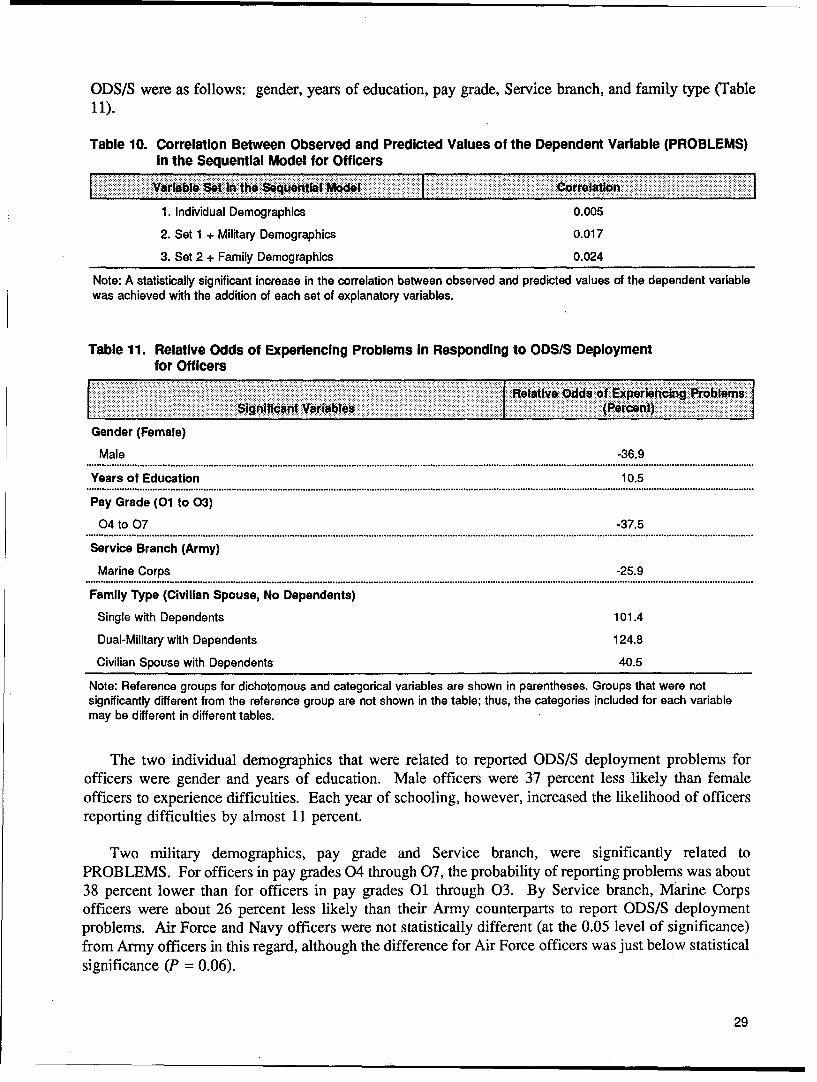
ODS/S were as follows: gender, years of education, pay grade, Service branch, and family type (Table11).
Table 10. Correlation Between Observed and Predicted Values of the Dependent Variable (PROBLEMS)
In the Sequential Model for Officers
1. Individual Demographics 0.005
2. Set 1 + Military Demographics 0.017
3. Set 2 + Family Demographics 0.024
Note: A statistically significant increase in the correlation between observed and predicted values of the dependent variablewas achieved with the addition of each set of explanatory variables.
Table 11. Relative Odds of Experiencing Problems in Responding to ODS/S Deploymentfor Officers
Reltie Odsof Experieilcin PrblemsiIii iSigniticant Variables I(Percent)
Gender (Female)Male -36.9S.................................................................................... ,............ ,............................................................................. .... ....................................... °...... ,............ .........................
Years of Education 10.5S....................................................................... I ............ ,............ ............................................................................. °.................................................. .....................................
Pay Grade (01 to 03)
04 to 07 -37.5S.................. .. ............................................................................. ,............................................................................................................................... . ...................................
Service Branch (Army)
Marine Corps -25.9S................... .. ................................................... ,....................... ............................................................................... ,.................................................. °...................................
Family Type (Civilian Spouse, No Dependents)
Single with Dependents 101.4
Dual-Military with Dependents 124.8
Civilian Spouse with Dependents 40.5
Note: Reference groups for dichotomous and categorical variables are shown in parentheses. Groups that were notsignificantly different from the reference group are not shown in the table; thus, the categories included for each variablemay be different in different tables.
The two individual demographics that were related to reported ODS/S deployment problems forofficers were gender and years of education. Male officers were 37 percent less likely than femaleofficers to experience difficulties. Each year of schooling, however, increased the likelihood of officersreporting difficulties by almost 11 percent.
Two military demographics, pay grade and Service branch, were significantly related toPROBLEMS. For officers in pay grades 04 through 07, the probability of reporting problems was about38 percent lower than for officers in pay grades 01 through 03. By Service branch, Marine Corpsofficers were about 26 percent less likely than their Army counterparts to report ODS/S deploymentproblems. Air Force and Navy officers were not statistically different (at the 0.05 level of significance)from Army officers in this regard, although the difference for Air Force officers was just below statisticalsignificance (P = 0.06).
29
As seen for enlisted personnel, family demographics for officers were related to the likelihood ofexperiencing problems in responding to ODS/S deployment. Single officers with dependents and officersin dual-military marriages with dependents were about 101 and 125 percent more likely, respectively,to experience problems than were officers married to civilians with no dependents. Officers with civilianspouses and dependents were about 41 percent more likely to report ODS/S deployment problems thanwere those in the reference group. Evidently, in contrast to the results for enlisted personnel, thepresence of dependents did make a difference for officers in terms of reports of experiencing deploymentproblems.
Family Concerns While Separated
Barriers to individual and family readiness may occur when a Service member is concerned abouthis/her family (defined as spouses, children, and/or parents) while he or she is away on assignment ordeployment. Concerns about family may impair a Service member's ability to perform his or her jobeffectively.
Analysis Methodology
The 1992 surveys addressed family concerns that Service members might experience while awayfrom home. Specifically, the following question was asked:
Here is a list of feelings or worries some military members have about their family (spouse,children, parents) when they are away on assignment, TDY or deployment. How often did orwould you worry about each of the following when you are away?
Family's safety in their communityFamily's ability to get car or household repairs doneFamily having enough money to meet expenses, pay bills, etc.Child(ren)'s health and well-beingFamily's safety in the event of war.
On a five-point scale from Very Seldom or Never (5) to Very Often or Always (1), respondents wereasked to indicate how often they did or would worry about each issue while away from home. Acomposite variable for satisfaction and confidence was also created, using factor analysis. Factoranalysis identifies a reduced number of underlying dimensions or factors present in a group of variables.It gives the analyst a systematic approach to understanding the interrelationships among items anduncovers groups of items that measure the same concept or issue (see Appendix B for more details).
For two of the independent variables-SATISFACTION and CONFIDENCE-composite variableswere constructed across items from questions on different scales (see Table 3, page 18). The ordinallyscaled responses from several questions were standardized (with a mean of 0 and standard deviation of1), and the mean of the standardized scores was used as the value of the composite variable (seeAppendix B for more details). The number of independent variables was dramatically reduced byconstructing conceptually similar and statistically reliable composites for survey questions concerningsatisfaction with military life and confidence in spouse's abilities to handle matters while the Servicemember was absent. Factor analyses for both variables were conducted using responses for Servicemembers deployed during ODS/S.
30

The constructed variable SATISFACTION WITH MILITARY LIFE combined nine survey items:a) whether life in the military was as the respondent expected; b) whether the respondent was satisfiedwith 1) personal freedom, 2) the opportunity to serve one's country, 3) working/environmentalconditions, 4) work group/coworkers, 5) military assignment stability, 6) friendships, and 7) frequencyof moves; and c) overall satisfaction with military life. At least five of the nine items had to beanswered for a respondent (case) to be included in the factor scoring. More details about the results offactor scoring for this and other constructed variables are provided in Appendix B.
For this analysis, a subset of data-for respondents who were deployed in ODS/S-was used. Noeffort was made to explain differences in the CONCERN dependent variable for nontraditional andtraditional families, since an earlier analysis (Aldridge et al., 1996) indicated that the reported levels ofconcern for the two groups were often indistinguishable.
Four sets of explanatory (independent) demographic variables-individual demographics, militarydemographics, family demographics, and emergency provisions in place-were used to develop asequential, or hierarchical, multiple regression model. The following variables were used: (a) individualdemographics--gender, age, race/ethnicity, and years of education; (b) military demographics-paygrade, military branch, tenure, military occupation,9 CONUS/OCONUS location, total value of pay andallowances, and time separated from family; (c) family demographics-family type (derived frommarital status, spouse type [civilian/military], and dependents) and spouse's occupation (married membersonly); and (d) emergency provisions in place-power of attorney, life insurance, and will. In addition,a fifth set consisting of two constructed variables, satisfaction with military life and confidence inspouse's ability (married members only), was also used. Detailed definitions of the variables areprovided in Table 3 on page 13.
Instead of the logistic regression used to model DIFFICULTY and PROBLEMS, multiple regressionwas used to model CONCERN because it was a continuous rather than a dichotomous variable. Multipleregression is used to examine the relationship of a set of independent variables to a dependent variable,but the model also predicts a level of the dependent variable (as opposed to a 1/0 outcome), and theinfluence of the independent variables is expressed in terms of a Beta coefficient rather than as relativeodds. The multiple regression procedure is applied in analyzing survey data when the dependent variableis continuous or consists of ordinal levels-e.g., Very Dissatisfied (1), Dissatisfied (2), Neither (3),Satisfied (4), Very Satisfied (5). The value of the t statistic is used to determine which variables shouldbe kept in the model (i.e., the significance of the coefficients associated with the explanatory variables).The Wald Chi square (see discussion in Appendix B) is used to assess the overall quality of the model.As in the DIFFICULTY and PROBLEMS models, groups of related variables were added into theCONCERN model. A similar sequential approach was followed, and the final model was detenninedby elimination of variables with coefficients that were not statistically significant at the 0.05 level.
9Military occupation was defined as the first digit of the DoD occupation code, as described in the OccupationalConversion Manual, 1991 (DoD 1312.1-M).
31

Results
The following sections present the results of the multiple regression analysis of factors affecting theCONCERN variable for enlisted personnel and for officers.
Enlisted Personnel
The variable CONCERN was measured on a five-point scale, where 1 equaled Very Often or AlwaysWorry about a given item, and 5 equaled Very Seldom or Never Worry. Table 12 shows the progressionin the overall explanatory power of the regression model. Because this is a multiple regression model(as opposed to a logistic model), the percent of variance explained (R2) is used instead of the correlationbetween the observed and predicted values of the dependent variable. Although the family demographicsset did not cause a significant increase in the model's power, the variable family type was significant.In practice, although the variables were entered in sets, variables that were significant were kept,according to standard stepwise regression procedure. The final model explained approximately 15percent of the variation in CONCERN.
Table 12. Variance In the Dependent Variable (CONCERN) in the Sequential Modelfor Enlisted Service Members
Percentage of Variance in CONCERNVariable Set in the Sequential Model Explained by the Model
1. Individual Demographics 0.01
2. Set 1 + Military Demographics 0.02
3. Set 2 + Family Demographics 0.13
4. Set 3 + Emergency Provisions in Place 0.14
5. Set 4 + Satisfaction with Military Life 0.15
Note: The statistical significance of the overall model was determined by calculating the F statistic and its associatedprobability (see discussion in Appendix B).
The relationship between CONCERN and the independent variables can be expressed as the change(increase or decrease) in family concern attributable to a unit of change in one independent variable,holding all other variables constant. For example, the relationship between CONCERN and gendercan be expressed in terms of how much more or less males experience family concerns as compared withfemales (the reference group). For continuous variables such as age, the relationship can be expressedas the change in CONCERN for each incremental increase in an independent variable (e.g., an additionalyear of age).
The results of the multivariate analyses are shown in Table 13, which presents the Beta coefficientsassociated with each independent variable. The Beta coefficients show the direction of the relationshipbetween CONCERN and each of the independent variables with which it was found to be significantlyrelated. The direction of each relationship is indicated as CONCERN relative to the reference group(shown in parentheses in Table 13) for dichotomous variables or as an increase of one unit forcontinuous variables. For example, the Beta coefficient of -0.18 for married males in the ODS/Sdeployed group in Table 13 means that males who had family and were deployed in ODS/S were morelikely than females with family who were deployed to report family concerns as a result of separation(i.e., the value of CONCERN was lower for married males than for married females). It is interesting
32

that males showed more concern than did females, despite the fact that males generally reported fewerproblems in responding to recall/alert.
Table 13. Relative Effects of Independent Variables on Family Concerns While Separatedfor Enlisted Personnel
S,,,~~~~~.. ...... . ,........ ,, , ,...,
Gender (Female)
Male -0.11 -0.18
Race/Ethnicity (White)
Other -0.22 -0.36
Value of Pay and Allowances <0.01 <0.01
Family Type (Civilian Spouse, No Dependents)
Single, No Dependents 0.92 1.07
Satisfaction with Military Life 2.30 2.18
•*Results from Aldridge et a!. (1996).Note: Reference groups for dichotomous and categorical variables are shown in parentheses. Groups that were notsignificantly different from the reference group are not shown in the table; thus, the categories included for each variablemay be different in different tables.
By race/ethnicity, the results for Blacks and Hispanics were not statistically different from those forWhites, but enlisted personnel in the other race/ethnicity groups (non-Black and non-Hispanic) weremore likely to be concerned about their families while away from home, whether the separation was dueto ODS/S deployment or some other assignment.
As expected, single enlisted personnel with no dependents were less likely to report concern thanwere enlisted personnel with a civilian spouse and no dependents (the reference group). On the otherhand, those with dependents were no more likely to be concerned than the reference group. Perhapsparents (children made up the bulk of dependents) who were deployed in ODS/S were confident aboutthe support mechanisms for their families at home. It should be noted, however, that those with acivilian spouse and dependents were more likely to report concern, although the result was not significantat the 0.05 level (P = .07).
The higher the value of total family income, the less likely enlisted Service members were to haveconcerns while away. Previous studies have indicated that financial concerns tend to be key stressorsfor Service members separated from their families. Presumably, Service members in families with highertotal incomes would be less bothered by financial concerns.
The variable SATISFACTION WITH MILITARY LIFE had the strongest effect on CONCERN.Enlisted personnel who were less satisfied with military life overall had higher levels of concern abouttheir families while separated than did those who were more satisfied with military life. This result isnot unexpected, since satisfaction with military services such as child care would presumably constitutean appreciable part of satisfaction with military life overall.
33
.. . . . . . . . ... .......
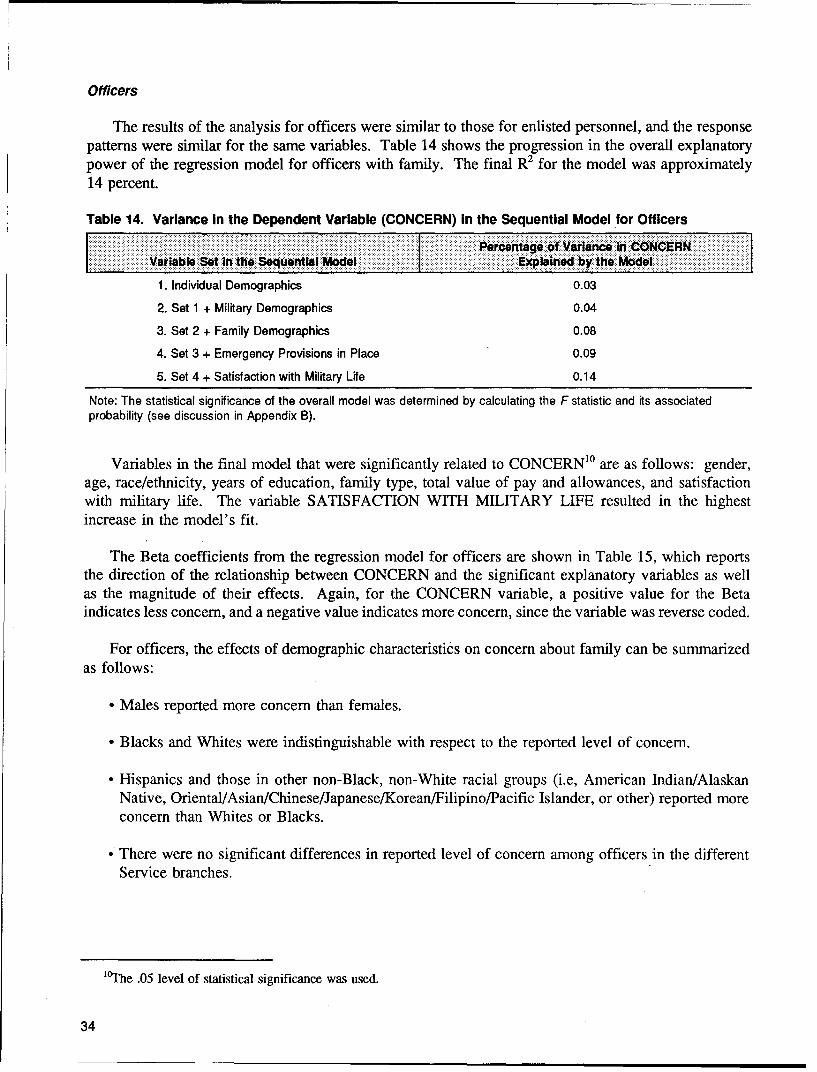
Officers
The results of the analysis for officers were similar to those for enlisted personnel, and the responsepatterns were similar for the same variables. Table 14 shows the progression in the overall explanatorypower of the regression model for officers with family. The final R2 for the model was approximately14 percent.
Table 14. Variance In the Dependent Variable (CONCERN) in the Sequential Model for Officers
Percentage af Vlance in CONC~ERNVariable $.et in the Sequentital Model Explained ,:by the Model ..
1. Individual Demographics 0.03
2. Set 1 + Military Demographics 0.04
3. Set 2 + Family Demographics 0.08
4. Set 3 + Emergency Provisions in Place 0.09
5. Set 4 + Satisfaction with Military Life 0.14
Note: The statistical significance of the overall model was determined by calculating the F statistic and its associatedprobability (see discussion in Appendix B).
Variables in the final model that were significantly related to CONCERN 10 are as follows: gender,age, race/ethnicity, years of education, family type, total value of pay and allowances, and satisfactionwith military life. The variable SATISFACTION WITH MILITARY LIFE resulted in the highestincrease in the model's fit.
The Beta coefficients from the regression model for officers are shown in Table 15, which reportsthe direction of the relationship between CONCERN and the significant explanatory variables as wellas the magnitude of their effects. Again, for the CONCERN variable, a positive value for the Betaindicates less concern, and a negative value indicates more concern, since the variable was reverse coded.
For officers, the effects of demographic characteristics on concern about family can be summarizedas follows:
"• Males reported more concern than females.
"• Blacks and Whites were indistinguishable with respect to the reported level of concern.
"* Hispanics and those in other non-Black, non-White racial groups (i.e, American Indian/AlaskanNative, Oriental/Asian/Chinese/Japanese/Korean/Filipino/Pacific Islander, or other) reported moreconcern than Whites or Blacks.
"• There were no significant differences in reported level of concern among officers in the differentService branches.
1Trhe .05 level of statistical significance was used.
34

Table 15. Relative Effects of Independent Variables on Family Concerns While Separated for Officers
AlJ:embrs3 I /S DeRployed Mem~bers$Inil vn Vail h Pm ly wih6:ti
Gender (Female)
Male -0.19 -0.19
Age -0.01 -0.01
Race/Ethnicity (White)
Hispanic -0.16 -0.26
Other -0.18 -0.28
Value of Pay and Allowances <0.01 <0.01
Family Type (Civilian Spouse, No Dependents)
Single, No Dependents 0.58 0.72
Dual-Military, No Dependents 0.27 0.28
Civilian Spouse with Dependents -0.13 -0.14S.......................................... ,............................... °................................................................................................................... °.....................................................................
Power of Attorney (No Power of Attorney)
Power of Attorney in Place -0.08 -0.09S.......... °.......... o..................................................... I ............................... °................................................................................................................................................. .......
Satisfaction with Military Life 1.14 1.29*Results from Aldridge et al. (1996).Note: Reference groups for dichotomous and categorical variables are shown in parentheses. Groups that were notsignificantly different from the reference group are not shown in the table; thus, the categories included for each variablemay be different in different tables.
"Officers with dependents worried more than those without dependents, except for those in dual-military marriages with dependents (as with enlisted personnel, these officers may have been moreconfident about military support mechanisms). Officers with no dependents who were either singleor married to a military spouse reported less concern than officers who had no dependents andwere married to a civilian spouse (the reference group).
" Higher levels of total pay and allowances were associated with lower levels of concern (as wasalso the case for enlisted personnel).
" Officers with power of attorney in place reported slightly more concern than those with no powerof attorney in place.
" Officers satisfied with military life in general reported less concern than those who were lesssatisfied (as was also found for enlisted personnel).
35
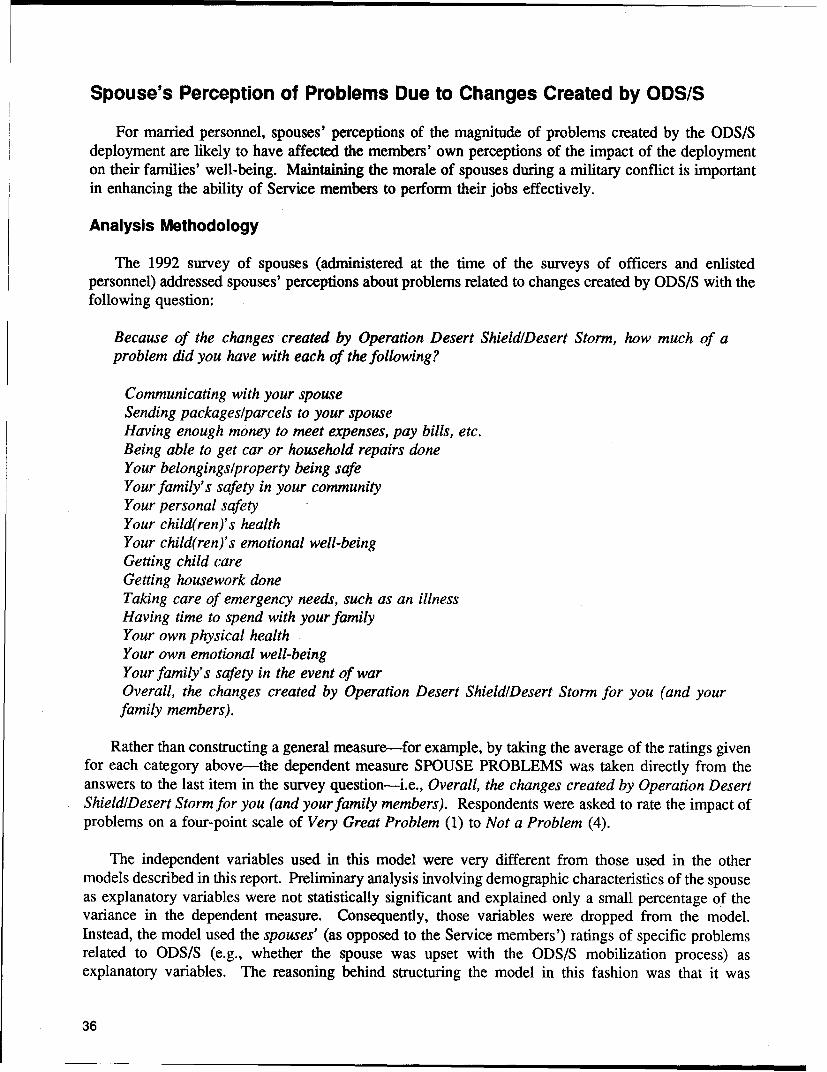
Spouse's Perception of Problems Due to Changes Created by ODS/S
For married personnel, spouses' perceptions of the magnitude of problems created by the ODS/Sdeployment are likely to have affected the members' own perceptions of the impact of the deploymenton their families' well-being. Maintaining the morale of spouses during a military conflict is importantin enhancing the ability of Service members to perform their jobs effectively.
Analysis Methodology
The 1992 survey of spouses (administered at the time of the surveys of officers and enlistedpersonnel) addressed spouses' perceptions about problems related to changes created by ODS/S with thefollowing question:
Because of the changes created by Operation Desert Shield/Desert Storm, how much of aproblem did you have with each of the following?
Communicating with your spouseSending packages/parcels to your spouseHaving enough money to meet expenses, pay bills, etc.Being able to get car or household repairs doneYour belongings/property being safeYour family's safety in your communityYour personal safetyYour child(ren)'s healthYour child(ren)'s emotional well-beingGetting child careGetting housework doneTaking care of emergency needs, such as an illnessHaving time to spend with your familyYour own physical healthYour own emotional well-beingYour family's safety in the event of warOverall, the changes created by Operation Desert Shield/Desert Storm for you (and yourfamily members).
Rather than constructing a general measure--for example, by taking the average of the ratings givenfor each category above-the dependent measure SPOUSE PROBLEMS was taken directly from theanswers to the last item in the survey question-i.e., Overall, the changes created by Operation DesertShield/Desert Storm for you (and your family members). Respondents were asked to rate the impact ofproblems on a four-point scale of Very Great Problem (1) to Not a Problem (4).
The independent variables used in this model were very different from those used in the othermodels described in this report. Preliminary analysis involving demographic characteristics of the spouseas explanatory variables were not statistically significant and explained only a small percentage of thevariance in the dependent measure. Consequently, those variables were dropped from the model.Instead, the model used the spouses' (as opposed to the Service members') ratings of specific problemsrelated to ODS/S (e.g., whether the spouse was upset with the ODS/S mobilization process) asexplanatory variables. The reasoning behind structuring the model in this fashion was that it was
36

important to understand which specific problems tended to contribute most to the spouses' perceptionsof problems overall. Explanatory variables were entered into the model in two sets.
Variable set 1 consisted of the following factors specifically related to the ODS/S Deployment:
"* Upset with mobilization"* Length of ODS/S deployment"• Advance notice of member deployment"* Effect of ODS/S deployment on spouse's job"* Satisfaction with information access during ODS/S"* Financial burdens of ODS/S"• Stress caused by ODS/S.
Variable set 2 consisted of the following composite indices of satisfaction with aspects of military life:
"* Satisfaction with member's military job"* Satisfaction with military benefits and family services"* Separation from member"• Job demands of member"* Satisfaction with family relationships"* Satisfaction with spouse's own job.
Some of the variables required factor analysis (see Table 3 on page 13 for a description of variablecreation).
Results
The following sections present results of the analysis of military spouses' perceptions of problemsdue to changes created by ODS/S deployment, for the spouses of enlisted personnel and officers.
Enlisted Personnel
For enlisted personnel, Table 16 shows the percentage of the variance in the dependent variable,SPOUSE PROBLEMS, that was explained by variable set 1 and by variables sets 1 and 2 incombination. The final R2 (approximately 31 percent) was the best fit obtained for any of the modelsdescribed in this report. Much of the variance was explained by the spouse's perception of factorsspecifically related to the ODS/S deployment (variable set 1). An additional 4 percent was explainedwith the addition of variables that measured the spouse's impression of military life overall (variable set2).
Table 16. Variance In the Dependent Variable (SPOUSE PROBLEMS) In the Sequential Modelfor Spouses of Enlisted Service Members
Percentage of Variance inVaiable Set in the Sequential Model SPOUSE PROBLEMS Explained by theMoe
1. Factors Specifically Related to the ODS/S Deployment 0.27
2. Set 1 + Composite Indices of Satisfaction with Aspects of Military Life 0.31
Note: The statistical significance of the overall model was determined by calculating the F statistic and its associatedprobability (see discussion in Appendix B).
37

Table 17 presents the Beta coefficients associated with each significant independent variable in theanalysis. Because the demographic explanatory variables were not significantly related to SPOUSEPROBLEMS, the Beta coefficients listed in Table 17 are just for attitudinal variables.
Table 17. Relative Effects of Independent Variables on Problems Experienced Because of Changes
Created by ODS/S for Spouses of Enlisted Personnel
Significant VI s b '! Beta Coffct enUpset with Mobilization 0.11
Effect on Spouse's Job (Does Not Affect Spouse's Job)
Affects Spouse's Job -0.28S.................................................................................................. o........................................................................................................................................ o..........................
Stress Caused by ODS/S 0.17oo............................................................................................... ............................................... ......................................................................................................................
Satisfaction with Family Relationships 0.10
Note: Reference groups for dichotomous and categorical variables are shown in parentheses. Groups that were notsignificantly different from the reference group are not shown in the table; thus, the categories included for each variablemay be different in different tables.
Enlisted Service members' spouses who were upset with the ODS/S mobilization were more likelyto report problems associated with ODS/S. This result is not surprising, since frustrations with themobilization process are logically related to perceived problems with the deployment.
If the ODS/S deployment of the enlisted Service member affected the spouse's job, the spousetended to report more severe problems with changes that occurred as a result of ODS/S deployment.Evidently, the prevalence of multiple-income families caused problems when one (or more) of the wageearners was deployed in ODS/S. This effect has probably increased in today's force due to the largeproportion of working spouses and the increased importance of their jobs.
Spouses who reported less stress caused by ODS/S (a positive Beta coefficient) tended to reportfewer problems. This is consistent with results of earlier studies that suggested stress as a cause ofdissatisfaction and problems for spouses of soldiers on hazardous duty assignments.
The higher the spouse's satisfaction with the "family relationships" aspect of military life, the lesslikely she or he was to report problems. Presumably, if the family situation was more stable, ODS/Sdeployment caused fewer problems for the spouse.
Officers
For officers' spouses, the model results were similar (Table 18). Three of the significantvariables-upset with mobilization, stress caused by ODS/S, and satisfaction with family relationships-were the same for officers' spouses as for spouses of enlisted personnel (Tables-'7 and 19). The onevariable that was different (i.e., dissatisfaction with separation from member) had the expected impact-the more dissatisfied the officer's spouse was over the separation, the more severely he or she rated theproblems associated with ODS/S.
38
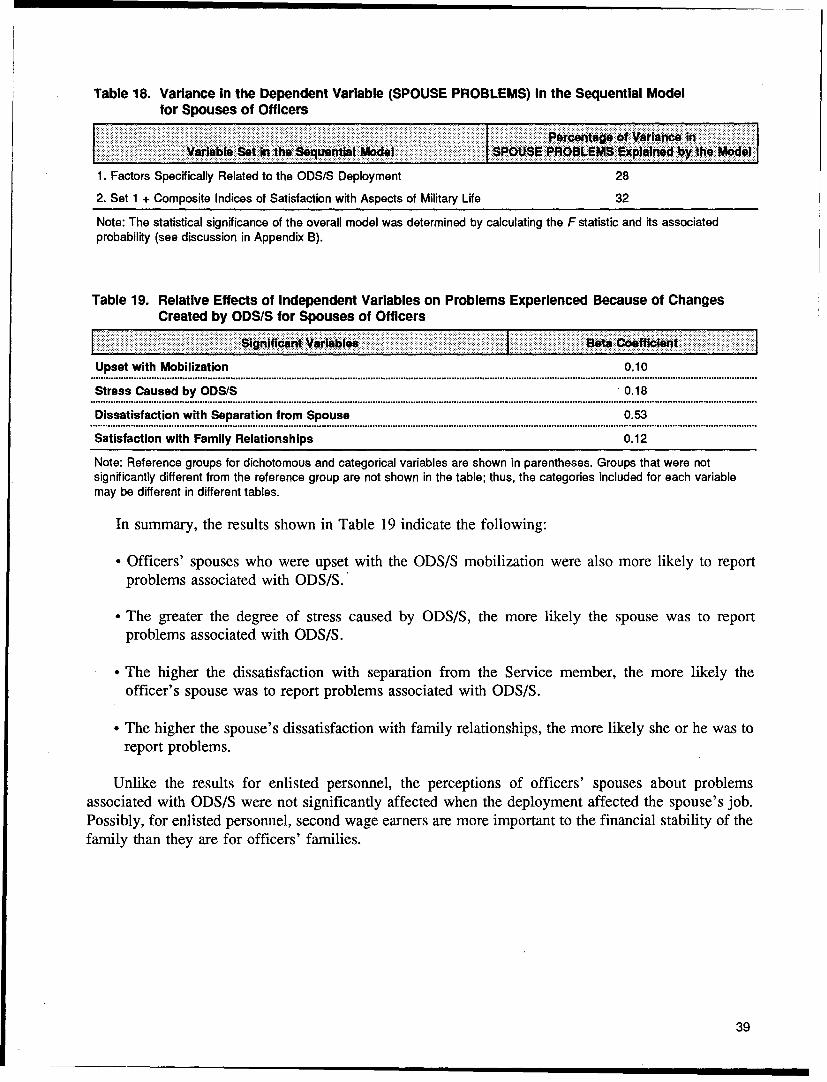
Table 18. Variance In the Dependent Variable (SPOUSE PROBLEMS) In the Sequential Modelfor Spouses of Officers
..... e ... .. . Pewetags- of Vaiance InýiiiiýýVf ibso ý4 0`1 odPOSPRO0~M .pareb he Model
1. Factors Specifically Related to the ODS/S Deployment 28
2. Set 1 + Composite Indices of Satisfaction with Aspects of Military Life 32
Note: The statistical significance of the overall model was determined by calculating the F statistic and its associatedprobability (see discussion in Appendix B).
Table 19. Relative Effects of Independent Variables on Problems Experienced Because of Changes
Created by ODS/S for Spouses of OfficersSignMicnt Varilbtes Bt offlcieifl
Upset with Mobilization 0.10S.................................... ,...................................... ,................................................ ,...................................... .......................................................... o....................................... 0.
Stress Caused by ODS/S 0.18
Dissatisfaction with Separation from Spouse 0.53
Satisfaction with Family Relationships 0.12
Note: Reference groups for dichotomous and categorical variables are shown in parentheses. Groups that were notsignificantly different from the reference group are not shown in the table; thus, the categories included for each variablemay be different in different tables.
In summary, the results shown in Table 19 indicate the following:
"• Officers' spouses who were upset with the ODS/S mobilization were also more likely to reportproblems associated with ODS/S.
"• The greater the degree of stress caused by ODS/S, the more likely the spouse was to reportproblems associated with ODS/S.
• The higher the dissatisfaction with separation from the Service member, the more likely theofficer's spouse was to report problems associated with ODS/S.
"* The higher the spouse's dissatisfaction with family relationships, the more likely she or he was toreport problems.
Unlike the results for enlisted personnel, the perceptions of officers' spouses about problemsassociated with ODS/S were not significantly affected when the deployment affected the spouse's job.Possibly, for enlisted personnel, second wage earners are more important to the financial stability of thefamily than they are for officers' families.
39
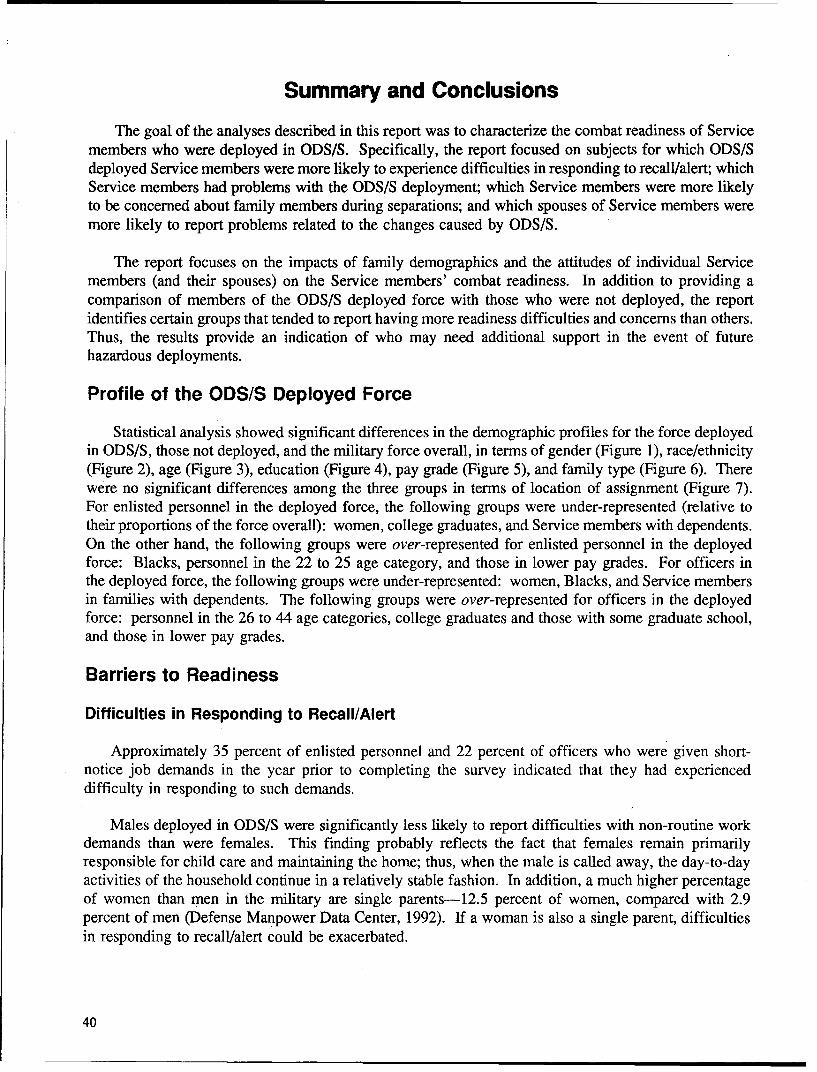
Summary and Conclusions
The goal of the analyses described in this report was to characterize the combat readiness of Servicemembers who were deployed in ODS/S. Specifically, the report focused on subjects for which ODS/Sdeployed Service members were more likely to experience difficulties in responding to recall/alert; whichService members had problems with the ODS/S deployment; which Service members were more likelyto be concerned about family members during separations; and which spouses of Service members weremore likely to report problems related to the changes caused by ODS/S.
The report focuses on the impacts of family demographics and the attitudes of individual Servicemembers (and their spouses) on the Service members' combat readiness. In addition to providing acomparison of members of the ODS/S deployed force with those who were not deployed, the reportidentifies certain groups that tended to report having more readiness difficulties and concerns than others.Thus, the results provide an indication of who may need additional support in the event of futurehazardous deployments.
Profile of the ODS/S Deployed Force
Statistical analysis showed significant differences in the demographic profiles for the force deployedin ODS/S, those not deployed, and the military force overall, in terms of gender (Figure 1), race/ethnicity(Figure 2), age (Figure 3), education (Figure 4), pay grade (Figure 5), and family type (Figure 6). Therewere no significant differences among the three groups in terms of location of assignment (Figure 7).For enlisted personnel in the deployed force, the following groups were under-represented (relative totheir proportions of the force overall): women, college graduates, and Service members with dependents.On the other hand, the following groups were over-represented for enlisted personnel in the deployedforce: Blacks, personnel in the 22 to 25 age category, and those in lower pay grades. For officers inthe deployed force, the following groups were under-represented: women, Blacks, and Service membersin families with dependents. The following groups were over-represented for officers in the deployedforce: personnel in the 26 to 44 age categories, college graduates and those with some graduate school,and those in lower pay grades.
Barriers to Readiness
Difficulties in Responding to Recall/Alert
Approximately 35 percent of enlisted personnel and 22 percent of officers who were given short-notice job demands in the year prior to completing the survey indicated that they had experienceddifficulty in responding to such demands.
Males deployed in ODS/S were significantly less likely to report difficulties with non-routine workdemands than were females. This finding probably reflects the fact that females remain primarilyresponsible for child care and maintaining the home; thus, when the male is called away, the day-to-dayactivities of the household continue in a relatively stable fashion. In addition, a much higher percentageof women than men in the military are single parents-12.5 percent of women, compared with 2.9percent of men (Defense Manpower Data Center, 1992). If a woman is also a single parent, difficultiesin responding to recall/alert could be exacerbated.
40
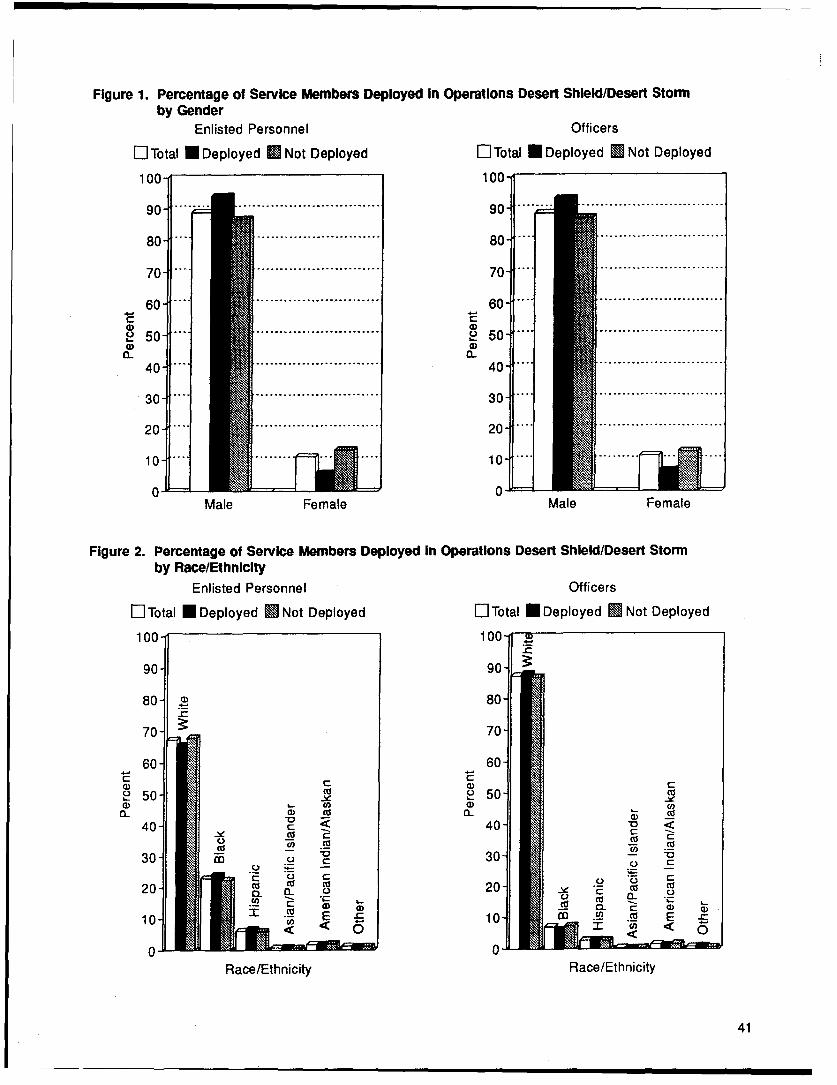
Figure 1. Percentage of Service Members Deployed In Operations Desert Shield/Desert Stormby Gender
Enlisted Personnel Officers
El Total U Deployed E Not Deployed El Total U Deployed M Not Deployed
100- 100-
I
50 .. . ........................... 2 9 0 " .. . ...........................
40 - ........................... 40 " ...........................
30 " ............... ........... 30 " ............................
6 0 - " ............... ............ 0 .......................... .(1))
10 -10 . . . . . . .. . .. . . . . .
0
0-
Male Female Male Female
Figure 2. Percentage of Service Members Deployed in Operations Desert Shield/Desert Stormby Race/EthnIcity
Enlisted Personnel Officers
El Total U Deployed M Not Deployed EliTotal N Deployed M Not Deployed
100- 100- w
90- 90-
80- cD 80"
70- 70"
60- 60"CcC " () C
CU 5)50-561- a) Co•
Q3_ Co
40- 40"
-- "z 3 0-z-
30- 30o
-
20 e 20- "- Cd
10.- C a) (Dt CL a) w
"1 -10 - Lz•_ ._ E
< 0 7- (n < 0
Race/Ethnicity Race/Ethnicity
41
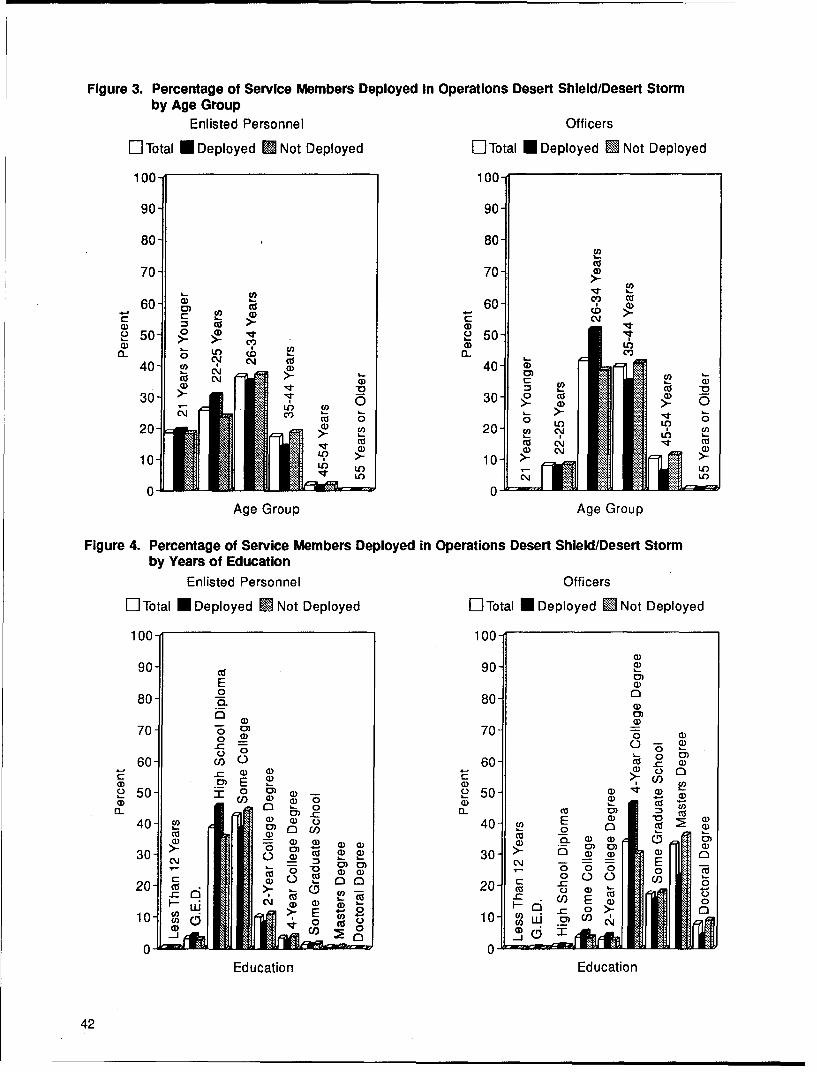
Figure 3. Percentage of Service Members Deployed In Operations Desert Shield/Desert Stormby Age Group
Enlisted Personnel Officers
ElTotal U Deployed Not Deployed LiTotal U Deployed SNot Deployed
100 100
90 90
80 80a,Cu
70 a,
60 � - c', Cua,
a, Cu
60 �,
�.- a,a, � Cu a,
250 � 250a, a, LI)
0 LI) �40 � C�J Cu
a, 40 �0) N
Cu c'.i a, cn a,a, -�
_ Cu0 >- a, N
30 N
300 Cu
20 20 a, e'� � �,Cu Cu c�j " \ � Cua,
a, a,10 � U;) >
10 N
LI) � � '� LI)
Age Group U)Age Group
FIgure 4. Percentage of Service Members Deployed in Operations Desert Shield/Desert Stormby Years of Education
Enlisted Personnel Officers
LuTotal U Deployed �Not Deployed ElTotal U Deployed �Not Deployed
100 100a,a,
90 Cu 90E a,0
80 _ 80 0a,
O 0)a, a,0)
70 o 70 o a,- a,
0 �-0 �
60 Cl)0 60 Cu � a,
- a, a, a, 0 0
a, _ 2? a,250 Ia 0 )
a,� 250 a, � a, a,
a, Cl) � a, 0 a, 2? Cu a,
0 0)
40 � 40 � 0Cu a, a, a, a, a, Cu � a, a, C
30 >0? 0 � aa, 30 � � a,
_ 00)0) - --
a, a, - 0 0 0 0 Cu
20 Cu 6 - )L� 20 � -� Cu>- �-O Cu o a, �-
'Cu �?CU *� Cl) E a, 0
Hw a, a, a,�10 �j >E 0 10 HQ� o>- 0
a, '4o�0-j U'
0* 0Education Education
42
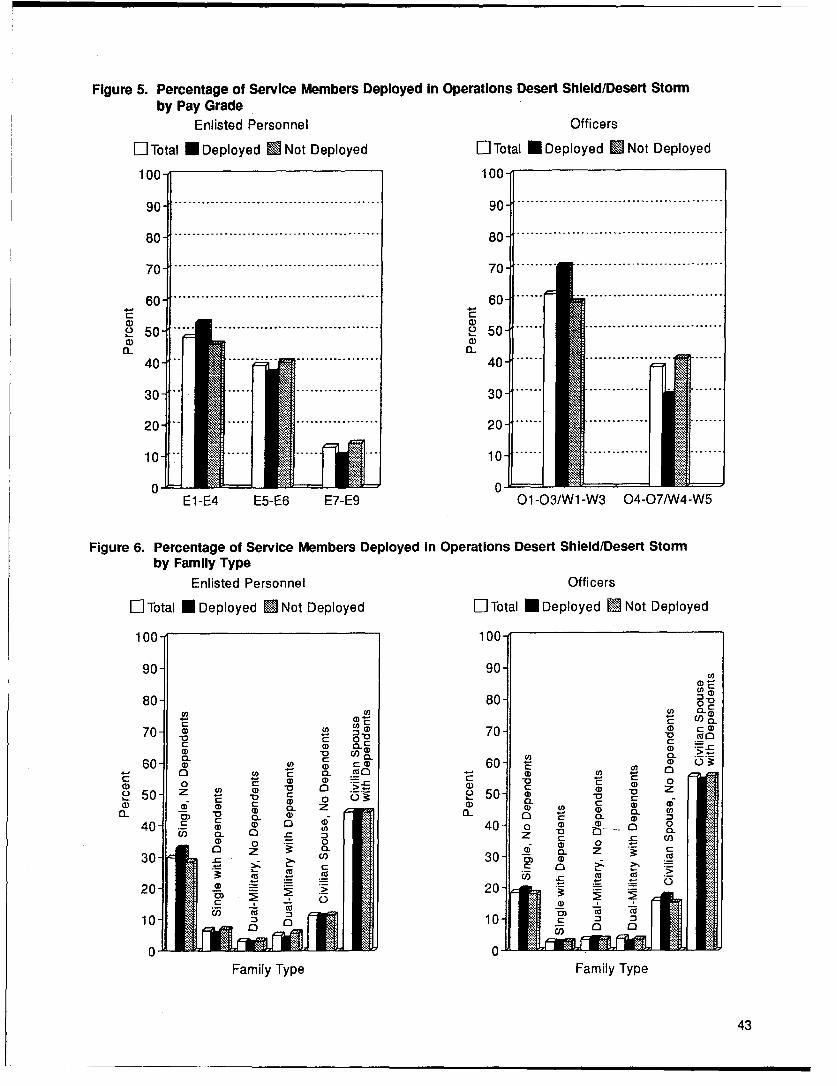
Figure 5. Percentage of Service Members Deployed In Operations Desert Shield/Desert Stormby Pay Grade
Enlisted Personnel Officers
El Total U Deployed M Not Deployed LZTotal N Deployed M Not Deployed
100- 100-
90 ........-------------- *....................90.-----.*-------......... ---------
80...................-- --------- ...... ..............8................70........
60.. . .. . . ...... 6 -............. ..
CD a)0a-
10- 0
E1-E4 E5-E6 E7-E9 O1-03/Wl-W3 04-O7/W4-W5
Figure 6. Percentage of Service Members Deployed In Operations Desert Shield/Desert Stormby Family Type
Enlisted Personnel Officers
El Total N Deployed M Not Deployed El Total U Deployed M Not Deployed
100- 100-
90- 90-
CD
70-- 0 : I
70 Co 0a 70-a L C
60 Co a 60- 0 C
a) -o CD 0~a, a) " . C 'a 0
50 'a CD 50 a)(D C, z a, 0UC C a,
c , a Za Co a, Ca Co
40 a 0 0 40 o 0 C
40~ a- a z n aCD 00 0 UM
30za30- U) 30 CU
10 104-
200
Family Type Family Type
43
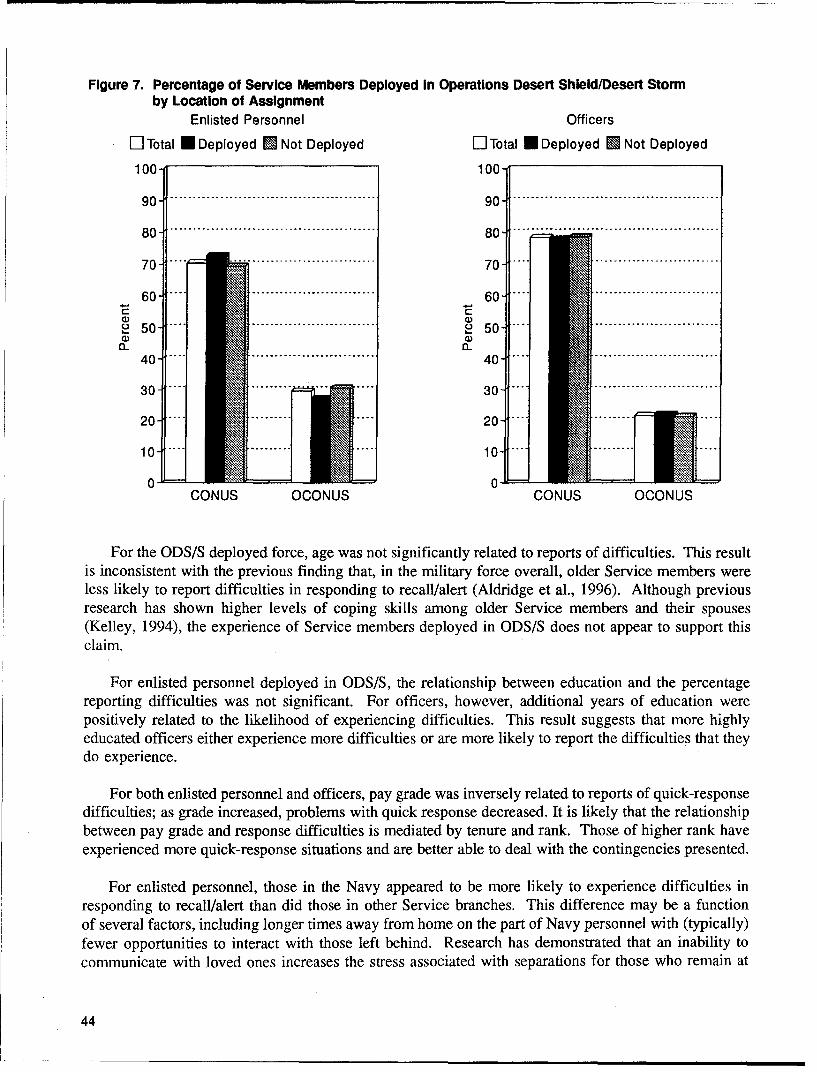
Figure 7. Percentage of Service Members Deployed In Operations Desert Shield/Desert Stormby Location of Assignment
Enlisted Personnel Officers
E]Total m Deployed M Not Deployed El-Total m Deployed M Not Deployed
100- 100-
90- ........ ......................................................
80- ........ 80.... ....... ..................
4 0 - .. ............70 - " .............................60 60........3...........................
2 0 - .... ... .5 0 " ". . ..... .. .. .. ... . . . . . . . .
a) a
1 0 - 1 ... .... . ... 1 0. .. ... ... .. . . . . . . .
0- 0"CON US OCON US CON US OCONU S
For the ODS/S deployed force, age was not significantly related to reports of difficulties. This resultis inconsistent with the previous finding that, in the military force overall, older Service members wereless likely to report difficulties in responding to recall/alert (Aldridge et al., 1996). Although previousresearch has shown higher levels of coping skills among older Service members and their spouses(Kelley, 1994), the experience of Service members deployed in ODS/S does not appear to support thisclaim.
For enlisted personnel deployed in ODS/S, the relationship between education and the percentagereporting difficulties was not significant. For officers, however, additional years of education werepositively related to the likelihood of experiencing difficulties. This result suggests that more highlyeducated officers either experience more difficulties or are more likely to report the difficulties that theydo experience.
For both enlisted personnel and officers, pay grade was inversely related to reports of quick-responsedifficulties; as grade increased, problems with quick response decreased. It is likely that the relationshipbetween pay grade and response difficulties is mediated by tenure and rank. Those of higher rank haveexperienced more quick-response situations and are better able to deal with the contingencies presented.
For enlisted personnel, those in the Navy appeared to be more likely to experience difficulties inresponding to recall/alert than did those in other Service branches. This difference may be a functionof several factors, including longer times away from home on the part of Navy personnel with (typically)fewer opportunities to interact with those left behind. Research has demonstrated that an inability tocommunicate with loved ones increases the stress associated with separations for those who remain at
44
home (Kelley, 1994; Milgram & Bar, 1993). Interestingly, however, Navy officers were no more likelyto report difficulties than were officers in other Service branches. Also, Marine officers were less likely(by approximately 29 percent) to report difficulties than those in any of the other branches.
As compared with the reference group (Service members with civilian spouses and no dependents),Service members with military spouses and dependents were more likely to have quick-responseproblems. Clearly, the presence of children (i.e., the majority of dependents) presents complications thatmake it harder to respond quickly to abrupt changes at work. This finding supports the conclusionreached in post-ODS/S studies-that dual-military marriages present special challenges requiring morein-depth attention (see, for example, Presidential Commission on the Assignment of Women in theArmed Forces, 1992). Curiously, though, single Service members with dependents (i.e., primarily singleparents) were no more likely to report quick response problems than were married Service members withno dependents. It is possible that single parents are more likely to have contingency care plans in placeat all times, so that changes in work schedules or duties present no more challenge than do other aspectsof daily life.
Problems Responding to ODS/S Deployment
Gender was not a significant factor for enlisted personnel in the PROBLEMS model, which focusedon problems specifically related to ODS/S deployment. For officers, however, males were less likelyto report deployment problems than were females. More highly educated Service members, both enlistedpersonnel and officers, were more likely to report problems.
Several military demographics-pay grade, military occupation (for enlisted personnel), and Servicebranch (for officers)-were related to the likelihood of reporting ODS/S deployment problems. Morehighly paid Service members, both enlisted personnel and officers, were less likely to report problems.Enlisted personnel involved in electronic equipment repair or electronic/mechanical equipment repairwere, on average, more likely to report problems than were those in other occupations. The highdemand for electronics technicians to man the high-tech weapons used in ODS/S may have contributedto their perceptions of problems responding to the deployment, especially those personnel who wereheavily committed elsewhere.
The influence of family factors was predictable for officers. Those officers in families withdependents were more likely to report problems. For enlisted personnel, however, single Servicemembers and those in dual-military families were not significantly different from those with civilianspouses and no dependents.
Family Concerns While Separated
Although males deployed in ODS/S reported fewer difficulties in responding to recall/alert than didfemales, they reported more concerns about the safety of their families during periods of separation.This result may be attributable in part to the fact that many men feel responsible for the role of familyprotector and, therefore, feel frustrated when they are separated from their families. In addition, womenmay be more familiar with and more confident in the support mechanisms available through the military(e.g., child care).
Hispanic officers and those in other non-Black, non-White race/ethnic groups (i.e, AmericanIndian/Alaskan Native, Oriental/Asian/Chinese/Japanese/Korean/Filipino/Pacific Islander, or other)
45
reported significantly higher levels of concern about their families while they were away from home thandid Whites or Blacks. For enlisted personnel, only the "Other" race/ethnic category was significantlydifferent from Whites, showing a greater likelihood than Whites to have higher levels of concern abouttheir families while they were away from home. Enlisted personnel in the Navy and the Marine Corpswere more likely to report concern than those in the Army and Air Force. For officers, there were nosignificant differences by Service branch. As expected, officers with dependents (with the exception ofthose in dual-military families) reported more concern about their families when they were deployed thandid those with civilian spouses and no dependents (the reference group). Interestingly, enlisted Servicemembers with dependents were no more likely to report concern than were those with civilian spousesand no dependents (the reference group).
For both enlisted personnel and officers, the variable with the strongest impact on concerns aboutfamily during separations was satisfaction with military life. Those who were more satisfied with theirmilitary careers reported fewer concerns when separated from their families. The question arises whetherhaving fewer concerns leads to higher levels of career satisfaction or whether being satisfied with one'scareer serves to decrease family-related concerns. The former would seem to be the more likelyrelationship, in that stress over family situations could have a negative influence on an individualmember's satisfaction, whereas that individual's satisfaction with his/her military career in general wouldbe unlikely to quell family concerns.
Spouse's Perception of Problems Due to Changes Created by ODS/S
In the PROBLEMS model, demographic characteristics were not significantly related to militaryspouses' perceptions of problems created by the ODS/S deployment. The results for this modelsuggested that the spouses most likely to report problems with changes created by ODS/S were thosewho were upset with the mobilization process, more dissatisfied with separation from the Servicemember, under greater stress, and less satisfied with family relationships in general. These results heldfor the spouses of both enlisted personnel and officers. Unlike the spouses of enlisted personnel,however, officers' spouses did not perceive more problems when their own jobs were affected by theODS/S deployment. Possibly, second jobs are less important financially in officers' households than inthose of enlisted personnel.
Conclusions
In conclusion, analysis of the survey results suggests the following:
" Service members who appear to require more attention and support as they attempt to cope withshort-notice job demands and hazardous deployments such as ODS/S include females, youngService members, and those with families and/or dependents.
" Although characteristics of Navy life seem to contribute to greater difficulties in responding tochanging job demands and increased concerns while deployed, the differences across Services arenot apparent for the ODS/S deployed group. The survey results suggest that, in preparation fora major deployment such as ODS/S, personnel in all Service branches tend to have similarproblems and concerns.
"* Although older, more experienced personnel seem to be able to respond to quick recall/alerts withless difficulty, age was not a significant factor in predicting problems related to the ODS/S
46
deployment. Instead, other characteristics, such as more years of education and more technicaloccupations, were associated with a higher incidence of problems.
• Satisfaction with one's career is related to the ability to respond to the demands of military lifeand the degree to which such demands result in concerns about family.
° Spouses' perceptions of problems with the ODS/S deployment were unaffected by demographics.Spouses' disappointments with the mobilization process, dissatisfaction with separations,dissatisfaction with family relationships, frustration over impediments to their careers, and otherattitudinal factors contributed to a heightened awareness of problems related to ODS/S.
47
References
Aldridge, D.M., Sturdivant, T.T., Smith, C.L., & Lago, J.L. (1996). Individual and family readinessfor separation and deployment. Bethesda, MD: Washington Consulting Group, Inc.
Archer, R.P., & Cauthorne, C.V. (1986). A final report on an investigation of the effects of deployment-related factors on performance and psychosocial adjustment (Technical Report No. ONR N00014-84-C-0666). Arlington, VA: Office of Naval Research.
Beckman, K., Marsella, A.J., & Finney, R. (1979). Depression in wives of nuclear submarinepersonnel. American Journal of Psychiatry, 136, 524-526.
Campbell, C.H., Campbell, R.C., Ramsberger, P., Schultz, S., Stawarski, C. & Styles, M. (1991). Amodel of family factors and individual and unit readiness: Literature review. Alexandria, VA: U.S.Army Research Institute for the Behavioral and Social Sciences.
Department of Defense. (1991). Occupational conversion manual (DoD 1312.1-M). Washington, DC:Office of the Assistant Secretary of Defense (Personnel and Readiness).
Department of Defense. (1993). Family status and initial term of service, Vol. II - Trends andindicators. Washington, DC: Office of the Assistant Secretary of Defense (Personnel andReadiness).
Defense Manpower Data Center. (1992). Fact sheet: Women in the military. Arlington, VA.
Kelley, M.L. (1994). Military-induced separation in relation to maternal adjustment and children'sbehaviors. Military Psychology, 6, 163-176.
Mardia, K.V., Kent, J.T., & Bibby, J.M. (1979). Multivariate analysis. London, UK: Academic Press.
Milgram, N.A., & Bar, K. (1993). Stress on wives due to husbands' hazardous duty or absence.Military Psychology, 5, 21-40.
Presidential Commission on the Assignment of Women in the Armed Forces. (1992). Report to thePresident. Washington, DC: U.S. Government Printing Office.
Rosen, L.N., & Moghadam, L.Z. (1990). Matching the support to the stressor: Implications for thebuffering hypothesis. Military Psychology 2, 193-204.
Segal, M.W., & Harris, J.J. (1993). What we know about Army families. ýSpecial Report 21).Alexandria, VA: U.S. Army Research Institute for the Behavioral and Social Sciences.
49
Appendix A. Study Design
The 1992 Department of Defense Surveys of Officer and Enlisted Personnel comprised four separatesamples: longitudinal, recruiters, members, and Active Guard/Reserve or Training and Administrationof the Reserve (AGR/TAR) members. The sample design for this survey was a stratified sample selectedfrom active duty personnel as of December 1991. The database used in the analysis for this reportincluded all four samples combined.
Sample Design
The samples were selected by probability methods. That is, each eligible individual had a non-zero,known probability of selection. This procedure allowed for the projection of the survey results to thetarget population. Sampling design for the 1992 surveys proceeded as follows: identify samplingframes, devise stratification scheme, select sampling methodology, decide sampling sizes, select sample,and develop weights. These steps are described in the following sections.
Target population and sampling frames. The target population is the group being estimated by thesample. For example, the target population for the recruiter sample was all recruiters. A sampling frameis a database that represents the target population from which a sample is drawn.
Stratification. Stratification is a sample design feature that seeks to reduce the variance of sampleestimates by defining homogeneous subgroups of sampling units and selecting the samples independentlywithin each stratum. In addition, stratification may be used to control subgroup sample sizes. For the1992 surveys, the stratification variables were identifiers present in the Active Duty Military Master andLoss (M&L) File and in the Reserve Component Common Personnel Data System (RCCPDS). Thelongitudinal sample was not stratified, but it reflected the stratification carried out in the selection of the1985 sample. The definitions of the stratification cells for the other three samples are identified below.
The target populations, sampling frames, stratification schemes, and sample sizes corresponding toeach of the four samples selected for the 1992 surveys were as follows:
- The longitudinal sample consisted of a subsample of 11,999 from the personnel selected for the1985 Department of Defense Survey of Officers and Enlisted Personnel who were still in themilitary as of December 1991. The sampling frame was based on the file of the 1985 sample andthe 1992 M&L File.
• The recruiter sample consisted of 3,999 recruiters, approximately 1,000 per Service. The samplingframe was extracted from the 1992 M&L File.
- The member sample consisted of members on active duty as of December 1991 who were in theService for 4 or more months and were neither recruiters nor included in the 1985 survey. Thesample of 75,345 active military personnel was derived by selecting approximately 5,000 membersfrom each of the 16 cells defined by Service, officer/enlisted status, and gender. The samplingframe was constructed from the M&L File.
- The AGR/TAR sample consisted of members included in the RCCPDS. The sample includedapproximately 500 AGR/TAR from each of the 14 cells defined by seven levels of Reserve
51
Component and officer/enlisted status (some cells had fewer than 500 members). A total of 5,484full-time, support AGR/TAR members were selected.
Sample selection. The longitudinal sample was selected using simple random (equal probability)sampling of eligible from the 1985 survey. The recruiter sample was selected with simple randomsampling from within each of the four Services. The member sample was selected with simple randomsampling within each of the 16 previously cited strata. If there were fewer than 5,000 Service membersin a member-sample stratum, all members were included in the sample. The AGR/TAR sample wasselected by simple random sampling from within each of 14 sampling strata defined by ReserveComponent and enlisted/officer status.
Weighting. Weights were developed to reflect the variable probabilities of selection and nonresponseadjustments. Weighting in sample surveys has several objectives: (a) to reflect varying probabilitiesof selection; (b) to adjust for sample losses due to nonresponse; and (c) to adjust for deficiencies in thesampling frame that may introduce bias.
Each sample selected for the 1992 surveys consisted of only a subset of its respective targetpopulation. Therefore, to represent the entire population, it was necessary to derive base weights thatprojected the sample to the populations covered by the sampling frames. The base weight is thereciprocal of the probability of selection. For the longitudinal sample, which did not involvestratification, the base weight (B"W) was computed as:
BWT = (number in population in 1992) / (sample size)
For the other three samples that were stratified, the base weight was computed within stratum as:
BWTs = (number in the stratum) / (stratum sample size)
To account for nonresponse, the base weight was adjusted by a nonresponse factor. Nonresponseadjustment through weighting implies that, within adjustment cells, nonrespondents are similar torespondents with respect to the characteristics being measured by the survey. To develop thenonresponse adjustment, respondents and nonrespondents were partitioned into adjustment cells basedon Service, status, and gender. For each of the four samples, the nonresponse adjustment was developedas all eligible (respondents and nonrespondents) divided by all respondents. The nonresponse adjustmentcells corresponded to the sampling strata. That is, for sampling stratum S, the nonresponse adjustmentfactor, Fs, is:
Fs = (eligible)s / (respondents)s
Multiplying the base weight by the corresponding nonresponse adjustment factor (i.e., BWTs x Fs)made the respondents represent not only the segment of the population they were sampled to representbut also nonrespondents in adjustment cell S.
The last phase of the weighting process involved raking to known population totals for various keycharacteristics. (Raking is a computational procedure that adjusts the final weight so that the weightedestimate from the sample corresponds to known totals for the groups defined by the raking variables.)Three levels of raking were performed. The first level of raking was indexed by Service, enlisted/officerstatus, and gender. Status was not used in raking the recruiters sample. The second level was indexed
52

by pay grade and race/ethnicity, and the third level by marital status. This process adjusted the weightsso that the sum of the weights for respondents over the raking variables corresponded to the knowncounts of eligible respondents in the respective cells.
Data Collection
Questionnaire development. Each of the 1992 survey instruments was constructed around a core setof questions comparable to those used in previous personnel surveys, particularly the 1985 Surveys ofOfficers and Enlisted Personnel. The questionnaire content focused on information about personal andmilitary background, family composition, economic status, preparedness, career plans, satisfaction withvarious aspects of military life, and assessment of military programs and services. In addition, the 1992surveys included questions regarding Operations Desert Shield/Desert Storm. Separate instruments wereadministered to enlisted personnel and officers. The enlisted and officer questionnaires were nearlyidentical, except on questions relating to enlistment intentions and promotions.
Administration. The data collection for the 1992 surveys was conducted by the Defense ManpowerData Center (DMDC) from May to October 1992. First, the total sample was aggregated by unit. Anyunit with more than one member selected for the survey was sent a pre-notification letter, advising theunit commander of the survey and requesting that a point-of-contact (POC) be appointed to receive anddistribute the surveys. A total of 10,973 pre-notification letters were mailed to units in April 1992.Address correction was required for 667 (6 percent) of the units.
The first questionnaires were mailed to units for distribution to members beginning in late April andcontinuing through May 1992. If only one member from a unit was selected to participate in the survey,that member was sent the survey package directly (approximately 7 percent of the sample).
Although nonresponse is present in all voluntary surveys, the potential bias caused by nonresponsecan be reduced by thorough nonresponse follow-up. In the 1992 study, nonresponse at the unit level washandled by sending three follow-up letters. The first letter notified the POCs of the units from whichDMDC had not received the survey check lists; the second letter informed the POC that the roster ofsurvey participants had not been received; and the third letter was a notification that the completedsurveys had not been returned to DMDC. Follow-up questionnaires were mailed 1 to 2 months later tononrespondents directly at their units.
Response rates. The initial 1992 sample consisted of 40,812 officers and 56,015 enlisted personnel,for a total of 96,827 members. According to POC-provided information, 6,557 individuals in the samplehad separated from the military by the time the survey was administered. Ultimately, the number ofeligible members was 90,270.
At the close of the data collection in October 1992, a total of 59,930 completed surveys (27,684officers and 32,246 enlisted) had been received. The level of nonresponse varied by Service, pay grade,and gender. Response rates were calculated based on the number of completed returns and the numberof eligible members. The adjusted response rates were 72 percent for officers, 62 percent for enlistedpersonnel, and 66 percent overall. Response rates by gender were 67 percent for males and 66 percentfor females. Response rates for the Services were 72 percent for the Air Force, 71 percent for the Navy,62 percent for the Marine Corps, and 59 percent for the Army.
53
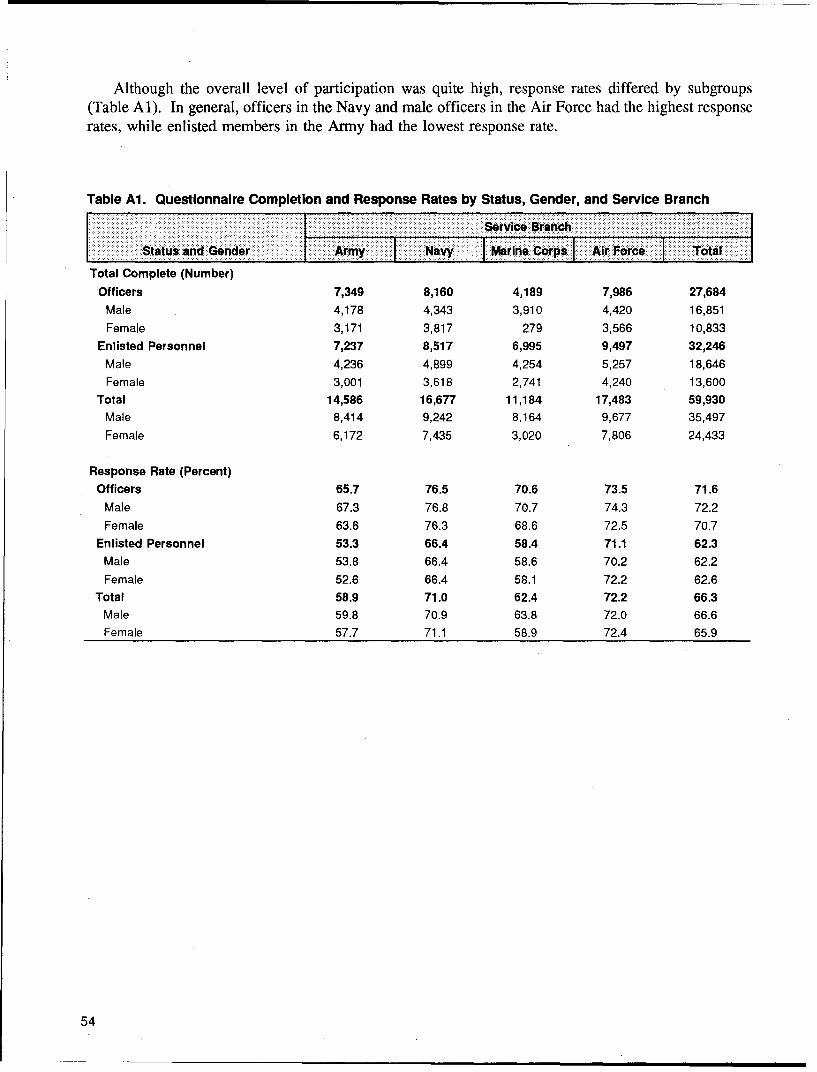
Although the overall level of participation was quite high, response rates differed by subgroups(Table Al). In general, officers in the Navy and male officers in the Air Force had the highest responserates, while enlisted members in the Army had the lowest response rate.
Table Al. Questionnaire Completion and Response Rates by Status, Gender, and Service Branch
I Service BranchStatus anid Gender Army F Navy fMarine Corps Air Force -ol
Total Complete (Number)Officers 7,349 8,160 4,189 7,986 27,684
Male 4,178 4,343 3,910 4,420 16,851Female 3,171 3,817 279 3,566 10,833
Enlisted Personnel 7,237 8,517 6,995 9,497 32,246Male 4,236 4,899 4,254 5,257 18,646Female 3,001 3,618 2,741 4,240 13,600
Total 14,586 16,677 11,184 17,483 59,930Male 8,414 9,242 8,164 9,677 35,497Female 6,172 7,435 3,020 7,806 24,433
Response Rate (Percent)Officers 65.7 76.5 70.6 73.5 71.6
Male 67.3 76.8 70.7 74.3 72.2Female 63.6 76.3 68.6 72.5 70.7
Enlisted Personnel 53.3 66.4 58.4 71.1 62.3Male 53.8 66.4 58.6 70.2 62.2Female 52.6 66.4 58.1 72.2 62.6
Total 58.9 71.0 62.4 72.2 66.3Male 59.8 70.9 63.8 72.0 66.6Female 57.7 71.1 58.9 72.4 65.9
54

Appendix B. Analysis Methodology
Analysis Database
The initial database used for the series of reports on the 1992 Department of Defense Surveys ofOfficer and Enlisted Personnel was prepared using Statistical Analysis System (SAS) software for DoDuse and served as the basis for a public-use tape. In the preparation of this file, the survey data werethoroughly edited, and analysis was carried out for key variables such as gender and race/ethnicity. Inaddition, constructed variables were developed from survey answers (e.g., total number of dependents),and from RCCPDS extracted information (e.g., location of current assignment--CONUS/OCONUS).Additional recodings and composite variables created during the course of this analysis are discussed inthe next two sections.
Extracting and recoding. The first step in the construction of the analysis database was to extractfrom the original DoD file a SAS file that included only the variables identified in the analysis plan.During this extraction step, all SAS character variables were converted to numeric variables so that theycould be used in SAS procedures. Several variable types need to be defined in order to explain theconversion. A categorical variable (e.g., race/ethnicity) has character values (e.g., 1 = White, 2 = Black)that represent possible categories or items. These variables were converted to numeric dichotomous (1= Yes, 0 = No) variables, one for each category. To use the race/ethnicity example, dichotomousvariables were created for White (1 = White, 0 = Non-white), Black (1 = Black, 0 = Non-black), and soon. An ordinal variable contains characters (e.g., 1 = Very Well, 2 = Well) that represent levels on ascale. These variables were simply made numeric in the analysis data set; some were used as is andsome were subject to further recoding. A continuous variable is a numeric variable that has significantdigits to the right of the decimal point; in other words, a continuous variable can have non-whole-numbervalues. In contrast to categorical variables, continuous variables in the analysis data set were appropriatefor models without modification.
The extracted data set was split into data sets for enlisted personnel and officers. Since the analysiswas to be performed separately for these two groups, these restricted data sets were more manageableand facilitated processing. In addition to the general character to numeric conversions described above,a series of recodes had to be performed to prepare variables for use in tabulations or models, and tofacilitate interpretation of the results. The following types of recodes were done:
" Valid skips were originally coded as SAS "special" missing values (.S). Following thisconvention, all "not applicable" responses were also recoded to the same special missing code (.S).This conversion differentiates these types of respondents from respondents who did not answer thequestion. A regular missing value is coded ".".
" For multiple-response categories measured with an ordinal scale, codes werereverse-scored whenthe highest code indicated a negative response. For example, one question asked how well aspouse would take care of family finances in the member's absence. It was answered using a scalethat varied from Very Well (1) to Very Poorly (5). After recoding, Very Well was scored a 5, VeryPoorly was scored a 1, and intermediate values were adjusted accordingly. This recodingfacilitated interpretation of the results by making responses uniform in their direction.
* Dichotomous variables were created for variables that had a No response and several options forthe Yes response. For example, in the Operations Desert Shield/Desert Storm (ODS/S) deployment
55

question, the four Yes responses (i.e., fewer than 3 months, 3 but fewer than 6 months, 6 but fewerthan 9 months, and 9 months or more) to the ODS/S deployment question were collapsed into asingle Yes category.
Response categories that had one-character codes representing ranges of values were assigned anumerical value corresponding to the midpoint of the range. This conversion captured the differentwidths of the ranges. For example, one pre-specified response option for "Total Value of Pay"ranged from $20,000 to $30,000. The original code of 2 was changed to a value of $25,000.
Constructed variables. New variables were developed using combinations of possible responses toa single question or of multiple questions (composite variables). One type of new variable consisted ofcombining categorical responses to several parts of a question. For example, respondents were askedhow many dependents they had in each of several age groups (e.g., under 1 year, 1 to under 2 years).A continuous variable for youngest dependent was constructed by identifying the lowest non-missinganswer (e.g., 2 dependents in the 1 to under 2 category) and entering the midpoint of the range (1.5 inthis case) as the value of the new variable.
Composite variables were created in order to capture the information from several multiple-itemquestions with response categories consisting of ordinal scales, thereby reducing the number of variablesto analyze. Factor analysis, a statistical technique that is used to identify a reduced number ofdimensions or "factors" present in a group of variables, was used for this purpose. Factor analysis givesthe analyst a systematic approach to understanding the interrelationships among items and uncoversgroups of items that measure the same concept or issue.
The factor identification was performed with the SAS procedure PROC FACTOR, using the principalcomponent approach to factor extraction (Mardia, Kent, & Bibby, 1979) and incorporating the finalweight. Each principal component calculated is a linear combination of the original variables and hasan eigenvalue which indicates how much variance is explained by that component or factor. "Factorloadings" describe the correlation of each original variable with the factor and indicate how much weightis assigned to each factor.
The initial matrix of factor loadings is difficult to interpret because many of the variables havemoderate-size correlations with several factors. Through a process of rotation, the matrix is transformedby applying a nonsingular linear transformation which groups the coefficients more closely around 0,1 or -1. Rotation makes assigning names to the common factors, which is always a subjective process,more objective by highlighting patterns. We used an orthogonal rotation, which maintains the axes ofthe matrix at a right angle. A variety of algorithms are used for orthogonal rotation. The mostcommonly used is the varimax method, which maximizes the variance of squared loadings and attemptsto minimize the number of variables that have high loadings on a factor. We used the varimax methodto enhance the interpretability of the factors. A statistic called Cronbach's coefficient Alpha was usedto assess the reliability of the factors identified through interpretation of the rotated matrix. Highcoefficient Alphas (0.7 and above) indicated a reliable composite variable.
The construction of the variable PROBLEMS ENCOUNTERED WITH PCS MOVES is an exampleof using factor analysis to develop composite variables. Each of 18 different potential problems wasrated by the respondent on a scale of Very Serious Problem to Not a Problem. A preliminary factoranalysis reduced the 18 items to five dimensions, as shown in Table B 1. Based on a member's responseto each of the 18 items, a "factor score" for each of the five dimensions was computed. The factor score
56
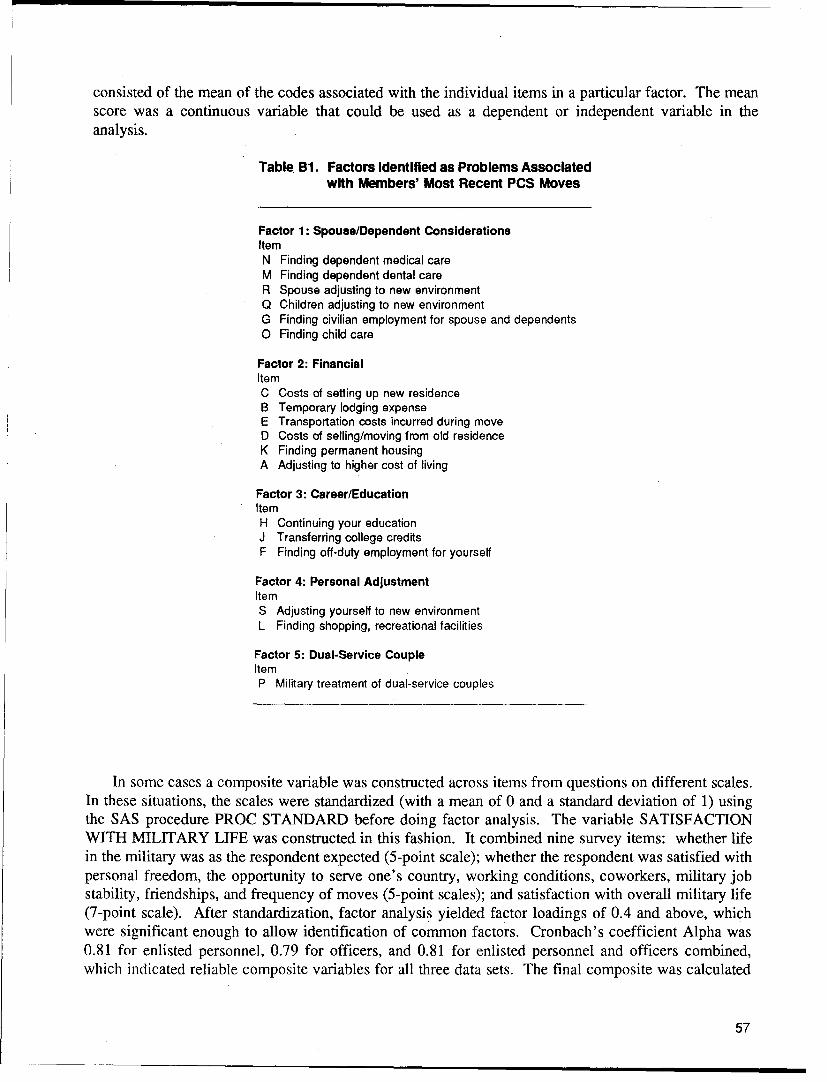
consisted of the mean of the codes associated with the individual items in a particular factor. The meanscore was a continuous variable that could be used as a dependent or independent variable in theanalysis.
Table B1. Factors Identified as Problems Associatedwith Members' Most Recent PCS Moves
Factor 1: Spouse/Dependent ConsiderationsItemN Finding dependent medical careM Finding dependent dental careR Spouse adjusting to new environmentQ Children adjusting to new environmentG Finding civilian employment for spouse and dependentsO Finding child care
Factor 2: FinancialItemC Costs of setting up new residenceB Temporary lodging expenseE Transportation costs incurred during moveD Costs of selling/moving from old residenceK Finding permanent housingA Adjusting to higher cost of living
Factor 3: Career/EducationItemH Continuing your educationJ Transferring college creditsF Finding off-duty employment for yourself
Factor 4: Personal AdjustmentItemS Adjusting yourself to new environmentL Finding shopping, recreational facilities
Factor 5: Dual-Service CoupleItemP Military treatment of dual-service couples
In some cases a composite variable was constructed across items from questions on different scales.In these situations, the scales were standardized (with a mean of 0 and a standard deviation of 1) usingthe SAS procedure PROC STANDARD before doing factor analysis. The variable SATISFACTIONWITH MILITARY LIFE was constructed in this fashion. It combined nine survey items: whether lifein the military was as the respondent expected (5-point scale); whether the respondent was satisfied withpersonal freedom, the opportunity to serve one's country, working conditions, coworkers, military jobstability, friendships, and frequency of moves (5-point scales); and satisfaction with overall military life(7-point scale). After standardization, factor analysis yielded factor loadings of 0.4 and above, whichwere significant enough to allow identification of common factors. Cronbach's coefficient Alpha was0.81 for enlisted personnel, 0.79 for officers, and 0.81 for enlisted personnel and officers combined,which indicated reliable composite variables for all three data sets. The final composite was calculated
57
based on the mean of these standardized items for cases with at least five of the nine survey itemspresent.
Statistical Procedures
The choice of statistical procedures used for the analyses conducted for this report was determinedby the nature of the variables and the research questions. In general, the analysis began with descriptivetabs, proceeded to simple descriptive tests (i.e., Chi-square), and then concluded with a complex model(either logistic or multiple regression).
A Chi-square test of independence, which is a test for the degree of association between twocategorical variables, was used as a first step in the analysis to identify statistically significantrelationships between pairs of categorical variables.
Logistic regression was used to determine the relative importance of particular sets of dichotomousor continuous independent variables on whether an event (e.g., experiencing difficulty responding torecall or alert) occurred or not. In developing the model, the dependent variable was represented by adichotornous variable. With this procedure it was possible: (a) to statistically assess the relativeimportance of each explanatory (independent) variable on the outcome measure (i.e., the dependentvariable); and (b) to test the applicability of the overall model. Relative odds, expressed as percentages,were computed from the Beta coefficients [(e' - 1) x 100] to indicate the increase or decrease in thelikelihood of an outcome compared to a reference group. For example, relative odds of -39 percent formales compared to females (the reference group) indicate that males are 39 percent less likely to havedifficulties than females. For a continuous variable, such as age, the relative odds refer to the impactof an increase of one unit (in this case, a year of age).
Multiple regression was used to examine the relationship of a set of independent variables with theexpected level of a dependent variable. This statistical procedure was applied when the dependentvariable was continuous or ordinal. The value of the t-statistic was used to determine which variablesshould be kept in the model by examining the significance of the coefficients associated with theexplanatory variables. The significance of the overall model was measured using the F statistic, whichwas based on the Wald Chi-square statistic, and an additional F test was used to assess the significanceof the increases in the overall quality of the model when new sets of variables were entered. Variableswere entered in related groups; that is, a systematic, hierarchical modeling approach was used. The finalmodel was determined by eliminating variables with coefficients that were not statistically significantat the 5 percent level.
Computing Software
The SAS® software was used to extract data from the initial database provided by the DoD,construct variables, and run descriptive tabulations. When the analysis graduated to descriptive tests andmodels, however, SAS was not appropriate. The sample design and estimation procedure for the 1992surveys had to be incorporated into the estimation of test statistics. Since survey data sets were basedon a complex sample design and estimation approach, the SUrvey DAta ANalysis (SUDAAN) softwarewas used to perform the modeling and compute test statistics used in the analyses
SUDAAN calculates model parameters, sampling errors, and test statistics for a variety of statisticalprocedures, including coefficients of linear regressions and loglinear models. The software uses Taylor
58

series linearization to approximate functions of linear statistics (e.g., means and linear regressioncoefficients) estimated from the sample data. It also accommodates weights that reflect varyingprobabilities of selection and other adjustments.
Three SUDAAN procedures-CROSSTAB, REGRESS, and LOGISTIC-were used in the analysisfor this report. These procedures allow for specification of the levels of stratification and theincorporation of the final weight associated with each observation when doing estimation and variancecalculations. CROSSTAB produces estimates of population totals and proportions, and a test ofindependence for each two-way table. The test statistic is based on the Wald statistic, which isdistributed as Chi-square with (R - 1)(C - 1) degrees of freedom, where R = row and C = column. TheREGRESS procedure fits multiple regression models to survey data. The statistical approach consistsof estimating the regression coefficients by first forming the Horvitz-Thomson estimators of thepopulation sums of squares and cross product matrices, and then using the Taylor series method toestimate the variance-covariance matrix of the coefficients. The LOGISTIC procedure fits logisticregression models to sample survey data so that the model parameter estimates and their variance-covariance matrix accurately accounts for the survey design. The Beta coefficients can be interpretedas linear regression coefficients and expressed as relative odds by (e6 - 1) x 100.
Statistical Backup
Tables B2 through B9 show the regression coefficients (estimated Betas) and associated P valuesfor the test of the hypothesis that the Beta coefficient is zero for each of the four dependent variablespresented in the report. The results for enlisted personnel and officers are presented separately.
59
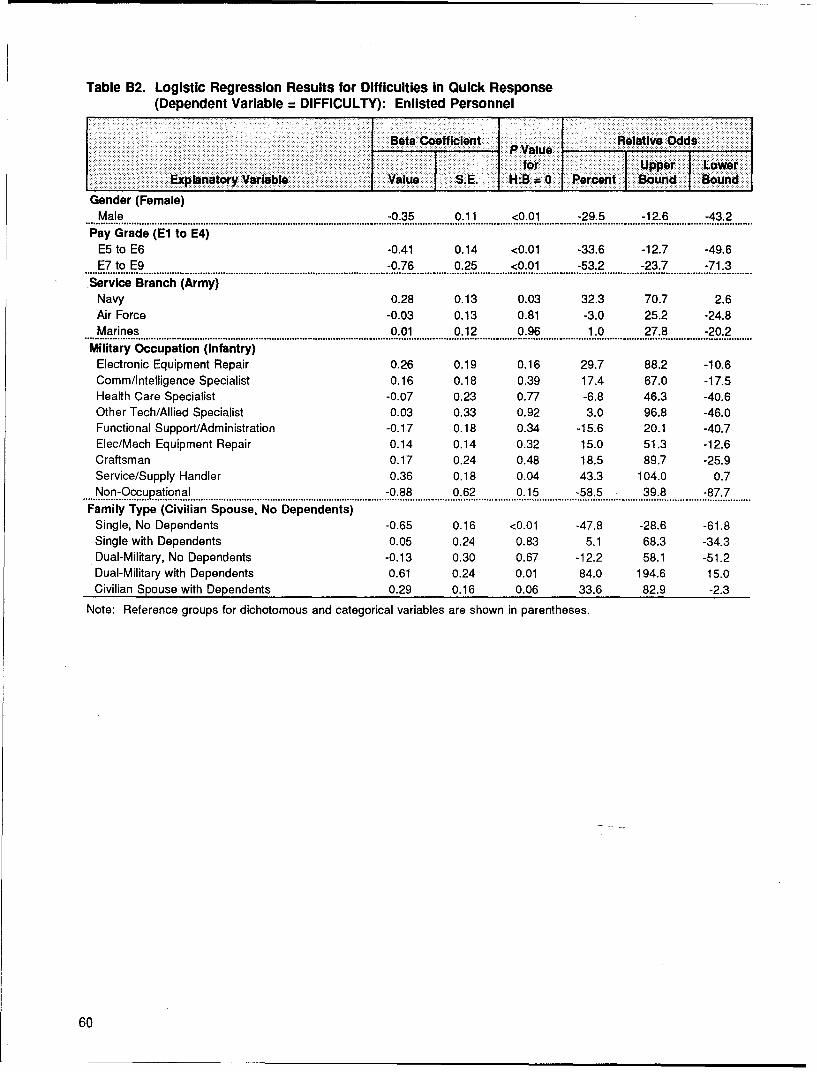
Table B2. Logistic Regression Results for Difficulties in Quick Response(Dependent Variable = DIFFICULTY): Enlisted Personnel
Beta Coeff icient P Value Relative Odds
for IUpper ILowerExlanatory Variable Value S.E. H:B = 0 Percent I Bound IBound
Gender (Female)Male -0.35 0.11 <0.01 -29.5 -12.6 -43.2...... ................................................................................. o ..................................................................................................................................................................
Pay Grade (El to E4)E5 to E6 -0.41 0.14 <0.01 -33.6 -12.7 -49.6E7 to E9 -0.76 0.25 <0.01 -53.2 -23.7 -71.3
Service Branch (Army)Navy 0.28 0.13 0.03 32.3 70.7 2.6Air Force -0.03 0.13 0.81 -3.0 25.2 -24.8Marines 0.01 0.12 0.96 1.0 27.8 -20.2
Military Occupation (Infantry)Electronic Equipment Repair 0.26 0.19 0.16 29.7 88.2 -10.6Comm/Intelligence Specialist 0.16 0.18 0.39 17.4 67.0 -17.5Health Care Specialist -0.07 0.23 0.77 -6.8 46.3 -40.6Other Tech/Allied Specialist 0.03 0.33 0.92 3.0 96.8 -46.0Functional Support/Administration -0.17 0.18 0.34 -15.6 20.1 -40.7Elec/Mech Equipment Repair 0.14 0.14 0.32 15.0 51.3 -12.6Craftsman 0.17 0.24 0.48 18.5 89.7 -25.9Service/Supply Handler 0.36 0.18 0.04 43.3 104.0 0.7Non..Ocupaional .- 0.88 0.62 0.15 -58.5 39.8 -87.7
Family Type (Civilian Spouse, No Dependents)Single, No Dependents -0.65 0.16 <0.01 -47.8 -28.6 -61.8Single with Dependents 0.05 0.24 0.83 5.1 68.3 -34.3Dual-Military, No Dependents -0.13 0.30 0.67 -12.2 58.1 -51.2Dual-Military with Dependents 0.61 0.24 0.01 84.0 194.6 15.0Civilian Spouse with Dependents 0.29 0.16 0.06 33.6 82.9 -2.3
Note: Reference groups for dichotomous and categorical variables are shown in parentheses.
60

Table B3. Logistic Regression Results for Difficulties in Quick Response(Dependent Variable = DIFFICULTY): Officers
Beta Coefficient PVleRelatiV4:Oddi-
for Upper ILowe~rEplanatory Variabl Value S.. H:B = 0 Parcan't Bound Bound
Gender (Female)Male -0.60 0.15 <0.01 -45.1 -26.4 -59.1
Pay Grade (01 to 03)04 to 07 -0.67 0.17 <0.01 -48.8 -28.6 -63.3
Service Branch (Army)Navy 0.08 0.14 0.56 8.3 42.5 -17.7Air Force -0.02 0.14 0.89 -2.0 29.0 -25.5Marines -0.34 0.13 0.01 -28.8 -8.2 -44.8Military Occupation (Engineering/Maintenance)
General Officer/Executive -0.07 0.52 0.90 -6.8 158.4 -66.4Tactical Operations Officer 0.32 0.17 0.06 37.7 92.2 -1.3Intelligence Officer -0.14 0.29 0.64 -13.1 o 53.5 -50.8Scientist/Professional -0.05 0.38 0.90 -4.9 100.3 -54.8Health Care Officer 0.48 0.23 0.04 61.6 153.7 3.0Administrator 0.01 0.26 0.98 1.0 68.1 -39.3Supply, Procurement, Allied Officer 0.24 0.23 0.30 27.1 99.5 -19.0Non- up ona ............................................... -0.04 0.31 0.90 -3.9 76.4 -47.7
Family Type (Civilian Spouse, No Dependents)Single, No Dependents -0.15 0.19 0.44 -13.9 24.9 -40.7Single with Dependents 1.34 0.30 <0.01 281.9 587.6 112.1Dual-Military, No Dependents -0.82 0.32 0.01 -56.0 -17.5 -76.5Dual-Military with Dependents 1.53 0.27 <0.01 361.8 684.0 172.0Civilian Spouse with Dependents 0.66 0.17 <0.01 93.5 170.0 38.7
Note: Reference groups for dichotomous and categorical variables are shown in parentheses.
61
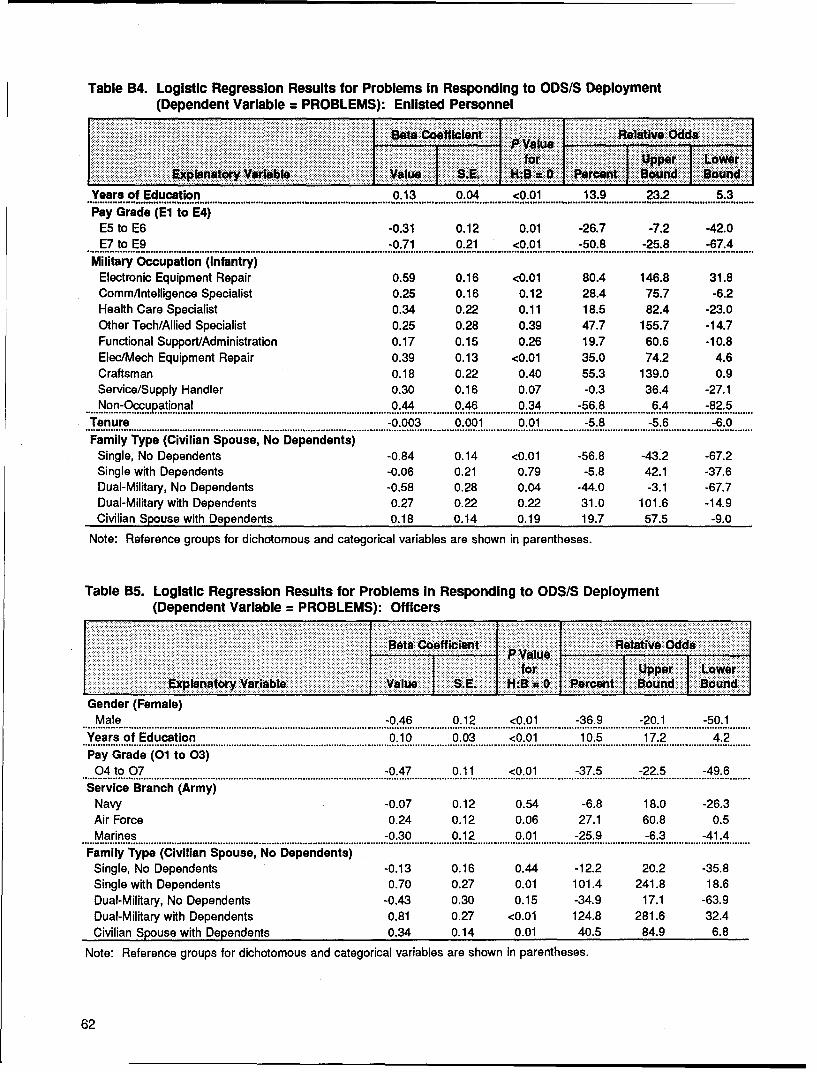
Table B4. Logistic Regression Results for Problems in Responding to ODS/S Deployment
(Dependent Variable - PROBLEMS): Enlisted Personnel
Beta Cficient Re :'veOdds
Years of Education 0.13 0.04 <0.01 13.9 23.2 5.3Pay Grade (El to E4)
E5 to E6 -0.31 0.12 0.01 -26.7 -7.2 -42.0E7 to E9 -0.71 0.21 <0.01 -50.8 -25.8 -67.4
Military Occupation (Infantry)Electronic Equipment Repair 0.59 0.18 <0.01 80.4 146.8 31.8Comm/inteiligence Specialist 0.25 0.16 0.12 28.4 75.7 -6.2Health Care Specialist 0.34 0.22 0.11 18.5 82.4 -23.0Other Tech/Allied Specialist 0.25 0.28 0.39 47.7 155.7 -14.7Functional Support/Administration 0.17 0.15 0.26 19.7 60.6 -10.8Elec/Mech Equipment Repair 0.39 0.13 <0.01 35.0 74.2 4.6Craftsman 0.18 0.22 0.40 55.3 139.0 0.9Service/Supply Handler 0.30 0.16 0.07 -0.3 36.4 -27.1
S...Non-.• up.ation~a. ...................................... 0.44........ 0.46........ 0:.34....... -56.8 6.........£.4. -8......!2:.5 ...Tenure -0.003 0.001 0.01 -5.8 -5.6 -6.0Family Type (Civilian Spouse, No Dependents)
Single, No Dependents -0.84 0.14 <0.01 -56.8 -43.2 -67.2Single with Dependents -0.06 0.21 0.79 -5.8 42.1 -37.6Dual-Military, No Dependents -0.58 0.28 0.04 -44.0 -3.1 -67.7Dual-Military with Dependents 0.27 0.22 0.22 31.0 101.6 -14.9Civilian Spouse with Dependents 0.18 0.14 0.19 19.7 57.5 -9.0
Note: Reference groups for dichotomous and categorical variables are shown in parentheses.
Table BS. Logistic Regression Results for Problems In Responding to ODS/S Deployment(Dependent Variable = PROBLEMS): Officers
............ ........P V a l.u e .......... ........ L.we
.atr Vaial Va.u ..... UPBu Perent Bo...Bun
Gender (Female)Male -0.46 0.12 <0.01 -36.9 -20.1 -50.1
Years of Education 0.10 0.03 <0.01 10.5 17.2 4.2Pay Grade (01 to 03)
04 to 07 -0.47 0.11 <0.01 -37.5 -22.5 -49.6
Service Branch (Army)Navy -0.07 0.12 0.54 -6.8 18.0 -26.3Air Force 0.24 0.12 0.06 27.1 60.8 0.5Marines -0.30 0.12 0.01 -25.9 -6.3 -41.4
..... ............................. °................................................................................................................................................................................................................. .....
Family Type (Civilian Spouse, No Dependents)Single, No Dependents -0.13 0.16 0.44 -12.2 20.2 -35.8Single with Dependents 0.70 0.27 0.01 101.4 241.8 18.6Dual-Military, No Dependents -0.43 0.30 0.15 -34.9 17.1 -63.9Dual-Military with Dependents 0.81 0.27 <0.01 124.8 281.6 32.4Civilian Spouse with Dependents 0.34 0.14 0.01 40.5 84.9 6.8
Note: Reference groups for dichotomous and categorical variables are shown in parentheses.
62
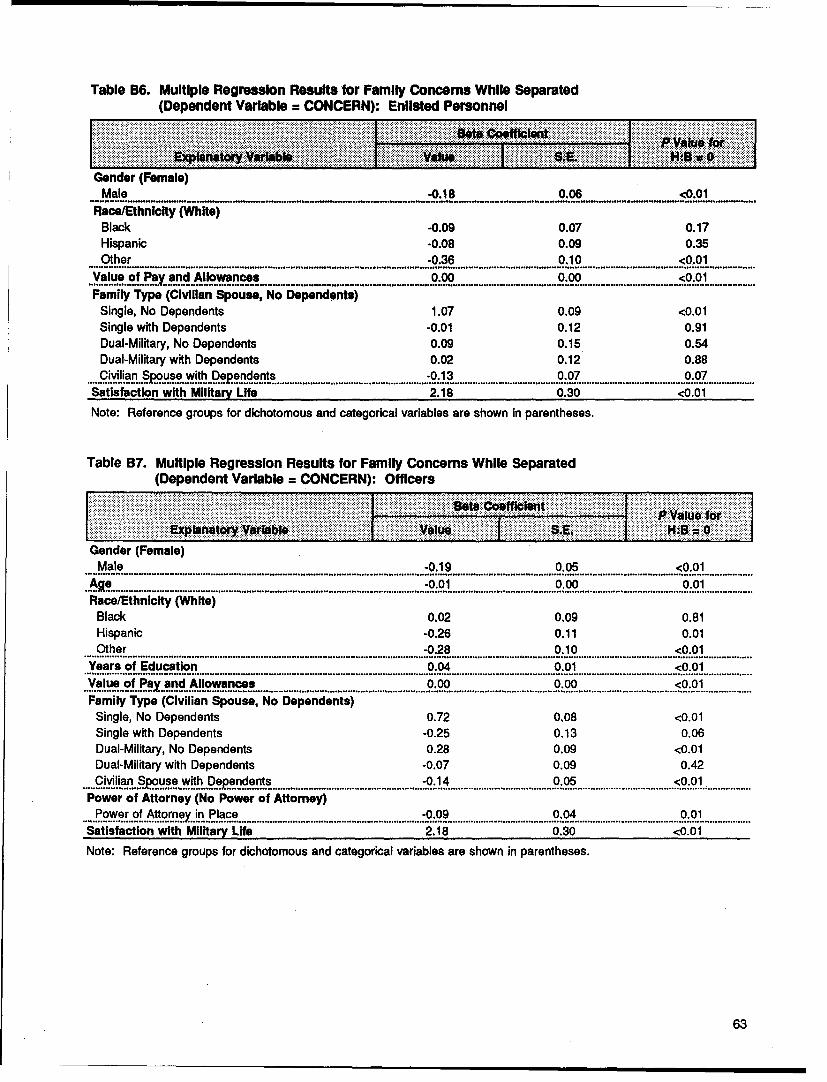
Table B6. Multiple Regression Results for Family Concerns While Separated(Dependent Variable CONCERN): Enlisted Personnel
Gender (Female)Male -0.18 0.06 <0.01
Race/Ethnicity (White)Black -0.09 0.07 0.17Hispanic -0.08 0.09 0.35Other -0.36 0.10 <0.01.V=..!u•. o! ..• .=..•.......... n...... ...................... ............ ....... ............ .:0, ................................ . ..0.. .................................... oo...........Value of Pay and Allowances0.00*~*..- 00 00
Family Type (Civilian Spouse, No Dependents)Single, No Dependents 1.07 0.09 <0.01Single with Dependents -0.01 0.12 0.91Dual-Military, No Dependents 0.09 0.15 0.54Dual-Military with Dependents 0.02 0.12 0.88CiýIian Spous wth eed -0.13 0.07 0.07
Satisfaction with Military Life 2.18 0.30 <0.01Note: Reference groups for dichotomous and categorical variables are shown in parentheses.
Table B7. Multiple Regression Results for Family Concerns While Separated(Dependent Variable = CONCERN): Officers
Gender (Female)
Race/Ethnicity (White)Black 0.02 0.09 0.81Hispanic -0.26 0.11 0.01
Years of Education 0.04 0.01 <0.01Value fP of n... Paw..ny and..............................Allowances...................... 0.0 000. .................. <0.01...........Family Type (Civilian Spouse, No Dependents)
Single, No Dependents 0.72 0.08 <0.01Single with Dependents -0.25 0. 13 0.06Dual-Military, No Dependents 0.28 0.09 <0.01Dual-Military with Dependents -0.07 0.09 0.42
S...C!.li•an.,S. o.use.with. Dependents ............................. -0.1.4 0.............. .0.....OO5.................... <0.01...........Power of Attorney (No Power of Attorney)
Satisfaction with Military Life 2.18 0.30 <0.01Note: Reference groups for dichotomous and categorical variables are shown in parentheses.
63
........ I.I
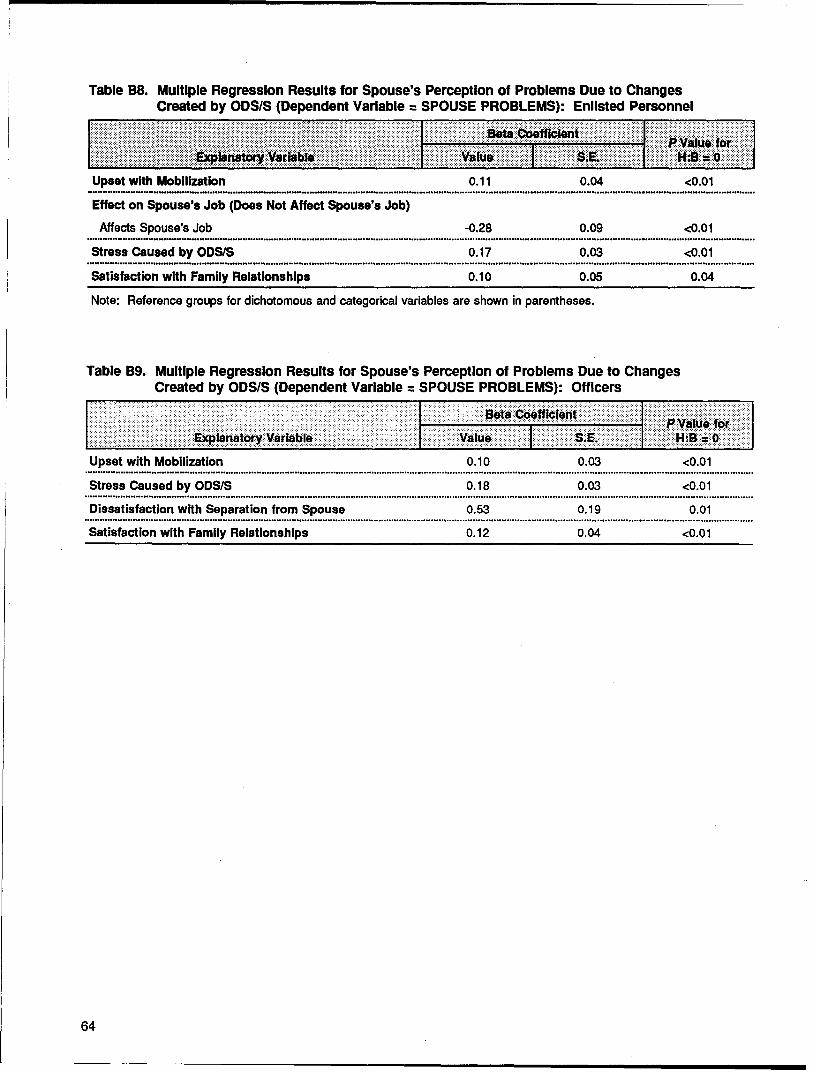
Table B8. Multiple Regression Results for Spouse's Perception of Problems Due to ChangesCreated by ODS/S (Dependent Variable = SPOUSE PROBLEMS): Enlisted Personnel
BetaCefic.e" t v.XJalX' xo
Upset with Mobilization 0.11 0.04 <0.01
Effect on Spouse's Job (Does Not Affect Spouse's Job)
Affects Spouse's Job -0.28 0.09 <0.01
Stress Caused by ODS/S 0.17 0.03 <0.01
Satisfaction with Family Relationships 0.10 0.05 0.04
Note: Reference groups for dichotomous and categorical variables are shown in parentheses.
Table B9. Multiple Regression Results for Spouse's Perception of Problems Due to Changes
Created by ODS/S (Dependent Variable SPOUSE PROBLEMS): Officers
Beta CoefficientPVlu oExplanatory Varial Vaue H:BEO
Upset with Mobilization 0.10 0.03 <0.01.•° ............. ...oo .o,°.........•........•............ °............•. •••• ............................. °............................•............... •............ . ••°. ...... •.................................... ...................... •.................... .
Stress Caused by ODS/S 0.18 0.03 <0.01S........••°.°.°.... °•°• .....................•° .............................. ° ....................•.•................. ............................ °............. •............. •...................................................... •.................................
Dissatisfaction with Separation from Spouse 0.53 0.19 0.01.•. •••................ . °.. °°...........• ...°..•.•.•.••......... oo...°..........•... ............. .......................................... ,............. °........... I ....................................... •............. .. ....... .................................
Satisfaction with Family Relationships 0.12 0.04 <0.01
64