operational analysis of shared lane markings · pdf fileoperational analysis of shared lane...
TRANSCRIPT
OPERATIONAL ANALYSIS OF SHARED LANE
MARKINGS AND GREEN BIKE LANES ON
ROADWAYS WITH SPEEDS GREATER THAN 35 MPH
Contract No. BDK 82-977-04
FINAL REPORT
January 2014
Report Prepared by:
Thobias Sando, Ph.D., P.E., PTOE (PI)
School of Engineering
University of North Florida
1 UNF Drive
Jacksonville, FL 32224
Tel: (904) 620 1142
Fax: 904-620-1391
Email: [email protected]
Report Prepared for:
The Florida Department of Transportation
Research Center
605 Suwannee Street, MS 30
Tallahassee, FL 32399
ii
DISCLAIMER
The opinions, findings, and conclusions, expressed in this publication are those of the authors
and not necessarily those of the State of Florida Department of Transportation.
iii
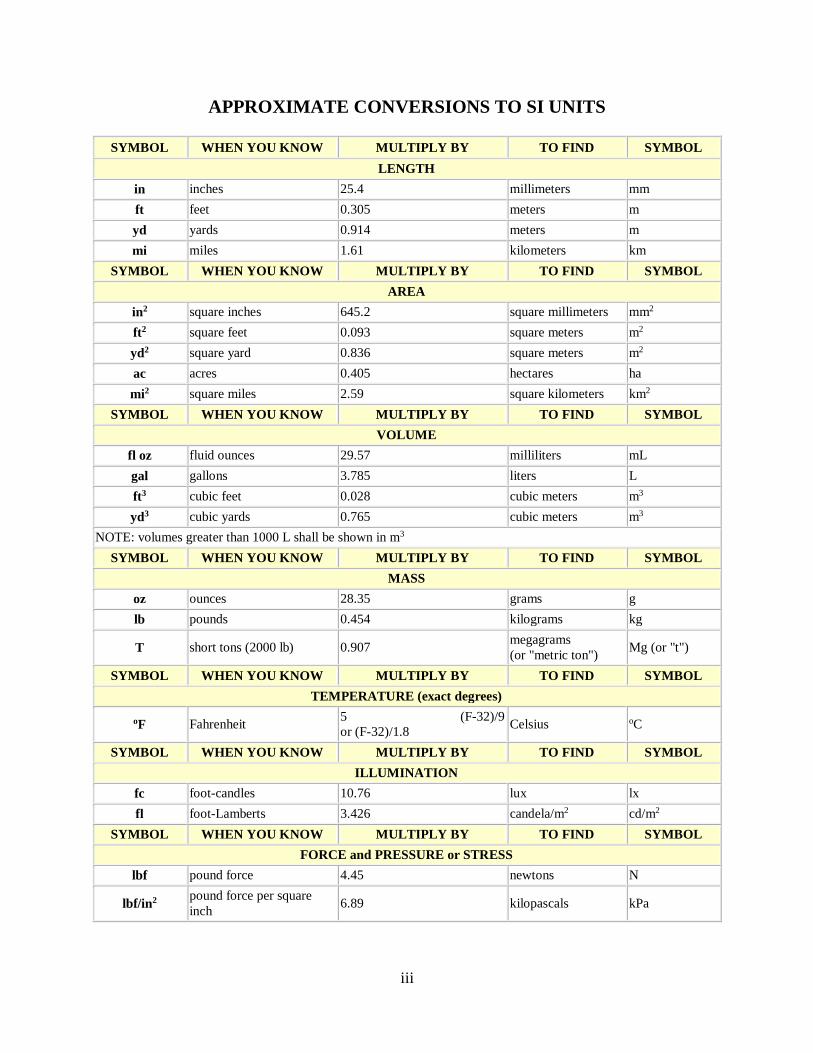
APPROXIMATE CONVERSIONS TO SI UNITS
SYMBOL WHEN YOU KNOW MULTIPLY BY TO FIND SYMBOL
LENGTH
in inches 25.4 millimeters mm
ft feet 0.305 meters m
yd yards 0.914 meters m
mi miles 1.61 kilometers km
SYMBOL WHEN YOU KNOW MULTIPLY BY TO FIND SYMBOL
AREA
in2 square inches 645.2 square millimeters mm2
ft2 square feet 0.093 square meters m2
yd2 square yard 0.836 square meters m2
ac acres 0.405 hectares ha
mi2 square miles 2.59 square kilometers km2
SYMBOL WHEN YOU KNOW MULTIPLY BY TO FIND SYMBOL
VOLUME
fl oz fluid ounces 29.57 milliliters mL
gal gallons 3.785 liters L
ft3 cubic feet 0.028 cubic meters m3
yd3 cubic yards 0.765 cubic meters m3
NOTE: volumes greater than 1000 L shall be shown in m3
SYMBOL WHEN YOU KNOW MULTIPLY BY TO FIND SYMBOL
MASS
oz ounces 28.35 grams g
lb pounds 0.454 kilograms kg
T short tons (2000 lb) 0.907 megagrams
(or "metric ton") Mg (or "t")
SYMBOL WHEN YOU KNOW MULTIPLY BY TO FIND SYMBOL
TEMPERATURE (exact degrees)
oF Fahrenheit 5 (F-32)/9
or (F-32)/1.8 Celsius oC
SYMBOL WHEN YOU KNOW MULTIPLY BY TO FIND SYMBOL
ILLUMINATION
fc foot-candles 10.76 lux lx
fl foot-Lamberts 3.426 candela/m2 cd/m2
SYMBOL WHEN YOU KNOW MULTIPLY BY TO FIND SYMBOL
FORCE and PRESSURE or STRESS
lbf pound force 4.45 newtons N
lbf/in2 pound force per square
inch 6.89 kilopascals kPa
iv
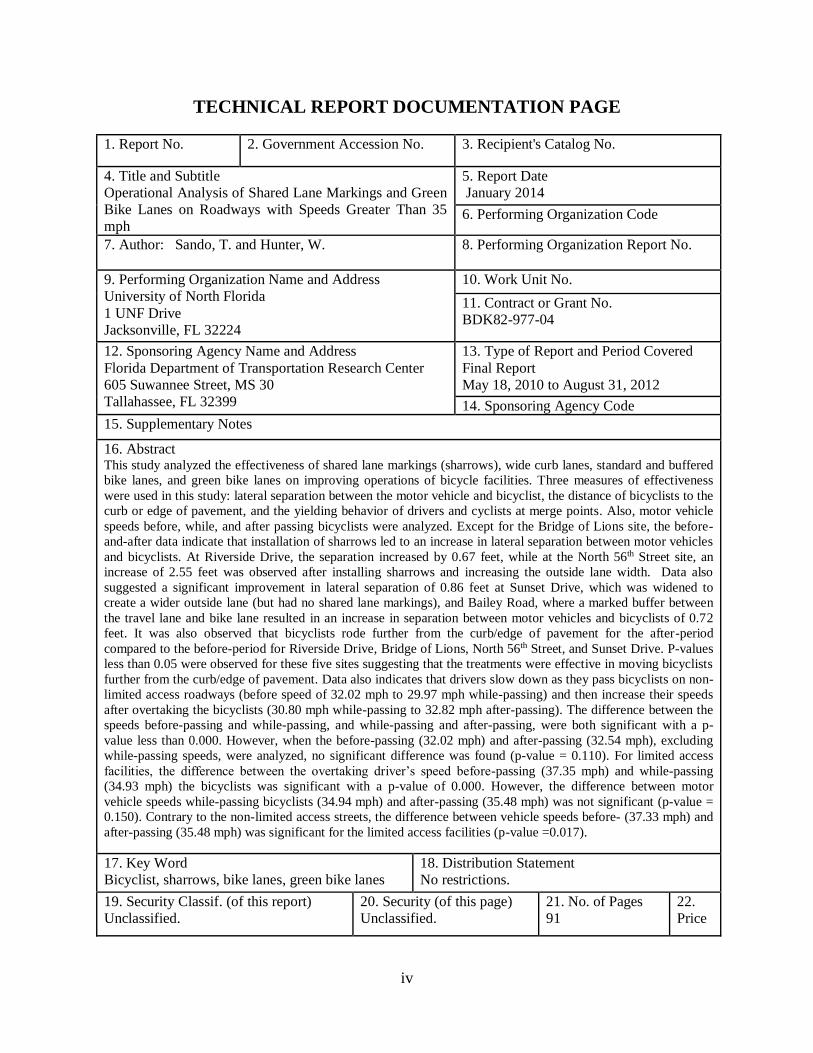
TECHNICAL REPORT DOCUMENTATION PAGE
1. Report No.
2. Government Accession No. 3. Recipient's Catalog No.
4. Title and Subtitle
Operational Analysis of Shared Lane Markings and Green
Bike Lanes on Roadways with Speeds Greater Than 35
mph
5. Report Date
January 2014
6. Performing Organization Code
7. Author: Sando, T. and Hunter, W.
8. Performing Organization Report No.
9. Performing Organization Name and Address
University of North Florida
1 UNF Drive
Jacksonville, FL 32224
10. Work Unit No.
11. Contract or Grant No.
BDK82-977-04
12. Sponsoring Agency Name and Address
Florida Department of Transportation Research Center
605 Suwannee Street, MS 30
Tallahassee, FL 32399
13. Type of Report and Period Covered
Final Report
May 18, 2010 to August 31, 2012
14. Sponsoring Agency Code
15. Supplementary Notes
16. Abstract This study analyzed the effectiveness of shared lane markings (sharrows), wide curb lanes, standard and buffered
bike lanes, and green bike lanes on improving operations of bicycle facilities. Three measures of effectiveness
were used in this study: lateral separation between the motor vehicle and bicyclist, the distance of bicyclists to the
curb or edge of pavement, and the yielding behavior of drivers and cyclists at merge points. Also, motor vehicle
speeds before, while, and after passing bicyclists were analyzed. Except for the Bridge of Lions site, the before-
and-after data indicate that installation of sharrows led to an increase in lateral separation between motor vehicles
and bicyclists. At Riverside Drive, the separation increased by 0.67 feet, while at the North 56th Street site, an
increase of 2.55 feet was observed after installing sharrows and increasing the outside lane width. Data also
suggested a significant improvement in lateral separation of 0.86 feet at Sunset Drive, which was widened to
create a wider outside lane (but had no shared lane markings), and Bailey Road, where a marked buffer between
the travel lane and bike lane resulted in an increase in separation between motor vehicles and bicyclists of 0.72
feet. It was also observed that bicyclists rode further from the curb/edge of pavement for the after-period
compared to the before-period for Riverside Drive, Bridge of Lions, North 56th Street, and Sunset Drive. P-values
less than 0.05 were observed for these five sites suggesting that the treatments were effective in moving bicyclists
further from the curb/edge of pavement. Data also indicates that drivers slow down as they pass bicyclists on non-
limited access roadways (before speed of 32.02 mph to 29.97 mph while-passing) and then increase their speeds
after overtaking the bicyclists (30.80 mph while-passing to 32.82 mph after-passing). The difference between the
speeds before-passing and while-passing, and while-passing and after-passing, were both significant with a p-
value less than 0.000. However, when the before-passing (32.02 mph) and after-passing (32.54 mph), excluding
while-passing speeds, were analyzed, no significant difference was found (p-value = 0.110). For limited access
facilities, the difference between the overtaking driver’s speed before-passing (37.35 mph) and while-passing
(34.93 mph) the bicyclists was significant with a p-value of 0.000. However, the difference between motor
vehicle speeds while-passing bicyclists (34.94 mph) and after-passing (35.48 mph) was not significant (p-value =
0.150). Contrary to the non-limited access streets, the difference between vehicle speeds before- (37.33 mph) and
after-passing (35.48 mph) was significant for the limited access facilities (p-value =0.017).
17. Key Word
Bicyclist, sharrows, bike lanes, green bike lanes
18. Distribution Statement
No restrictions.
19. Security Classif. (of this report)
Unclassified.
20. Security (of this page)
Unclassified.
21. No. of Pages
91
22.
Price
v
ACKNOWLEDGEMENTS
The author wishes to thank the Florida Department of Transportation (FDOT) for sponsoring this
project. Special thanks go to Mary Anne Koos, Project Manager, for working tirelessly to bring
this project to fruition. Graduate research assistants, Michelle Angel, Pham Giao Quynh, and
Hoang Hung deserve special recognition for their significant contribution in making this study a
success.
This research project would not have been possible without the full support of the cyclists,
videographers, traffic technicians, and designers who gave their time to ensure that we would
have high quality, reliable data that represented all of Florida’s communities. A special thank
you to the following teams:
Central Office: FDOT: Dennis Felton, Matt Cosgrove, and Shawn Trotman
District 2: FDOT: Chris Ledew, Scott Lent, Jennifer Graham, Rachel Walton,
Joshua Reichert, Austin Chapman, Rodney Cooper and Doreen Joyner-
Howard
North Florida Transportation Planning Organization: Elizabeth De Jesus
City of Jacksonville: James Reed
City of St. Augustine: Police Department
District 3: FDOT: Miranda Glass, J.C. Spivey, and Cliff Johnson
District 4: FDOT: John Mark Palacios
Palm Beach Metropolitan Planning Organization: Bret Baronak
Broward County: Mark Horowitz
District 5: FDOT: Joan Carter, Todd Alexander, George Borchik, Steve Tonjes,
Jeff Shepard, and Mary McGehee
Revolutions Cyclery: Ginger Twigg
District 6: FDOT: Ken Jeffries, Chris Tavella, Heidi Solaun, Danny Iglesias,
Felix Hernandez, Omar Meitin, Aileen Boucle, Hong Benitez, Andre Diaz,
and Jorge Rodriguez
Miami-Dade Metropolitan Planning Organization: David Henderson
Kimley-Horn and Associates, Inc: John McWilliams, Stewart Robertson,
Katie Vila, Doug Cobb, Stephan Mack, Denise Chevrenak, and Kelsey Lewis
District 7: FDOT: Lori Marable, Stephen Benson, Ron Chin, Peter Hsu,
Rochelle Garrett, Mary Lou Godfrey, Kelli Bradley, Susan Moore,
Katasha Cornwell, Thomas Curley, Britni West, Brit Hardy, Kellie Ziemak,
and Sally Prescott,
City of Temple Terrace: Robert Gordon, Police Department
City of Tampa: Bernadette Corey
City Bike Tampa: Kevin Craft, and Jim Schirk
vi
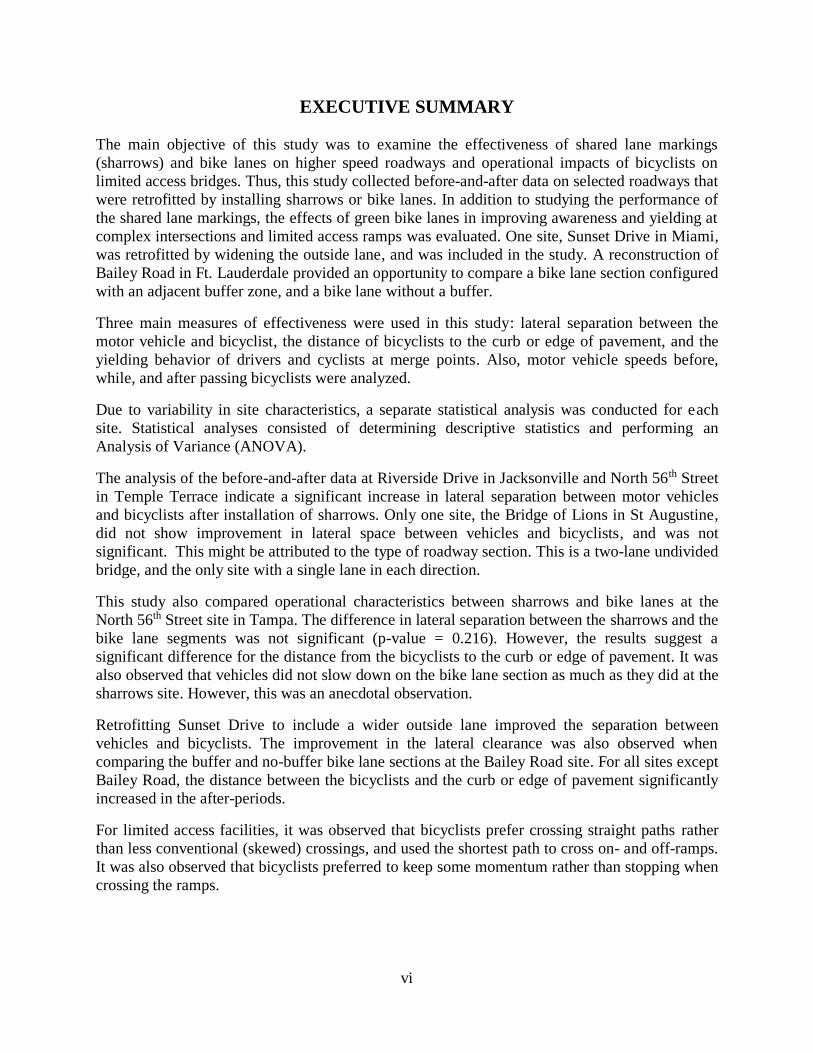
EXECUTIVE SUMMARY
The main objective of this study was to examine the effectiveness of shared lane markings
(sharrows) and bike lanes on higher speed roadways and operational impacts of bicyclists on
limited access bridges. Thus, this study collected before-and-after data on selected roadways that
were retrofitted by installing sharrows or bike lanes. In addition to studying the performance of
the shared lane markings, the effects of green bike lanes in improving awareness and yielding at
complex intersections and limited access ramps was evaluated. One site, Sunset Drive in Miami,
was retrofitted by widening the outside lane, and was included in the study. A reconstruction of
Bailey Road in Ft. Lauderdale provided an opportunity to compare a bike lane section configured
with an adjacent buffer zone, and a bike lane without a buffer.
Three main measures of effectiveness were used in this study: lateral separation between the
motor vehicle and bicyclist, the distance of bicyclists to the curb or edge of pavement, and the
yielding behavior of drivers and cyclists at merge points. Also, motor vehicle speeds before,
while, and after passing bicyclists were analyzed.
Due to variability in site characteristics, a separate statistical analysis was conducted for each
site. Statistical analyses consisted of determining descriptive statistics and performing an
Analysis of Variance (ANOVA).
The analysis of the before-and-after data at Riverside Drive in Jacksonville and North 56th Street
in Temple Terrace indicate a significant increase in lateral separation between motor vehicles
and bicyclists after installation of sharrows. Only one site, the Bridge of Lions in St Augustine,
did not show improvement in lateral space between vehicles and bicyclists, and was not
significant. This might be attributed to the type of roadway section. This is a two-lane undivided
bridge, and the only site with a single lane in each direction.
This study also compared operational characteristics between sharrows and bike lanes at the
North 56th Street site in Tampa. The difference in lateral separation between the sharrows and the
bike lane segments was not significant (p-value = 0.216). However, the results suggest a
significant difference for the distance from the bicyclists to the curb or edge of pavement. It was
also observed that vehicles did not slow down on the bike lane section as much as they did at the
sharrows site. However, this was an anecdotal observation.
Retrofitting Sunset Drive to include a wider outside lane improved the separation between
vehicles and bicyclists. The improvement in the lateral clearance was also observed when
comparing the buffer and no-buffer bike lane sections at the Bailey Road site. For all sites except
Bailey Road, the distance between the bicyclists and the curb or edge of pavement significantly
increased in the after-periods.
For limited access facilities, it was observed that bicyclists prefer crossing straight paths rather
than less conventional (skewed) crossings, and used the shortest path to cross on- and off-ramps.
It was also observed that bicyclists preferred to keep some momentum rather than stopping when
crossing the ramps.
vii
TABLE OF CONTENTS
DISCLAIMER ................................................................................................................................ ii
APPROXIMATE CONVERSIONS TO SI UNITS ...................................................................... iii
TECHNICAL REPORT DOCUMENTATION PAGE ................................................................. iv
ACKNOWLEDGEMENTS ............................................................................................................ v
EXECUTIVE SUMMARY ........................................................................................................... vi
LIST OF FIGURES ....................................................................................................................... ix
LIST OF TABLES ........................................................................................................................ xii
1 INTRODUCTION ...................................................................................................................... 1
2 RESEARCH OBJECTIVES ....................................................................................................... 2
3 LITERATURE REVIEW ........................................................................................................... 3
4 STUDY SITES.......................................................................................................................... 10
5 METHODOLOGY ................................................................................................................... 13
5.1 Data Collection .................................................................................................................... 13
5.2 Data Reduction .................................................................................................................... 13
5.3 Data Analysis ...................................................................................................................... 14
6 ANALYSIS AND RESULTS ................................................................................................... 16
6.1 Riverside Drive (Jacksonville) ............................................................................................ 16
6.1.1 Analysis of Variance .................................................................................................... 19
6.2 Bridge of Lions (St. Augustine) .......................................................................................... 19
6.2.1 Analysis of Variance .................................................................................................... 22
6.3 North 56th Street (Temple Terrace) ..................................................................................... 23
6.3.1 Sharrows (Site A) ......................................................................................................... 23
6.3.2 Analysis of Variance for Wider Outside Lane and Sharrows (Site A) ......................... 25
6.3.3 Bike Lane (Site B) ........................................................................................................ 26
6.3.4 Analysis of Variance for Bike Lane (Site B) ................................................................ 29
6.4 Sunset Drive (Miami) .......................................................................................................... 29
6.4.1 Descriptive Analysis ..................................................................................................... 31
6.4.2 Analysis of Variance .................................................................................................... 33
6.5 Bailey Road (Fort Lauderdale) ............................................................................................ 33
6.5.1 Site Description ............................................................................................................ 33
6.5.2 Descriptive Statistics .................................................................................................... 35
6.5.3 Analysis of Variance .................................................................................................... 36
6.6 Limited Access Facility Pilot Projects ................................................................................ 37
viii
6.6.1 Limited Access Sites .................................................................................................... 37
6.6.2 Analysis of Driver Characteristics at Crossing Locations ............................................ 40
6.6.3 Analysis of Bicyclist Characteristics at Crossing Locations ........................................ 40
6.6.4 Analysis of Pineda Causeway Data .............................................................................. 41
6.7 Speed Analysis .................................................................................................................... 43
6.8 Vehicle Lateral Shift ........................................................................................................... 48
7 CONCLUSIONS....................................................................................................................... 49
7.1 Lateral Spacing between Vehicles and Bicyclists ............................................................... 49
7.2 Lateral Spacing between Bicyclists and Curb ..................................................................... 49
7.3 Limited Access Crossing ..................................................................................................... 50
7.4 Speed Analysis .................................................................................................................... 50
REFERENCES ............................................................................................................................. 51
APPENDIX A ............................................................................................................................... 53
I-195/Julia Tuttle Causeway Fact Sheets .................................................................................. 54
APPENDIX B ............................................................................................................................... 56
Bicycle Crash Maps for Limited Access Pilot Studies ............................................................. 57
APPENDIX C ............................................................................................................................... 60
Bicycles on Limited Access Bridges ......................................................................................... 61
APPENDIX D ............................................................................................................................... 62
Pineda Causeway Fact Sheet ..................................................................................................... 63
APPENDIX E ............................................................................................................................... 64
William Lehman Causeway Bike Lane Concept ...................................................................... 65
APPENDIX F................................................................................................................................ 68
William Lehman Causeway Fact Sheets ................................................................................... 69
APPENDIX G ............................................................................................................................... 71
Bridge of Lions Sharrows Plan ................................................................................................. 72
APPENDIX H ............................................................................................................................... 73
Additional Photographs ............................................................................................................. 74
ix
LIST OF FIGURES
FIGURE 4.1 Locations of Study Sites .......................................................................................... 11
FIGURE 5.1 Pipe Attachment ...................................................................................................... 13
FIGURE 5.2 Vehicle Lateral Shift into Adjacent Lane Quartiles ................................................ 14
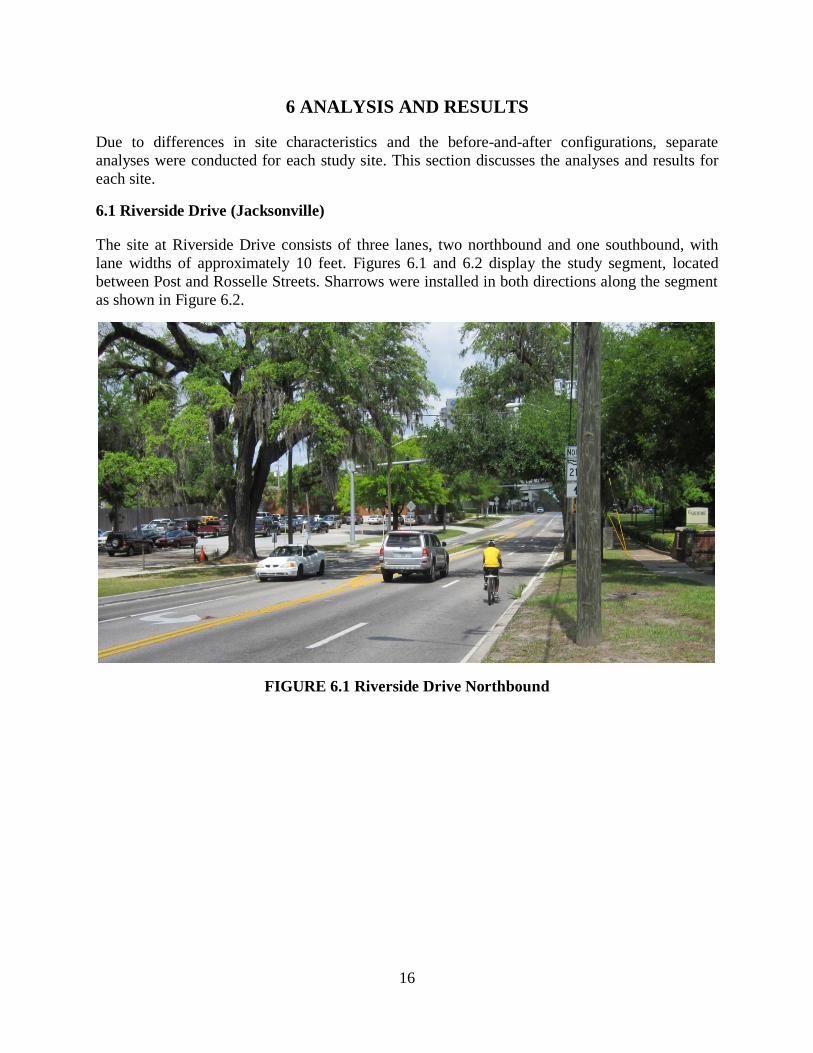
FIGURE 6.1 Riverside Drive Northbound ................................................................................... 16
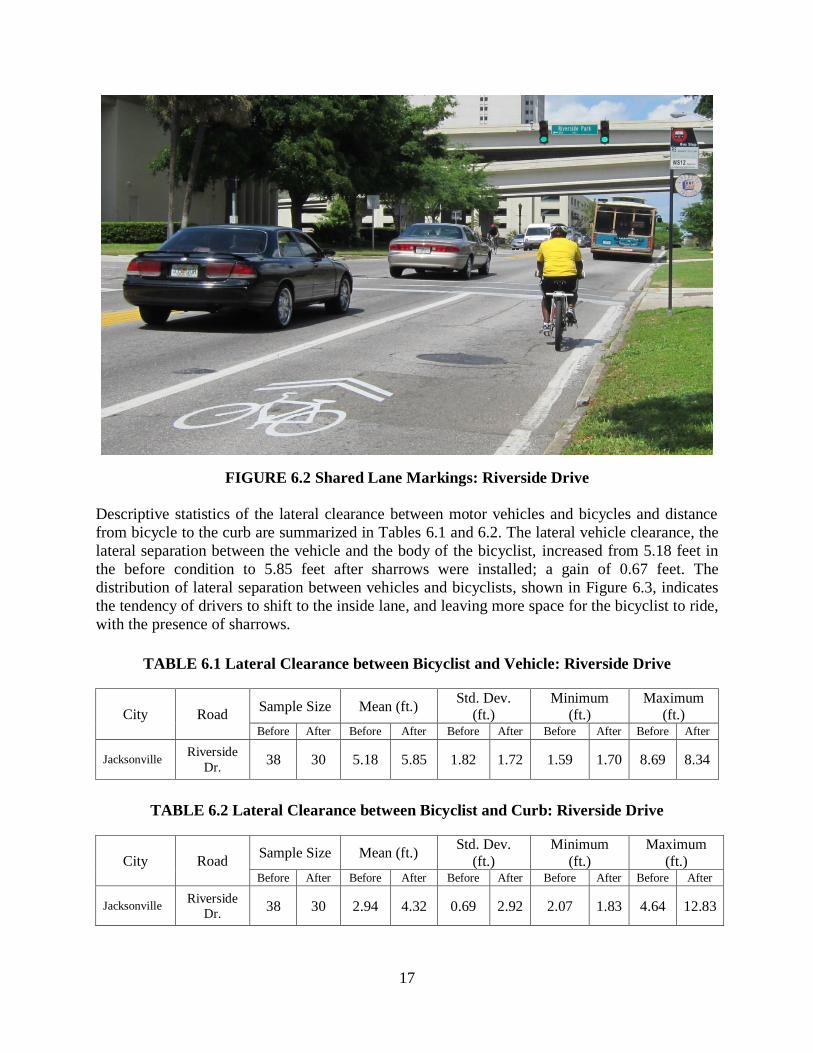
FIGURE 6.2 Shared Lane Markings: Riverside Drive ................................................................. 17
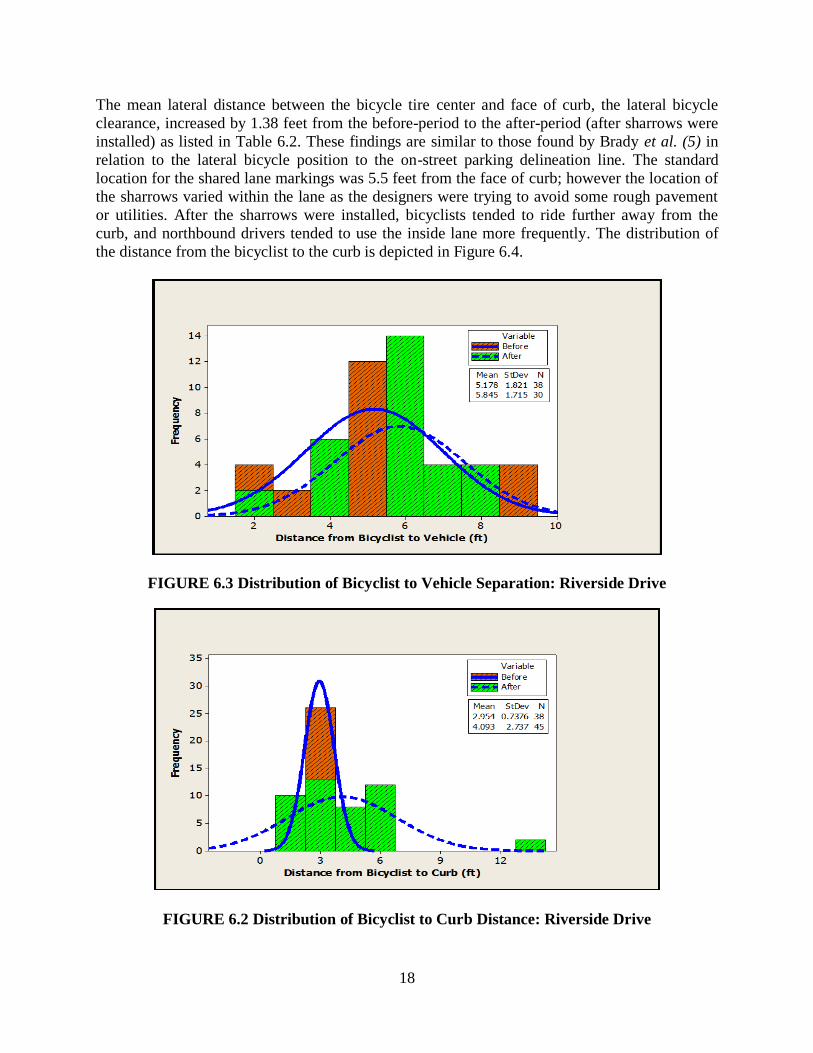
FIGURE 6.3 Distribution of Bicyclist to Vehicle Separation: Riverside Drive ........................... 18
FIGURE 6.2 Distribution of Bicyclist to Curb Distance: Riverside Drive................................... 18
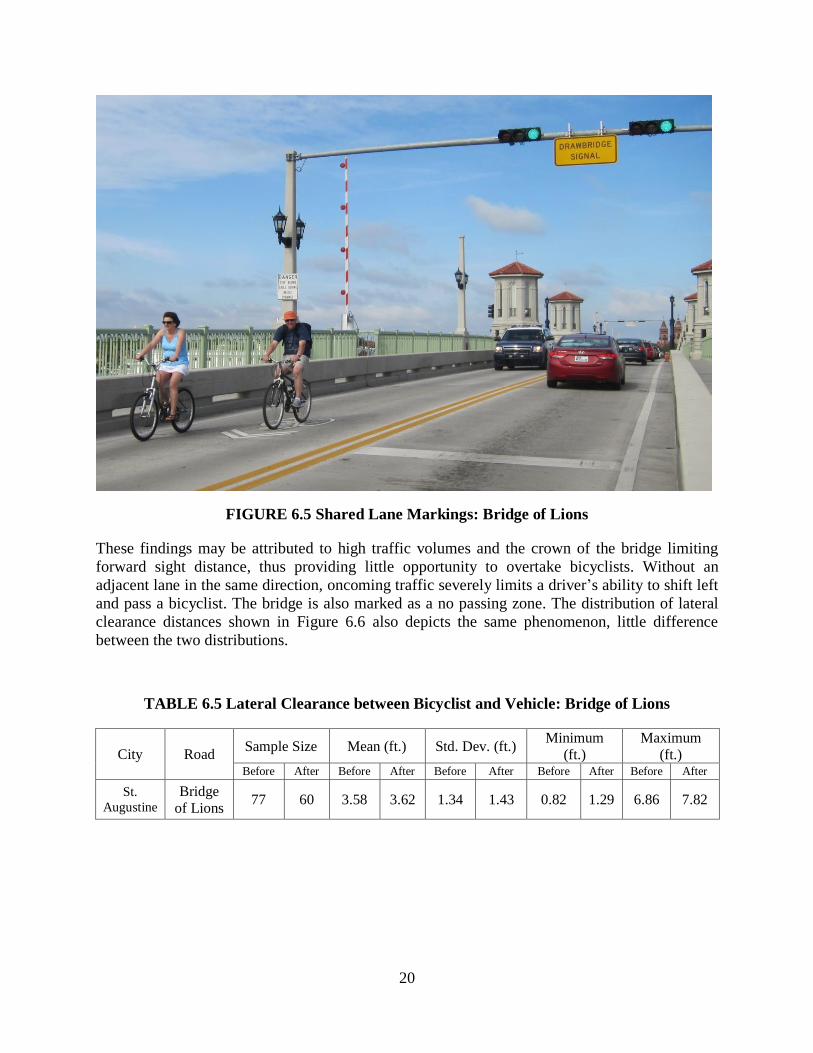
FIGURE 6.5 Shared Lane Markings: Bridge of Lions ................................................................. 20
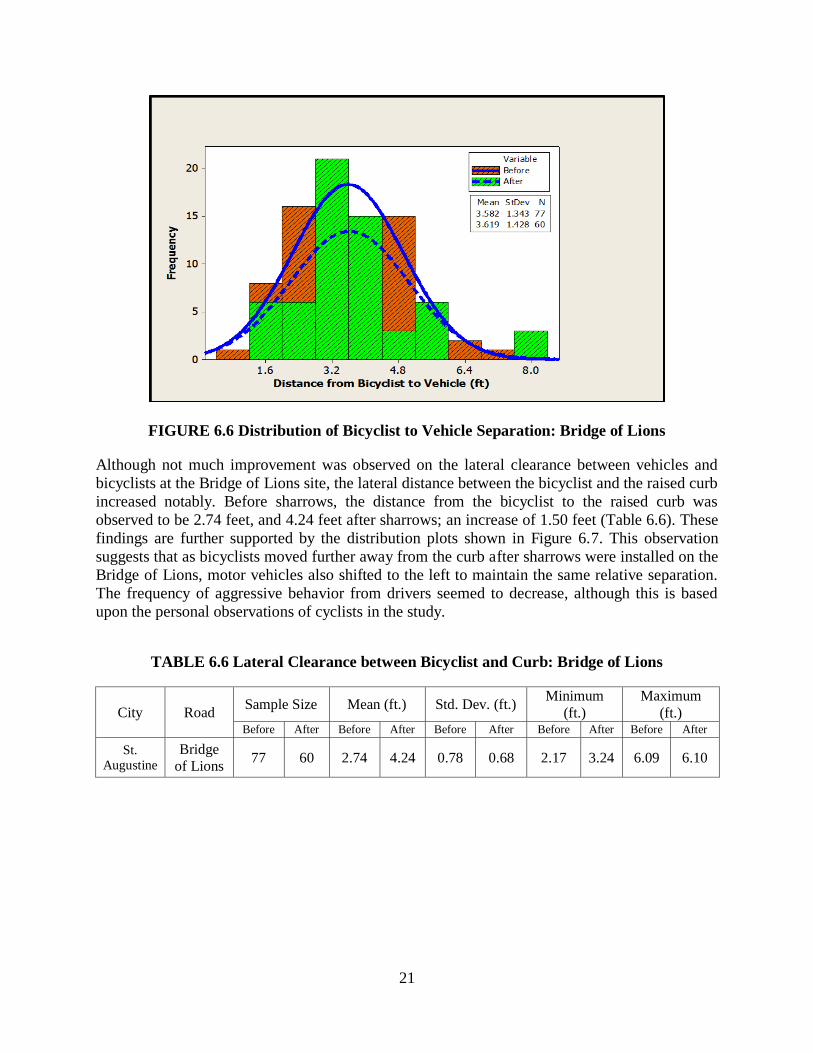
FIGURE 6.6 Distribution of Bicyclist to Vehicle Separation: Bridge of Lions ........................... 21
FIGURE 6.7 Distribution of Bicyclist to Curb Distance: Bridge of Lions ................................... 22
FIGURE 6.8 Wider Outside Lanes with Shared Lane Markings: N 56th Street (Site A) ............. 23
FIGURE 6.9 Distribution of Bicyclist to Vehicle Separation: N 56th Street (Site A) Wider
Outside Lane with Shared Lane Markings............................................................................ 24
FIGURE 6.10 Distribution of Bicyclist to Curb Distance: N 56th Street (Site A) Wider Outside
Lane with Shared Lane Markings ......................................................................................... 25
FIGURE 6.11 Bike Lanes: N 56th Street (Site B) ......................................................................... 27
FIGURE 6.12 Distribution of Bicyclist to Vehicle Separation-Comparing Bike Lane and
Sharrows: N 56th Street ........................................................................................................ 28
FIGURE 6.13 Distribution of Bicyclist to Curb Distance-Comparing Bike Lane and Sharrows: N
56th Street ............................................................................................................................. 28
FIGURE 6.14 Sunset Drive (before scenario) .............................................................................. 30
FIGURE 6.15 Sunset Drive (after scenario) ................................................................................. 30
FIGURE 6.16 Distribution of Bicyclist to Vehicle Separation: Sunset Drive .............................. 31
FIGURE 6.17 Distribution of Bicyclist to Edge of Pavement Distance: Sunset Drive ................ 32
FIGURE 6.18 Section with 5-foot Bike Lane: Bailey Rd. ........................................................... 34
FIGURE 6.19 Section with 4-foot Bike Lane and 2-foot Buffer: Bailey Rd. .............................. 34
FIGURE 6.20 Distribution of Bicyclist to Vehicle Distance: Bailey Road .................................. 35
FIGURE 6.21 Distribution of Bicyclist to Curb Distance: Bailey Road ...................................... 36
x
FIGURE 6.22 William Lehman Cswy Westbound Off-ramp ...................................................... 37
FIGURE 6.23 William Lehman Cswy Westbound On-ramp ....................................................... 38
FIGURE 6.24 William Lehman Cswy Eastbound Off-ramp ........................................................ 38
FIGURE 6.25 William Lehman Cswy Eastbound On-ramp ........................................................ 39
FIGURE 6.26 Julia Tuttle Cswy Westbound (Mt. Sinai) On-ramp .............................................. 39
FIGURE 6.27 Bicyclist Group Riding from US 1 to Pineda Cswy Eastbound After Green Bike
Lane Installation.................................................................................................................... 41
FIGURE 6.28 Bicyclist Crossing from US 1 to Pineda Cswy Eastbound Before Green Bike Lane
Installation............................................................................................................................. 42
FIGURE 6.29 Bicyclist Crossing from US 1 to Pineda Cswy Eastbound Before Green Bike Lane
Installation............................................................................................................................. 42
FIGURE 6.30 Bicyclist Crossing Ramp from US 1 to Pineda Cswy Eastbound After Green Bike
Lane Installation.................................................................................................................... 43
FIGURE 6.31 Average Vehicle Speed during Passing Events (Non-Limited Access Sites) ....... 44
FIGURE 6.32 Average Vehicle Speed during Passing Events (Limited Access Sites) ............... 45
FIGURE A.1 Julia Tuttle Cswy Bicycle Improvement Details .................................................... 54
FIGURE A.2 Julia Tuttle Cswy Bicycle Improvement Plan ........................................................ 55
FIGURE B.1 Pineda Cswy Bicycle Crash Map 2005-2010 ......................................................... 57
FIGURE B.2 Julia Tuttle Cswy Bicycle Crash Map 2005-2010 .................................................. 58
FIGURE B.3 William Lehman Cswy Bicycle Crash Map 2005-2010 ......................................... 59
FIGURE D.1 Pineda Cswy Bicycle Improvement Details ........................................................... 63
FIGURE E.1 William Lehman Cswy Bike Lane Plan Sheet 1 of 3 ............................................. 65
FIGURE E.2 William Lehman Cswy Bike Lane Plan Sheet 2 of 3 ............................................. 66
FIGURE E.3 William Lehman Cswy Bike Lane Plan Sheet 3 of 3 ............................................. 67
FIGURE F.1 William Lehman Cswy Bicycle Improvement Details ........................................... 69
FIGURE F.2 William Lehman Cswy Bicycle Improvement Plan ................................................ 70
FIGURE G.1 Bridge of Lions Sharrows Placement Plan ............................................................. 72
FIGURE H.1 Driver Yielding Right-of-Way to Bicyclist at Ramp Crossing on Julia Tuttle Cswy
............................................................................................................................................... 74
xi
FIGURE H.2 Bicyclist Crossing Ramp Using Green Bike Lane on Julia Tuttle Cswy ............... 74
FIGURE H.3 Cyclist Group Using Wide Shoulder on Julia Tuttle Cswy .................................... 75
FIGURE H.4 Sharrows on Lehman Cswy On-Ramp ................................................................... 75
FIGURE H.5 Bicyclist using Bike Lane Approaching Lehman Cswy On-Ramp ........................ 76
FIGURE H.6 Cyclist Checking Traffic before Crossing Lehman Cswy On-Ramp ..................... 76
FIGURE H.7 Bicyclist Yielding to Traffic before Crossing Lehman Cswy On-Ramp ............... 77
FIGURE H.8 Bicyclist Negotiating with Driver before Crossing Lehman Cswy On-Ramp ....... 77
FIGURE H.9 Bicyclist Crossing Ramp After Yielding to Driver (Fig. H.8) ............................... 78
FIGURE H.10 Bicyclist Crossing Ramp Using Bike Lane at Lehman Cswy On-Ramp ............. 78
xii
LIST OF TABLES
TABLE 4.1 Roadway Characteristics of Study Sites ................................................................... 12
TABLE 6.1 Lateral Clearance between Bicyclist and Vehicle: Riverside Drive ......................... 17
TABLE 6.2 Lateral Clearance between Bicyclist and Curb: Riverside Drive ............................. 17
TABLE 6.3 ANOVA Results for Sharrows Effect (Cyclist to Vehicle): Riverside Drive ........... 19
TABLE 6.4 ANOVA Results for Sharrows Effect (Cyclist to Curb): Riverside Drive ............... 19
TABLE 6.5 Lateral Clearance between Bicyclist and Vehicle: Bridge of Lions ......................... 20
TABLE 6.6 Lateral Clearance between Bicyclist and Curb: Bridge of Lions.............................. 21
TABLE 6.7 ANOVA Results for Sharrows Effect (Cyclist to Vehicle): Bridge of Lions ........... 22
TABLE 6.8 ANOVA Results for Sharrows Effect (Cyclist to Barrier): Bridge of Lions ............ 22
TABLE 6.9 Lateral Clearance between Motor Vehicle and Bicyclist: N 56th Street (Site A)
Wider Outside Lane with Shared Lane Markings................................................................. 24
TABLE 6.10 Lateral Clearance between Bicyclist and Curb: N 56th Street (Site A) Wider
Outside Lane with Shared Lane Markings............................................................................ 25
TABLE 6.11 ANOVA Results for Wider Outside Lane with Shared Lane Markings (Cyclist to
Vehicle): N 56th Street (Site A) ............................................................................................. 26
TABLE 6.12 ANOVA Results for Wider Outside Lanes with Shared Lane Markings (Cyclist to
Curb): N 56th Street (Site A) ................................................................................................. 26
TABLE 6.13 Lateral Clearance between Motor Vehicle and Bicyclist-Comparing Bike Lane and
Sharrows: N 56th Street ......................................................................................................... 27
TABLE 6.14 Lateral Clearance between Bicyclist and Curb/Edge of Pavement-Comparing Bike
Lane and Sharrows: N 56th Street ......................................................................................... 27
TABLE 6.15 ANOVA Results for Sharrows vs. Bike Lane (Cyclist to Vehicle): N 56th Street. 29
TABLE 6.16 ANOVA Results for Sharrows vs. Bike Lane (Cyclist to Curb/Edge of Pavement):
N 56th Street ......................................................................................................................... 29
TABLE 6.17 Lateral Clearance between Motor Vehicle and Bicyclist: Sunset Drive ................. 31
TABLE 6.18 Lateral Clearance between Bicyclist and Edge of Pavement: Sunset Drive ........... 32
TABLE 6.19 ANOVA Results for Wider Outside Lane Effect (Cyclist to Vehicle): Sunset Drive
............................................................................................................................................... 33
xiii
TABLE 6.20 ANOVA Results for Wider Outside Lane Effect (Cyclist to Edge of Pavement):
Sunset Drive .......................................................................................................................... 33
TABLE 6.21 Lateral Clearance between Motor Vehicle and Bicycle: Bailey Rd. ...................... 35
TABLE 6.22 Lateral Clearance from Bicyclist to Curb: Bailey Rd. ............................................ 36
TABLE 6.23 ANOVA Results for Buffer vs. no Buffer (Cyclist to Vehicle): Bailey Road ........ 36
TABLE 6.24 ANOVA Results for Buffer vs. no Buffer (Cyclist to Curb): Bailey Road ............ 37
TABLE 6.25 Operational Characteristics at Crossing Locations ................................................. 40
TABLE 6.26 Average Speed in Terms of Vehicle Types (Non-Limited Access Sites) ............... 43
TABLE 6.27 Average Speed in Terms of Vehicle Types (Limited Access Sites) ....................... 44
Table 6.28 Paired T-Test Results for Motor Vehicle Speeds (Non-Limited Access Streets) ....... 46
Table 6.29 Paired T-Test Results for Motor Vehicle Speeds (Limited Access Causeways) ........ 47
Table 6.30 Lateral Shift Data for Study Sites ............................................................................... 48
TABLE C.1 Pilot Projects of Bicycles on Limited Access Bridges ............................................. 61
1 INTRODUCTION
Across the United States, a great deal of attention is being focused on promoting energy efficient
and environmentally friendly modes of transportation. Bicycling is an integral part of a
sustainable transportation system as it is one of the most energy-efficient, cost effective, and
environment-friendly modes of transportation. Transportation agencies are looking for ways to
better support the growing use of bicycles for transportation and leisure activities in the existing
built environment.
In the past, urban design criteria in Florida allowed for the construction of wide outside lanes
rather than bike lanes when the corridor was constrained. Wide outside lanes are typically 14
feet wide to allow a shared use by motor vehicles and bicycles. Environmental and historical
constraints led to the reconstruction of the Bridge of Lions in St. Augustine with narrow (11”)
lanes and no bike lanes. Shared lane markings, also known as “sharrows” are a strategy for
mitigating the lack of a bike lane. Their intent is to encourage appropriate placement of cyclists
in the roadway and sharing of the lane by motorists. According to the Manual on Uniform
Traffic Control Devices (MUTCD, 2009) (12), sharrows are known to offer the following
benefits:
A. Assist bicyclists with lateral positioning in a shared lane with on-street parallel parking in
order to reduce the chance of a bicyclist hitting an open door of a parked vehicle,
B. Assist bicyclists with lateral positioning in lanes that are too narrow for a motor vehicle
and a bicycle to travel side by side within the same traffic lane,
C. Alert road users of the lateral location bicyclists are likely to occupy within the traveled
way,
D. Encourage safe passing of bicyclists by motorists, and
E. Reduce the incidence of wrong-way bicycling.
2
2 RESEARCH OBJECTIVES
This research is a follow-up study that builds on a previous FDOT research study on the
evaluation of restriping roadways to create wider outside lanes for bicyclists. The earlier study,
titled Operational and Safety Impacts of Restriping Inside Lanes or Urban Multi Lane Curbed
Roadways to 11 Feet or Less to Create Wider Outside Curb Lanes for Bicyclists (BDK82-877-
01) , and can be found on the web page for FDOT’s Research Office.
The main objective of this study was to examine the effectiveness of bike lanes and shared lane
markings (sharrows) on higher speed roadways, and included FDOT’s three pilot projects that
allow bicycle travel on limited access highways. Thus, a before-and-after study was conducted
on selected roadways that were retrofitted by installing bike lanes and/or sharrows. The study
evaluated the effects of green bike lanes in improving awareness and yielding at complex
intersections and limited access ramps. In addition to the state highways included in the study,
Broward County, Florida participated by constructing a new roadway with two styles of bike
lanes (buffered and traditional) that we were able to compare.
The study will be used by transportation officials in Florida to collect data on the operational
performance of the bicycle pilot projects on limited access roadways and refine guidelines on the
design of bicycle facilities, including the use of sharrows. Also, this study will provide guidance
on suitability of different methodologies used for videotape data collection and reduction.
3
3 LITERATURE REVIEW
Many cities and states have started implementing shared lane markings on roadways to
encourage the safe coexistence of bicycles and motor vehicles. However, very few localities
have formally evaluated the impact of these markings on safety or operations. In the late 1990s,
Pein, Hunter, and Stewart conducted a before-after study of a variant of the bike-in-house
marking implemented on a four-lane high volume (35,000 vehicles per day) roadway with a 30
mi/h (48 km/h) speed limit in Gainesville, FL (1). The roadway had wide outside lanes 15 feet to
the curb and no on-street parking. The center of the bike-in-house marking was placed 3.5 feet
from the curb face.
In the before-period 39 percent of bicyclists were riding in the same direction as traffic. This
increased to 45 percent in the after-period, and the increase was statistically significant.
Bicyclists rode an average of 1.6 feet from the curb (tire to curb) in the before-period and 1.8 feet
from the curb in the after-period—a shift of about 3 inches. This change was statistically
significant but not thought to be practically significant. However, examining the distribution of
distances showed a larger proportion of bicyclists riding 1.75 to 2.5 feet from the curb, indicating
that more riders had additional maneuvering space toward the curb in the event that motor
vehicles encroached into their space. This also potentially increased the comfort of bicyclists
using the shared lane. Motorists allowed a mean of approximately 1.5 inches additional space
when passing bicyclists in the after-period (6.1 feet) compared to the before-period (6.0 feet);
however, this difference was also not thought to be practically significant. The mean and median
motor vehicle distance to curb also increased slightly.
The San Francisco Department of Parking and Traffic conducted an evaluation of two shared
lane marking designs – a bike-in-house design and a bike-and-chevron design (similar to the
sharrow) – on streets with parallel parking (2). The study first conducted assessments to
hypothesize an appropriate spacing for bicyclists to be able to avoid the door zone, which is the
area where bicyclists risk colliding with an open door of a parked vehicle. By measuring vehicle
doors in that locale, they found that the 85th percentile for the door zone extended 9.5 feet from
the curb in the study areas. This distance included 7 feet from curb edge to outside of parked
vehicle and 2.5 feet occupied by an opened door. From this, they concluded that bicyclists
needed to ride at least 2.5 feet, or 30 inches, from parked vehicles to be relatively safe from an
opened door. The marking treatments were subsequently implemented with the center of the
markings 11 feet from the curb face to suggest a bicycle tracking position. This distance was
intended to accommodate the 85th percentile distance of door clearance (9.5 feet plus 0.5 feet of
shy distance plus half of the average bicycle width of 2 feet.
The San Francisco evaluation used data that were collected on six street segments before-and-
after markings were introduced. Curb lane widths, including parking, ranged from about 17 to 19
feet on four 4-lane roads, and the curb lane widths, including parking, were 22 feet on two 2-lane
roads. Each of the streets had moderate (2,000–4,000 vehicles per lane per day) to heavy (>4,000
vehicles per lane per day) traffic. In each of these locations, the bike-in-house marking was
painted along one side of the road and the bike-and-chevron marking on the other side. Both
shared lane markings led to the following results:
25 to 35 percent fewer sidewalk riders.
4
More space (3 to 4 inches) between bicycles and parked vehicles.
More space (more than 2 feet) between bicycles and passing motor vehicles in travel
lanes.
More space (about 1 foot) between motor vehicles in travel lanes and parked vehicles when no bicycles were present.
There were also reductions in the proportions of wrong-way riders associated with the bike-and-
chevron design. Due to the bike-and-chevron marking being more readily understood by
bicyclists to indicate a preferred travel path, this marking was the preferred choice and ultimately
approved for inclusion in the California Manual on Traffic Control Devices (3).
The Transportation Association of Canada (TAC) has now adopted the sharrow for use in
Canada, and a paper by Jacobson, Skene, Davidson, and Rawsthorne (4) covers side-by-side,
single file, and conflict zones applications. Recommendations for stencil placement and spacing
are slightly different from that recommended in the 2009 MUTCD (12). For the conflict zones
application, such as a motor vehicle off ramp and straight through bicycle movement, multiple
sharrows may be used with a minimum spacing of 1.5 meters. Further research is recommended
for stencil elongation as a function of roadway speed, stencil width, minimum sharrow
placement from the curb for the full-time parking situation, marking schemes for part-time
parking routes, and study of applications and dimensions as related to traffic volume, motor
vehicle speed, and vehicle class.
Brady, Loskorn, Mills, Duthie, and Machemehl examined the varying use of sharrows on three
different streets in Austin, Texas (5). Sharrows were installed in the middle of the 11-foot travel
lanes on Guadalupe Street, a 4-lane, one-way street with parking on each side. With block
lengths of approximately 370 feet, sharrows were installed 40 feet past each intersection,
resulting in nominal spacing of 370 feet. Videotape data were collected during peak commuting
hours when the parking spaces were rarely filled, thus giving bicyclists the opportunity to ride in
the empty parking spaces. After sharrow placement, the average bicyclist lateral position (BLP)
from the bicyclist’s front wheel to the on-street parking space delineation or the outside of the
edge of the parked motor vehicle increased from 3.14 to 3.51 feet, or 4.4 inches. The mode of the
BLP observations shifted from 1.1 to 5.5 feet, indicating that an increased number of bicyclists
were tracking over the center of the sharrow. The percentage of cyclists riding at a BLP of 4.4 to
6.6 feet, defined as the center of the lane, increased significantly from 31 to 42 percent after
sharrow placement. Motorists passing bicyclists also significantly decreased. Bicyclists were
significantly less likely to either ride on the sidewalk or in empty parking spaces after sharrows.
In a second evaluation, sharrows were also placed in the center of the lane on E 51st Street, a 2-
way, 4-lane arterial in a 2,100 foot section where the bike lanes had been dropped. Sharrow
spacing was 250 feet in the center of the outside lanes. After sharrow placement, the average
BLP increased from 4.0 to 4.75 feet, an increase of 8 inches, and the mode of the BLP increased
from 3 to 5 feet. The percentage of cyclists riding at a BLP of 4 to 6 feet, defined as the center of
the lane, increased from 44 to 54 percent after sharrow placement (p = .069). Sidewalk bicycle
riding significantly decreased from 12 to 4 percent.
A third experiment was conducted on Dean Keeton Street, an arterial roadway where space did
not allow bike lane placement throughout. Here, sharrows were placed 11 feet from the curb and
5
next to parked vehicles. The width from center of sharrow to center of the outside lane line was
11 feet. Parking spaces tended to stay filled. Before sharrows, the BLP was evenly distributed
between 1.5 and 4.5 feet when motorists passed cyclists. After sharrows, approximately 70
percent of cyclists rode 3 feet from the parked motor vehicles (p = 0.363). During non-passing
events the BLP mode was 4.5 feet. The percentage of cyclists riding within the door zone during
a passing event significantly decreased from approximately 80 to 36 percent (p<0.001). During a
non-passing event, the percentage of cyclists riding within the door zone significantly decreased
from approximately 82 to 68 percent (p<0.001).
Hunter, Thomas, Srinivasan, and Martell performed three separate evaluations of shared lane
markings for the FHWA (6). In Cambridge, MA, the evaluation compared a “before” condition
with no markings to an “after” condition of sharrows placed at 10 foot spacing from the curb.
The objective was to determine whether 10 foot spacing would have a positive effect on where
cyclists and motorists were positioned compared with no sharrows. Assuming parked vehicles
use 7 feet of space, this placement would result in the center of the sharrows being 3 feet from
the parked vehicles. The sharrows were placed 10 feet from the curb for about 2,500 feet on
Massachusetts Avenue, which is a 4-lane divided street with approximately 29,000 vehicles per
day, parallel parking on both sides, and a speed limit of 30 mi/h.
Results pertaining to the interaction of bicycles and motor vehicles included the following
changes from the before-period to the after-period:
The percentage of bicyclists who were taking the lane decreased from 13 to 8 percent.
The percentage of bicyclists who kept moving safely (were riding safely and did not need to change speed or direction) increased from 73 to 90 percent.
The percentage of bicyclists who made slight direction changes decreased from 17 to 6
percent.
The percentage of bicyclists who yielded (changed direction or speed to give way to a motor vehicle) decreased from 23 to 7 percent.
When a bicyclist was approaching, existing open vehicle doors decreased from 5 to 2 percent; opening of doors decreased from 4 to 0.3 percent; and motor vehicles pulling in
or out of parking spaces decreased from 11 to 4.5 percent. No actual door events occurred
in either the before-period or after-period.
The percentage of motorists who made no movement to change lanes when overtaking a
bicycle increased from 27 to 66 percent.
The percentage of safe overtaking movements by motorists (approached and passed the cyclist without difficulty) increased from 94 to 98 percent.
The percentage of motor vehicles making no movement (i.e., continuing to follow) when following bicycles increased from 44 to 65 percent.
The percentage of motorists who yielded (changed direction or speed to give way to a
bicycle) increased from 5 to 10 percent.
The percentage of motorists who made complete lane changes decreased from 12 to 3 percent.
The percentage of motorists who made slight direction changes decreased from 38 to 22 percent.
The percentage of motorists who slowed increased from 5 to 10 percent.
6
The percentage of motorists who made no change while following a bicyclist increased from 44 to 65 percent.
The percentage of avoidance maneuvers decreased from 76 to 37 percent.
All of these differences were independent of inbound or outbound direction. Taken together, the
results portray a more segregated flow with less lateral movement of bicycles and motor vehicles
after sharrow installation.
Results pertaining to the spacing of bicycles and motor vehicles in the presence of a following
motor vehicle in the after-period included the following:
The distance from a bicyclist riding beside a parked motor vehicle increased from 40.1 to 42.3 inches when both directions were combined and increased from 37.4 to 41.5 inches
for the inbound direction.
Outbound spacing was 42.7 inches in the before-period and 43.1 inches in the after-period.
The percentage of bicyclists who rode within 40 inches (i.e., near the door zone) of parked motor vehicles decreased. Most of the effect was in the inbound direction with a
decrease from 58 to 41 percent. Comparable outbound values were 44 percent in the
before-period and 38 percent in the after-period.
The percentage of bicyclists who rode within 30 inches (i.e., within the door zone)
remained unchanged at 13 percent.
Results pertaining to the spacing of bicycles and motor vehicles in the absence of a following
motor vehicle in the after-period included the following:
The change in distance between a bicyclist and a parked motor vehicle was negligible (approximately 45 inches before and after).
The percentage of bicyclists who rode within 40 inches of parked motor vehicles increased from 37.5 to 45 percent, although this may reflect the high percentage of
bicyclists who rode over the sharrows.
When motorists drove past parked motor vehicles, the spacing increased 16 inches (from
77.4 to 93.6 inches) in the inbound direction, 12 inches (from 84.5 to 96.5 inches) in the
outbound direction, and 14 inches (from 80.9 to 95.0 inches) combined.
Overall results from Cambridge, MA, indicate the following:
A total of 94 percent of bicyclists rode over the sharrows.
There was more operating space for bicycles as motor vehicle spacing from parked motor vehicles increased.
A number of variables related to the operations of bicycles and motor vehicles showed positive effects.
Placement of the sharrows 10 ft. from the curb (instead of 11 ft.) was not a problem.
7
In a second evaluation in Chapel Hill, NC, the sharrows were placed 43.5 inches from the curb
along Martin Luther King, Jr. Boulevard (MLK) for 1.25 miles. MLK is a street with a 5-lane
cross section (4 travel lanes and a center two-way left turn lane) with no parking, 27,000 vehicles
per day, a speed limit of 35 mi/h, and periodic sunken drain grates next to the curb. There was a
3 to 4 percent grade where the videotape data were collected. The street had previously been
resurfaced, and the outside lanes were marked nominally as 15-ft-wide lanes. The spacing of
bicycles and motor vehicles from the curb and in situations where motorists passed bicyclists
was of primary interest.
Results pertaining to the interaction of bicycles and motor vehicles included the following
changes from the before-period to the after-period:
A total of 91 percent of the bicyclists rode over the sharrows—97 percent in the downhill direction and 88 percent in the uphill direction. Bicyclists riding uphill traveled slower
and tended to ride closer to the curb.
The percentage of motorists who made no movement to change lanes when overtaking a
bicyclist increased from 24 to 32 percent.
There was no difference in the proportion of bicyclists riding near the curb (approximately 98 percent) or taking the lane (approximately 2 percent).
The percentage of avoidance maneuvers decreased from 81 to 71 percent.
The percentage of motorists staying in the lane when following bicyclists increased from 20 to 29 percent.
There was no change in the percentage of bicyclists or motorists who yielded.
Results pertaining to the spacing of bicycles and motor vehicles included the following:
In the presence of a following motor vehicle in the after-period, bicyclists rode closer to the curb after the sharrows by about 2.5 inches (40.1 to 37.7 inches). The effect was more
pronounced downhill (4.6 inches closer) versus uphill (2.9 inches closer). Similar to
Cambridge, MA, this was likely a reflection of bicyclists tracking over the sharrows.
There were slight increases in the percentages of bicyclists who rode within 30 and 40 inches of the curb. The percentage within 30 inches increased from 12.5 to 15 percent
downhill and 47.3 to 50.5 percent uphill.
When motorists passed bicyclists in the after-period, there was a small decrease in the
passing distance overall from 82 to 79 inches. In the downhill direction, motorists passed
7 inches closer to bicycles (from 84.7 to 77.7 inches). There was no change in the uphill
direction (from 80.0 to 81.1 inches).
The percentage of passing motor vehicles within 50 inches showed only small and insignificant differences (from 2.0 to 2.6 percent).
When the distance of the right front tires of motor vehicles from the curb in the absence of bicycles was examined in the after-period, the spacing increased 8.3 inches in the
uphill direction (from 64.4 to 72.7 inches), 4.7 inches in the downhill direction (from
76.6 to 81.3 inches), and 7 inches overall (from 70.5 to 77.0 inches).
The percentages of motor vehicles within 50 and 60 inches of the curb were also significantly lower in the after-period. The effect was most pronounced in the uphill
8
direction (from 16 to 4 percent within 50 inches and from 46 to 17 percent within
60 inches).
Bicyclist sidewalk riding significantly decreased from 43 percent in the before-period to 23 percent in the after-period. In the downhill direction, sidewalk riding decreased from
39 to 10 percent, with no significant change in the uphill direction.
Wrong-way riding by bicyclists was 11 percent in the before-period and 8 percent in the
after-period (non-significant change).
Overall results from Chapel Hill, NC, indicate the following:
A total of 91 percent of bicyclists tracked over the sharrows and rode at a safe distance from the edge of curb with more of an effect in the downhill direction.
Motorists moved away from the sharrows, providing more operating space for bicyclists.
A number of variables related to the operations of bicycles and motor vehicles showed positive effects.
Bicyclist sidewalk riding decreased in the downhill direction.
There was no change in the percentage of bicyclist wrong-way riding.
In a third evaluation in Seattle, WA, sharrows were placed in the center of the lane 12.25 feet
from the curb on a downhill section of Fremont Street, which is a 2-lane street that has a speed
limit of 30 mi/h, 10,000 vehicles per day, 3.6 percent grade, and parking on both sides of the
street. The placement was meant to encourage bicyclists to take the lane while traveling
downhill. Data were collected in two additional periods following the before-period. The
centerline of the street was repositioned to allow a 5-foot bicycle lane and parking line to be
installed on the uphill section of the street (after-period 1). Sharrows were then added in the
downhill direction (after-period 2) since there was not enough width for bicycle lanes on both
sides of the streets.
Results pertaining to the interaction of bicycles and motor vehicles included the following
changes from the before-period to the after-period:
There was no difference in the safety of the manner in which motorists were following and passing bicyclists. Overall, 97 percent of these maneuvers were considered to be
performed safely.
A total of 15 percent of the bicyclists rode over the sharrow during the after-period 2.
A significantly higher percentage (51 versus 28 percent) of bicyclists shifted toward the center of the lane and took the lane during after-period 1 when the lane was narrowed to
accommodate the addition of the bicycle lane in the uphill direction.
The percentage of bicyclists who yielded (i.e., changed direction or speed to give way to a motor vehicle) decreased from 3.3 percent in the before-period to 2.8 percent in after-
period 1 and 0.7 percent in after-period 2.
The percentage of motorists who yielded (i.e., changed direction or speed to give way to a bicycle) decreased from 13 percent in the before-period to 6.5 percent in after-period 1
and 5 percent in after-period 2.
9
Results pertaining to the spacing of bicycles and motor vehicles included the following:
In the absence of following motor vehicles, the average spacing between bicycles and parked motor vehicles did not significantly change across periods (45.8 inches in the
before-period, 47.5 inches in after-period 1, and 44.5 inches in after-period 2).
The percentage of bicyclist spacing values within 30 inches (i.e., within the door zone)
increased from about 6 percent in the before-period to about 12 percent in the two
after-periods.
The percentage of bicyclist spacing values within 40 inches increased from 36 percent in the before-period to 39 percent in after-period 1 and 44 percent in after-period 2 (non-
significant change).
When motorists drove past parked motor vehicles in the absence of bicycles in both after-periods, the average spacing decreased about 18 inches due to the change in the roadway
configuration (the lane had been narrowed by 2.5 ft.)
Overall results from Seattle, WA, indicate the following:
Sharrow placement alone did not seem to result in an increase in the percentage of bicyclists taking the lane.
Bicyclists were already riding out of the door zone in the before-period and stayed in this
location in both after-periods. Sharrows had previously been installed 11 ft. from the curb
next to parked cars over a 2,000-ft, four-lane section of Fremont Street leading into the
section studied in the current project.
It is possible that narrowing the travel lanes and adding the uphill bike lane had more of an effect on operations and spacing than the addition of sharrows.
The bicyclists riding in the street seemed experienced and showed that it was not necessary to ride in the middle of the lane to control the lane.
Similar operational and spacing measures have been used in studies evaluating operational
effects of bicycle lanes and wide curb lanes (without shared lane markings). It has generally been
found both in comparative studies (7,8) and before-after studies (9) that the presence of a bicycle
lane or shoulder stripe reduces lateral shifting by motor vehicles into an adjacent lane and
increases tracking consistency for a given roadway width. The studies also report bicyclist shifts
away from the roadway edge or parked vehicles with striping in place (9, 10). The van Houten
and Seiderman study examined the effects of sequential bicycle lane markings compared with a
baseline of only a roadway center line with no bicycle lane marking. This study found that there
was less variability in bicycle tracking with the bike lane markings in place (10). The study also
reported the overwhelming preference of bicyclists for the bike lanes, as well as the motorists’
awareness of them.
Furth, Pulaski, Bussing, and Tavakolian determined that the distance between the curb and a
parallel parked car increased as the parking lane width increased from 6 to 9 feet in a study
conducted near Boston, Massachusetts (11). As the width of the parking lane increased from 6 to
7 to 8 to 9 feet, the proportion of vehicles parked more than 12 inches from the curb increased
from 1% to 13% to 44% to 60%. Thus, a strategy of narrowing parking lanes can provide more
operating space for bicyclists.
10
4 STUDY SITES
Locations for data collection were determined by the Florida Department of Transportation
(FDOT) with District and local government cooperation, based on the availability of roadway
segments of varying characteristics, where higher volumes of bicyclists and pedestrians were
known to occur, and where existing shared lane pavement markings (sharrows) for bicycle traffic
were not already in place. Sites for the green bike lanes were selected based on pilot projects
where the installation of green bike lanes at on-ramps of limited access facilities was underway.
Based on prior experience, it was determined that evaluating existing bicycle traffic would not
produce sufficient data for the intended analysis. The FDOT districts were contacted to solicit
volunteer riders. For liability reasons, riders had to be employees of participating institutions
conducting the research (Florida State University and University of North Florida), the FDOT, or
supportive local governments and transportation planning organizations. Research assistants
were used only for operating cameras and collecting speed data.
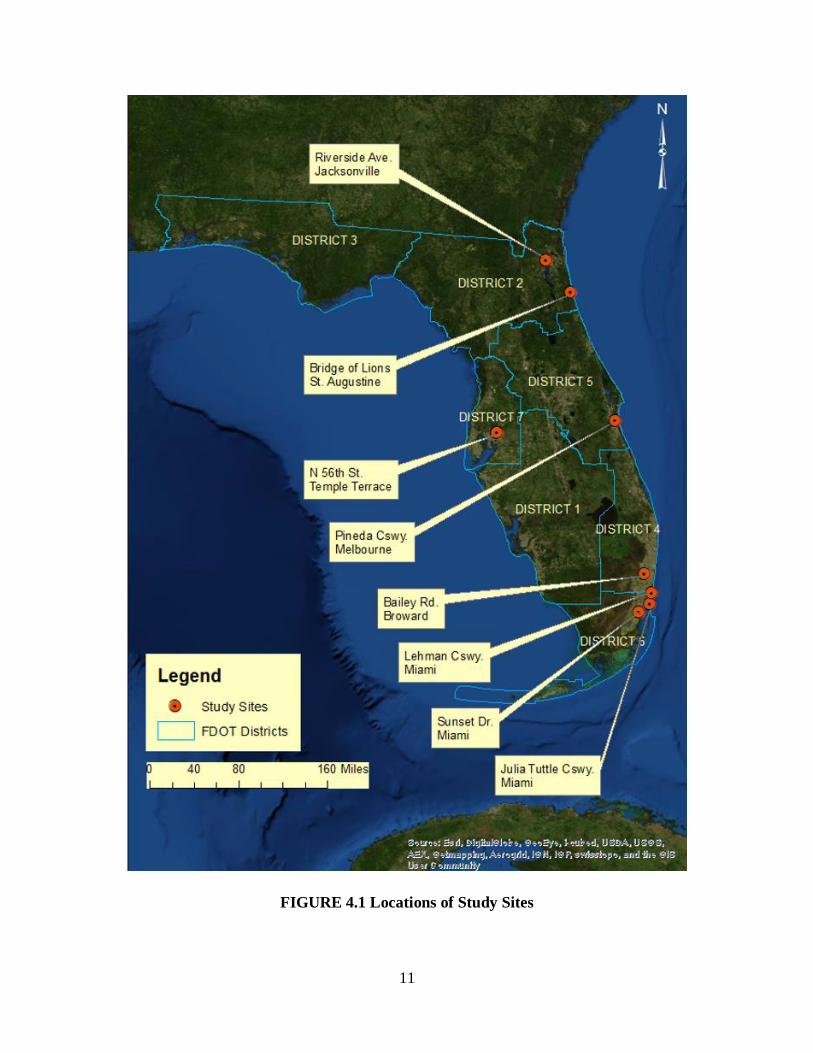
As shown in Figure 4.1, study sites were distributed across the state. Table 4.1 details the
roadway characteristics of all study sites. Three sites involved installation of sharrows while one
site in Miami, Sunset Drive, was a retrofit from a symmetric multilane to asymmetric section
with a wide outside lane. Another site in Fort Lauderdale (Bailey Road) had two different
configurations, a conventional bike lane with no buffer and a bike lane with a buffer between
motor traffic and bicycles. Three corridors were evaluated for travel by bicyclists on limited
access bridges (Pineda, William Lehman, and Julia Tuttle Causeways) and included the
installation of standard and green bike lanes. More information about characteristics of the
limited access sites can be found in Appendices A to F.
11
FIGURE 4.1 Locations of Study Sites
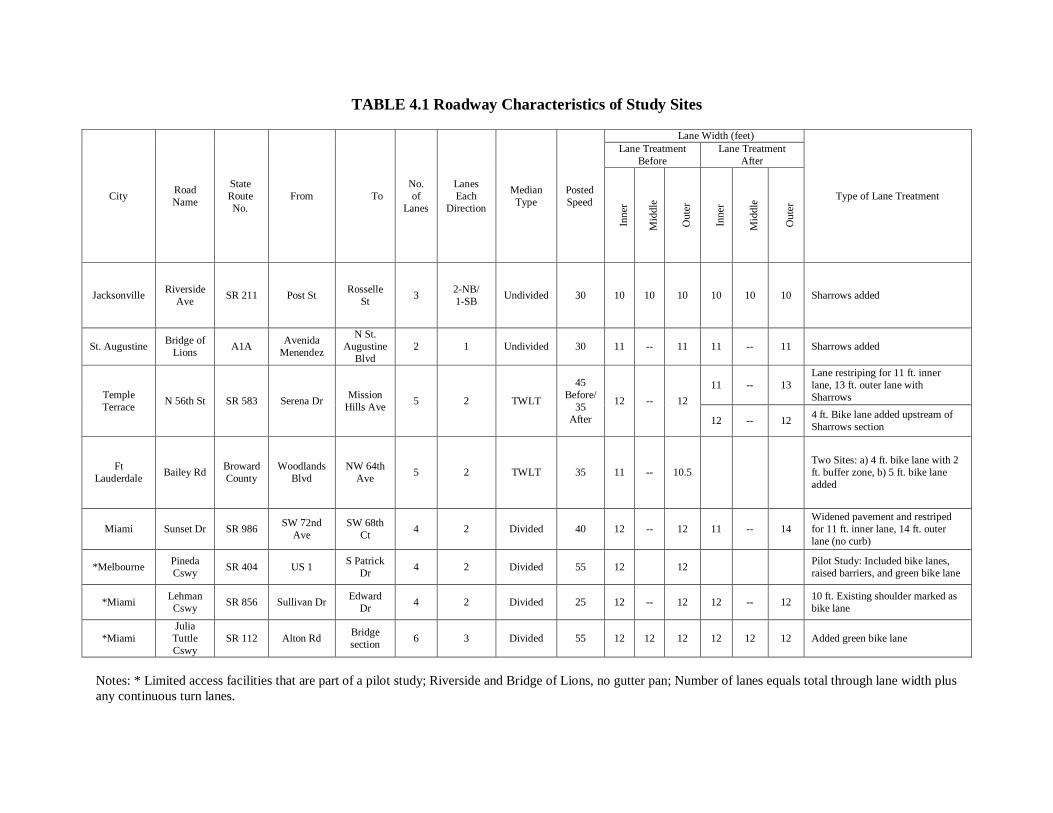
TABLE 4.1 Roadway Characteristics of Study Sites
City Road
Name
State
Route
No.
From To
No.
of
Lanes
Lanes
Each
Direction
Median
Type
Posted
Speed
Lane Width (feet)
Type of Lane Treatment
Lane Treatment
Before
Lane Treatment
After
Inner
Mid
dle
Oute
r
Inner
Mid
dle
Oute
r
Jacksonville Riverside
Ave SR 211 Post St
Rosselle
St 3
2-NB/
1-SB Undivided 30 10 10 10 10 10 10 Sharrows added
St. Augustine Bridge of
Lions A1A
Avenida
Menendez
N St.
Augustine
Blvd
2 1 Undivided 30 11 -- 11 11 -- 11 Sharrows added
Temple
Terrace N 56th St SR 583 Serena Dr
Mission
Hills Ave 5 2 TWLT
45
Before/
35
After
12 -- 12
11 -- 13
Lane restriping for 11 ft. inner
lane, 13 ft. outer lane with
Sharrows
12 -- 12 4 ft. Bike lane added upstream of
Sharrows section
Ft
Lauderdale Bailey Rd
Broward
County
Woodlands
Blvd
NW 64th
Ave 5 2 TWLT 35 11 -- 10.5
Two Sites: a) 4 ft. bike lane with 2
ft. buffer zone, b) 5 ft. bike lane
added
Miami Sunset Dr SR 986 SW 72nd
Ave
SW 68th
Ct 4 2 Divided 40 12 -- 12 11 -- 14
Widened pavement and restriped
for 11 ft. inner lane, 14 ft. outer
lane (no curb)
*Melbourne Pineda
Cswy SR 404 US 1
S Patrick
Dr 4 2 Divided 55 12 12
Pilot Study: Included bike lanes,
raised barriers, and green bike lane
*Miami Lehman
Cswy SR 856 Sullivan Dr
Edward
Dr 4 2 Divided 25 12 -- 12 12 -- 12
10 ft. Existing shoulder marked as
bike lane
*Miami
Julia
Tuttle
Cswy
SR 112 Alton Rd Bridge
section 6 3 Divided 55 12 12 12 12 12 12 Added green bike lane
Notes: * Limited access facilities that are part of a pilot study; Riverside and Bridge of Lions, no gutter pan; Number of lanes equals total through lane width plus
any continuous turn lanes.
13
5 METHODOLOGY
5.1 Data Collection
The data was collected at various times during the day, often in peak hour durations. In addition
to the local cyclists who were traveling through the corridor, volunteer cyclists from FDOT,
City, County, and Metropolitan Planning Organization (MPO) staff, as well as FDOT’s design
consultant were used to provide as many samples as possible of interactions of vehicles sharing
the outside lane with bicyclists both before and after bike lanes or sharrow markings were added
to the roadway segments. Members of the public who traveled the corridor by bicycle while data
was being collected were also included in the analysis.
At each location, cyclists rode along the selected road segment while researchers videotaped
their paths and interactions with motor vehicles. Video cameras were strategically located to
capture the behavior of motor vehicles as they approached and passed a bicyclist. Efforts were
made to conceal the camera and operator from passing traffic as to not influence driver behavior.
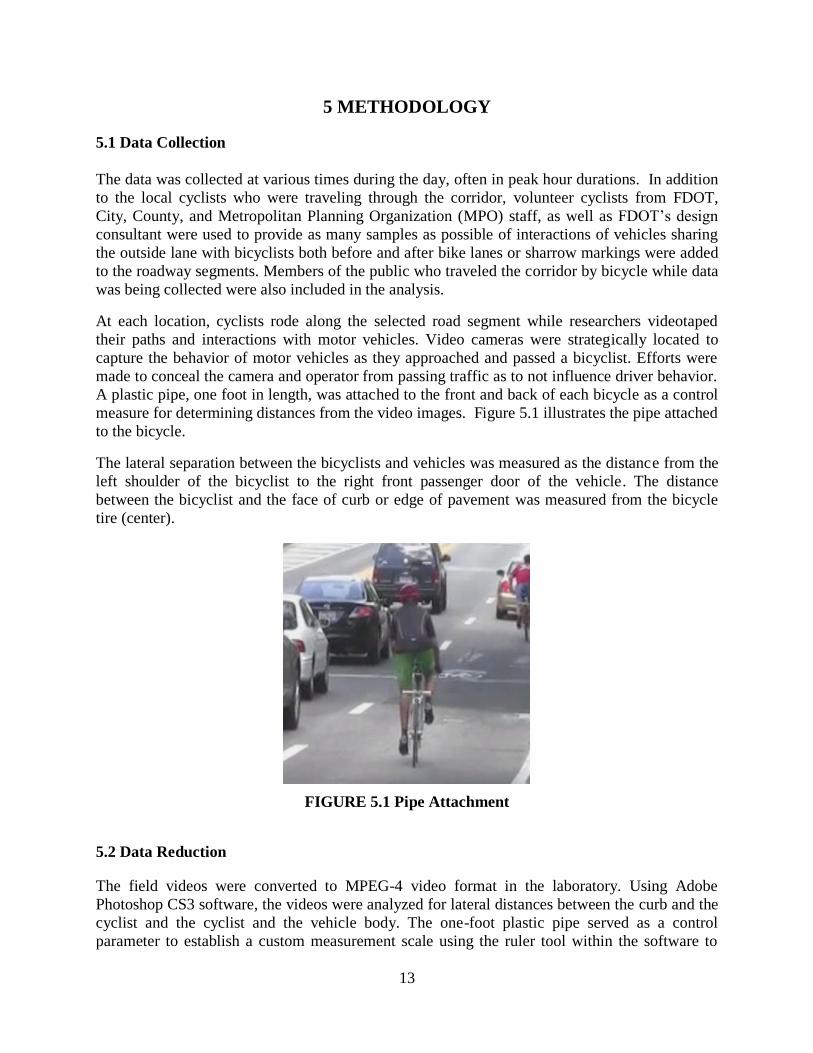
A plastic pipe, one foot in length, was attached to the front and back of each bicycle as a control
measure for determining distances from the video images. Figure 5.1 illustrates the pipe attached
to the bicycle.
The lateral separation between the bicyclists and vehicles was measured as the distance from the
left shoulder of the bicyclist to the right front passenger door of the vehicle. The distance
between the bicyclist and the face of curb or edge of pavement was measured from the bicycle
tire (center).
FIGURE 5.1 Pipe Attachment
5.2 Data Reduction
The field videos were converted to MPEG-4 video format in the laboratory. Using Adobe
Photoshop CS3 software, the videos were analyzed for lateral distances between the curb and the
cyclist and the cyclist and the vehicle body. The one-foot plastic pipe served as a control
parameter to establish a custom measurement scale using the ruler tool within the software to
14
determine the lateral distances. Measurements included the lateral distance from the bicycle tire
center to the face of curb or edge of pavement and from the cyclist’s left shoulder to the passing
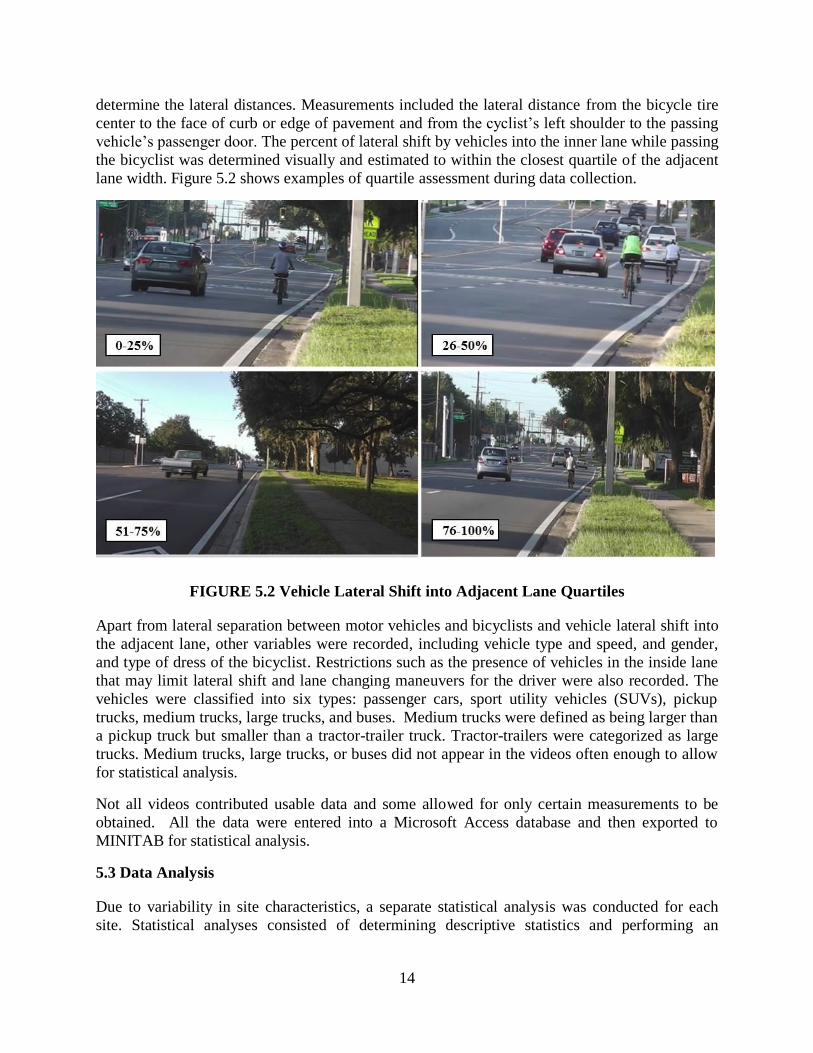
vehicle’s passenger door. The percent of lateral shift by vehicles into the inner lane while passing
the bicyclist was determined visually and estimated to within the closest quartile of the adjacent
lane width. Figure 5.2 shows examples of quartile assessment during data collection.
FIGURE 5.2 Vehicle Lateral Shift into Adjacent Lane Quartiles
Apart from lateral separation between motor vehicles and bicyclists and vehicle lateral shift into
the adjacent lane, other variables were recorded, including vehicle type and speed, and gender,
and type of dress of the bicyclist. Restrictions such as the presence of vehicles in the inside lane
that may limit lateral shift and lane changing maneuvers for the driver were also recorded. The
vehicles were classified into six types: passenger cars, sport utility vehicles (SUVs), pickup
trucks, medium trucks, large trucks, and buses. Medium trucks were defined as being larger than
a pickup truck but smaller than a tractor-trailer truck. Tractor-trailers were categorized as large
trucks. Medium trucks, large trucks, or buses did not appear in the videos often enough to allow
for statistical analysis.
Not all videos contributed usable data and some allowed for only certain measurements to be
obtained. All the data were entered into a Microsoft Access database and then exported to
MINITAB for statistical analysis.
5.3 Data Analysis
Due to variability in site characteristics, a separate statistical analysis was conducted for each
site. Statistical analyses consisted of determining descriptive statistics and performing an
15
Analysis of Variance (ANOVA) which use the sum of squares for treatments and sum of squares
for error to test the significance of the difference in treatments.
The mean square for treatments is the measure of variability among the treatment means, while
the mean square for error measures the sampling variability within the treatments. The F-statistic
is calculated as the ratio of the mean square for treatments (MST) and the mean square for error
(MSE) as shown in the equation below.
𝐹 =MST
MSE
Values of the F-statistic near one indicate that the two sources of variation, between treatment
means and within treatments, are approximately equal. In this case, the difference between the
treatment means may well be attributable to sampling error, which provides little support for the
significance of the difference between the two treatments. To determine whether the value of F-
statistic exceeds the value of one, enough to suggest a significant difference between the two
treatments, a computed F-statistic is compared to the F-value taken from statistical tables and is
based on the degrees of freedom and the confidence level. If the obtained p-value is less than the
considered level of significance, typically 95% in traffic studies (i.e., α = 0.05), there would be
sufficient evidence to conclude that the two treatment means differ.
16
6 ANALYSIS AND RESULTS
Due to differences in site characteristics and the before-and-after configurations, separate
analyses were conducted for each study site. This section discusses the analyses and results for
each site.
6.1 Riverside Drive (Jacksonville)
The site at Riverside Drive consists of three lanes, two northbound and one southbound, with
lane widths of approximately 10 feet. Figures 6.1 and 6.2 display the study segment, located
between Post and Rosselle Streets. Sharrows were installed in both directions along the segment
as shown in Figure 6.2.
FIGURE 6.1 Riverside Drive Northbound
17
FIGURE 6.2 Shared Lane Markings: Riverside Drive
Descriptive statistics of the lateral clearance between motor vehicles and bicycles and distance
from bicycle to the curb are summarized in Tables 6.1 and 6.2. The lateral vehicle clearance, the
lateral separation between the vehicle and the body of the bicyclist, increased from 5.18 feet in
the before condition to 5.85 feet after sharrows were installed; a gain of 0.67 feet. The
distribution of lateral separation between vehicles and bicyclists, shown in Figure 6.3, indicates
the tendency of drivers to shift to the inside lane, and leaving more space for the bicyclist to ride,
with the presence of sharrows.
TABLE 6.1 Lateral Clearance between Bicyclist and Vehicle: Riverside Drive
City Road Sample Size Mean (ft.)
Std. Dev.
(ft.) Minimum
(ft.) Maximum
(ft.) Before After Before After Before After Before After Before After
Jacksonville Riverside
Dr. 38 30 5.18 5.85 1.82 1.72 1.59 1.70 8.69 8.34
TABLE 6.2 Lateral Clearance between Bicyclist and Curb: Riverside Drive
City Road Sample Size Mean (ft.)
Std. Dev.
(ft.) Minimum
(ft.) Maximum
(ft.) Before After Before After Before After Before After Before After
Jacksonville Riverside
Dr. 38 30 2.94 4.32 0.69 2.92 2.07 1.83 4.64 12.83
18
The mean lateral distance between the bicycle tire center and face of curb, the lateral bicycle
clearance, increased by 1.38 feet from the before-period to the after-period (after sharrows were
installed) as listed in Table 6.2. These findings are similar to those found by Brady et al. (5) in
relation to the lateral bicycle position to the on-street parking delineation line. The standard
location for the shared lane markings was 5.5 feet from the face of curb; however the location of
the sharrows varied within the lane as the designers were trying to avoid some rough pavement
or utilities. After the sharrows were installed, bicyclists tended to ride further away from the
curb, and northbound drivers tended to use the inside lane more frequently. The distribution of
the distance from the bicyclist to the curb is depicted in Figure 6.4.
FIGURE 6.3 Distribution of Bicyclist to Vehicle Separation: Riverside Drive
FIGURE 6.2 Distribution of Bicyclist to Curb Distance: Riverside Drive
19
6.1.1 Analysis of Variance
Tables 6.3 and 6.4 show the ANOVA results for the Riverside Drive study segment. The
Analysis of Variance indicates a significant difference between the vehicle and bicycle
separation from the before-period to the after-period with sharrows by the p-value of 0.039.
Also, the results suggest that there is a significant difference in the way bicyclists ride in relation
to the curb after sharrows were installed. A p-value of 0.015, obtained from the ANOVA, for the
distance between bicyclists and the curb for the before- and after-scenario reflects the
significance in the difference.
TABLE 6.3 ANOVA Results for Sharrows Effect (Cyclist to Vehicle): Riverside Drive
Source DF Sum of
Squares Mean Square F-Value p-value
Model 1 7.45 7.45 2.36 0.039
Error 77 208.07 3.15
Total 67 215.52
TABLE 6.4 ANOVA Results for Sharrows Effect (Cyclist to Curb): Riverside Drive
Source DF Sum of
Squares Mean Square F-Value p-value
Model 1 26.74 26.74 6.19 0.015
Error 66 349.80 4.32
Total 67 376.54
6.2 Bridge of Lions (St. Augustine)
The study segment at this location is across the Bridge of Lions, a two lane undivided roadway
with lane widths of 11 feet, one in each direction. Sharrow placement at this site is illustrated in
Appendix G. Descriptive statistics of the lateral clearance between motor vehicles and bicycles
and the distance from bicycle to the curb are summarized in Tables 6.5 and 6.6. The lateral
vehicle clearance did not improve significantly at this site. Before sharrows, an average
clearance of 3.58 feet was observed. After sharrows were installed, the average clearance
improved by only 0.04 feet for an average to of 3.62 feet. Sharrows were placed 5.5 feet of the
face of curb due to the narrow lanes. The Bridge of Lions study segment after sharrows were
installed is shown in Figure 6.5.
20
FIGURE 6.5 Shared Lane Markings: Bridge of Lions
These findings may be attributed to high traffic volumes and the crown of the bridge limiting
forward sight distance, thus providing little opportunity to overtake bicyclists. Without an
adjacent lane in the same direction, oncoming traffic severely limits a driver’s ability to shift left
and pass a bicyclist. The bridge is also marked as a no passing zone. The distribution of lateral
clearance distances shown in Figure 6.6 also depicts the same phenomenon, little difference
between the two distributions.
TABLE 6.5 Lateral Clearance between Bicyclist and Vehicle: Bridge of Lions
City Road Sample Size Mean (ft.) Std. Dev. (ft.)
Minimum
(ft.) Maximum
(ft.) Before After Before After Before After Before After Before After
St.
Augustine Bridge
of Lions 77 60 3.58 3.62 1.34 1.43 0.82 1.29 6.86 7.82
21
FIGURE 6.6 Distribution of Bicyclist to Vehicle Separation: Bridge of Lions
Although not much improvement was observed on the lateral clearance between vehicles and
bicyclists at the Bridge of Lions site, the lateral distance between the bicyclist and the raised curb
increased notably. Before sharrows, the distance from the bicyclist to the raised curb was
observed to be 2.74 feet, and 4.24 feet after sharrows; an increase of 1.50 feet (Table 6.6). These
findings are further supported by the distribution plots shown in Figure 6.7. This observation
suggests that as bicyclists moved further away from the curb after sharrows were installed on the
Bridge of Lions, motor vehicles also shifted to the left to maintain the same relative separation.
The frequency of aggressive behavior from drivers seemed to decrease, although this is based
upon the personal observations of cyclists in the study.
TABLE 6.6 Lateral Clearance between Bicyclist and Curb: Bridge of Lions
City Road Sample Size Mean (ft.) Std. Dev. (ft.)
Minimum
(ft.) Maximum
(ft.) Before After Before After Before After Before After Before After
St.
Augustine Bridge
of Lions 77 60 2.74 4.24 0.78 0.68 2.17 3.24 6.09 6.10
22
FIGURE 6.7 Distribution of Bicyclist to Curb Distance: Bridge of Lions
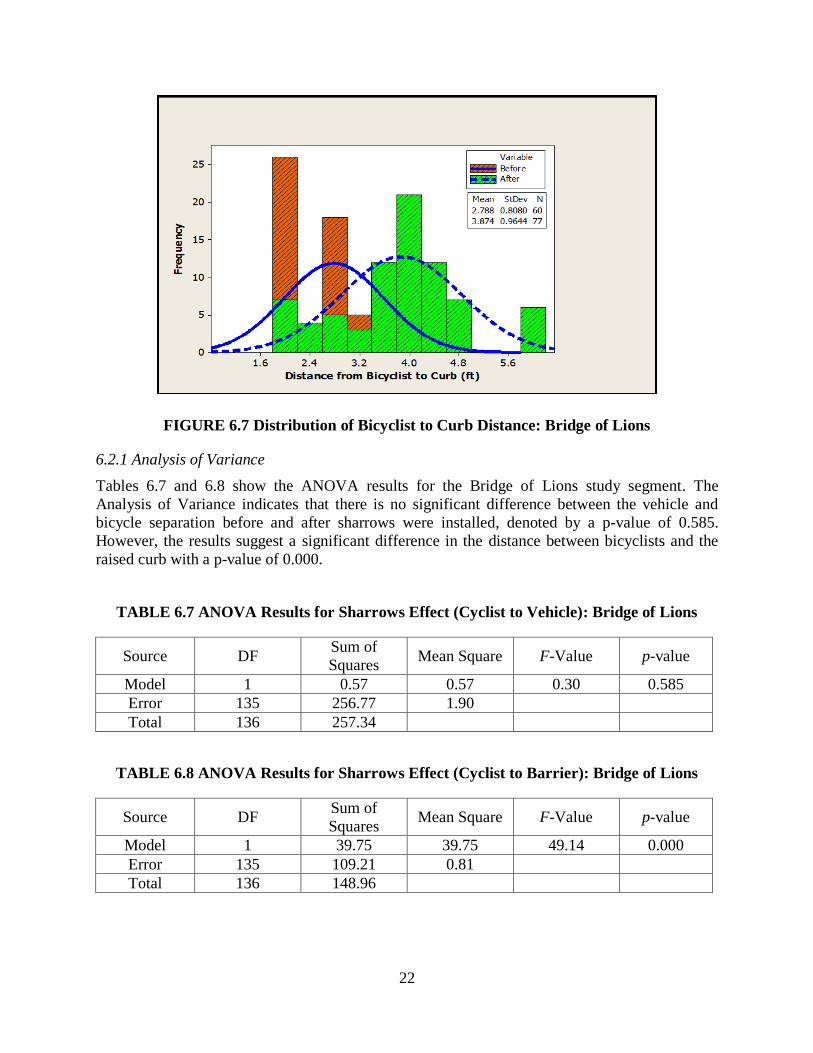
6.2.1 Analysis of Variance
Tables 6.7 and 6.8 show the ANOVA results for the Bridge of Lions study segment. The
Analysis of Variance indicates that there is no significant difference between the vehicle and
bicycle separation before and after sharrows were installed, denoted by a p-value of 0.585.
However, the results suggest a significant difference in the distance between bicyclists and the
raised curb with a p-value of 0.000.
TABLE 6.7 ANOVA Results for Sharrows Effect (Cyclist to Vehicle): Bridge of Lions
Source DF Sum of
Squares Mean Square F-Value p-value
Model 1 0.57 0.57 0.30 0.585
Error 135 256.77 1.90
Total 136 257.34
TABLE 6.8 ANOVA Results for Sharrows Effect (Cyclist to Barrier): Bridge of Lions
Source DF Sum of
Squares Mean Square F-Value p-value
Model 1 39.75 39.75 49.14 0.000
Error 135 109.21 0.81
Total 136 148.96
23
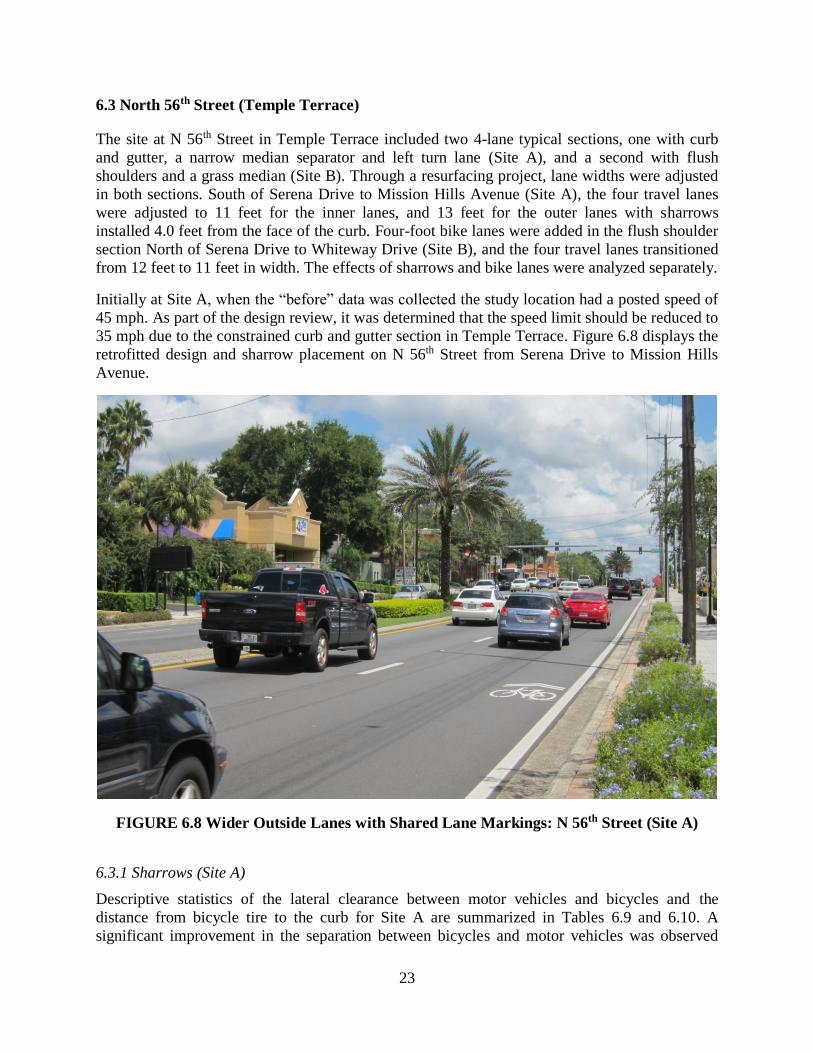
6.3 North 56th Street (Temple Terrace)
The site at N 56th Street in Temple Terrace included two 4-lane typical sections, one with curb
and gutter, a narrow median separator and left turn lane (Site A), and a second with flush
shoulders and a grass median (Site B). Through a resurfacing project, lane widths were adjusted
in both sections. South of Serena Drive to Mission Hills Avenue (Site A), the four travel lanes
were adjusted to 11 feet for the inner lanes, and 13 feet for the outer lanes with sharrows
installed 4.0 feet from the face of the curb. Four-foot bike lanes were added in the flush shoulder
section North of Serena Drive to Whiteway Drive (Site B), and the four travel lanes transitioned
from 12 feet to 11 feet in width. The effects of sharrows and bike lanes were analyzed separately.
Initially at Site A, when the “before” data was collected the study location had a posted speed of
45 mph. As part of the design review, it was determined that the speed limit should be reduced to
35 mph due to the constrained curb and gutter section in Temple Terrace. Figure 6.8 displays the
retrofitted design and sharrow placement on N 56th Street from Serena Drive to Mission Hills
Avenue.
FIGURE 6.8 Wider Outside Lanes with Shared Lane Markings: N 56th Street (Site A)
6.3.1 Sharrows (Site A)
Descriptive statistics of the lateral clearance between motor vehicles and bicycles and the
distance from bicycle tire to the curb for Site A are summarized in Tables 6.9 and 6.10. A
significant improvement in the separation between bicycles and motor vehicles was observed
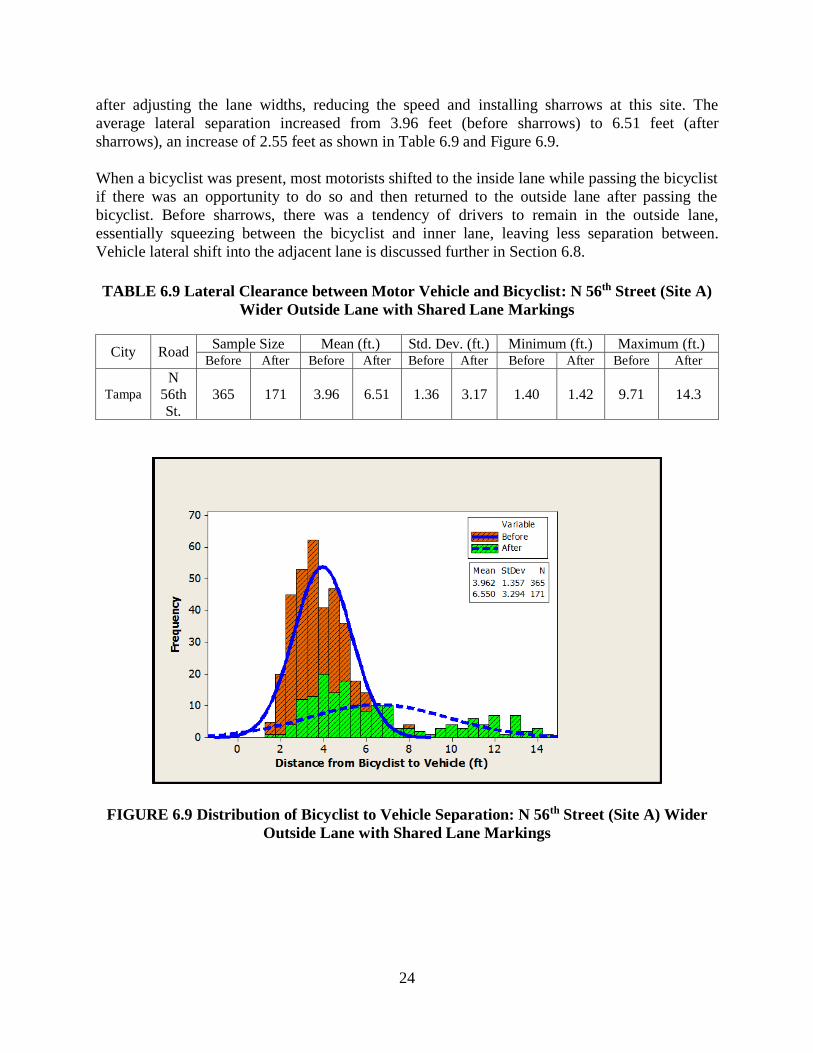
24
after adjusting the lane widths, reducing the speed and installing sharrows at this site. The
average lateral separation increased from 3.96 feet (before sharrows) to 6.51 feet (after
sharrows), an increase of 2.55 feet as shown in Table 6.9 and Figure 6.9.
When a bicyclist was present, most motorists shifted to the inside lane while passing the bicyclist
if there was an opportunity to do so and then returned to the outside lane after passing the
bicyclist. Before sharrows, there was a tendency of drivers to remain in the outside lane,
essentially squeezing between the bicyclist and inner lane, leaving less separation between.
Vehicle lateral shift into the adjacent lane is discussed further in Section 6.8.
TABLE 6.9 Lateral Clearance between Motor Vehicle and Bicyclist: N 56th Street (Site A)
Wider Outside Lane with Shared Lane Markings
City Road Sample Size Mean (ft.) Std. Dev. (ft.) Minimum (ft.) Maximum (ft.)
Before After Before After Before After Before After Before After
Tampa N
56th
St. 365 171 3.96 6.51 1.36 3.17 1.40 1.42 9.71 14.3
FIGURE 6.9 Distribution of Bicyclist to Vehicle Separation: N 56th Street (Site A) Wider
Outside Lane with Shared Lane Markings
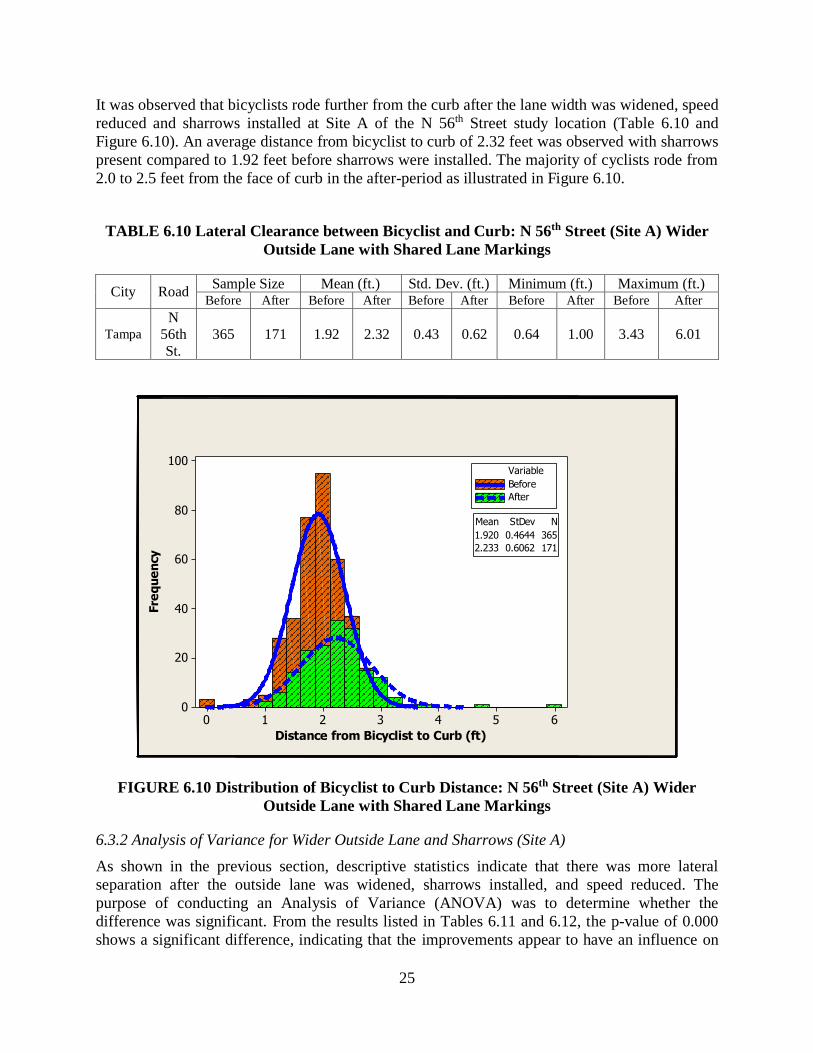
25
It was observed that bicyclists rode further from the curb after the lane width was widened, speed
reduced and sharrows installed at Site A of the N 56th Street study location (Table 6.10 and
Figure 6.10). An average distance from bicyclist to curb of 2.32 feet was observed with sharrows
present compared to 1.92 feet before sharrows were installed. The majority of cyclists rode from
2.0 to 2.5 feet from the face of curb in the after-period as illustrated in Figure 6.10.
TABLE 6.10 Lateral Clearance between Bicyclist and Curb: N 56th Street (Site A) Wider
Outside Lane with Shared Lane Markings
City Road Sample Size Mean (ft.) Std. Dev. (ft.) Minimum (ft.) Maximum (ft.)
Before After Before After Before After Before After Before After
Tampa N
56th
St. 365 171 1.92 2.32 0.43 0.62 0.64 1.00 3.43 6.01
6543210
100
80
60
40
20
0
Distance from Bicyclist to Curb (ft)
Fre
qu
en
cy
1.920 0.4644 365
2.233 0.6062 171
Mean StDev N
Before
After
Variable
FIGURE 6.10 Distribution of Bicyclist to Curb Distance: N 56th Street (Site A) Wider
Outside Lane with Shared Lane Markings
6.3.2 Analysis of Variance for Wider Outside Lane and Sharrows (Site A)
As shown in the previous section, descriptive statistics indicate that there was more lateral
separation after the outside lane was widened, sharrows installed, and speed reduced. The
purpose of conducting an Analysis of Variance (ANOVA) was to determine whether the
difference was significant. From the results listed in Tables 6.11 and 6.12, the p-value of 0.000
shows a significant difference, indicating that the improvements appear to have an influence on
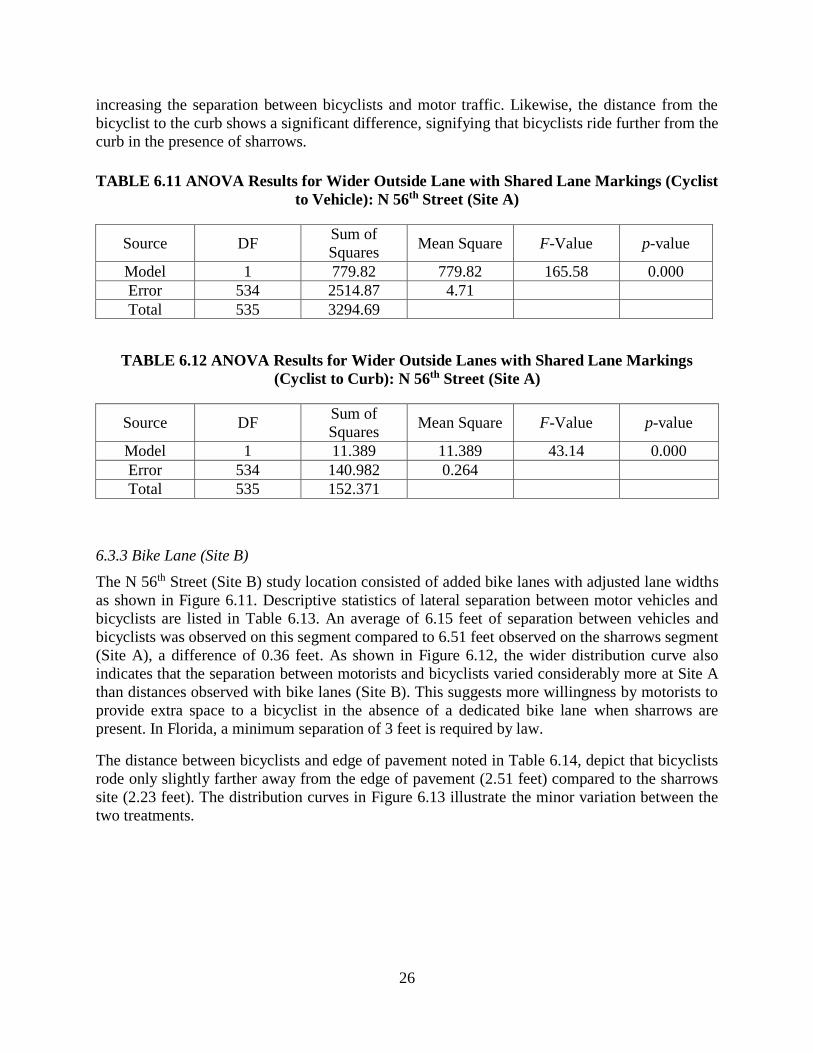
26
increasing the separation between bicyclists and motor traffic. Likewise, the distance from the
bicyclist to the curb shows a significant difference, signifying that bicyclists ride further from the
curb in the presence of sharrows.
TABLE 6.11 ANOVA Results for Wider Outside Lane with Shared Lane Markings (Cyclist
to Vehicle): N 56th Street (Site A)
Source DF Sum of
Squares Mean Square F-Value p-value
Model 1 779.82 779.82 165.58 0.000
Error 534 2514.87 4.71
Total 535 3294.69
TABLE 6.12 ANOVA Results for Wider Outside Lanes with Shared Lane Markings
(Cyclist to Curb): N 56th Street (Site A)
Source DF Sum of
Squares Mean Square F-Value p-value
Model 1 11.389 11.389 43.14 0.000
Error 534 140.982 0.264
Total 535 152.371
6.3.3 Bike Lane (Site B)
The N 56th Street (Site B) study location consisted of added bike lanes with adjusted lane widths
as shown in Figure 6.11. Descriptive statistics of lateral separation between motor vehicles and
bicyclists are listed in Table 6.13. An average of 6.15 feet of separation between vehicles and
bicyclists was observed on this segment compared to 6.51 feet observed on the sharrows segment
(Site A), a difference of 0.36 feet. As shown in Figure 6.12, the wider distribution curve also
indicates that the separation between motorists and bicyclists varied considerably more at Site A
than distances observed with bike lanes (Site B). This suggests more willingness by motorists to
provide extra space to a bicyclist in the absence of a dedicated bike lane when sharrows are
present. In Florida, a minimum separation of 3 feet is required by law.
The distance between bicyclists and edge of pavement noted in Table 6.14, depict that bicyclists
rode only slightly farther away from the edge of pavement (2.51 feet) compared to the sharrows
site (2.23 feet). The distribution curves in Figure 6.13 illustrate the minor variation between the
two treatments.
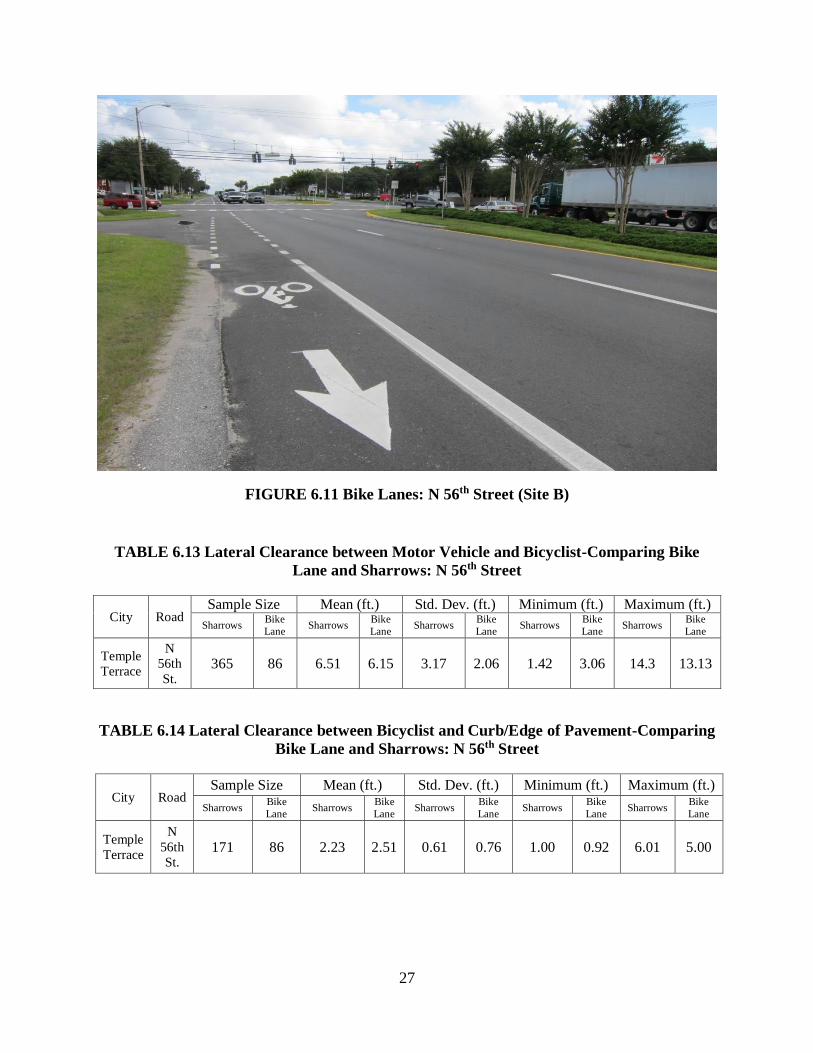
27
FIGURE 6.11 Bike Lanes: N 56th Street (Site B)
TABLE 6.13 Lateral Clearance between Motor Vehicle and Bicyclist-Comparing Bike
Lane and Sharrows: N 56th Street
City Road Sample Size Mean (ft.) Std. Dev. (ft.) Minimum (ft.) Maximum (ft.)
Sharrows Bike
Lane Sharrows
Bike
Lane Sharrows
Bike
Lane Sharrows
Bike
Lane Sharrows
Bike
Lane
Temple
Terrace
N
56th
St. 365 86 6.51 6.15 3.17 2.06 1.42 3.06 14.3 13.13
TABLE 6.14 Lateral Clearance between Bicyclist and Curb/Edge of Pavement-Comparing
Bike Lane and Sharrows: N 56th Street
City Road Sample Size Mean (ft.) Std. Dev. (ft.) Minimum (ft.) Maximum (ft.)
Sharrows Bike
Lane Sharrows
Bike
Lane Sharrows
Bike
Lane Sharrows
Bike
Lane Sharrows
Bike
Lane
Temple
Terrace
N
56th
St. 171 86 2.23 2.51 0.61 0.76 1.00 0.92 6.01 5.00
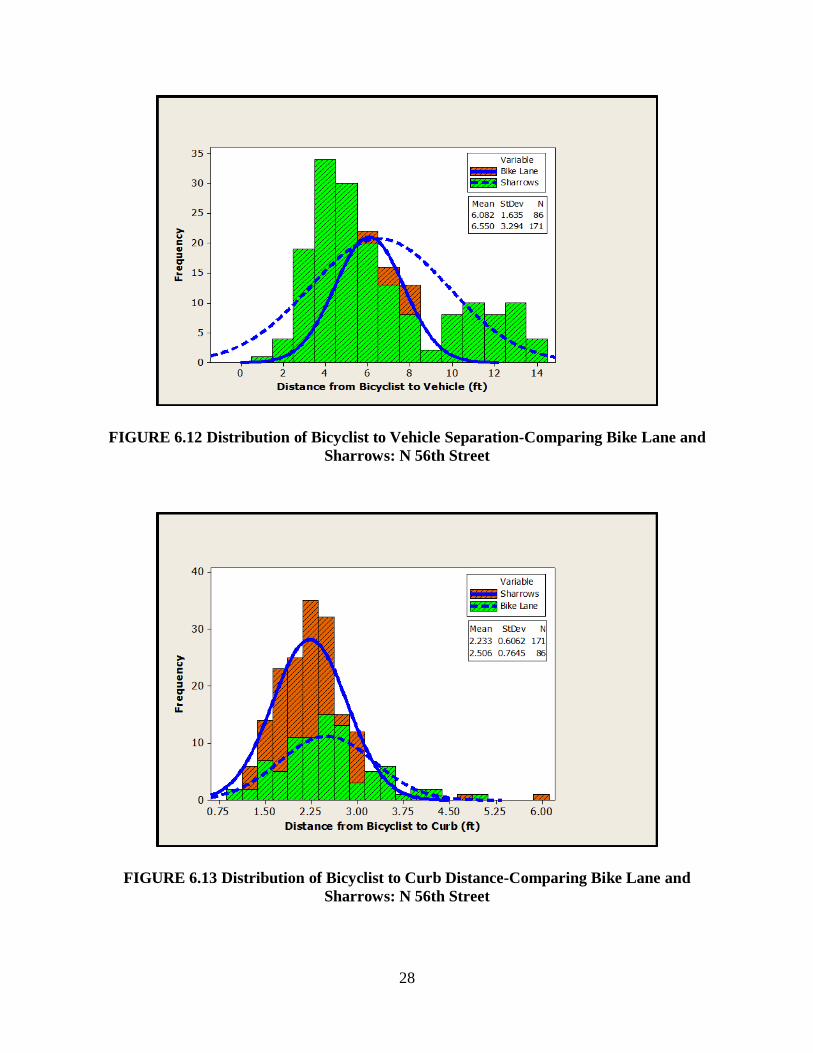
28
FIGURE 6.12 Distribution of Bicyclist to Vehicle Separation-Comparing Bike Lane and
Sharrows: N 56th Street
FIGURE 6.13 Distribution of Bicyclist to Curb Distance-Comparing Bike Lane and
Sharrows: N 56th Street
29
6.3.4 Analysis of Variance for Bike Lane (Site B)
ANOVA results from the comparison between bicycle treatments (sharrows and bike lane) on
North 56th Street are summarized in Tables 6.15 and 6.16. The results indicate that there is no
significant difference (p-value of 0.216) between the two treatments in lateral separation between
vehicles and bicyclists. However, the results suggest a significant difference (p-value of 0.02) in
the distance from the bicyclists to the curb or edge of pavement. It was also observed that drivers
did not slow down in the bike lane section as much as they did at the sharrows site. However,
this was an anecdotal observation.
TABLE 6.15 ANOVA Results for Sharrows vs. Bike Lane (Cyclist to Vehicle): N 56th
Street
Source DF Sum of
Squares Mean Square F-Value p-value
Model 1 12.53 12.53 1.54 0.216
Error 255 2072.13 8.13
Total 256 2084.65
TABLE 6.16 ANOVA Results for Sharrows vs. Bike Lane (Cyclist to Curb/Edge of
Pavement): N 56th Street
Source DF Sum of
Squares Mean Square F-Value p-value
Model 1 4.27 4.27 9.70 0.02
Error 255 112.15 0.44
Total 256 116.42
6.4 Sunset Drive (Miami)
The Sunset Drive study site involved comparing operational characteristics of a four-lane (two
lanes in each direction) divided roadway with a curbed median and flush grass shoulders. The
pavement width was increased by reducing the median and applying the additional width to the
outside lanes. The result was wider outside lanes (14 feet lane) and narrower inside lanes (11
feet). No sharrows were installed on this facility, shown in Figures 6.14 and 6.15.
30
FIGURE 6.14 Sunset Drive (before scenario)
FIGURE 6.15 Sunset Drive (after scenario)
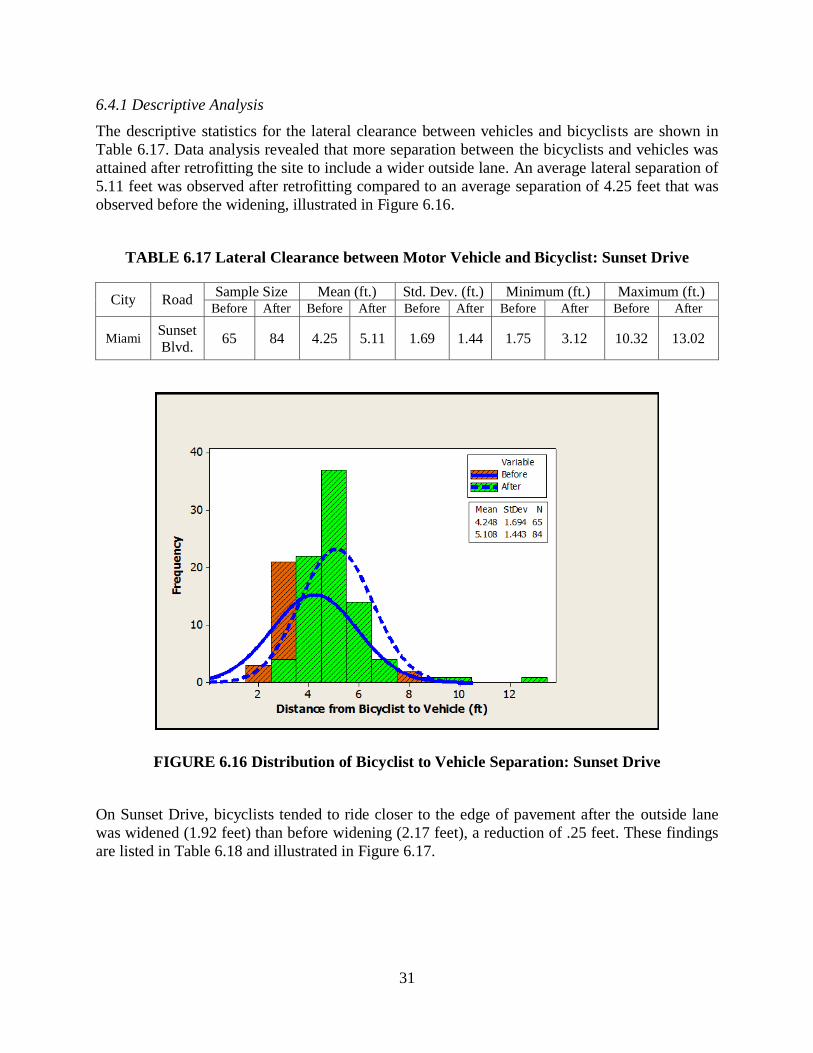
31
6.4.1 Descriptive Analysis
The descriptive statistics for the lateral clearance between vehicles and bicyclists are shown in
Table 6.17. Data analysis revealed that more separation between the bicyclists and vehicles was
attained after retrofitting the site to include a wider outside lane. An average lateral separation of
5.11 feet was observed after retrofitting compared to an average separation of 4.25 feet that was
observed before the widening, illustrated in Figure 6.16.
TABLE 6.17 Lateral Clearance between Motor Vehicle and Bicyclist: Sunset Drive
City Road Sample Size Mean (ft.) Std. Dev. (ft.) Minimum (ft.) Maximum (ft.)
Before After Before After Before After Before After Before After
Miami Sunset
Blvd. 65 84 4.25 5.11 1.69 1.44 1.75 3.12 10.32 13.02
FIGURE 6.16 Distribution of Bicyclist to Vehicle Separation: Sunset Drive
On Sunset Drive, bicyclists tended to ride closer to the edge of pavement after the outside lane
was widened (1.92 feet) than before widening (2.17 feet), a reduction of .25 feet. These findings
are listed in Table 6.18 and illustrated in Figure 6.17.
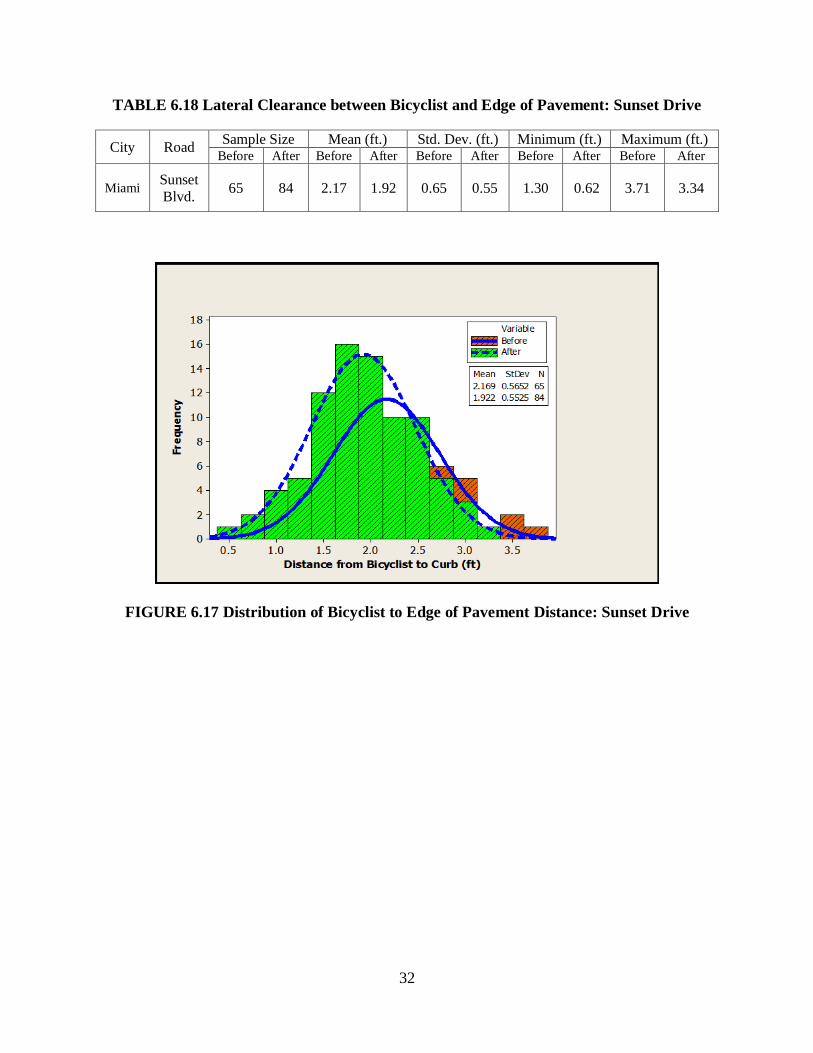
32
TABLE 6.18 Lateral Clearance between Bicyclist and Edge of Pavement: Sunset Drive
City Road Sample Size Mean (ft.) Std. Dev. (ft.) Minimum (ft.) Maximum (ft.)
Before After Before After Before After Before After Before After
Miami Sunset
Blvd. 65 84 2.17 1.92 0.65 0.55 1.30 0.62 3.71 3.34
FIGURE 6.17 Distribution of Bicyclist to Edge of Pavement Distance: Sunset Drive
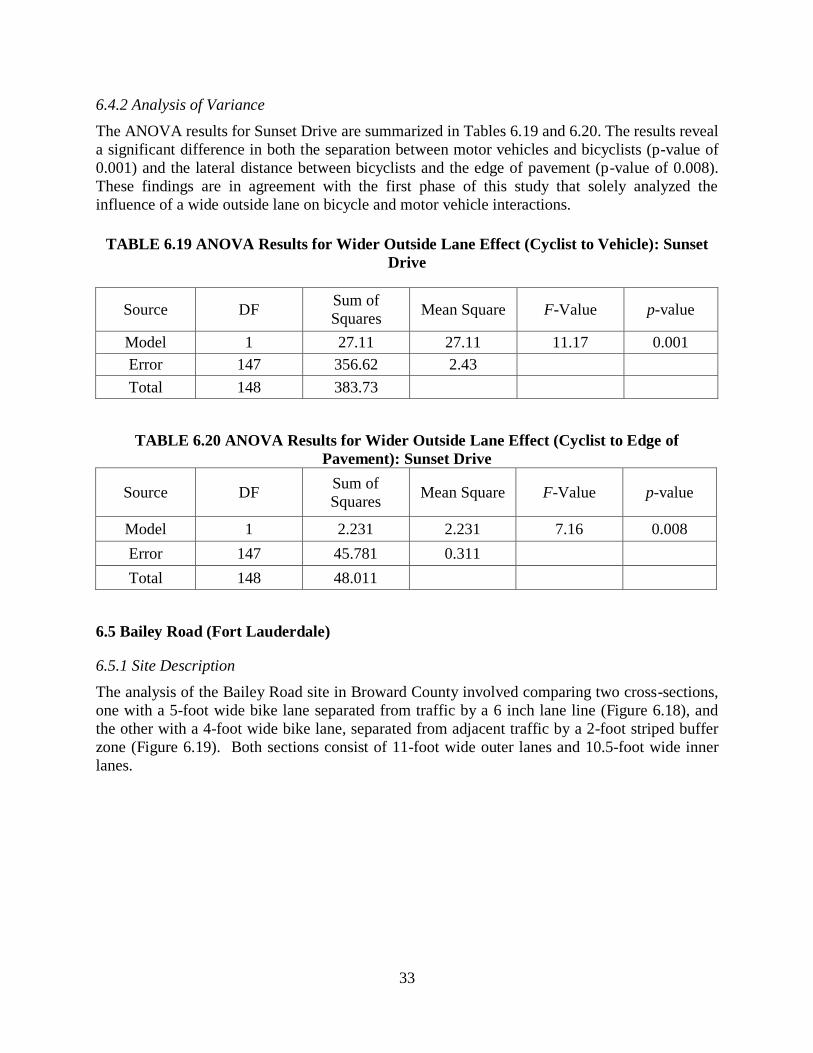
33
6.4.2 Analysis of Variance
The ANOVA results for Sunset Drive are summarized in Tables 6.19 and 6.20. The results reveal
a significant difference in both the separation between motor vehicles and bicyclists (p-value of
0.001) and the lateral distance between bicyclists and the edge of pavement (p-value of 0.008).
These findings are in agreement with the first phase of this study that solely analyzed the
influence of a wide outside lane on bicycle and motor vehicle interactions.
TABLE 6.19 ANOVA Results for Wider Outside Lane Effect (Cyclist to Vehicle): Sunset
Drive
Source DF Sum of
Squares Mean Square F-Value p-value
Model 1 27.11 27.11 11.17 0.001
Error 147 356.62 2.43
Total 148 383.73
TABLE 6.20 ANOVA Results for Wider Outside Lane Effect (Cyclist to Edge of
Pavement): Sunset Drive
Source DF Sum of
Squares Mean Square F-Value p-value
Model 1 2.231 2.231 7.16 0.008
Error 147 45.781 0.311
Total 148 48.011
6.5 Bailey Road (Fort Lauderdale)
6.5.1 Site Description
The analysis of the Bailey Road site in Broward County involved comparing two cross-sections,
one with a 5-foot wide bike lane separated from traffic by a 6 inch lane line (Figure 6.18), and
the other with a 4-foot wide bike lane, separated from adjacent traffic by a 2-foot striped buffer
zone (Figure 6.19). Both sections consist of 11-foot wide outer lanes and 10.5-foot wide inner
lanes.
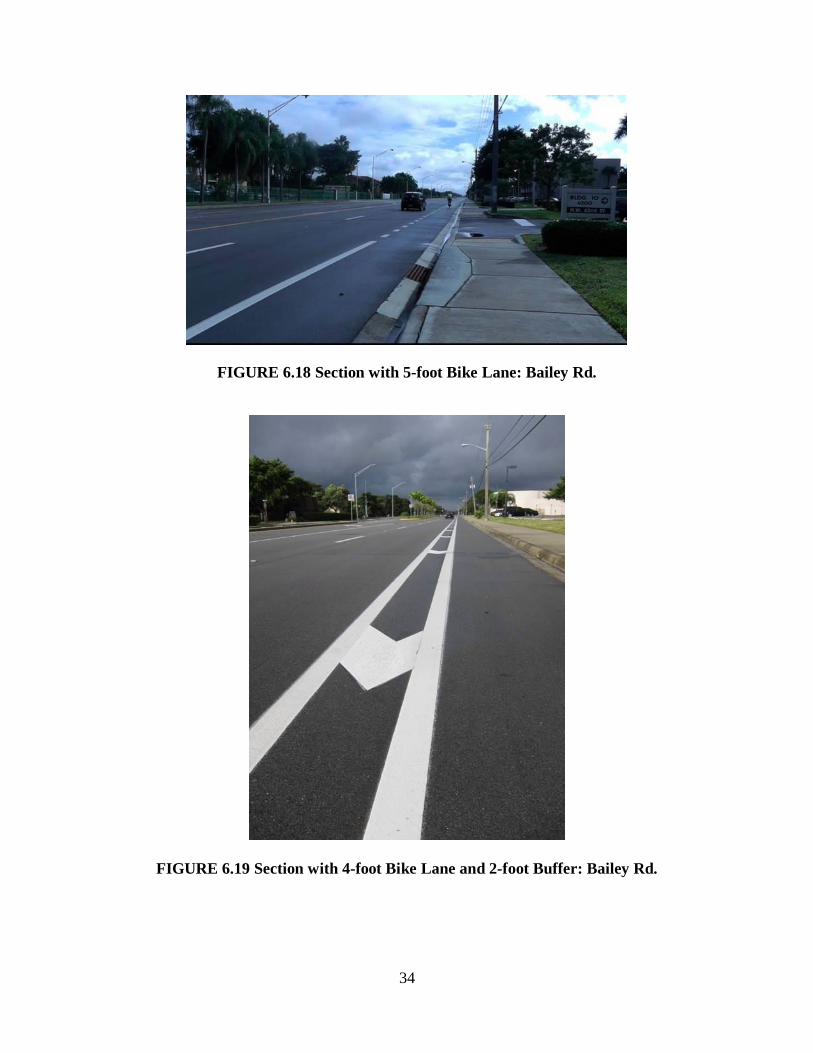
34
FIGURE 6.18 Section with 5-foot Bike Lane: Bailey Rd.
FIGURE 6.19 Section with 4-foot Bike Lane and 2-foot Buffer: Bailey Rd.
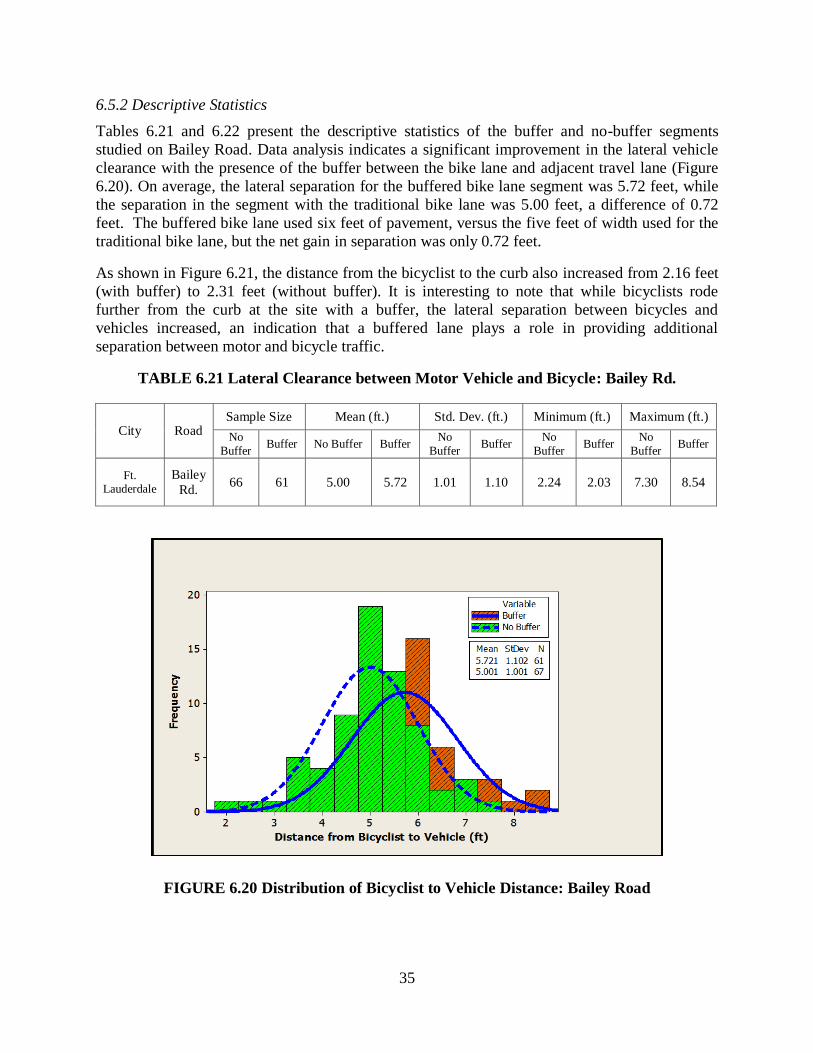
35
6.5.2 Descriptive Statistics
Tables 6.21 and 6.22 present the descriptive statistics of the buffer and no-buffer segments
studied on Bailey Road. Data analysis indicates a significant improvement in the lateral vehicle
clearance with the presence of the buffer between the bike lane and adjacent travel lane (Figure
6.20). On average, the lateral separation for the buffered bike lane segment was 5.72 feet, while
the separation in the segment with the traditional bike lane was 5.00 feet, a difference of 0.72
feet. The buffered bike lane used six feet of pavement, versus the five feet of width used for the
traditional bike lane, but the net gain in separation was only 0.72 feet.
As shown in Figure 6.21, the distance from the bicyclist to the curb also increased from 2.16 feet
(with buffer) to 2.31 feet (without buffer). It is interesting to note that while bicyclists rode
further from the curb at the site with a buffer, the lateral separation between bicycles and
vehicles increased, an indication that a buffered lane plays a role in providing additional
separation between motor and bicycle traffic.
TABLE 6.21 Lateral Clearance between Motor Vehicle and Bicycle: Bailey Rd.
City Road Sample Size Mean (ft.) Std. Dev. (ft.) Minimum (ft.) Maximum (ft.)
No
Buffer Buffer No Buffer Buffer
No
Buffer Buffer
No
Buffer Buffer
No
Buffer Buffer
Ft.
Lauderdale Bailey
Rd. 66 61 5.00 5.72 1.01 1.10 2.24 2.03 7.30 8.54
FIGURE 6.20 Distribution of Bicyclist to Vehicle Distance: Bailey Road
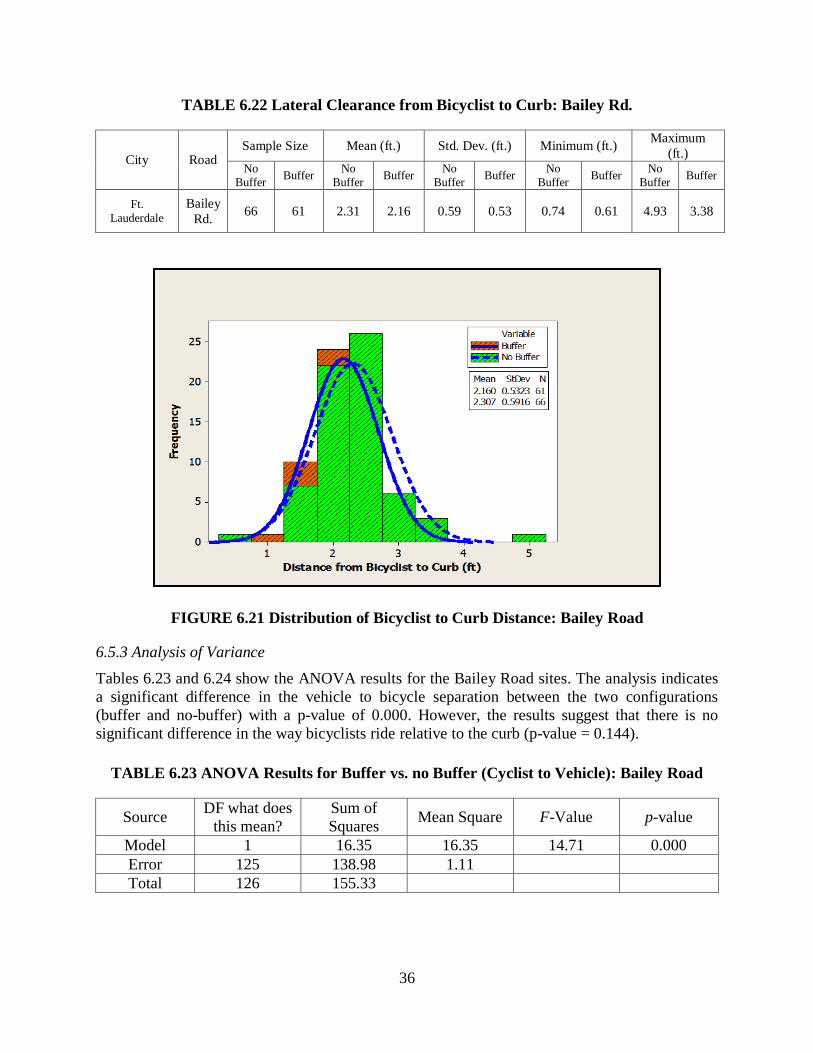
36
TABLE 6.22 Lateral Clearance from Bicyclist to Curb: Bailey Rd.
City Road Sample Size Mean (ft.) Std. Dev. (ft.) Minimum (ft.)
Maximum
(ft.) No
Buffer Buffer
No
Buffer Buffer
No
Buffer Buffer
No
Buffer Buffer
No
Buffer Buffer
Ft.
Lauderdale Bailey
Rd. 66 61 2.31 2.16 0.59 0.53 0.74 0.61 4.93 3.38
FIGURE 6.21 Distribution of Bicyclist to Curb Distance: Bailey Road
6.5.3 Analysis of Variance
Tables 6.23 and 6.24 show the ANOVA results for the Bailey Road sites. The analysis indicates
a significant difference in the vehicle to bicycle separation between the two configurations
(buffer and no-buffer) with a p-value of 0.000. However, the results suggest that there is no
significant difference in the way bicyclists ride relative to the curb (p-value = 0.144).
TABLE 6.23 ANOVA Results for Buffer vs. no Buffer (Cyclist to Vehicle): Bailey Road
Source DF what does
this mean?
Sum of
Squares Mean Square F-Value p-value
Model 1 16.35 16.35 14.71 0.000
Error 125 138.98 1.11
Total 126 155.33
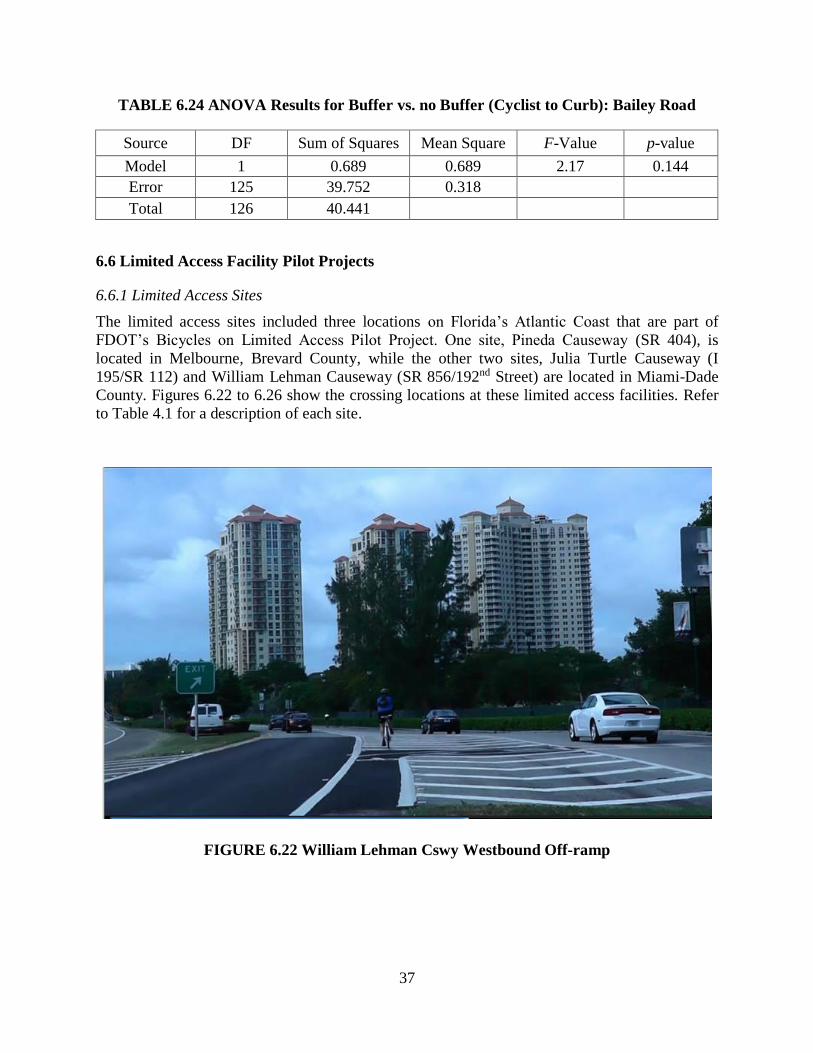
37
TABLE 6.24 ANOVA Results for Buffer vs. no Buffer (Cyclist to Curb): Bailey Road
Source DF Sum of Squares Mean Square F-Value p-value
Model 1 0.689 0.689 2.17 0.144
Error 125 39.752 0.318
Total 126 40.441
6.6 Limited Access Facility Pilot Projects
6.6.1 Limited Access Sites
The limited access sites included three locations on Florida’s Atlantic Coast that are part of
FDOT’s Bicycles on Limited Access Pilot Project. One site, Pineda Causeway (SR 404), is
located in Melbourne, Brevard County, while the other two sites, Julia Turtle Causeway (I
195/SR 112) and William Lehman Causeway (SR 856/192nd Street) are located in Miami-Dade
County. Figures 6.22 to 6.26 show the crossing locations at these limited access facilities. Refer
to Table 4.1 for a description of each site.
FIGURE 6.22 William Lehman Cswy Westbound Off-ramp
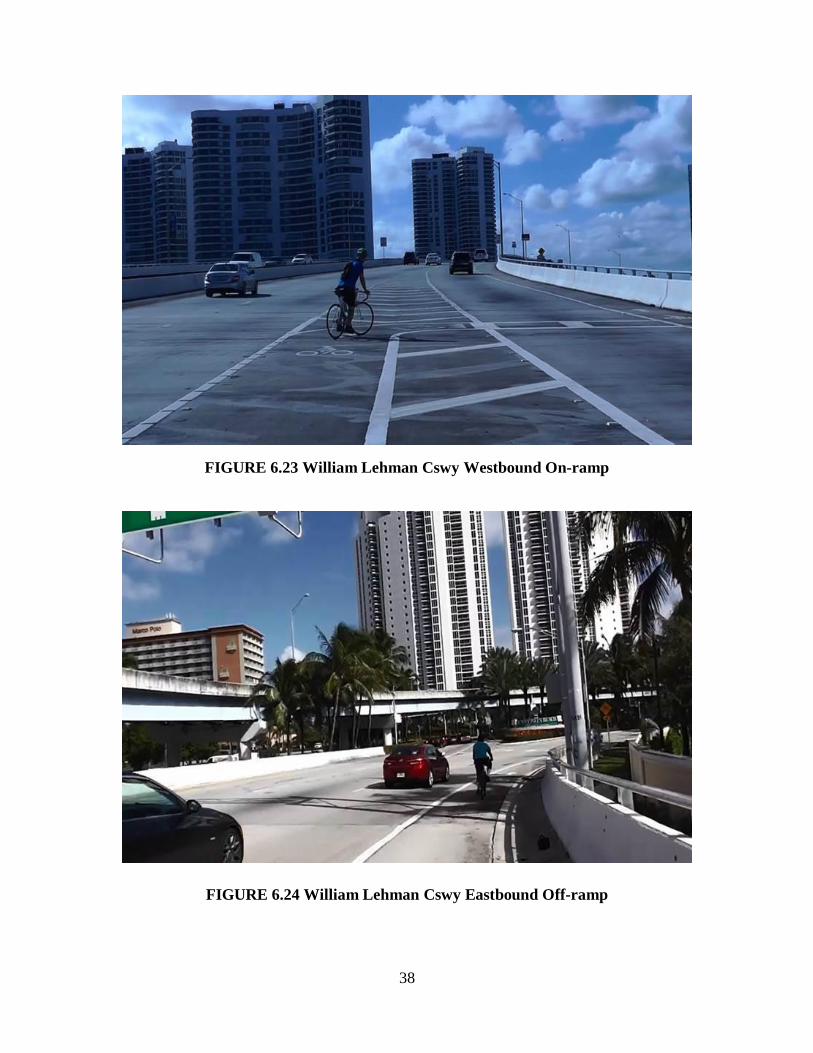
38
FIGURE 6.23 William Lehman Cswy Westbound On-ramp
FIGURE 6.24 William Lehman Cswy Eastbound Off-ramp
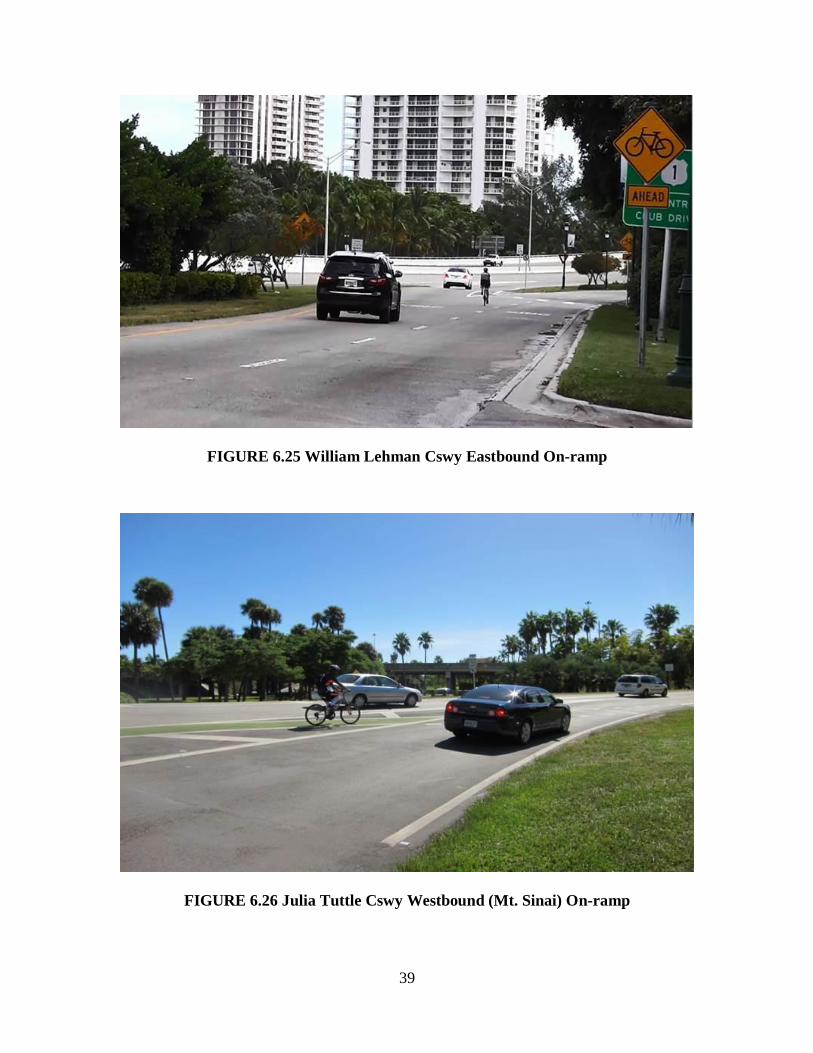
39
FIGURE 6.25 William Lehman Cswy Eastbound On-ramp
FIGURE 6.26 Julia Tuttle Cswy Westbound (Mt. Sinai) On-ramp
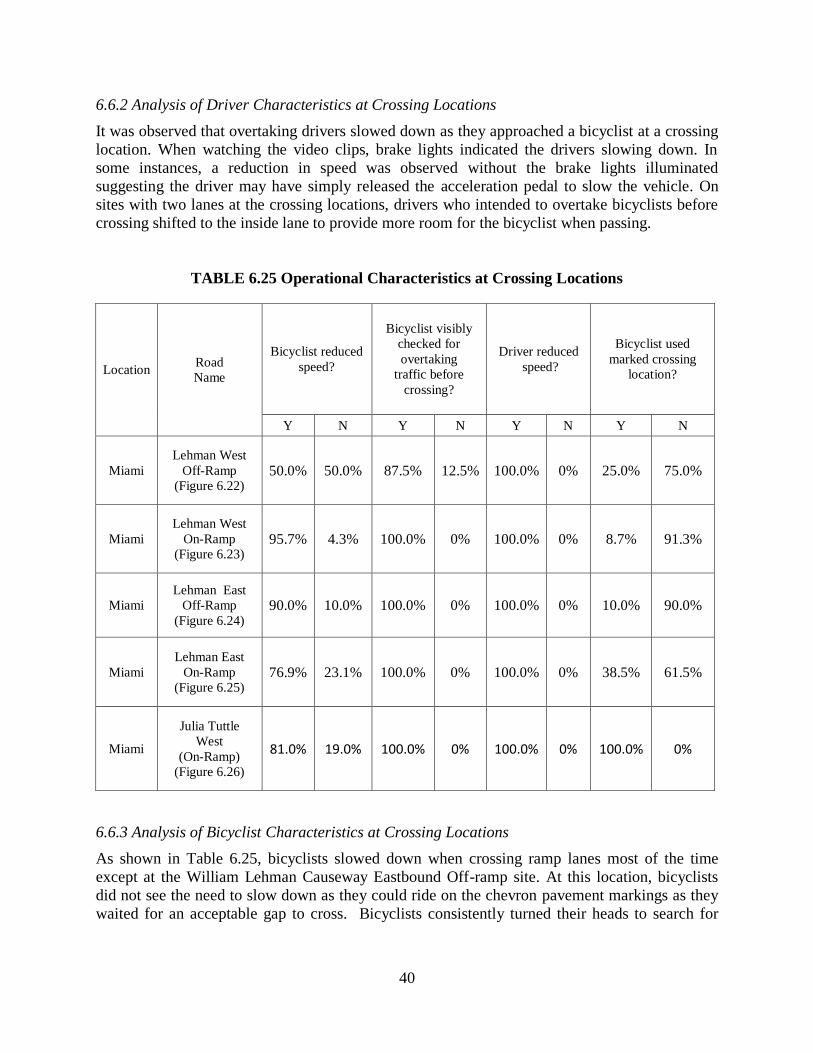
40
6.6.2 Analysis of Driver Characteristics at Crossing Locations
It was observed that overtaking drivers slowed down as they approached a bicyclist at a crossing
location. When watching the video clips, brake lights indicated the drivers slowing down. In
some instances, a reduction in speed was observed without the brake lights illuminated
suggesting the driver may have simply released the acceleration pedal to slow the vehicle. On
sites with two lanes at the crossing locations, drivers who intended to overtake bicyclists before
crossing shifted to the inside lane to provide more room for the bicyclist when passing.
TABLE 6.25 Operational Characteristics at Crossing Locations
6.6.3 Analysis of Bicyclist Characteristics at Crossing Locations
As shown in Table 6.25, bicyclists slowed down when crossing ramp lanes most of the time
except at the William Lehman Causeway Eastbound Off-ramp site. At this location, bicyclists
did not see the need to slow down as they could ride on the chevron pavement markings as they
waited for an acceptable gap to cross. Bicyclists consistently turned their heads to search for
Location Road
Name
Bicyclist reduced
speed?
Bicyclist visibly
checked for
overtaking
traffic before
crossing?
Driver reduced
speed?
Bicyclist used
marked crossing
location?
Y N Y N Y N Y N
Miami
Lehman West
Off-Ramp
(Figure 6.22) 50.0% 50.0% 87.5% 12.5% 100.0% 0% 25.0% 75.0%
Miami
Lehman West
On-Ramp
(Figure 6.23) 95.7% 4.3% 100.0% 0% 100.0% 0% 8.7% 91.3%
Miami
Lehman East
Off-Ramp
(Figure 6.24) 90.0% 10.0% 100.0% 0% 100.0% 0% 10.0% 90.0%
Miami
Lehman East
On-Ramp
(Figure 6.25) 76.9% 23.1% 100.0% 0% 100.0% 0% 38.5% 61.5%
Miami
Julia Tuttle
West
(On-Ramp)
(Figure 6.26)
81.0% 19.0% 100.0% 0% 100.0% 0% 100.0% 0%
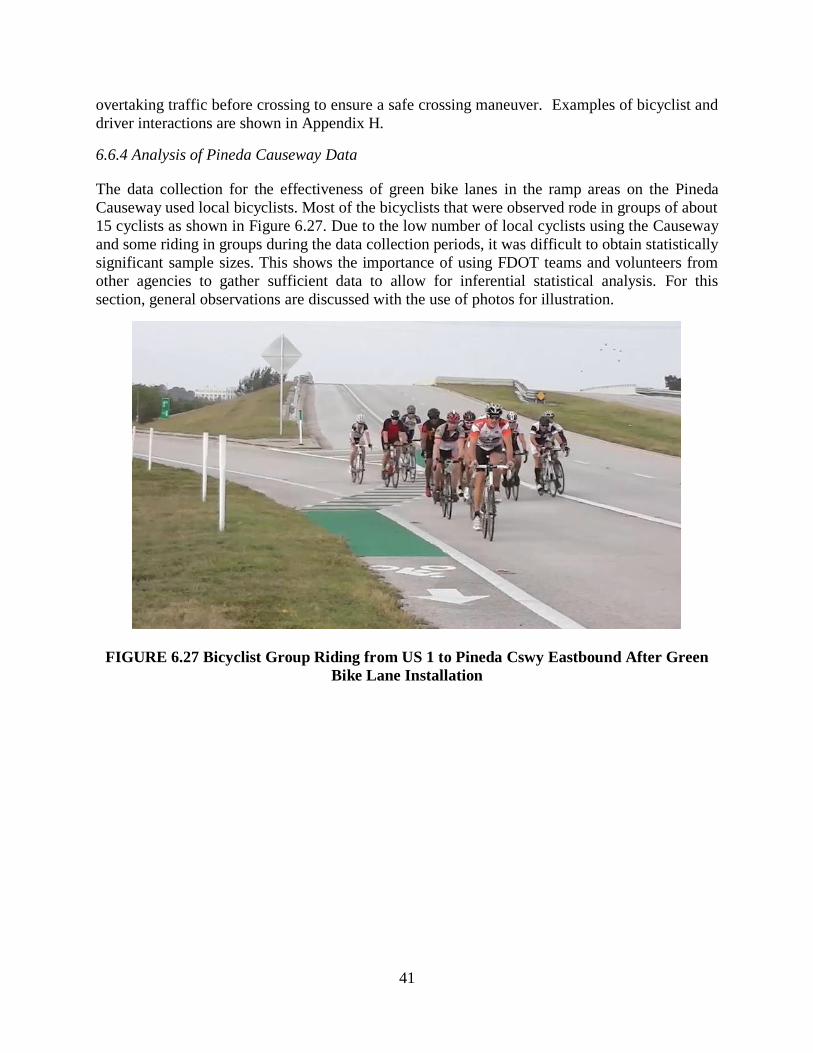
41
overtaking traffic before crossing to ensure a safe crossing maneuver. Examples of bicyclist and
driver interactions are shown in Appendix H.
6.6.4 Analysis of Pineda Causeway Data
The data collection for the effectiveness of green bike lanes in the ramp areas on the Pineda
Causeway used local bicyclists. Most of the bicyclists that were observed rode in groups of about
15 cyclists as shown in Figure 6.27. Due to the low number of local cyclists using the Causeway
and some riding in groups during the data collection periods, it was difficult to obtain statistically
significant sample sizes. This shows the importance of using FDOT teams and volunteers from
other agencies to gather sufficient data to allow for inferential statistical analysis. For this
section, general observations are discussed with the use of photos for illustration.
FIGURE 6.27 Bicyclist Group Riding from US 1 to Pineda Cswy Eastbound After Green
Bike Lane Installation
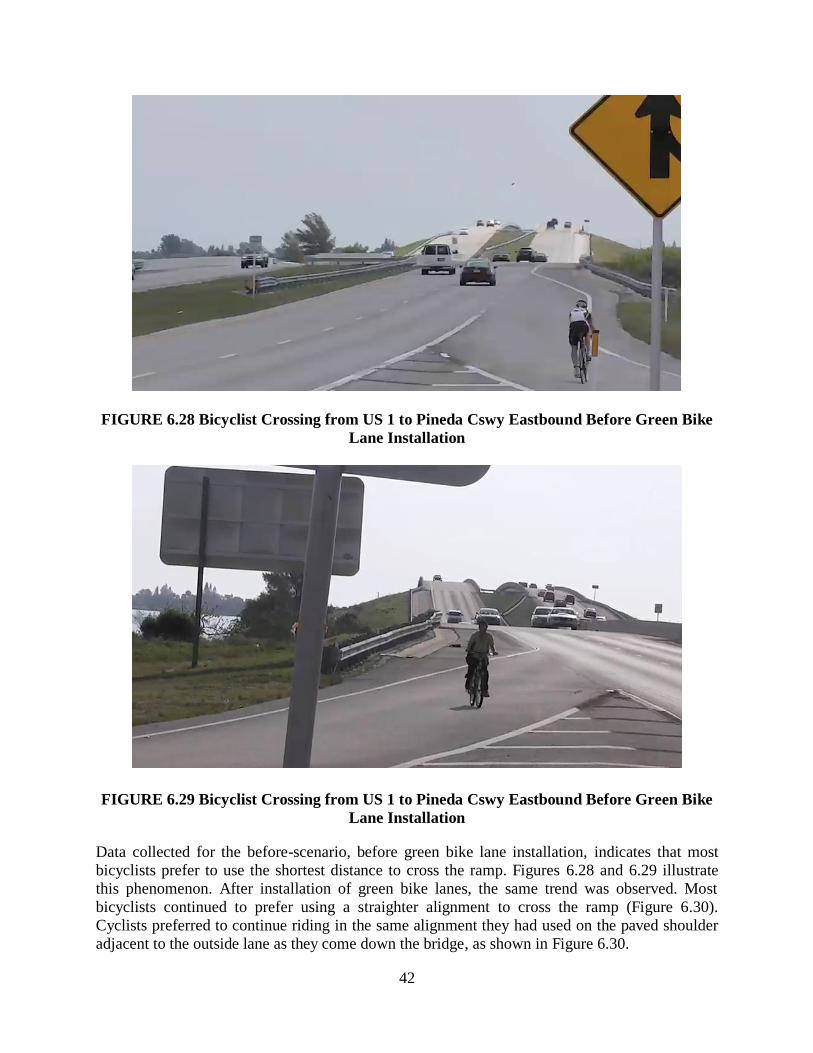
42
FIGURE 6.28 Bicyclist Crossing from US 1 to Pineda Cswy Eastbound Before Green Bike
Lane Installation
FIGURE 6.29 Bicyclist Crossing from US 1 to Pineda Cswy Eastbound Before Green Bike
Lane Installation
Data collected for the before-scenario, before green bike lane installation, indicates that most
bicyclists prefer to use the shortest distance to cross the ramp. Figures 6.28 and 6.29 illustrate
this phenomenon. After installation of green bike lanes, the same trend was observed. Most
bicyclists continued to prefer using a straighter alignment to cross the ramp (Figure 6.30).
Cyclists preferred to continue riding in the same alignment they had used on the paved shoulder
adjacent to the outside lane as they come down the bridge, as shown in Figure 6.30.
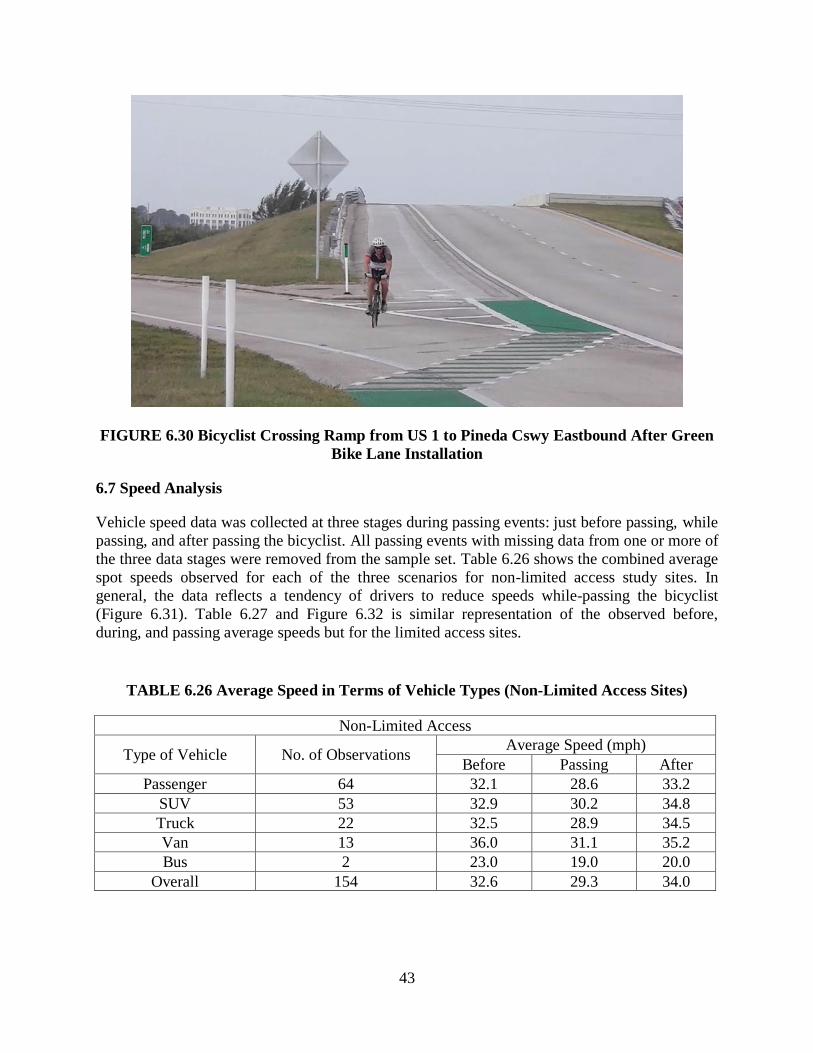
43
FIGURE 6.30 Bicyclist Crossing Ramp from US 1 to Pineda Cswy Eastbound After Green
Bike Lane Installation
6.7 Speed Analysis
Vehicle speed data was collected at three stages during passing events: just before passing, while
passing, and after passing the bicyclist. All passing events with missing data from one or more of
the three data stages were removed from the sample set. Table 6.26 shows the combined average
spot speeds observed for each of the three scenarios for non-limited access study sites. In
general, the data reflects a tendency of drivers to reduce speeds while-passing the bicyclist
(Figure 6.31). Table 6.27 and Figure 6.32 is similar representation of the observed before,
during, and passing average speeds but for the limited access sites.
TABLE 6.26 Average Speed in Terms of Vehicle Types (Non-Limited Access Sites)
Non-Limited Access
Type of Vehicle No. of Observations Average Speed (mph)
Before Passing After
Passenger 64 32.1 28.6 33.2
SUV 53 32.9 30.2 34.8
Truck 22 32.5 28.9 34.5
Van 13 36.0 31.1 35.2
Bus 2 23.0 19.0 20.0
Overall 154 32.6 29.3 34.0
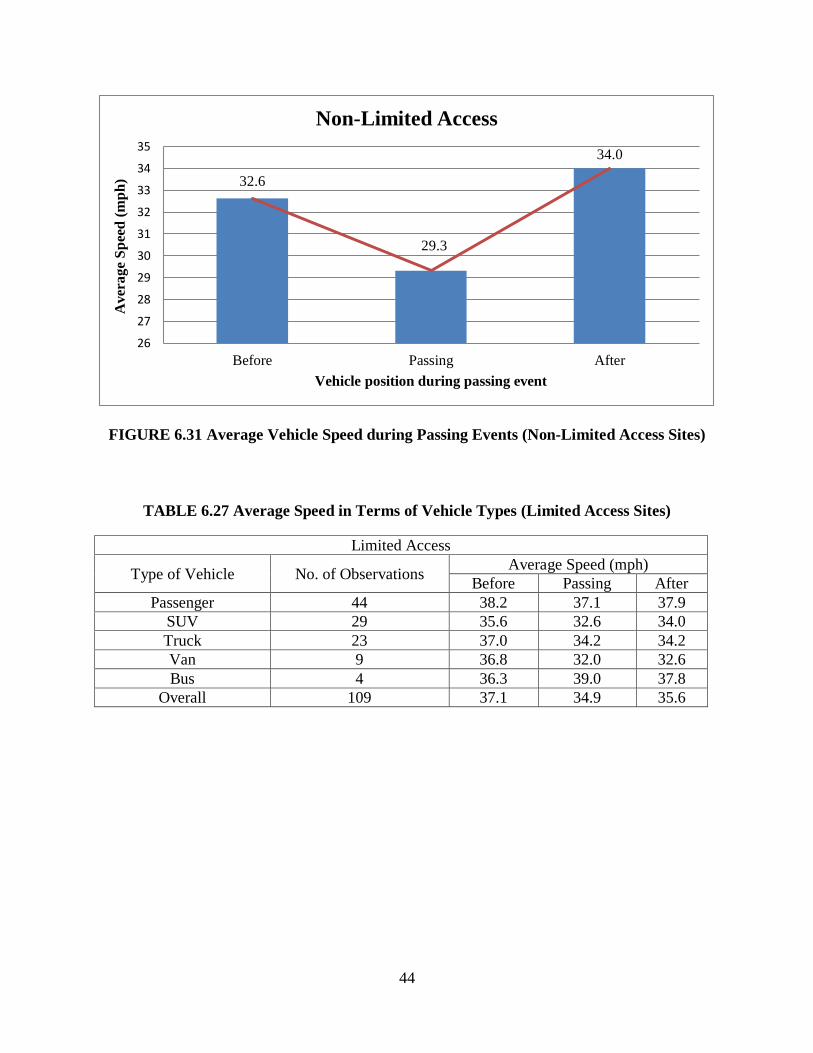
44
FIGURE 6.31 Average Vehicle Speed during Passing Events (Non-Limited Access Sites)
TABLE 6.27 Average Speed in Terms of Vehicle Types (Limited Access Sites)
Limited Access
Type of Vehicle No. of Observations Average Speed (mph)
Before Passing After
Passenger 44 38.2 37.1 37.9
SUV 29 35.6 32.6 34.0
Truck 23 37.0 34.2 34.2
Van 9 36.8 32.0 32.6
Bus 4 36.3 39.0 37.8
Overall 109 37.1 34.9 35.6
32.6
29.3
34.0
26
27
28
29
30
31
32
33
34
35
Before Passing After
Aver
ag
e S
pee
d (
mp
h)
Vehicle position during passing event
Non-Limited Access
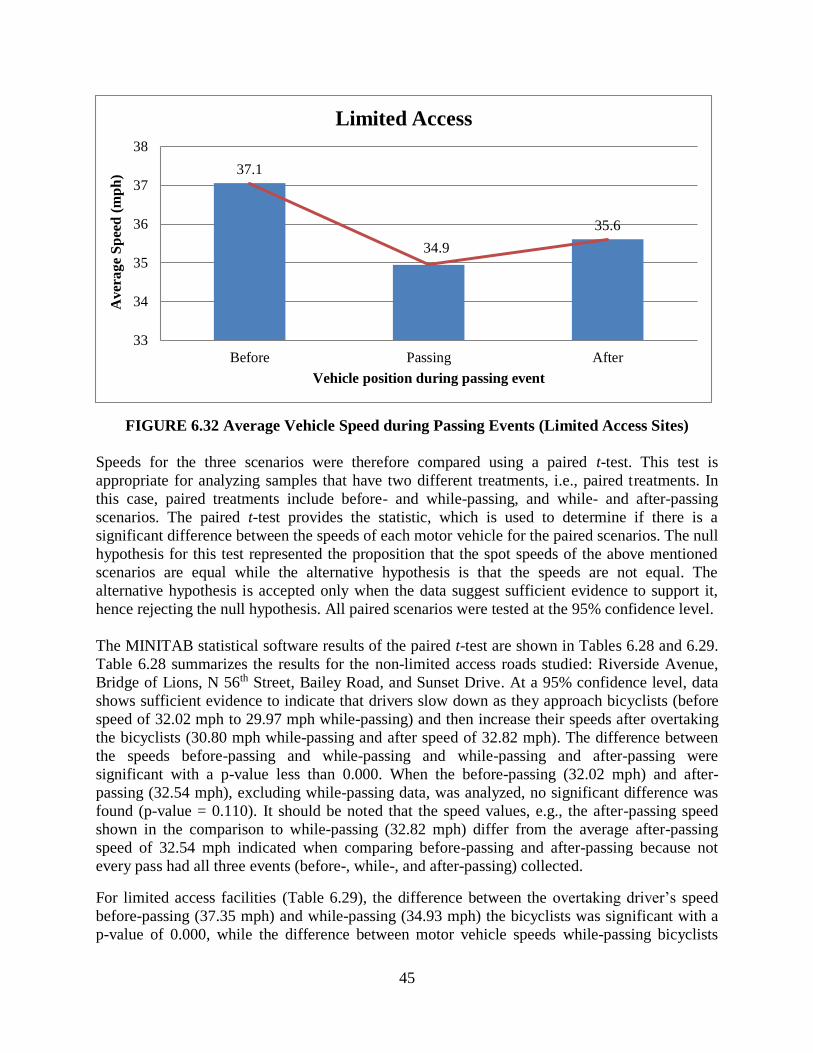
45
FIGURE 6.32 Average Vehicle Speed during Passing Events (Limited Access Sites)
Speeds for the three scenarios were therefore compared using a paired t-test. This test is
appropriate for analyzing samples that have two different treatments, i.e., paired treatments. In
this case, paired treatments include before- and while-passing, and while- and after-passing
scenarios. The paired t-test provides the statistic, which is used to determine if there is a
significant difference between the speeds of each motor vehicle for the paired scenarios. The null
hypothesis for this test represented the proposition that the spot speeds of the above mentioned
scenarios are equal while the alternative hypothesis is that the speeds are not equal. The
alternative hypothesis is accepted only when the data suggest sufficient evidence to support it,
hence rejecting the null hypothesis. All paired scenarios were tested at the 95% confidence level.
The MINITAB statistical software results of the paired t-test are shown in Tables 6.28 and 6.29.
Table 6.28 summarizes the results for the non-limited access roads studied: Riverside Avenue,
Bridge of Lions, N 56th Street, Bailey Road, and Sunset Drive. At a 95% confidence level, data
shows sufficient evidence to indicate that drivers slow down as they approach bicyclists (before
speed of 32.02 mph to 29.97 mph while-passing) and then increase their speeds after overtaking
the bicyclists (30.80 mph while-passing and after speed of 32.82 mph). The difference between
the speeds before-passing and while-passing and while-passing and after-passing were
significant with a p-value less than 0.000. When the before-passing (32.02 mph) and after-
passing (32.54 mph), excluding while-passing data, was analyzed, no significant difference was
found (p-value = 0.110). It should be noted that the speed values, e.g., the after-passing speed
shown in the comparison to while-passing (32.82 mph) differ from the average after-passing
speed of 32.54 mph indicated when comparing before-passing and after-passing because not
every pass had all three events (before-, while-, and after-passing) collected.
For limited access facilities (Table 6.29), the difference between the overtaking driver’s speed
before-passing (37.35 mph) and while-passing (34.93 mph) the bicyclists was significant with a
p-value of 0.000, while the difference between motor vehicle speeds while-passing bicyclists
37.1
34.9
35.6
33
34
35
36
37
38
Before Passing After
Aver
ag
e S
pee
d (
mp
h)
Vehicle position during passing event
Limited Access
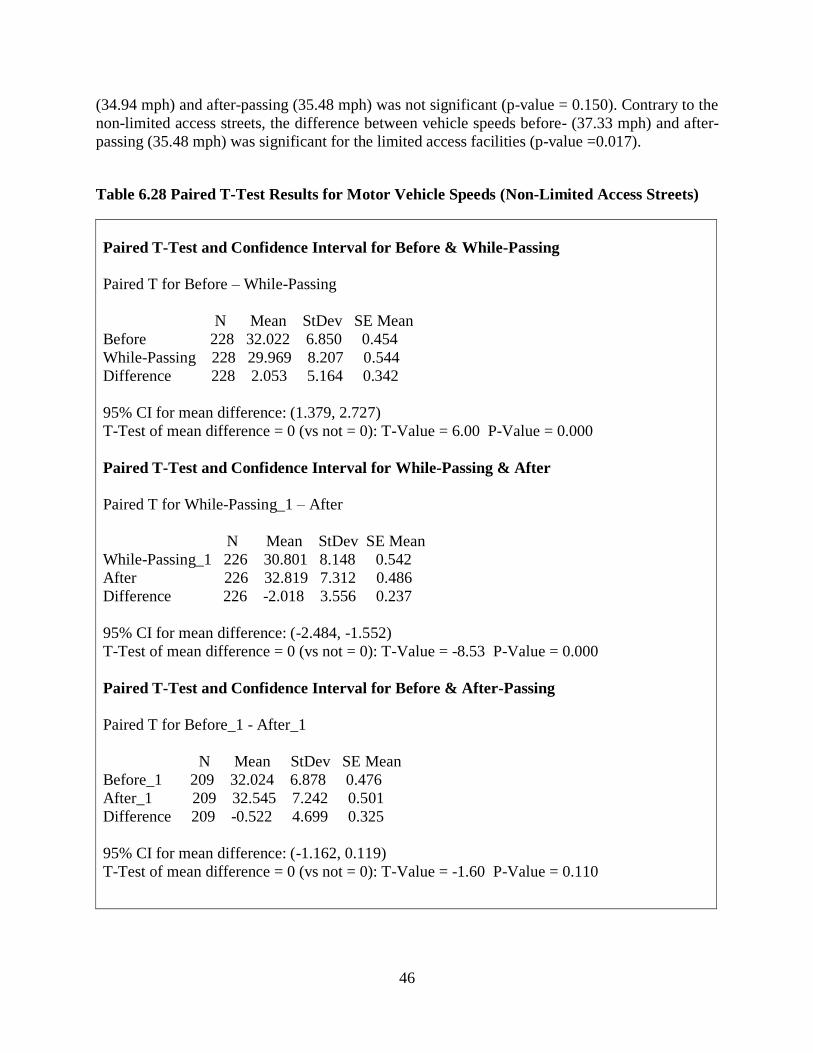
46
(34.94 mph) and after-passing (35.48 mph) was not significant (p-value = 0.150). Contrary to the
non-limited access streets, the difference between vehicle speeds before- (37.33 mph) and after-
passing (35.48 mph) was significant for the limited access facilities (p-value =0.017).
Table 6.28 Paired T-Test Results for Motor Vehicle Speeds (Non-Limited Access Streets)
Paired T-Test and Confidence Interval for Before & While-Passing
Paired T for Before – While-Passing
N Mean StDev SE Mean
Before 228 32.022 6.850 0.454
While-Passing 228 29.969 8.207 0.544
Difference 228 2.053 5.164 0.342
95% CI for mean difference: (1.379, 2.727)
T-Test of mean difference = 0 (vs not = 0): T-Value = 6.00 P-Value = 0.000
Paired T-Test and Confidence Interval for While-Passing & After
Paired T for While-Passing_1 – After
N Mean StDev SE Mean
While-Passing_1 226 30.801 8.148 0.542
After 226 32.819 7.312 0.486
Difference 226 -2.018 3.556 0.237
95% CI for mean difference: (-2.484, -1.552)
T-Test of mean difference = 0 (vs not = 0): T-Value = -8.53 P-Value = 0.000
Paired T-Test and Confidence Interval for Before & After-Passing
Paired T for Before_1 - After_1
N Mean StDev SE Mean
Before_1 209 32.024 6.878 0.476
After_1 209 32.545 7.242 0.501
Difference 209 -0.522 4.699 0.325
95% CI for mean difference: (-1.162, 0.119)
T-Test of mean difference = 0 (vs not = 0): T-Value = -1.60 P-Value = 0.110
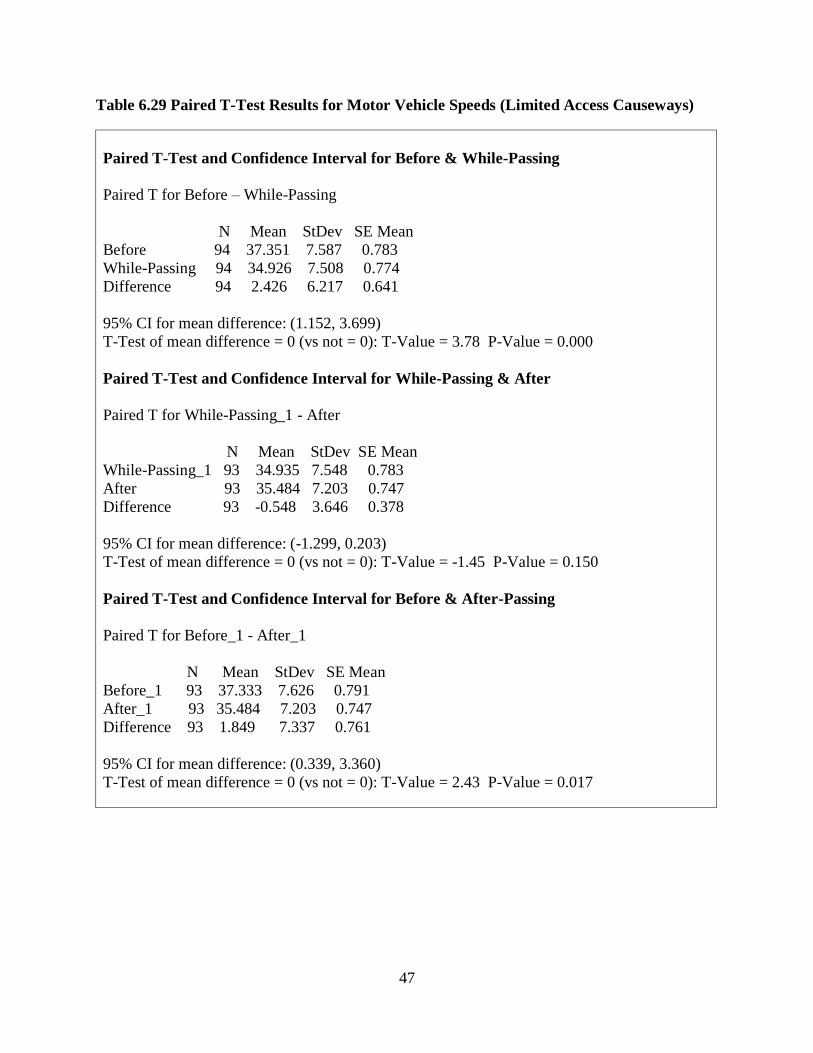
47
Table 6.29 Paired T-Test Results for Motor Vehicle Speeds (Limited Access Causeways)
Paired T-Test and Confidence Interval for Before & While-Passing
Paired T for Before – While-Passing
N Mean StDev SE Mean
Before 94 37.351 7.587 0.783
While-Passing 94 34.926 7.508 0.774
Difference 94 2.426 6.217 0.641
95% CI for mean difference: (1.152, 3.699)
T-Test of mean difference = 0 (vs not = 0): T-Value = 3.78 P-Value = 0.000
Paired T-Test and Confidence Interval for While-Passing & After
Paired T for While-Passing_1 - After
N Mean StDev SE Mean
While-Passing_1 93 34.935 7.548 0.783
After 93 35.484 7.203 0.747
Difference 93 -0.548 3.646 0.378
95% CI for mean difference: (-1.299, 0.203)
T-Test of mean difference = 0 (vs not = 0): T-Value = -1.45 P-Value = 0.150
Paired T-Test and Confidence Interval for Before & After-Passing
Paired T for Before_1 - After_1
N Mean StDev SE Mean
Before_1 93 37.333 7.626 0.791
After_1 93 35.484 7.203 0.747
Difference 93 1.849 7.337 0.761
95% CI for mean difference: (0.339, 3.360)
T-Test of mean difference = 0 (vs not = 0): T-Value = 2.43 P-Value = 0.017
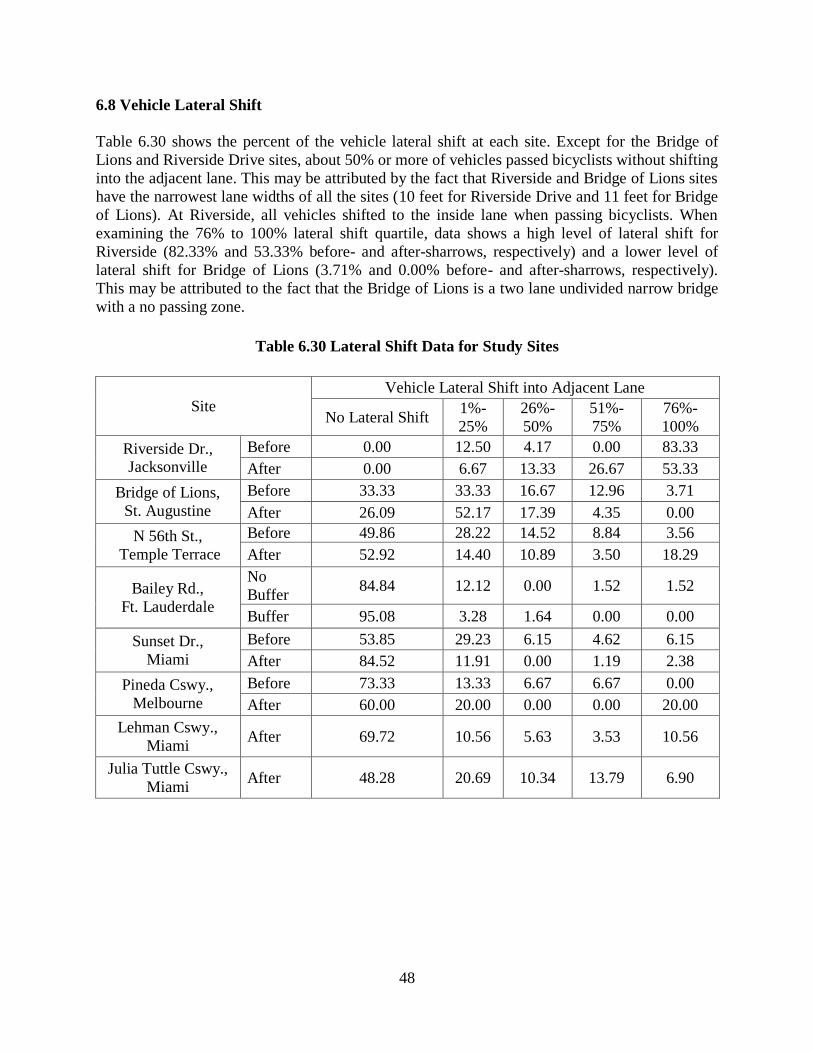
48
6.8 Vehicle Lateral Shift
Table 6.30 shows the percent of the vehicle lateral shift at each site. Except for the Bridge of
Lions and Riverside Drive sites, about 50% or more of vehicles passed bicyclists without shifting
into the adjacent lane. This may be attributed by the fact that Riverside and Bridge of Lions sites
have the narrowest lane widths of all the sites (10 feet for Riverside Drive and 11 feet for Bridge
of Lions). At Riverside, all vehicles shifted to the inside lane when passing bicyclists. When
examining the 76% to 100% lateral shift quartile, data shows a high level of lateral shift for
Riverside (82.33% and 53.33% before- and after-sharrows, respectively) and a lower level of
lateral shift for Bridge of Lions (3.71% and 0.00% before- and after-sharrows, respectively).
This may be attributed to the fact that the Bridge of Lions is a two lane undivided narrow bridge
with a no passing zone.
Table 6.30 Lateral Shift Data for Study Sites
Site
Vehicle Lateral Shift into Adjacent Lane
No Lateral Shift 1%-
25%
26%-
50%
51%-
75%
76%-
100%
Riverside Dr., Jacksonville
Before 0.00 12.50 4.17 0.00 83.33
After 0.00 6.67 13.33 26.67 53.33
Bridge of Lions,
St. Augustine
Before 33.33 33.33 16.67 12.96 3.71
After 26.09 52.17 17.39 4.35 0.00
N 56th St.,
Temple Terrace
Before 49.86 28.22 14.52 8.84 3.56
After 52.92 14.40 10.89 3.50 18.29
Bailey Rd.,
Ft. Lauderdale
No
Buffer 84.84 12.12 0.00 1.52 1.52
Buffer 95.08 3.28 1.64 0.00 0.00
Sunset Dr.,
Miami
Before 53.85 29.23 6.15 4.62 6.15
After 84.52 11.91 0.00 1.19 2.38
Pineda Cswy.,
Melbourne
Before 73.33 13.33 6.67 6.67 0.00
After 60.00 20.00 0.00 0.00 20.00
Lehman Cswy.,
Miami After 69.72 10.56 5.63 3.53 10.56
Julia Tuttle Cswy.,
Miami After 48.28 20.69 10.34 13.79 6.90
49
7 CONCLUSIONS
This study was conducted to examine the influence of several bicycle facilities on the interaction
between motor vehicles and bicyclists. The effectiveness of sharrows, bike lanes, buffers, wide
curb lanes, and bicycle crossing pavement markings, were evaluated, including green bike
crossings on limited access facilities. Several measures of effectiveness were investigated,
including the lateral separation between motor vehicles and bicyclists, the distance from the
bicycle tire to the curb, and motor vehicle speeds before-passing, while-passing, and after-
passing a bicyclist. The following sections discuss the results produced from this study.
7.1 Lateral Spacing between Vehicles and Bicyclists
The lateral separation between motor vehicles and bicyclists was greater with sharrows
compared to without sharrows for all three sites that were evaluated for shared lane markings.
For the two sites with narrow outside lanes (Bridge of Lions and Riverside Drive), the lateral
separation improved, with the greatest increase at Riverside Drive from an average of 5.18 feet
before sharrows to 5.85 feet after sharrows were installed. Increased lateral separation of 2.55
feet also was observed at Site A in Temple Terrace (North 56th Street) after sharrows were
installed with an average separation of 3.96 feet and 6.51 feet observed before- and after-
sharrows were installed, respectively.
This study also compared operational characteristics between sharrows and bike lanes at North
56th Street (Site B) in Temple Terrace. The separation between motor vehicles and bicyclists in
the bike lane segment was of 6.15 feet, compared to the 6.51 feet for the sharrows section. The
range of lateral spacing varied from 1.42 feet to 14.30 feet for the sharrows segment, while bike
lanes had a narrower range of 3.06 feet to 13.13 feet. Site observations indicated that there were
less shifting to the inside lane at the bike lane site compared to the sharrows site. The difference
in lateral separation between the sharrows section and the bike lane segment was not significant
(p-value = 0.216).
At the Sunset Drive site in Miami, where the effect of a wide curb lane was examined, lateral
vehicle to cyclist separation of 5.11 feet was observed after retrofitting compared to the
separation of 4.25 feet before widening the roadway and restriping the lanes to include a wide
curb lane, a significant increase (p-value = 0.001).
The influence of a buffer between the vehicle travel lane and bike lane was also evaluated at the
Bailey Road site in Broward County. On average, a lateral separation of 5.00 feet was observed
for the section without a buffer zone, while the lateral separation between bicyclist and vehicles
for the section with a striped buffer was 5.72 feet, a difference of nearly three quarters of a foot.
In general, there was improvement in the amount of lateral spacing drivers provided to bicyclists
at all of the study sites. The analyses of variance showed that the difference was significant.
7.2 Lateral Spacing between Bicyclists and Curb
While consistent results were obtained for lateral spacing between vehicles and bicycles, mixed
results were observed for lateral spacing between bicyclists and the curb or edge of pavement.
Distances observed for the Riverside and Bridge of Lions sites showed increases of 1.38 feet and
50
1.50 feet, respectively, while the spacing at North 56th Street (Site A) in Temple Terrace
improved from 1.92 feet to 2.32 feet. The lateral spacing between bicyclists and the edge of
pavement on the bike lane section on North 56th Street (Site B) was observed to be greater (2.51
feet) than observed at the sharrows segment (2.23 feet) and the difference was statistically
significant, indicated by a p-value of 0.02. The results suggested no significant difference in the
way bicyclists ride relative to the curb after reconstructing Sunset Drive to a wide curb lane, and
when comparing a no-buffer to buffer zone at the Bailey Road site in Fort Lauderdale.
7.3 Limited Access Crossing
It was observed that overtaking drivers regularly reduced speeds when approaching a bicyclist at
a crossing location. Simultaneously, bicyclists typically slowed down when passing a motorist at
a crossing location except at the eastbound off-ramp study site on William Lehman Causeway.
At this location, bicyclists did not see the need to slow down as they could ride across the striped
chevron pavement markings alongside the ramp lane until an acceptable crossing gap was
presented. It is interesting to note that bicyclists consistently turned their heads to watch for
approaching traffic before crossing to ensure a safe crossing maneuver.
7.4 Speed Analysis
Vehicle speeds were analyzed separately for limited access and non-limited access facilities.
Data indicates that drivers slow down as they pass bicyclists on non-limited access roadways
(before speed of 32.02 mph to 29.97 mph while-passing) and then increase their speeds after
overtaking the bicyclists (30.80 mph while-passing to 32.82 mph after-passing). The difference
between the speeds before-passing and while-passing, and while-passing and after-passing, were
both significant with p-values less than 0.000. However, when the before-passing (32.02 mph)
and after-passing (32.54 mph), excluding while-passing speeds, were analyzed, no significant
difference was found (p-value = 0.110).
For limited access facilities, the difference between the overtaking driver’s speed before-passing
(37.35 mph) and while-passing (34.93 mph) the bicyclists was significant with a p-value of
0.000. However, the difference between motor vehicle speeds while-passing bicyclists (34.94
mph) and after-passing (35.48 mph) was not significant (p-value = 0.150). Contrary to the non-
limited access streets, the difference between vehicle speeds before- (37.33 mph) and after-
passing (35.48 mph) was significant for the limited access facilities (p-value =0.017).
51
REFERENCES
1. Pein, W.E., Hunter, W.W., and Stewart, J.R. Evaluation of the Shared-Use Arrow,
Florida Department of Transportation, Tallahassee, Florida, 1999.
2. Alta Planning + Design. San Francisco’s Shared Lane Pavement Markings: Improving
Bicycle Safety. San Francisco Department of Parking and Traffic, San Francisco,
California, 2004.
3. CALTRANS. California Manual on Uniform Traffic Control Devices, Sacramento, CA,
2003.
4. Jacobson, M., Skene, M., Davidson, G. and Rawsthorne, D. An Overview of Shared Use
Lane Pavement Markings for Cyclists, Annual Conference of the Transportation
Association of Canada, Vancouver, British Columbia, 2009.
5. Brady, J., Loskorn, J., Mills, A., Duthie, J., and Machemehl, R. Operational and Safety
Implications of Three Experimental Bicycle safety Devices in Austin, TX. Paper presented
at 90th Annual Meeting of the Transportation Board, Washington, DC, 2011.
6. Hunter, W.W., Thomas, L., Srinivasan, R. and Martell, C.A. Evaluation of Shared Lane
Markings. Federal Highway Administration Final Report HRT-10-041, Washington, DC:
Federal Highway Administration. 2010.
7. Harkey, D.L. and Stewart, J.R. “Evaluation of Shared-Use Facilities for Bicycles and
Motor Vehicles,” In Transportation Research Record: Journal of the Transportation
Research Board, No. 1578, Transportation Research Board of the National Academies,
Washington, DC, 1997, pp. 111-118.
8. McHenry, S.R. and Wallace, M.J. Evaluation of Wide Curb Lanes as Shared Lane
Bicycle Facilities, Maryland State Highway Administration, Baltimore, Maryland, 1985.
9. Hunter, W.W., Feaganes, J.R., and Srinivasan, R. “Conversions of Wide Curb Lanes: The
Effect on Bicycle and Motor Vehicle Interactions,” In Transportation Research Record:
Journal of the Transportation Research Board, No. 1939, Transportation Research Board
of the National Academies, Washington, DC, 2005, pp. 37-44.
10. Van Houten, R. and C. Seiderman. “How Pavement Markings Influence Bicycle and
Motor Vehicle Positioning: Case Study in Cambridge, Massachusetts,” In Transportation
Research Record: Journal of the Transportation Research Board, No. 1939,
Transportation Research Board of the National Academies, Washington, DC, 2005, pp. 3-
14, 2005.
11. Furth, P. Dulaski, D., Buessing, M., and Tavakolian, P. “Parking Lane Width and Bicycle
Operating Space,” In In Transportation Research Record: Journal of the Transportation
Research Board, No. 2190, Transportation Research Board of the National Academies,
Washington, DC, 2010, pp. 45-50.
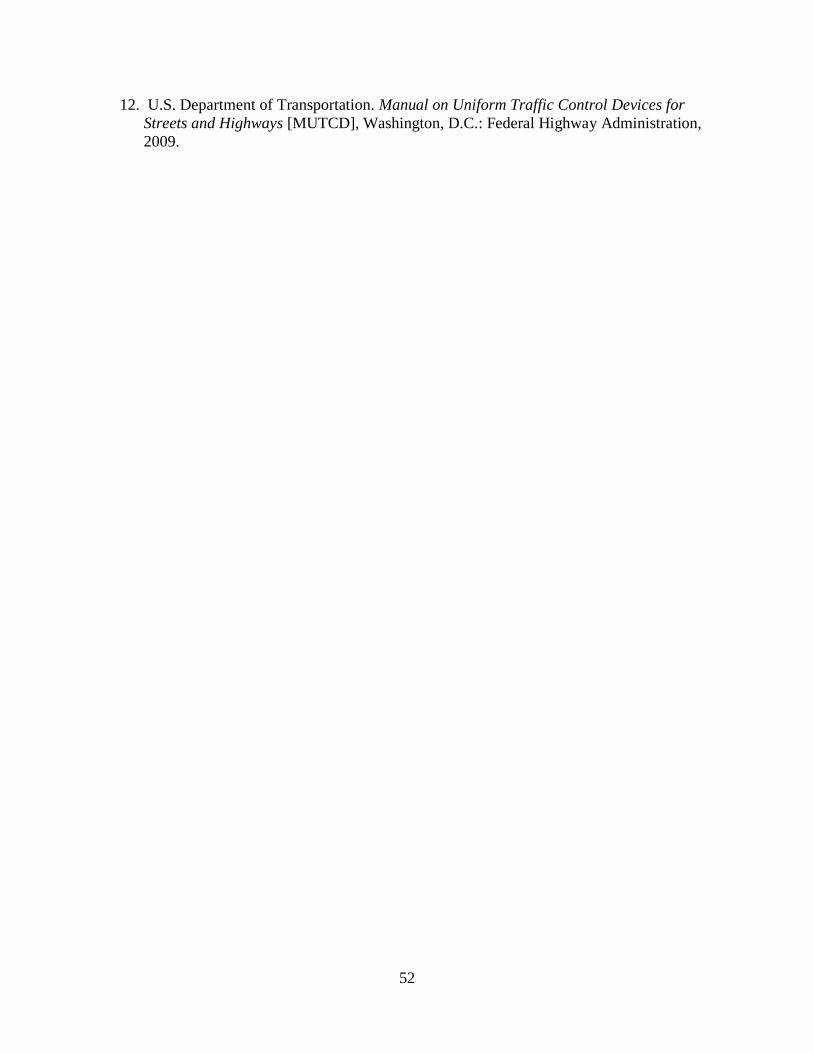
52
12. U.S. Department of Transportation. Manual on Uniform Traffic Control Devices for
Streets and Highways [MUTCD], Washington, D.C.: Federal Highway Administration,
2009.

53
APPENDIX A
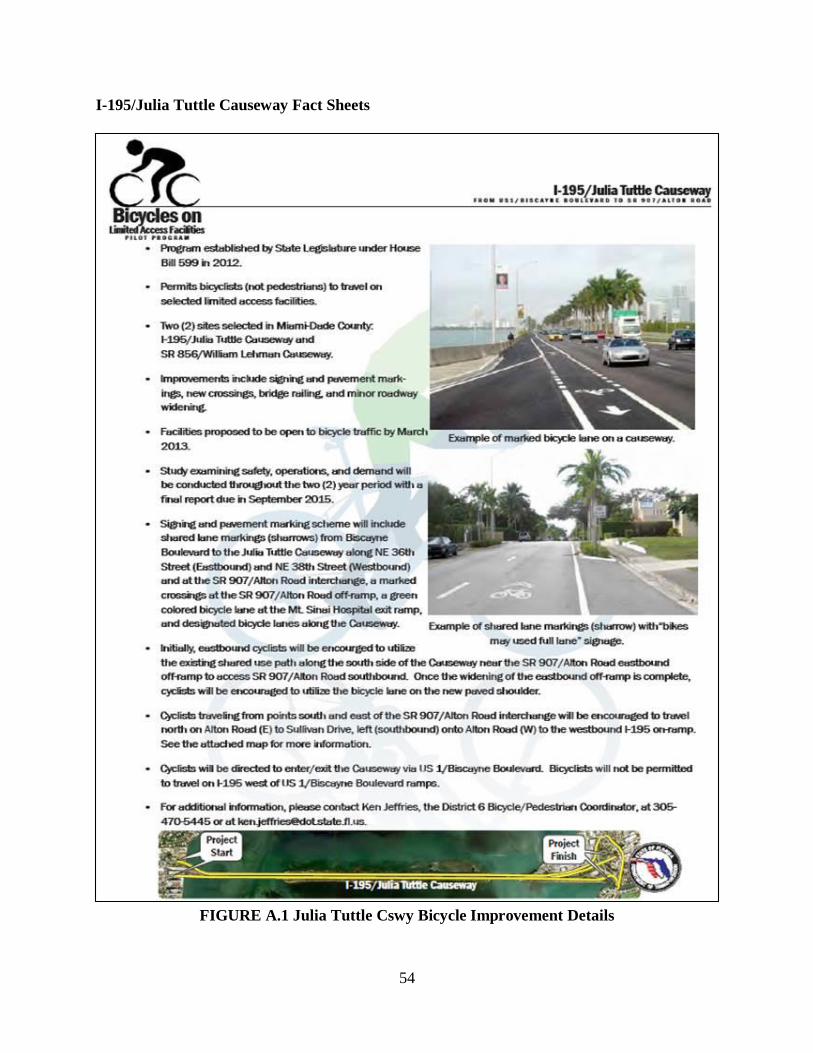
54
I-195/Julia Tuttle Causeway Fact Sheets
FIGURE A.1 Julia Tuttle Cswy Bicycle Improvement Details
55
FIGURE A.2 Julia Tuttle Cswy Bicycle Improvement Plan

56
APPENDIX B
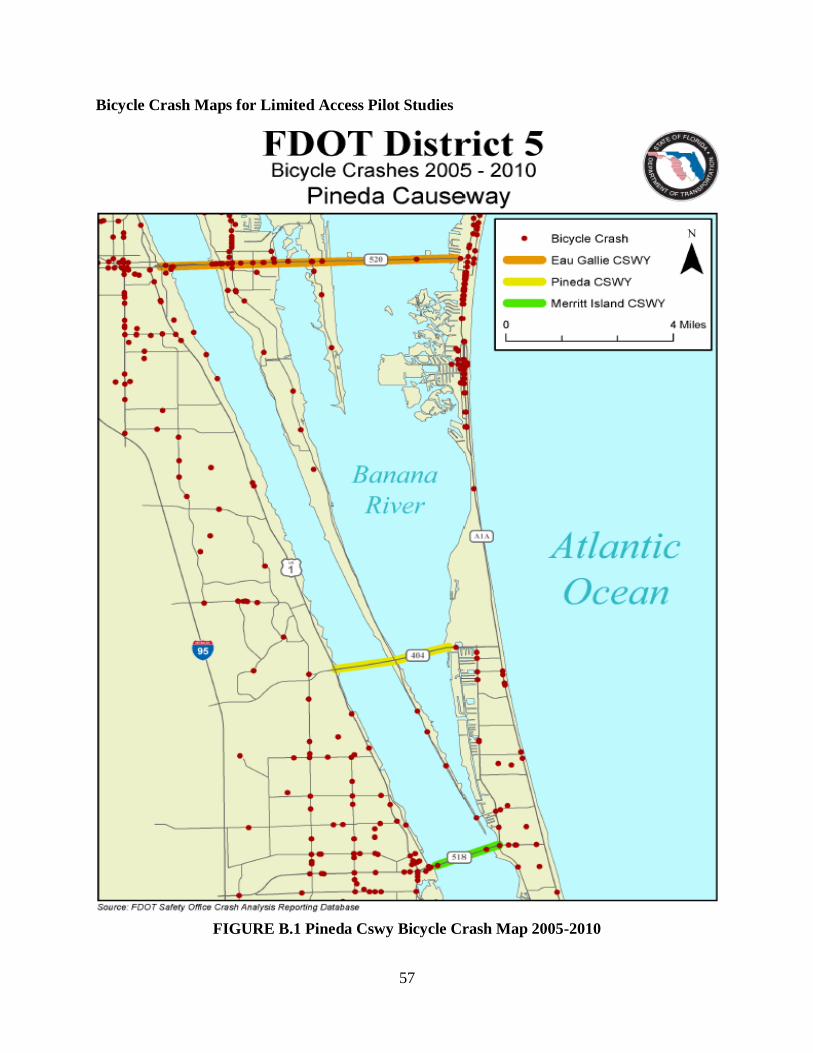
57
Bicycle Crash Maps for Limited Access Pilot Studies
FIGURE B.1 Pineda Cswy Bicycle Crash Map 2005-2010
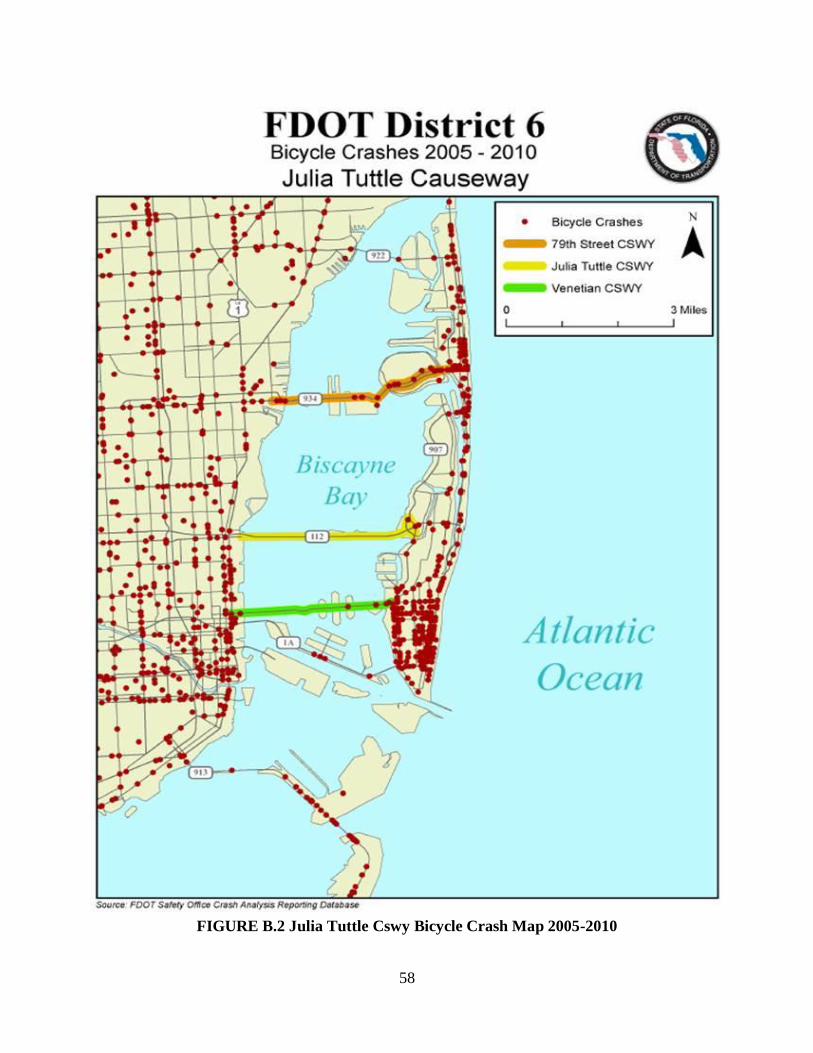
58
FIGURE B.2 Julia Tuttle Cswy Bicycle Crash Map 2005-2010
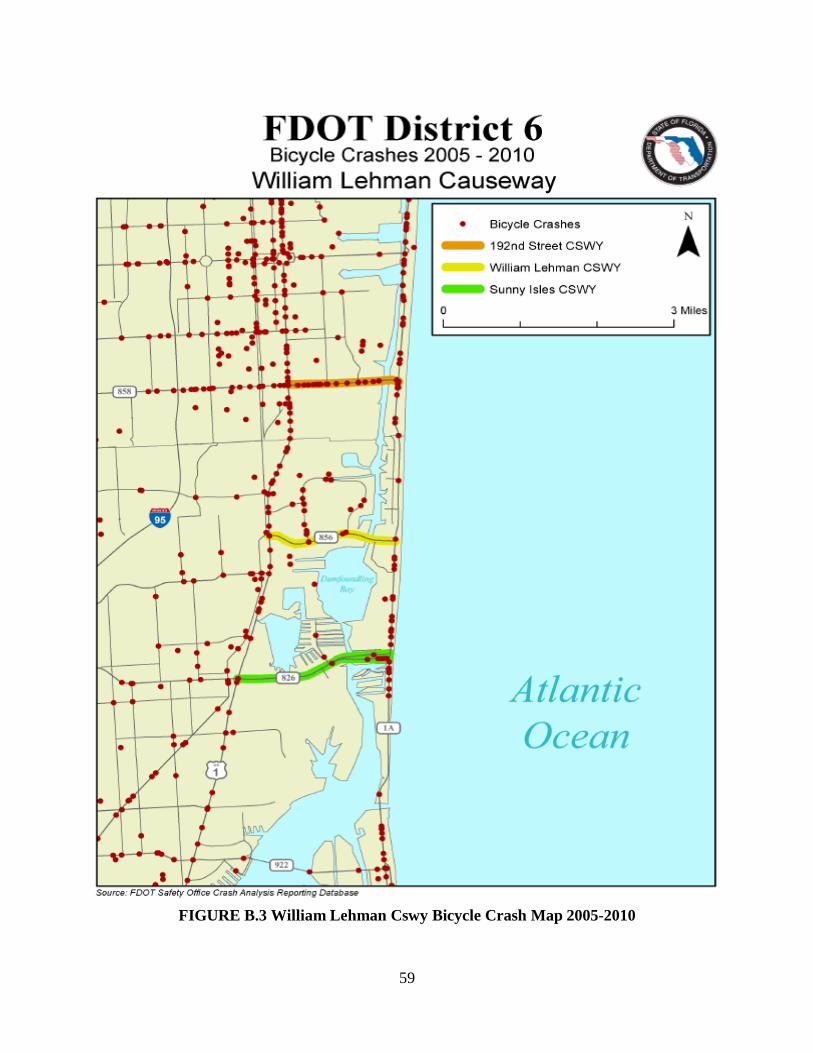
59
FIGURE B.3 William Lehman Cswy Bicycle Crash Map 2005-2010

60
APPENDIX C
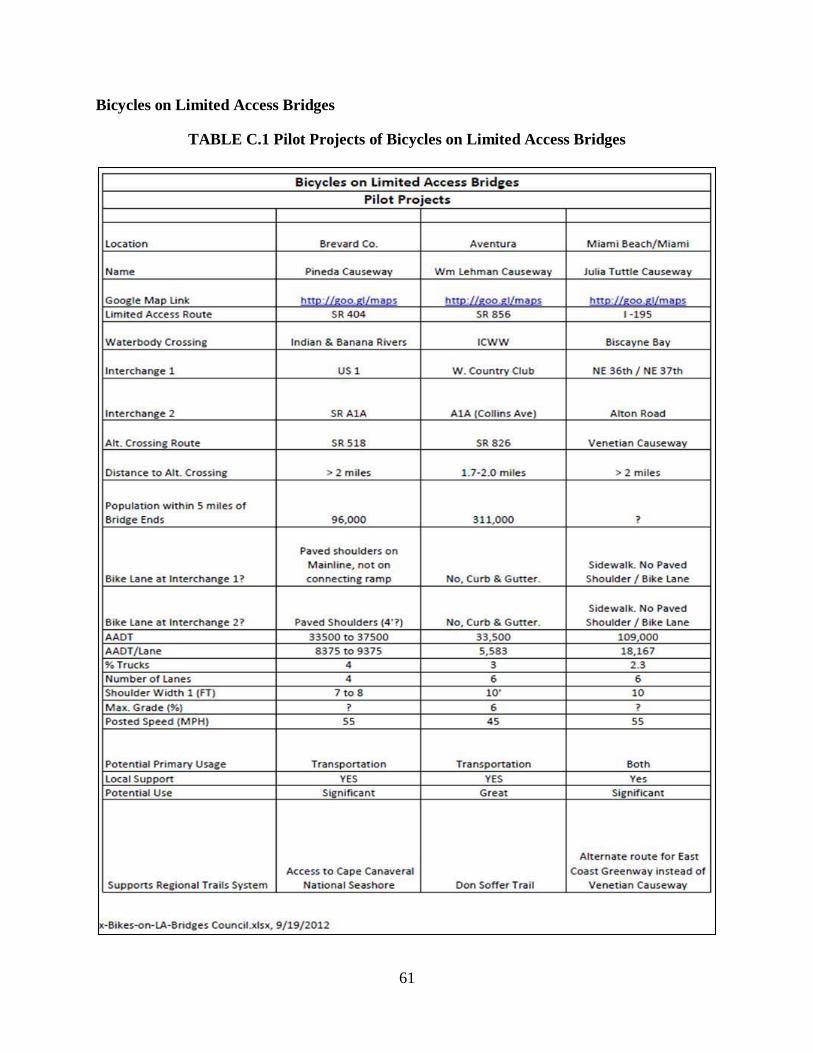
61
Bicycles on Limited Access Bridges
TABLE C.1 Pilot Projects of Bicycles on Limited Access Bridges

62
APPENDIX D
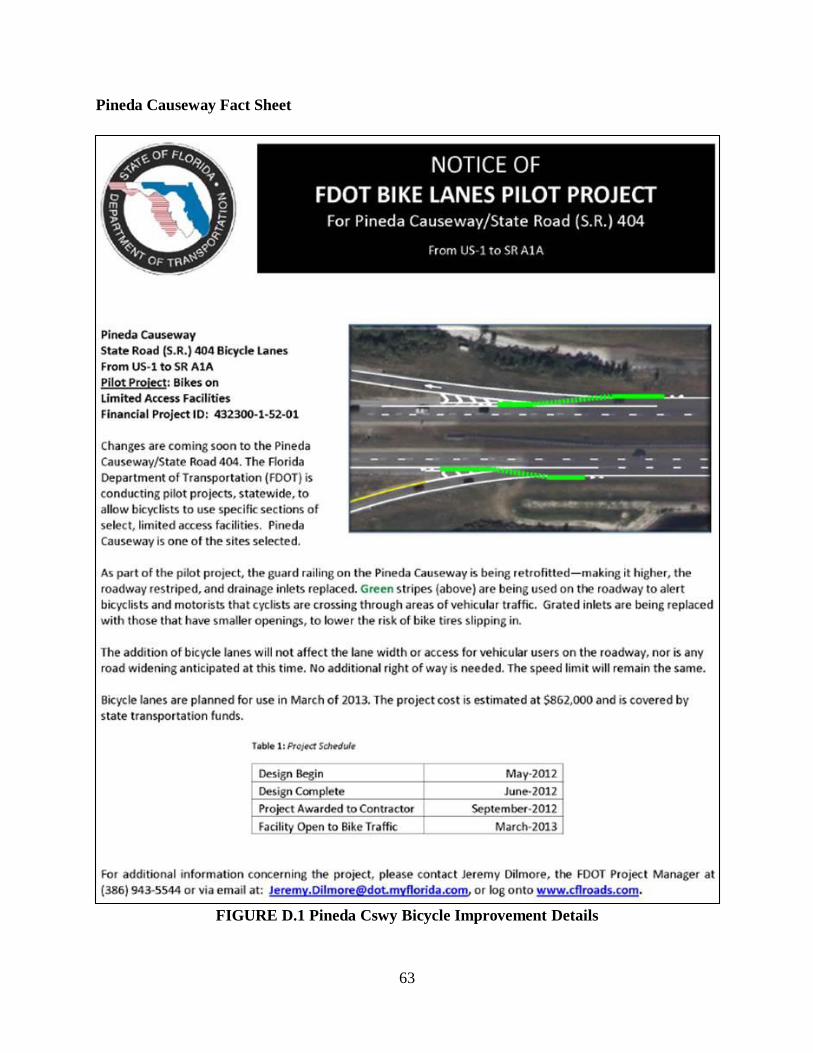
63
Pineda Causeway Fact Sheet
FIGURE D.1 Pineda Cswy Bicycle Improvement Details

64
APPENDIX E
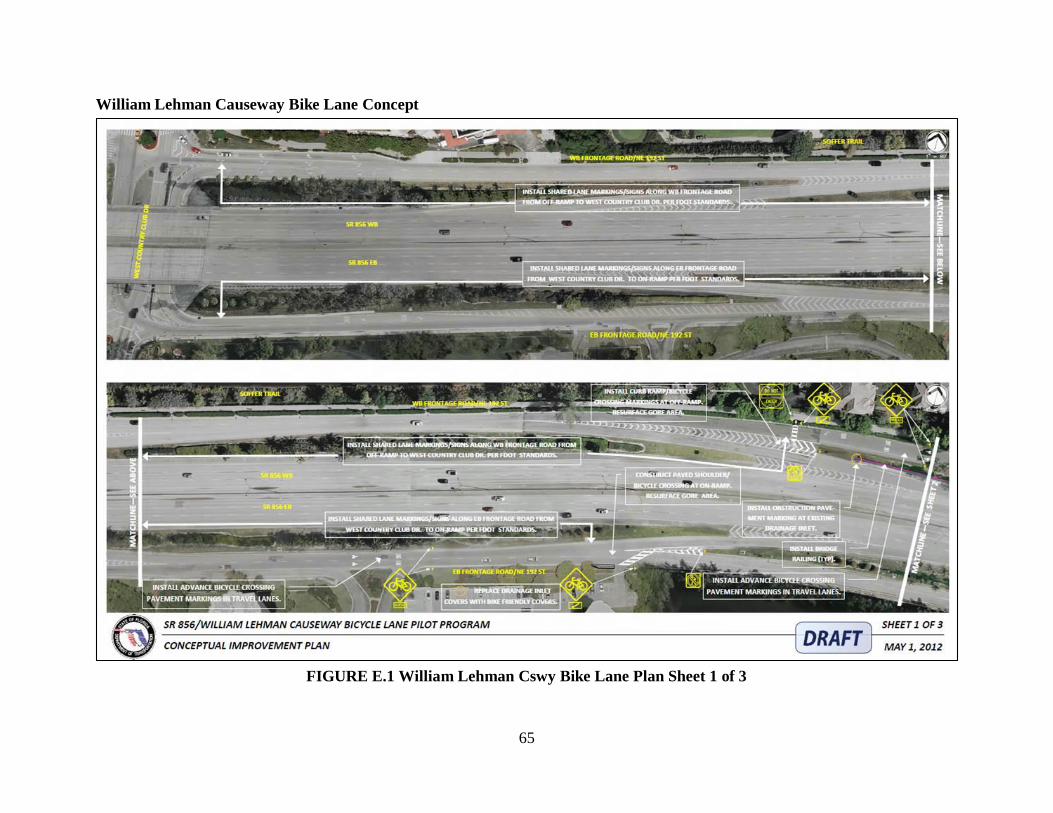
65
William Lehman Causeway Bike Lane Concept
FIGURE E.1 William Lehman Cswy Bike Lane Plan Sheet 1 of 3
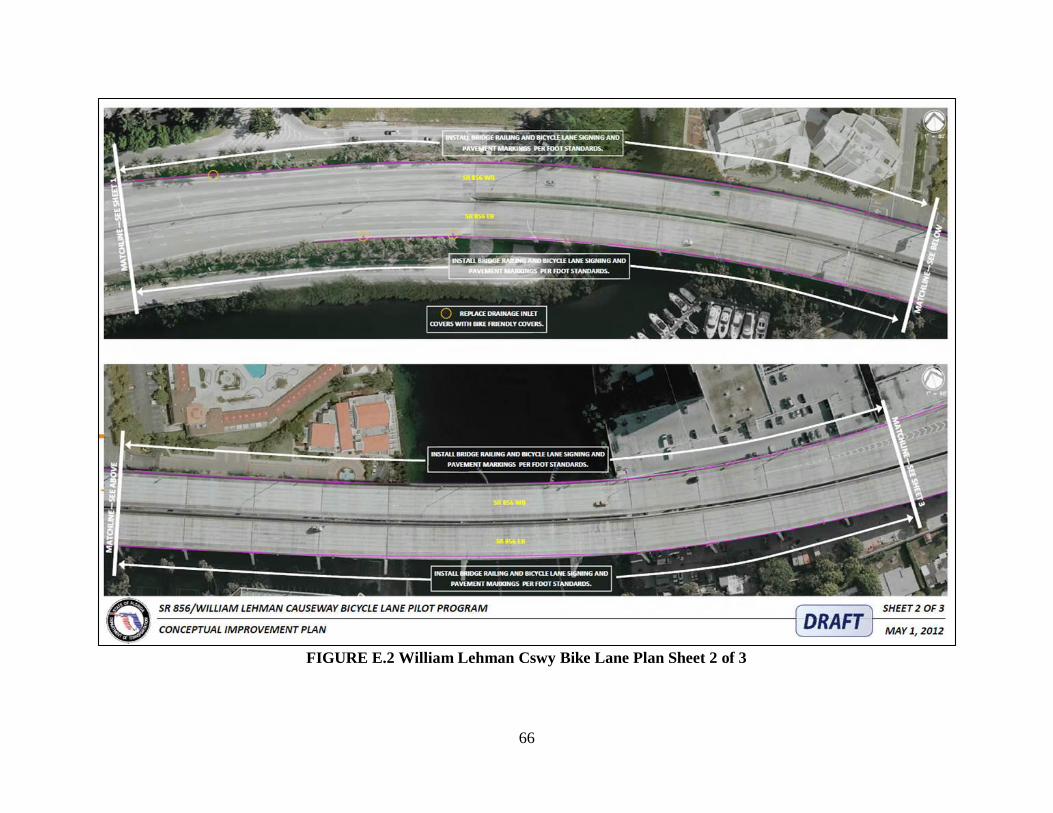
66
FIGURE E.2 William Lehman Cswy Bike Lane Plan Sheet 2 of 3
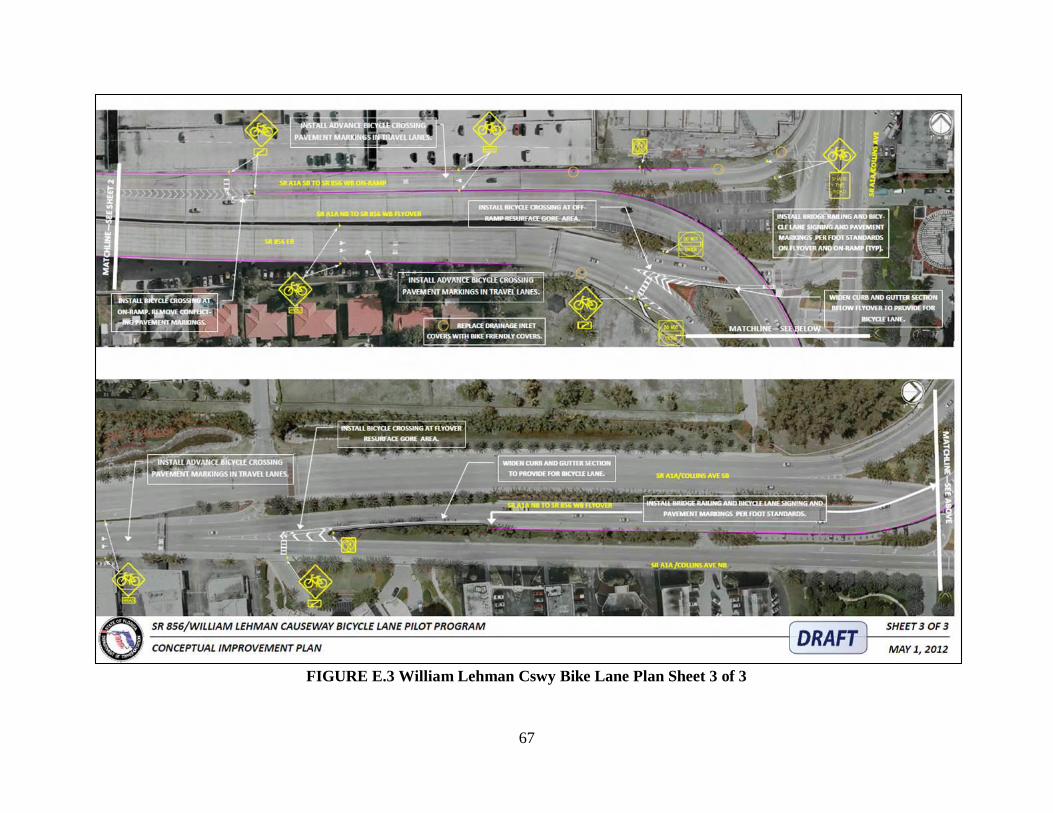
67
FIGURE E.3 William Lehman Cswy Bike Lane Plan Sheet 3 of 3

68
APPENDIX F
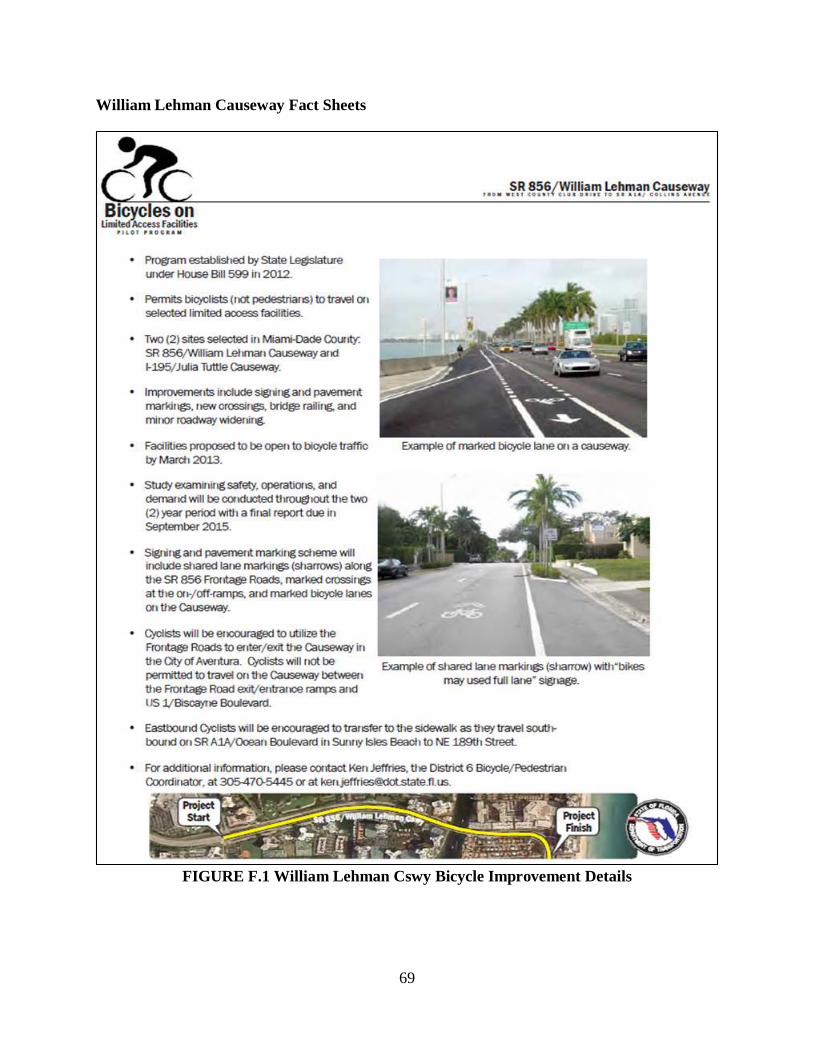
69
William Lehman Causeway Fact Sheets
FIGURE F.1 William Lehman Cswy Bicycle Improvement Details
70
FIGURE F.2 William Lehman Cswy Bicycle Improvement Plan

71
APPENDIX G
72
Bridge of Lions Sharrows Plan
FIGURE G.1 Bridge of Lions Sharrows Placement Plan

73
APPENDIX H
74
Additional Photographs
FIGURE H.1 Driver Yielding Right-of-Way to Bicyclist at Ramp Crossing on Julia Tuttle
Cswy
FIGURE H.2 Bicyclist Crossing Ramp Using Green Bike Lane on Julia Tuttle Cswy
75
FIGURE H.3 Cyclist Group Using Wide Shoulder on Julia Tuttle Cswy
FIGURE H.4 Sharrows on Lehman Cswy On-Ramp
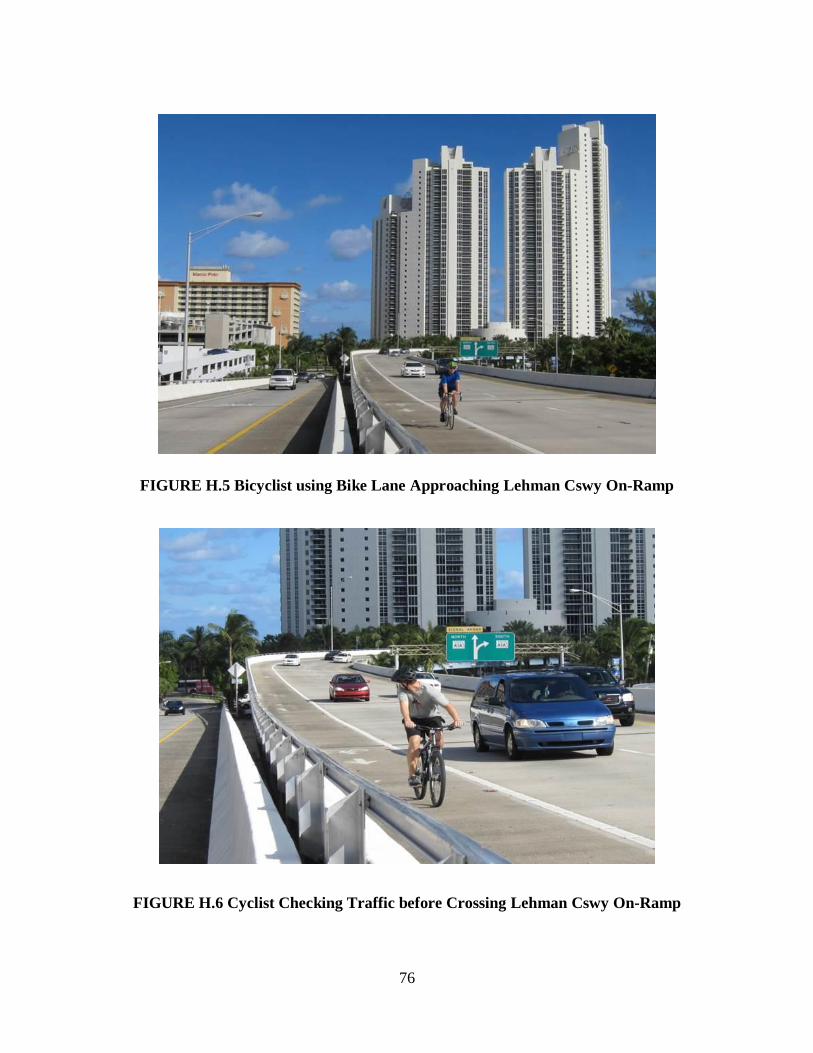
76
FIGURE H.5 Bicyclist using Bike Lane Approaching Lehman Cswy On-Ramp
FIGURE H.6 Cyclist Checking Traffic before Crossing Lehman Cswy On-Ramp
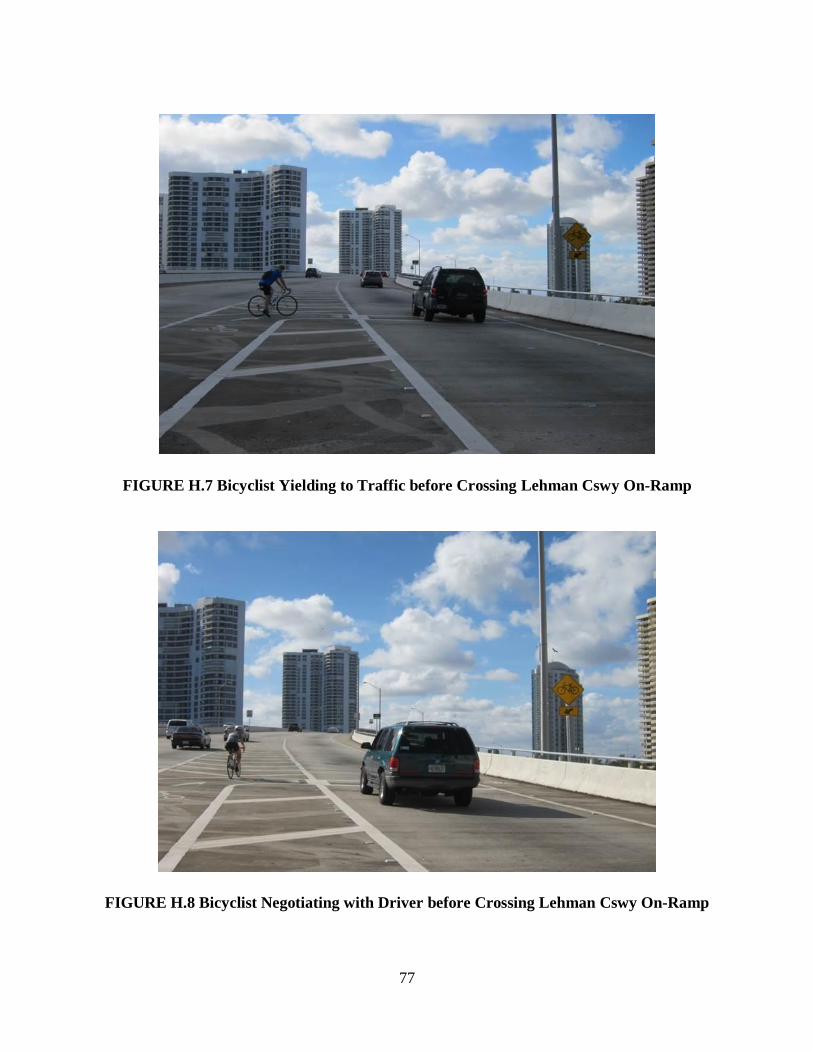
77
FIGURE H.7 Bicyclist Yielding to Traffic before Crossing Lehman Cswy On-Ramp
FIGURE H.8 Bicyclist Negotiating with Driver before Crossing Lehman Cswy On-Ramp
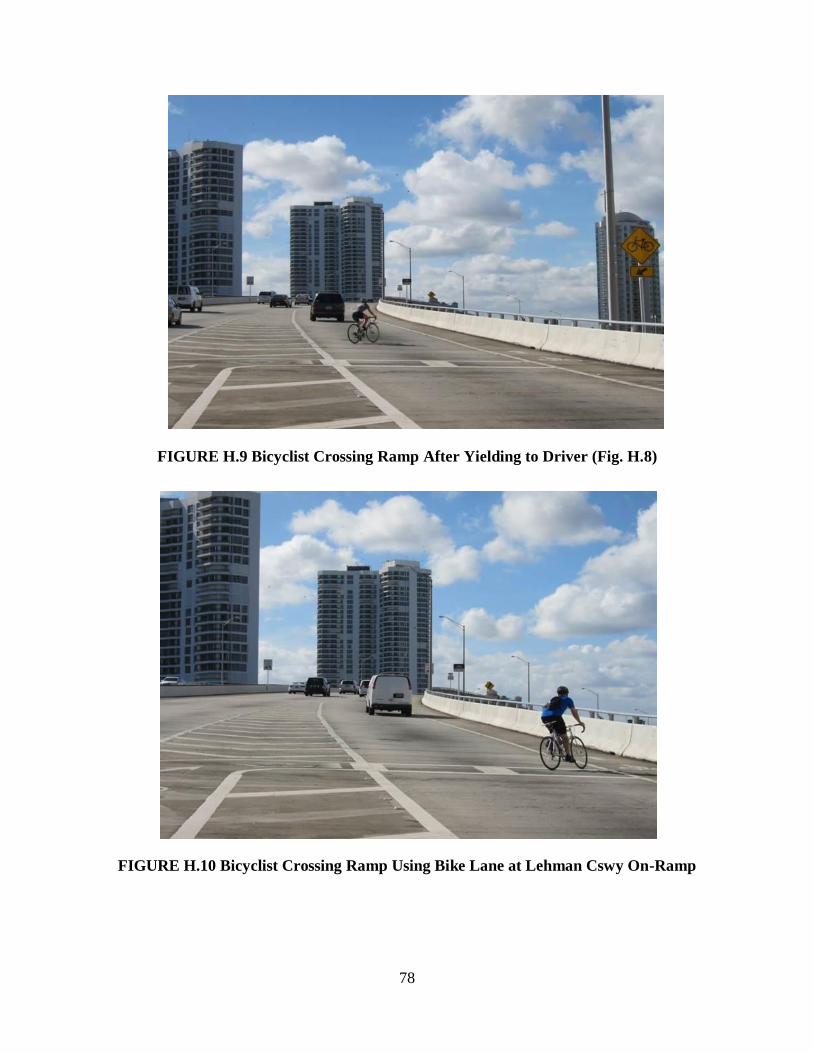
78
FIGURE H.9 Bicyclist Crossing Ramp After Yielding to Driver (Fig. H.8)
FIGURE H.10 Bicyclist Crossing Ramp Using Bike Lane at Lehman Cswy On-Ramp