open source mon landscape ·...
TRANSCRIPT
The Open-‐Source Monitoring LandscapeMichael Merideth Sr. Director of IT, VictorOps [email protected], @vo_mike

My History and Background
•Working in IT since the mid 90’s
•Mostly at startups in the Colorado Front Range area
•Along for the ride during the “dot com boom”
•Build my career using open-‐source tools
Since the 90’s now, there’s been a sharp division in tools and methodology between the enterprise space and the startup and small business communi;es. Obviously, smaller businesses, especially in the tech sector, were early and eager adopters of open-‐source technology, and much quicker to learn to rely on open-‐source tool chains in business-‐cri;cal applica;ons.
Up at the enterprise level, at the public companies, they’re only now fully-‐embracing Linux as a business-‐cri;cal tool, and I think that’s largely because “the enterprise” is star;ng to be defined by companies that either came up in the dot com era, like Google, or built the dot com era, like Sun, or Dell, or let’s say RedHat.
So, the “enterprise” had their toolchain, built on commercial solu;ons like HPUX and OpenView and so on, and the startup community, the “dot com” community had a completely different toolchain, based on Linux, based on open standards and protocols, built with open-‐source components like GNU, and Apache, and ISC Bind and so on. I’m lucky enough that I’ve been able to spend my career in the startup sphere, working with that open-‐source toolchain. I started working in IT in the mid 90’s in the Colorado front range, and I’ve spent my ;me since then working for and consul;ng at early-‐stage startups and other “non enterprise” shops. I’ve been able to see first-‐hand as the OSS toolchain has gone from seat-‐of-‐the-‐pants flying to mature, stable, mission-‐cri;cal solu;ons (with seat-‐of-‐the-‐pants mode s;ll available for the adventurous of course).
I’ve always been interested in monitoring and telemetry, and the ways it can help make life easier for people like me, so I really have my dream job now, working for VictorOps in Boulder, Colorado. We spend a lot of ;me integra;ng our product with monitoring tools, which gives me an opportunity to see a lot of what’s out there, and hear from our customers about what they’re using and how it’s working for them.

Open-‐Source Monitoring
•Started out as shell scripts
and “Big Brother”
•Better tools emerged in
the late 90’s
• For much of the 2000’s, not
much changed in the space
•Now things are shaking up!
So that’s why I’m here to talk to you about open-‐source monitoring today. When I started in IT, the free monitoring op;ons were a li[le thin on the ground, and most of us were running scripts out of cron and using other homegrown solu;ons to get the job done. Here you can see a screenshot of “Big Brother”, which was a common OSS tool at the ;me. Isn’t that nice? I love the grid view, which assumes that every service runs on every host. That’s just good design.
In the late 90’s, be[er open-‐source monitoring tools started to emerge and get adopted. And for several years a]er that, not much changed. A great deal has been happening in the monitoring space lately though. I think it’s in response to the rise of virtualiza;on and cloud hos;ng, and in response to the rise of DevOps business methodologies. Some older, more established solu;ons are making changes, or ge_ng challenged by new approaches, and I think a line is being drawn between a more enterprise-‐like all-‐in-‐one approach to monitoring solu;ons and a more modular approach.

Monitoring categories
Func;onal
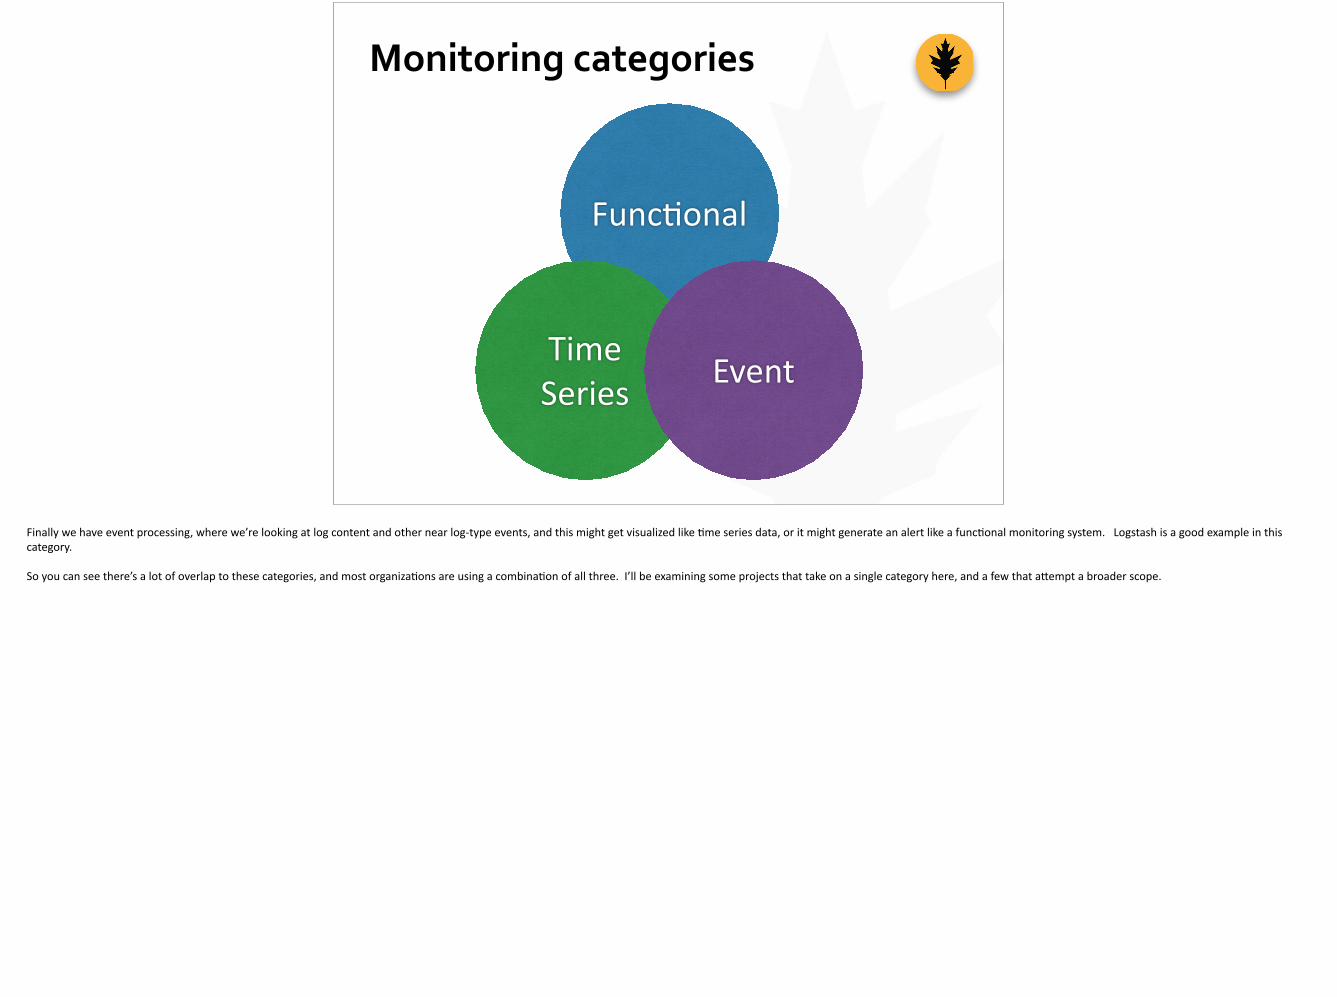
There’s three main categories in monitoring where I’m going to be concentra;ng my focus here. First is tradi;onal func;onal monitoring, the type of product that pages you when your website goes down. Nagios is an obvious example of a func;onal monitoring product.

Monitoring categories
Func;onal
Time Series
Then we have ;me-‐series data collec;on, where we’re more frequently genera;ng graphs than genera;ng alerts, though there certainly can be overlap. Cac; and Graphite are examples here.
Monitoring categories
Func;onal
Time Series Event
Finally we have event processing, where we’re looking at log content and other near log-‐type events, and this might get visualized like ;me series data, or it might generate an alert like a func;onal monitoring system. Logstash is a good example in this category.
So you can see there’s a lot of overlap to these categories, and most organiza;ons are using a combina;on of all three. I’ll be examining some projects that take on a single category here, and a few that a[empt a broader scope.
Why OSS Monitoring?
The practice of Systems Administration is changing
quickly
•DevOps
• Infrastructure as Code
•Virtualization
•Cloud Hosting and Elastic Environments
Commercial solutions can’t keep up!
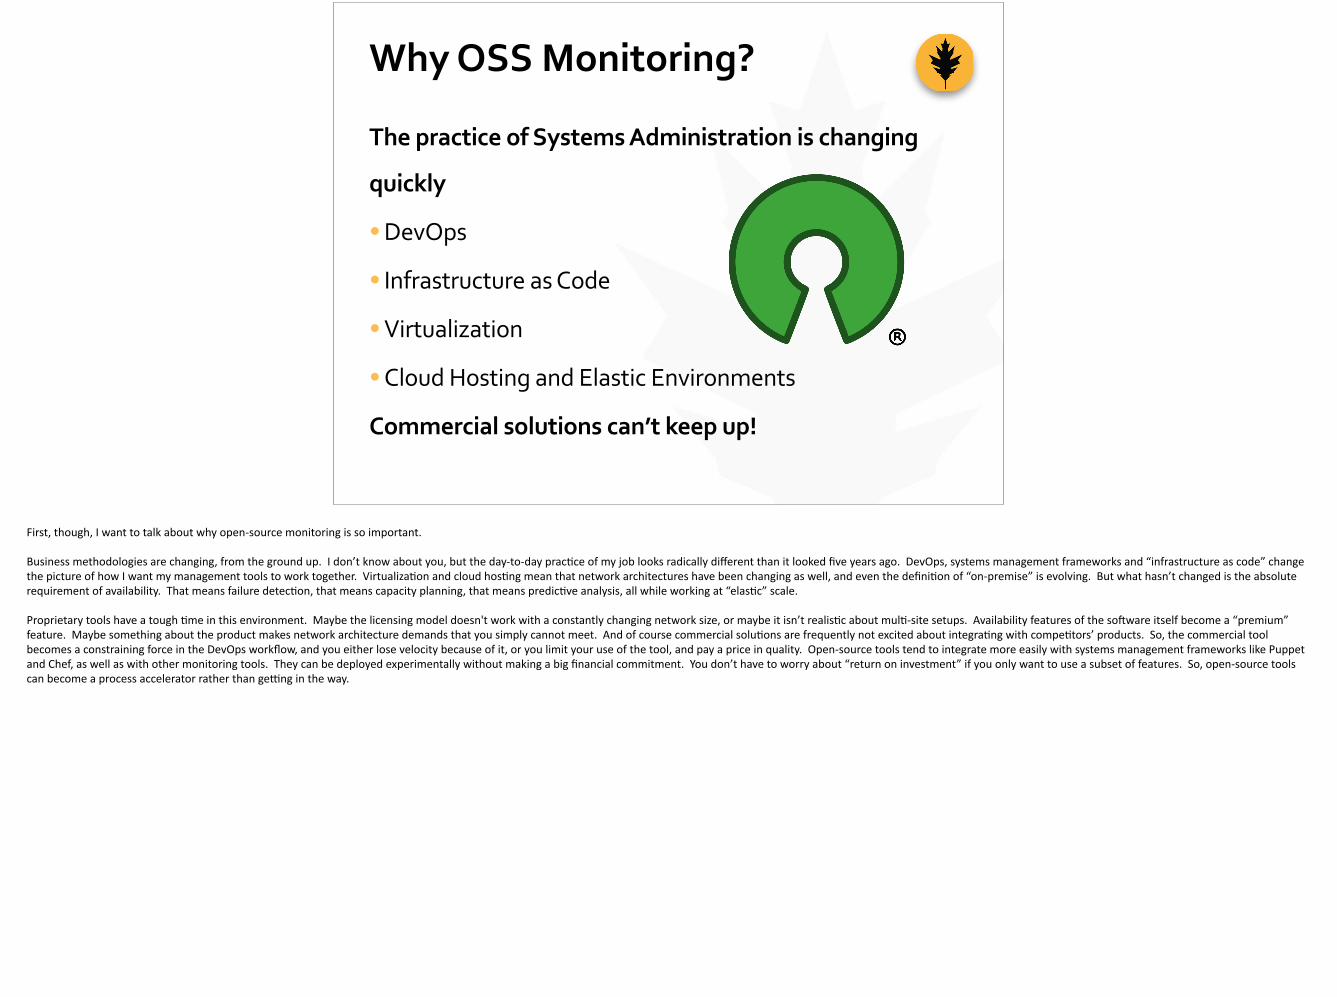
First, though, I want to talk about why open-‐source monitoring is so important.
Business methodologies are changing, from the ground up. I don’t know about you, but the day-‐to-‐day prac;ce of my job looks radically different than it looked five years ago. DevOps, systems management frameworks and “infrastructure as code” change the picture of how I want my management tools to work together. Virtualiza;on and cloud hos;ng mean that network architectures have been changing as well, and even the defini;on of “on-‐premise” is evolving. But what hasn’t changed is the absolute requirement of availability. That means failure detec;on, that means capacity planning, that means predic;ve analysis, all while working at “elas;c” scale.
Proprietary tools have a tough ;me in this environment. Maybe the licensing model doesn't work with a constantly changing network size, or maybe it isn’t realis;c about mul;-‐site setups. Availability features of the so]ware itself become a “premium” feature. Maybe something about the product makes network architecture demands that you simply cannot meet. And of course commercial solu;ons are frequently not excited about integra;ng with compe;tors’ products. So, the commercial tool becomes a constraining force in the DevOps workflow, and you either lose velocity because of it, or you limit your use of the tool, and pay a price in quality. Open-‐source tools tend to integrate more easily with systems management frameworks like Puppet and Chef, as well as with other monitoring tools. They can be deployed experimentally without making a big financial commitment. You don’t have to worry about “return on investment” if you only want to use a subset of features. So, open-‐source tools can become a process accelerator rather than ge_ng in the way.

What about SaaS?
•There are some great options out there
• It can be a great way to get started
• It can be a great second-‐line of defense
•Cost can scale very quickly
•Even in a cloud-‐hosted environment,
you will still need “on premise”
monitoring
Now there’s a ton of new SaaS offerings in the monitoring space. At VictorOps we’re happy to work with them all of course, and they can provide great point solu;ons, especially in the early product development stages. I’m also a big fan of using external monitoring services to provide a second line of defense in case your primary monitoring solu;on fails, and they can also be a great way to see how you’re performing from different parts of the world. However they tend to be priced by the data point, so as you scale up you tend to wind up going from watching everything to watching a sta;s;cally significant sample, to watching a sta;s;cally insignificant sample, and it’s the same problem as enterprise so]ware. You under-‐monitor, and you sacrifice quality. So, if you’re scaling up at all, you can use managed services, but you’re s;ll going to want “on-‐premise” solu;ons that you can scale at will.
Functional Monitoring Tools
All right, so let’s start looking at the opens-‐source tools that are out there, star;ng with func;onal monitoring. This isn’t a comprehensive list of every project out there, so your personal favorite might not be represented. But these are some of the projects that I thought were interes;ng or important for one reason or another.

Nagios
Everybody Loves Nagios:
• Much better than its
predecessors
• Simple architecture
• Thriving ecosystem of
plugins and add-‐ons
• Well-‐understood and
popular Image Source: linuxscrew.com
For about 15 years now, the 500 pound gorilla of open-‐source monitoring has been Nagios. It is the most commonly used integra;on we see at VictorOps by a wide margin. When it came along, most of us were using “Big Brother” for monitoring, or homegrown scripts running out of cron. In that world, Nagios was a revela;on. It’s strength is that it’s really just a scheduler and event handler, and all the complicated check work is done by a highly modular and portable system of plugins. It’s easy to write a check plugin for nagios, and given that the checks are standalone programs that are called with a fork and exec, the plugins can be easily re-‐used by other monitoring daemons like NRPE or by completely different solu;ons. Plugins have been wri[en to do complex, deep monitoring of most devices and applica;ons out there, it’s a thriving ecosystem.
The configura;on language for Nagios is well understood, even though it can lend itself to some ambiguity and it’s possible for nagios configura;ons to get impossibly complex. It mainly has the advantage of having been ubiquitous for so long that virtually everyone in the industry has some experience with Nagios configs. Systems management tools, like Puppet, have built-‐in capabili;es for genera;ng nagios configura;ons, so it’s rela;vely easy to build a configura;on that automa;cally picks up changes in your network architecture. And again, it’s extremely flexible and can be adapted for a lot of different use cases.

Nagios
Everybody Hates Nagios:
• Many features require add-‐on software
• WebUI is clunky and inefficient
• Not scalable
• Not highly-‐available
• Config language is ambiguous and confusing
Nagios is not without its cri;cs. Again, Nagios core is rela;vely simple so]ware. It schedules checks, parses the output, maybe takes ac;on, and has a basic web interface. It doesn’t generate graphs or track metrics without add-‐on so]ware. It doesn’t parse log files or deal with event streams. It doesn’t do automa;c discovery. This is all true, but these are all inten;onal choices that are built in to the architecture, and part of the reason why it’s so modular and flexible, and rela;vely good at what it does.
There are some more general and legi;mate complaints. The web interface is clunky and dated, and hasn’t changed substan;ally in years. Version 3, the version that’s in widest use right now, and is in the repos of the major Linux distribu;ons, is a bit of a resource hog and has trouble scaling past a few thousand data points. It’s not cluster-‐aware or designed for high availability. It doesn’t lend itself well to mul;-‐datacenter use or horizontal scaling. Nagios’s configura;on language is well-‐known, but widely cri;cized for for being ambiguous and confusing.

Nagios
Fork’s A-‐Comin’
• Community dissatisfaction with pace of development
• Differing views on product scope and architecture
• 2009: Icinga fork is announced
• Shinken follows quickly
• Naemon is a newer fork
• In 2015, things are getting interesting…
The add-‐on ecosystem has addressed a lot of those complaints, but there was growing dissa;sfac;on in the community about the pace of development of the core Nagios project and the fact that Ethan Galstad, the original developer and the CEO of Nagios Enterprises, was ac;ng as a sole gatekeeper for changes to the core codebase. Some people in the community had different ideas about product scope and what features should be included, and others had different ideas about the overall product architecture. In 2009, over ten years a]er Nagios’s original release as NetSaint, a group of developers announced a fork of the Nagios project called “Icinga”, and it has been gaining in popularity ever since. More recently, the Shinken and Naemon projects have appeared as well. All four of these projects have taken radically different views on design, architecture, scope, and mone;za;on strategy.
Now, as with all so]ware projects where human developers and egos are involved, there has been no shortage of digital ink spilled about the poli;cal controversy surrounding these forks, and there have been cri;cal statements made by all the par;es about one another. That’s well-‐covered online, so I won’t wade in to it here. Read all the accounts before you form an opinion, that’s my advice. The only opinion I have is about whether the controversy affects me personally, and for me that’s a “no”.
As a user of open-‐source so]ware, I think the forking of Nagios has been a big posi;ve. Icinga version 1 brought a lot of long-‐needed improvements to the web UI, and added support for addi;onal database backends, among other things. At the same ;me it’s mo;vated Nagios to add more developers to the core project, and to quicken the pace of development. So the users of both projects have benefi[ed. I think we’ll need to wait and see what the ul;mate impact will be of the Shinken and Naemon projects.
There are big changes happening right now though. Both Nagios and Icinga introduced new versions in 2014 that put them on a wildly divergent path. Nagios 4 and Icinga 2 are both major rewrites, with Icinga 2 going so far as to adopt a new configura;on language. If Icinga was perceived as “Nagios with nicer UI” before, it is now a substan;ally different product with different design and architecture goals.
Icinga 2
•Totally rewritten from the ground up
•New command-‐line interface
•Several built-‐in modules
•Reload config without interrupting checks
•Totally new configuration language
• Includes a tool for converting Nagios configs
Icinga 2 is a complete ground-‐up rewrite. It provides a new cli management interface with access to program and monitoring configura;on objects. Several common add-‐on features (database integra;on, performance data collec;on) are now built-‐in modules that can be enabled or disabled as desired from the CLI. It includes several performance features, including the ability to reload configura;on data without interrup;ng running checks, and if you work in a shop that updates Nagios config a lot, you know that’s a big deal.
The configura;on language is completely changed from the Nagios standard. They do include a tool for conver;ng Nagios-‐format configs to the new Icinga 2 format. The config language is said to adopt a “one best way” design philosophy, with the idea of elimina;ng the ambiguity that can arise in a Nagios configura;on. It’s object-‐based and rule driven, which means a]er ini;al templates are defined, managing changes in configura;on should be simple. I love the look of Icinga 2. We’re pilo;ng it at VictorOps right now, and we may be adop;ng it for produc;on use.

Icinga2
Here’s a screenshot of Icinga running the new Icinga-‐web 2 webUI. You can see it’s a much more modern-‐looking interface than Nagios, but design is just part of it. They’ve made some rela;vely minor changes to the way you interact with mul;ple services or mul;ple hosts at a ;me, that have produced big produc;vity gains over the Nagios UI.

Nagios 4
•Lightweight worker processes to spawn checks
•API improvements
•Some features have been obsoleted
• Faster development and more core developers
Nagios 4 is also a major rewrite, but obviously s;cking much more closely to the original Nagios paradigm. Nagios core now spawns lightweight worker processes that handle check execu;on, and that has greatly increased efficiency. Nagios has also made improvements in APIs and event handling, and obsoleted some features that were never fully implemented in previous versions of Nagios like failure predic;on, or that had become difficult to maintain, like the embedded Perl interpreter.
Nagios has also added new developers to the Nagios Core team, and a succession strategy is being worked out. They’ve signaled that they intend to increase the pace of development on the core product.

Nagios 4
The nice thing about Nagios 4 is that it accomplishes all this while maintaining configura;on fidelity, and in fact the day-‐to-‐day opera;on of Nagios 4 is essen;ally unchanged from earlier versions. This means that if you’re using Puppet to manage your Nagios configura;on, you can upgrade to Nagios 4 quite easily and enjoy the performance benefits without a ton of work. On the downside, the webUI s;ll hasn’t evolved significantly from Nagios 3, and is star;ng to feel really dated. Lots of common tasks are tedious and difficult from the UI. They have changed the default look-‐and-‐feel from “black” to “white”, so it’s a more readable interface, but it’s s;ll frames and tables.

Shinken
•Complete reimplilention in
Python
•Modular architecture with
multiple processes
•Config-‐compatible with Nagios
Shinken aims to have it both ways, being a complete reimplementa;on of Nagios core as a series of modular Python-‐based processes, but that maintains legacy Nagios configura;on compa;bility. They boast very impressive performance numbers, and an architecture that provides for high-‐availability and high-‐scale. That comes at the cost of having a lot of moving parts and a lot of external dependencies. It’s also distributed using the PIP packaging system, and then it has it’s own internal package repository-‐like func;onality for adding modules to the so]ware. So if you like the idea of layers upon layers of package managers and dependencies, then Shinken may be for you.
There’s also a commercial Shinken Enterprise product, which includes some addi;onal features not included in the community edi;on. So if you like the idea of PAYING for external dependencies and extra package managers, be sure to check that out.
Naemon
•Forked from Nagios 4
•Aims to add frequently requested features
•Non-‐commercial entity in control
• Explicit goal of a more open development process
Finally I’ll men;on Naemon, which is a more recent fork, this one based on the Nagios 4 codebase. The goal of the project is to introduce a lot of the same community-‐driven feature requests that Icinga and Shinken do, but also with an explicit goal to have a non-‐commercial en;ty managing the project and ensuring an inclusive development process. So if you find that the poli;cs around using Nagios or Icinga or Shinken really bother you, then Naemon might be a good choice. They just hit their 1.0 release a bit over a week ago so that project is really just ge_ng going.

Commercial Nagios Derivatives
•Groundwork
•Opsview
•Others, I’m sure
• If you want to pay for
Nagios, pay NagiosImage source: Cafepress
There are some explicitly commercial products out there that are based on Nagios as well; Groundwork and Opsview are two examples. I don’t see a lot of value in them, they don’t really offer anything over Nagios core except visual cru] and a licensing fee. If you want to pay to run Nagios, then you can always pay Nagios.

Sensu
•Similar scope to Nagios
•Architected as a
composable framework
•Several external
dependenciesImage Source: florin.myip.org
There are a couple other projects I’ll men;on that are focused on func;onal monitoring:
Sensu has a fairly similar scope and feature set to Nagios, but takes the form of a composable framework of components, including a web interface that can serve as a front-‐end for several Sensu servers. Like Shinken, it has a lot of external dependencies, and ge_ng it up and running is no joke, but if you need extreme flexibility or have very specific architectural requirements, it might be for you. At VictorOps we’re seeing a growing number of our customers using Sensu

Monit
•Runs locally on each server
•Thresholds can trigger scripted actions or alerts
• Lightweight web interface shows status and stats
•M/Monit is a commercial product that offers a
central dashboard
Monit runs as an agent on each monitored host. It can be configured to watch processes, files, or other metrics, and take scripted ac;ons when thresholds get crossed. Monit provides a lightweight web interface for looking at status and sta;s;cs. A commercial product m/monit, can provide a central management point for several hosts running monit, but it’s not a required component. In a managed environment you might have it send events to a Nagios host and in that way decrease poller load, or avoid some of the security concerns with running NRPE.
Managed vs. Discovery
•Managed configs work great in an infrastructure-‐as-‐
code environment
•Also fine for small environments that don’t change
•Auto-‐discovery solves problems for some larger
shops with heterogenous networks
•Network tripwire
All of those solu;ons are great if you are in a DevOps workflow, and you have a managed infrastructure, using something like Puppet or Chef. The hosts and resources that get monitored are either defined in well-‐known standard text configura;on files, or can be managed programma;cally. So it’s possible to wire them into your systems management framework and get your configura;on auto-‐generated.
Of course, not everybody lives in that world. Auto Discovery is an important feature for a lot of shops. If you work for a larger company that’s making acquisi;ons, you might find yourself managing an inherited infrastructure with li[le prior knowledge and poor documenta;on. In this case, a tool that can discover the current state of a network and alert you to changes from that state can be an invaluable learning and troubleshoo;ng tool while you’re building documenta;on.
Auto-‐discovery can also act as a network tripwire, detec;ng devices that may have been placed on your network without your knowledge. Most monitoring systems with auto-‐discovery can send a no;fica;on when a new device is detected.

OpenNMS
•Released in 1999
• JVM-‐based
•Efficient ping-‐based auto-‐discovery
•Native support for SNMP
OpenNMS is an example of a discovery-‐based monitoring solu;on that’s been around almost as long as Nagios. They’re here at the conference so I’m sure many of you have spoken to them. It’s JVM-‐based so it’s pre[y easy to get it deployed and running. In my experience it runs fine with OpenJDK. Once you’ve tuned the discovery se_ngs it can pick up the state of a network quickly and provide a picture of where everything is running. One thing to note with OpenNMS, and a lot of discovery-‐based tools, is that the hosts being discovered have to respond to ICMP to be discovered. So it’s less effec;ve for finding “rogue” equipment on the network, and switch or router ACLs may limit the effec;veness of discovery in distributed networks.
OpenNMS uses SNMP to gather metrics and do local checks on monitored systems. This makes it especially handy if you’re managing a lot of network gear or appliance-‐type devices, like video conferencing systems and so on.

The Assimilation Project
• “Nanoprobe” agents do discovery and monitoring
•Zero network footprint discovery listens to ARP traffic,
so nodes don’t need to respond to ping (or anything) to
be discovered
•Agents form a self-‐organizing mesh of redundant
monitors
• http://assimilationsystems.com
There’s a brand-‐new project in the early stages of development called “The Assimila;on Project”. It was started by Alan Robertson, who you may know as the founder of the Linux HA project and long ;me maintainer of Heartbeat. It uses “nanoprobes”, or basically li[le agents, that communicate state to a central data store, and these nanoprobes do distributed “zero network footprint” discovery by listening to arp traffic. This means that it can quickly discover your network topology even if your hosts don’t respond to pings, and since the process is distributed and agent-‐based, it can discover complex and heterogenous networks (as long as the agents can connect back to the master). Monitoring is also highly distributed and redundant, so the loss of any one node will not result in the loss of monitoring for any other node.
In a lot of ways it represents a new paradigm in systems monitoring, and I’m probably not doing it jus;ce here. I really encourage you to check out the project website, there are some good illustra;ons of the core concepts at play, that give you an inkling of the poten;al power of this so]ware. If total informa;on awareness is your goal, or you just like messing around with bleeding-‐edge technology, Assimila;on should be on your list.
Zenoss
•Similar scope to OpenNMS
•Zenoss sells an enterprise product, but the free
product is community supported
• “Zen Pack” plugins provide specialized monitoring
and alerting capabilities
Zenoss is another tool that does discovery. Like OpenNMS, it also does ;me-‐series monitoring, and also has event handling capabili;es. Hopefully you had a chance to stop and talk to them at their booth during the show; I get the impression that their community outreach team takes their jobs very seriously. So even though their main focus is a commercial enterprise product, the community version is OSS, and it’s viable.

Zabbix
•Similar scope to OpenNMS
• Includes an agent to perform local checks and report
system metrics
•Zabbix is a commercial company, but their software
is all OSS
Zabbix is another product that does network discovery, similar to OpenNMS. Zabbix also includes an agent that can be installed on monitored hosts and provides system-‐level metrics (again, OpenNMS achieves this through SNMP). Zabbix is distributed by a commercial en;ty who offer support and consul;ng, but the so]ware is all distributed under a GPL license.

Time-‐Series Monitoring
All right, now I want to highlight some projects that are focused on ;me-‐series data.
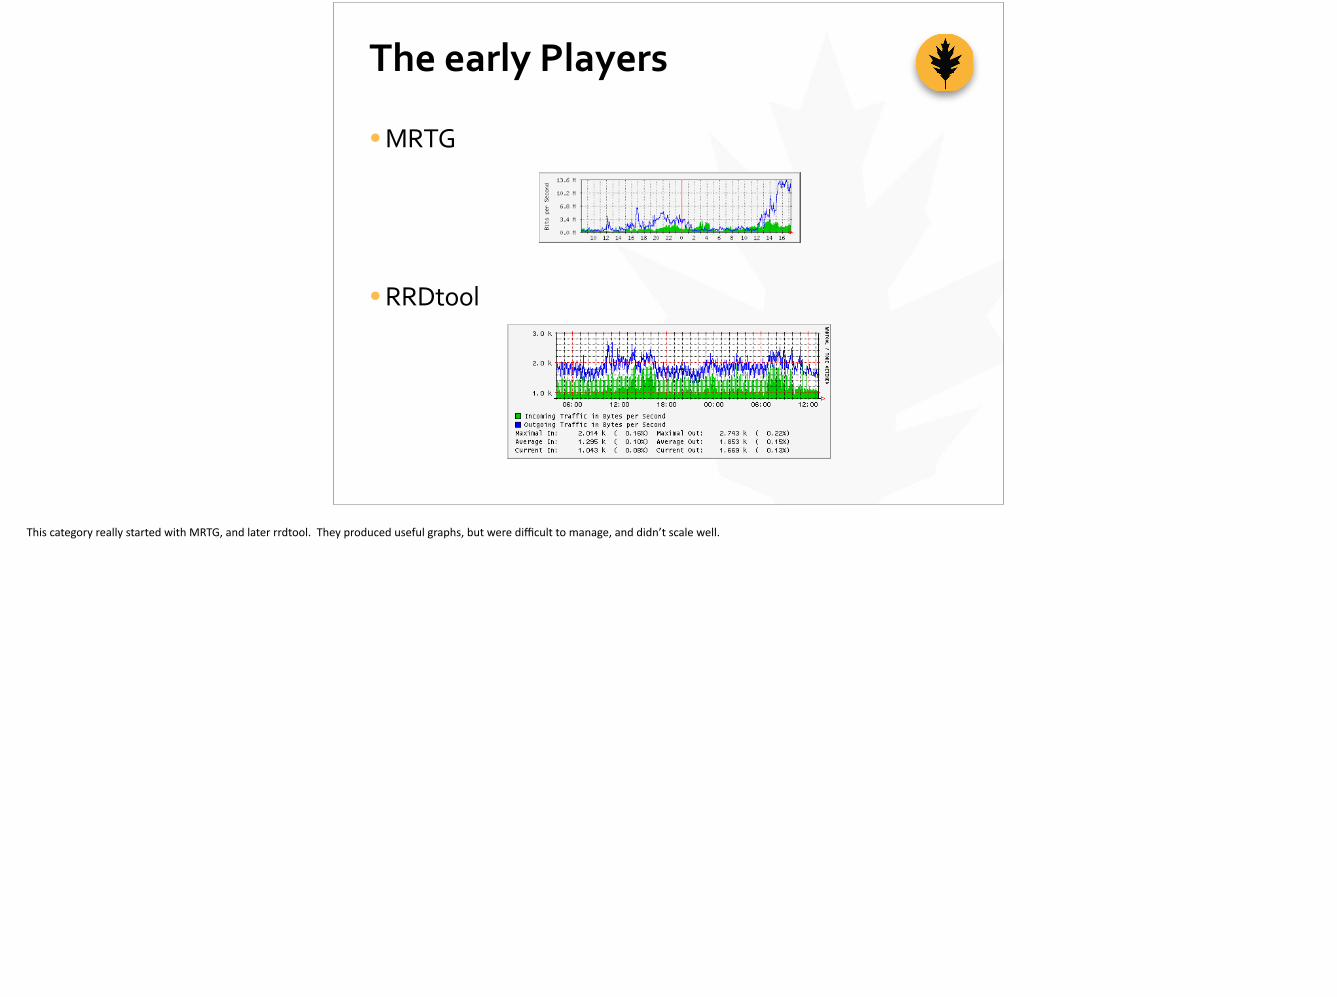
The early Players
•MRTG
•RRDtool
This category really started with MRTG, and later rrdtool. They produced useful graphs, but were difficult to manage, and didn’t scale well.

Cacti
•RRDtool with a
nice web-‐based
management
wrapper and
dashboard
builder
Cac; came along in the early 2000’s as a web configura;on wrapper around RRDtool. It solved a lot of the ease of use problems, but didn’t address the scalability of the RRDtool backend, or the inherent scalability challenges of an SNMP poller-‐based graphing tool.

Munin
•Local agents with
a central poller
•Goes beyond
SNMP monitoring
•Can produce
alerts based on
thresholds
Munin breaks through some of the poller-‐based scale challenges of an RRDtool-‐based solu;on, by using an agent that gathers data locally and transmits it in batches. The master can also pass alerts to Nagios if the agents report threshold viola;ons. Munin also breaks out of SNMP-‐based checks by making process and filesystem checks simple in the agent. Out of the box, the agent collects a ton of metrics, so it’s a good way to get a comprehensive look at a system. On the downsite, it’s not known for great performance, and the agent may be a bit heavy for some people’s tastes.

Graphite
•Whisper storage engine is similar to RRDtool, but
can be clustered
•Modular framework includes listeners, pollers, and a
visualization layer
•New data points automatically created in the
database
More recently, new projects have taken a more modularized approach, which has allowed for more mixing between visualiza;on layers, storage layers, and data sources. The storage back-‐ends have become very free form, allowing for the crea;on of arbitrary objects and key-‐value pairs.
Graphite is a popular example. It’s a framework that includes a storage engine similar in many ways to RRDtool, a daemon that listens for ;me series data, and a web-‐based visualiza;on layer. It’s notably different than Cac; and Munin because it doesn’t include a poller, it listens for connec;ons and passively accepts data, automa;cally crea;ng new tables when new data sources connect. So provisioning new hosts is effortless. Lots of compa;ble tools have been created to feed it data, including SNMP pollers, so more tradi;onal setups and data sources can also be accommodated.

Graphite -‐ Tree View
Here’s a look at the graph composer, which allows you to browse through all of your data points, combine them in a single graph, and apply filtering, aggrega;on, transforma;ons and so forth to the data. Very powerful.
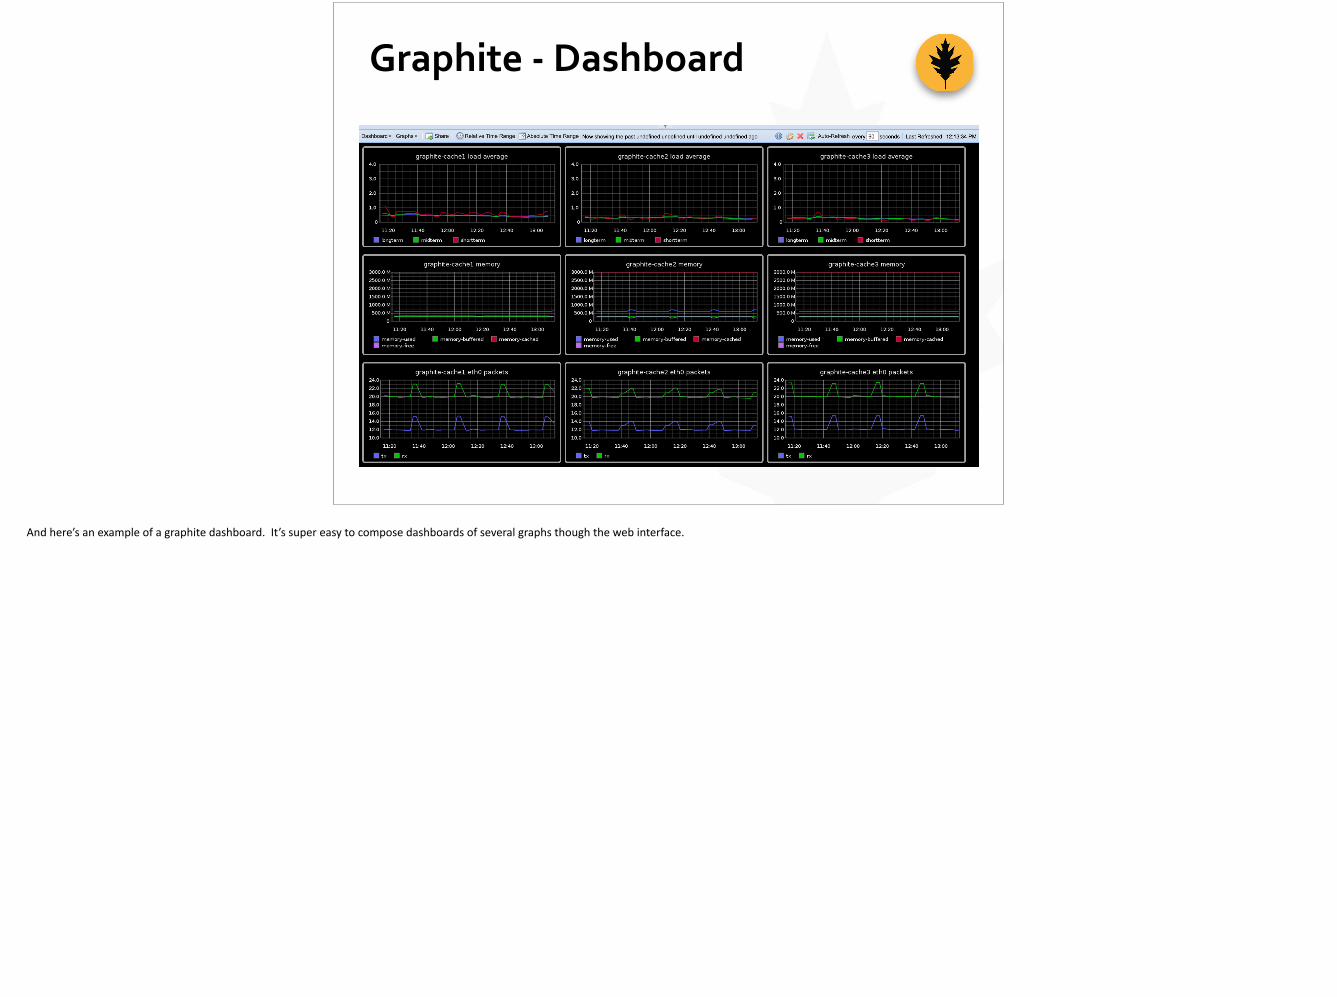
Graphite -‐ Dashboard
And here’s an example of a graphite dashboard. It’s super easy to compose dashboards of several graphs though the web interface.

InfluxDB
•Similar scope to Graphite
•Designed for horizontal scale
•Easy web API for the listener
•SQL-‐like query language for building graphs
•No external dependencies
InfluxDB is a brand-‐new project with similar scope to Graphite. It’s designed to be easily horizontally scalable and its listener presents a standard h[p API, making it easier to write data. It also has a SQL-‐like query language with func;ons you can use to build complex graphs or new data sources. It’s simple to install with no external dependencies. The project isn’t calling itself produc;on-‐ready yet, but it should be soon, and it’s worth keeping an eye on.

Prometheus
• Just open-‐sourced by
SoundCloud
•Similar to Graphite, but
adds alerting
functionality
• Includes a data poller,
but can passively
receive data tooImage Source: SoundCloud
Prometheus is an internal project at SoundCloud that they open-‐sourced in January. It is another ;me-‐series database similar to InfluxDB, but that adds aler;ng func;onality. It includes its own poller, but can also passively receive data like Graphite and InfluxDB.
No;ce, this new genera;on of tools is all highly modular and composable. To some extent you can mix the front-‐ends and back-‐ends, and some collec;on tools can be used with just about all of them:

Collectd
•Gathers metrics and emits them to a configurable
destination
•Runs as an agent on a variety of architectures
•Easy to manage configuration
for example, collectd runs as a lightweight daemon on monitored hosts, gathering metrics based on a built-‐in plugin library and emi_ng them at regular intervals to a des;na;on. It’s a great way to feed system sta;s;cs like CPU u;liza;on and disk IO to a ;me-‐series database, and can be managed easily by Puppet or Chef.

Statsd
•Middleware to make it easy to get data into Graphite
•TCP and UDP listener receives metrics, forwards
them to the Graphite listener
•Open-‐source project from Etsy, inspired by a similar
project from Flickr
statsd is another example. It provides a TCP and UPD listener that can receive metrics in a simple format and forward them on to a backend like Graphite or InfluxDB. It’s an easy way to add instrumenta;on to in-‐house so]ware. Etsy released it, inspired by a similar project from Flickr.
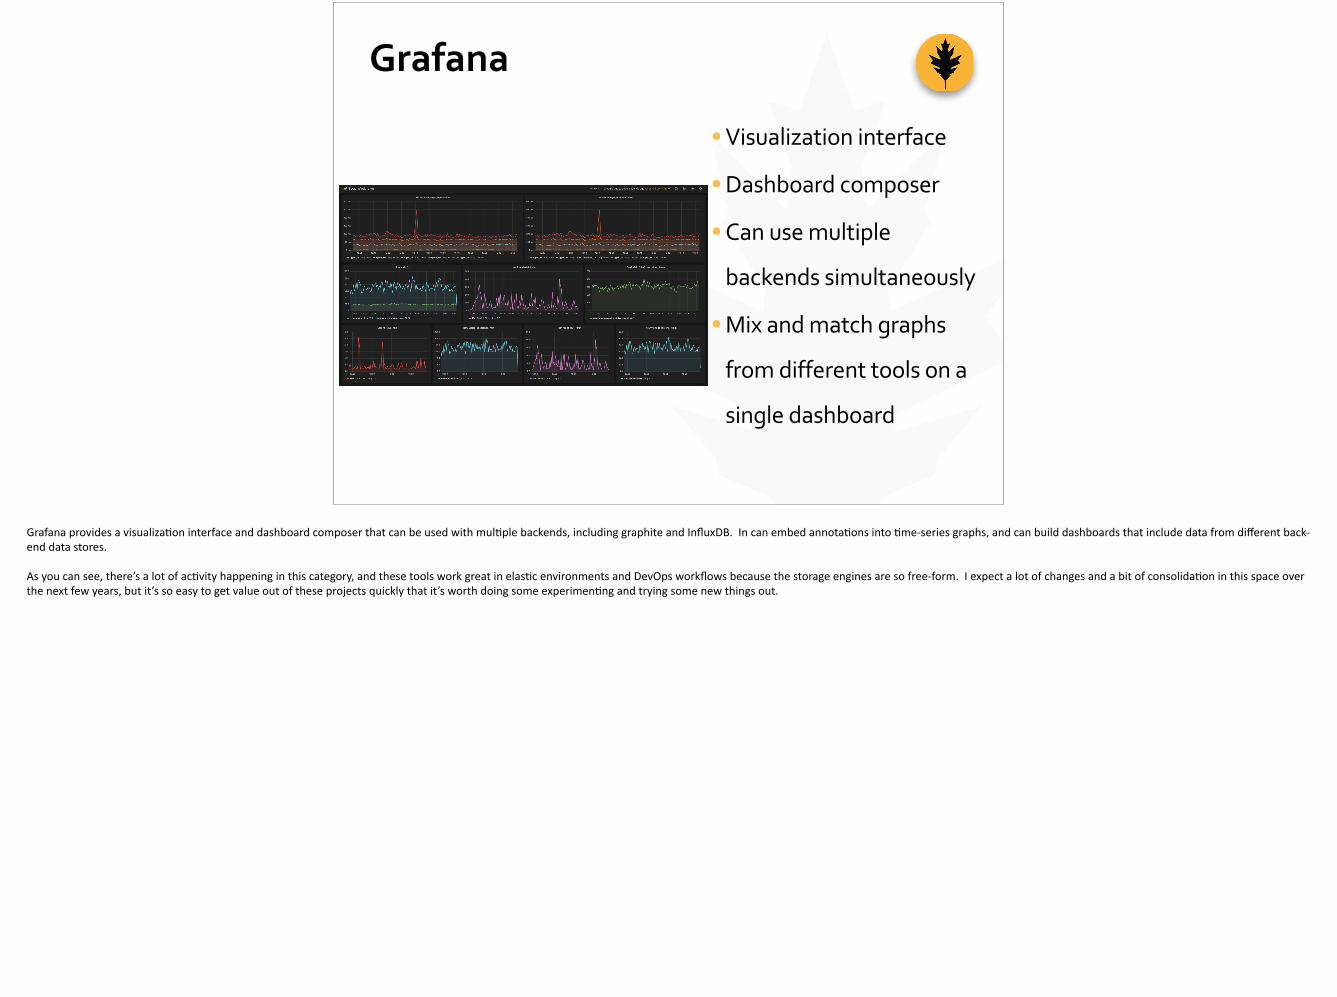
Grafana
•Visualization interface
•Dashboard composer
•Can use multiple
backends simultaneously
•Mix and match graphs
from different tools on a
single dashboard
Grafana provides a visualiza;on interface and dashboard composer that can be used with mul;ple backends, including graphite and InfluxDB. In can embed annota;ons into ;me-‐series graphs, and can build dashboards that include data from different back-‐end data stores.
As you can see, there’s a lot of ac;vity happening in this category, and these tools work great in elas;c environments and DevOps workflows because the storage engines are so free-‐form. I expect a lot of changes and a bit of consolida;on in this space over the next few years, but it’s so easy to get value out of these projects quickly that it’s worth doing some experimen;ng and trying some new things out.

Sidebar: Poller vs. Listener
•Polling over a network is inefficient
•TCP is more expensive to the originator
•Poller connections are longer-‐lived
• Listeners can be used for functional monitoring
•Scale demands it, we’re going to see more of it
You may have no;ced that a lot of the more recent tools have switched from a poller model to a listener model. This makes so much sense with ;me-‐series data, but I also think the model has applica;on in func;onal monitoring. Poller-‐based monitoring is just inherently inefficient, since so much of the TCP heavy li]ing is concentrated in one place, and frequently the connec;on has to be held open while the check is run or the metric sampled. Emi_ng events to a passive listener means more of the TCP work is distributed, and the check or sample can run before the connec;on is opened, so you only need to communicate long enough to send the data. In a managed environment, a lot of health checks can be run locally and problems emi[ed to Nagios or another event handler. This scales be[er than poller-‐based solu;ons in so many environment, I have to expect we’ll start seeing more of it on the func;onal side. The Assimila;on project has a fascina;ng approach to this as well; again, I urge you to check it out on their website.
Event Monitoring
Okay, on to our third category, Event monitoring
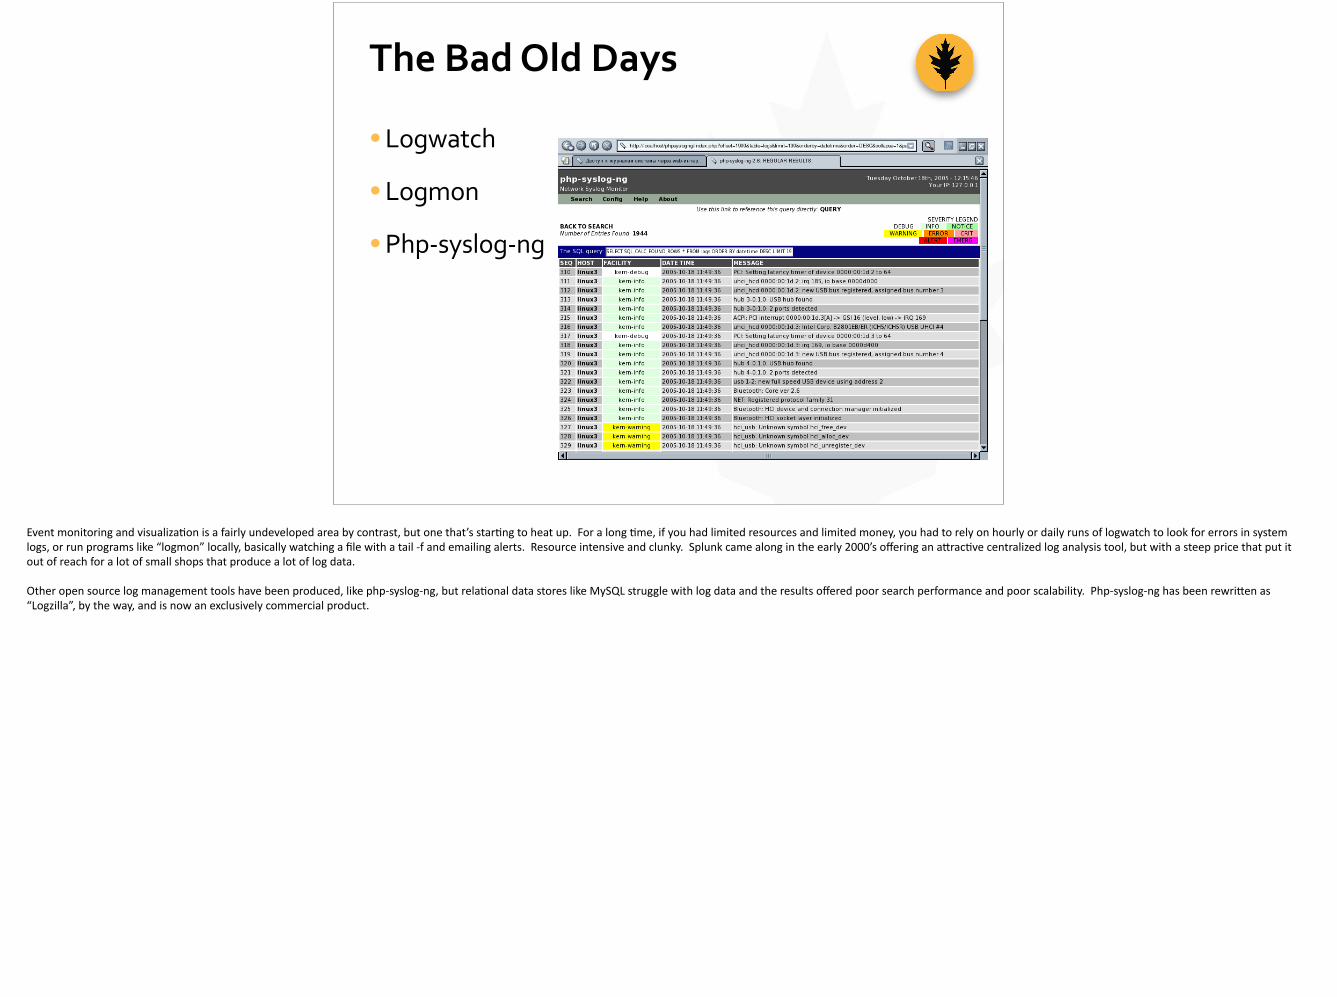
The Bad Old Days
•Logwatch
• Logmon
•Php-‐syslog-‐ng
Event monitoring and visualiza;on is a fairly undeveloped area by contrast, but one that’s star;ng to heat up. For a long ;me, if you had limited resources and limited money, you had to rely on hourly or daily runs of logwatch to look for errors in system logs, or run programs like “logmon” locally, basically watching a file with a tail -‐f and emailing alerts. Resource intensive and clunky. Splunk came along in the early 2000’s offering an a[rac;ve centralized log analysis tool, but with a steep price that put it out of reach for a lot of small shops that produce a lot of log data.
Other open source log management tools have been produced, like php-‐syslog-‐ng, but rela;onal data stores like MySQL struggle with log data and the results offered poor search performance and poor scalability. Php-‐syslog-‐ng has been rewri[en as “Logzilla”, by the way, and is now an exclusively commercial product.

ELK -‐ Logstash
•The “ELK” stack is comprised of
Elasticsearch, Logstash, and Kibana
•Clusterable, horizontally scalable data
store
• Lots of listeners, filters, event handlers
•Beautiful easy to use visualization
layer
Recent advances in open-‐source data stores like Elas;csearch has given rise to Logstash, which provides very similar func;onality to Splunk with a completely open-‐source stack. This is commonly referred to as the “ELK” stack, comprised of Elas;csearch as the back-‐end data store, Logstash to receive and process log events, and then pass them to the storage backend, and Kibana, the web-‐based visualiza;on layer that makes it easy to create dashboards of your log data including histograms and pie charts. As of 2013, Elas;csearch is the commercial keeper and distributer of the ELK stack components.

Logstash -‐ Kibana
Image source: ifconfig-‐a.com
Here’s a screenshot of the Kibana part of the ELK stack. As you can see, it provides not only ways to examine, search and filter your logs, but also to visualize them in interes;ng ways.

Nagios Log Server
•Nagios-‐branded ELK stack
• Includes user management and security features
•Promises easy clustering
•No free version
Last fall, Nagios annouced the Nagios Log Server, which is a commercialized version of the ELK stack with mul;-‐user security features and integra;on with Nagios built-‐in, and promises easy-‐to-‐deploy clustering, something that can be challenging with a standard Elas;csearch deployment. There’s no free version, but it might be a way to get ELK in the door if you have a manager that frets about so]ware without support, or you simply don’t have ;me to invest in ge_ng an elas;csearch cluster running.

Graylog 2
•Similar scope to ELK stack
•Commercial company releases software as OSS, and
sells support and consulting
•External dependencies on MongoDB and
Elasticsearch
graylog2 is a product very similar to the ELK stack, and it’s ge_ng close to a 1.0 release. Similar to Elas;csearch, Graylog Inc. releases all of their code as open-‐source, and offers produc;on and development support contracts for enterprise users. It has external dependencies on MongoDB and Elas;csearch.

Event Monitoring
•A lot of room for growth
•A lot of room for consolidation with time-‐series
projects
• It’s still a great time to be alive and generating log
data
I expect to see the event management tools space heat up like the ;me-‐series space has, even as the two categories start to see more overlap. Again, I think it will be a while before a clear overall winner emerges in terms of storage backends, visualiza;on layers, and event handlers, but what’s out there today has plenty of value to offer. If you’re not running Logstash or graylog2 today you owe it to yourself to get it going. Chances are you won’t have to wait long to see a benefit.

Our Categories Again
Func;onal
Time Series Event
Okay, that’s a very quick survey of our three major categories. If I le] your favorite project out, let me know, I’ll probably want to hear about it! Now, as I said at the start, there’s a lot of overlap between the func;onality of the tools in these three categories, and some of the tools I men;oned could fit in mul;ple categories. It can be temp;ng to look for a single solu;on that captures all of this func;onality, and several projects and companies are aiming at a unified solu;on.

Do-‐It-‐All Products
•OpenNMS
•Zenoss
•Zabbix
•Nedi
•Nagios Enterprises
OpenNMS, Zabbix, and Zenoss don't just do discovery and monitoring, they also graph ;me-‐series data, and have asset management and network management func;onality built-‐in.
“Nedi” is a similar project that’s s;ll defining it’s commercial and release model, but for now is mainly defined by a long list of external dependencies.
Nagios Enterprises is in the process of building a suite of commercial products around Nagios that’s comprised of a lot of different components (like Nagios Log server), but at least gives you a single neck to choke for support I guess

Monolithic vs. Modular
Monolithic:
• If all-‐in-‐one gets the job done, then great
•Good for smaller scale, non-‐tech-‐focused companies
Modular:
• Agile and DevOps shops require flexibility and
innovation
• Good for tech driven and ops-‐focused companies
Some of these all-‐in-‐one products and suites of products can be very a[rac;ve, and if you find one that meets all of your needs, then it can save you a lot of ;me you might otherwise spend composing a monitoring infrastructure out of individual parts. For a lot of shops that operate at a smaller scale but otherwise have more enterprise-‐like requirements (i.e. the primary business isn’t technology), it may be a wise approach to look for a single product to do everything, and adapt your workflow to the tool if you need to.
For shops adop;ng DevOps methodologies, and managing infrastructure as code, especially those working in elas;c environments where architectures and requirements can change over ;me, there’s tremendous opportunity to combine the latest genera;on tools in ways that were difficult or impossible just a few years ago, and produce business value quickly. If you find that one of the monolithic product works for you in that sort of environment, then great, but it’s probable that a mixture of smaller components will address your specific needs more easily.

The “Event Stream” Concept
Source: @obfuscurity
For a few years now, Jason Dixon, who organizes the “Monitorama” conference which is going to be in Portland this year, has described the “event stream” paradigm in monitoring. Rather than try to reproduce his diagram I’ve just swiped it from one of his slide decks. It goes like this: events enter the toolchain. Depending on event type and content, it might get sent to a storage backend for visualiza;on, or aggregated with other events before ge_ng stored. Depending on content, it might change state in a state engine, trigger an event handler or aler;ng process, fire off an email or a VictorOps alert. By using small, composable tools in combina;on, you create the event stream that suits your technology stack and environment.

Nagios-‐Based Toolchain
Collectd
NRPE
Monit
Nagios
ELK
Graphite
Syslog
This doesn’t mean necessarily turning your back on ins;tu;onal knowledge and established tools. Nagios can sit comfortably right in the middle of the event stream.
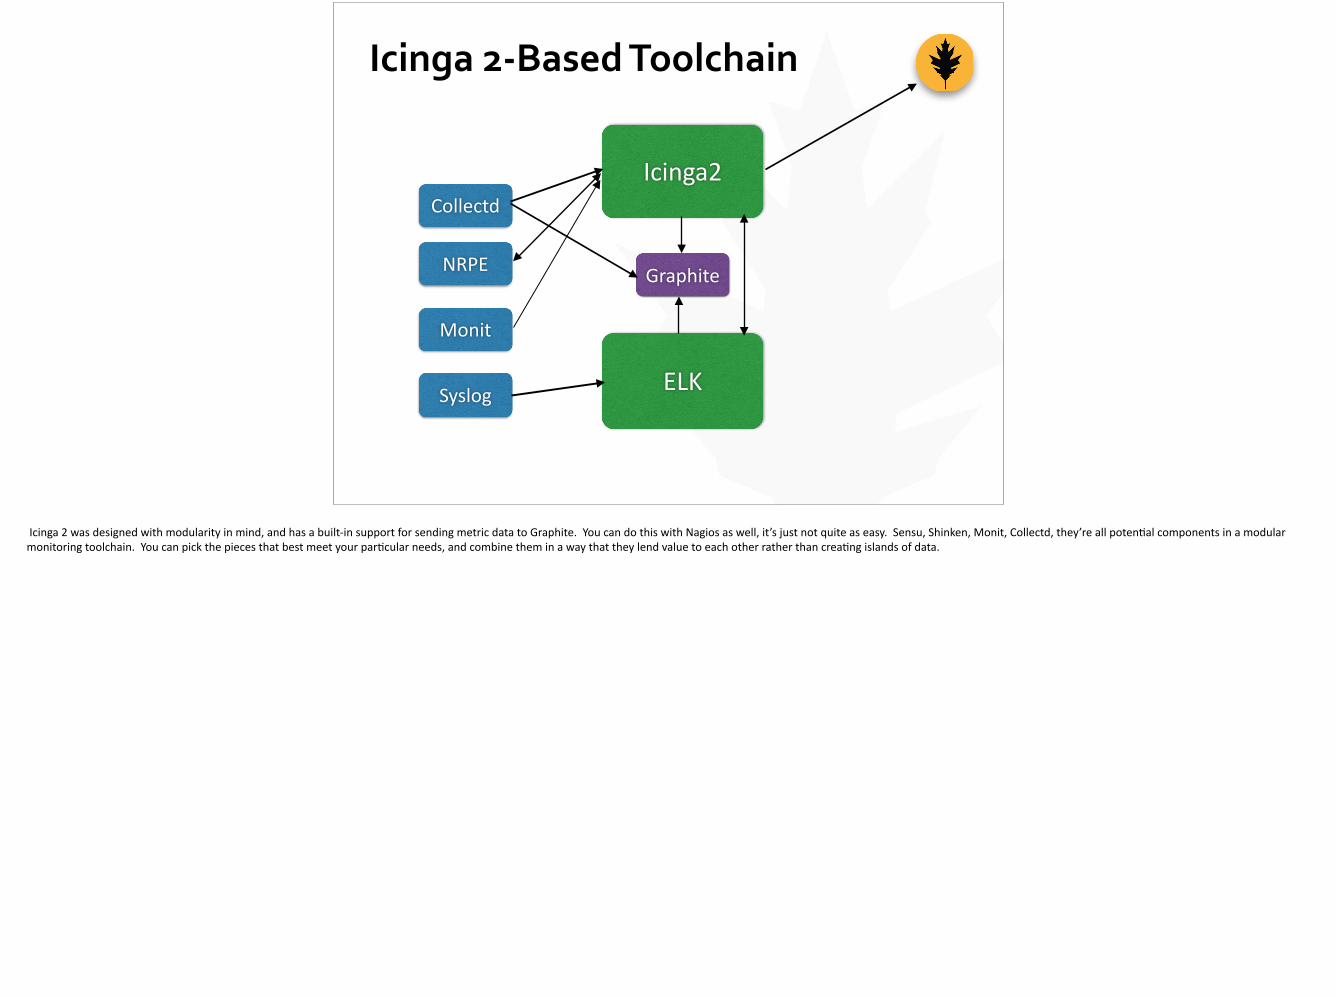
Icinga 2-‐Based Toolchain
Collectd
NRPE
Monit
Icinga2
ELK
Graphite
Syslog
Icinga 2 was designed with modularity in mind, and has a built-‐in support for sending metric data to Graphite. You can do this with Nagios as well, it’s just not quite as easy. Sensu, Shinken, Monit, Collectd, they’re all poten;al components in a modular monitoring toolchain. You can pick the pieces that best meet your par;cular needs, and combine them in a way that they lend value to each other rather than crea;ng islands of data.

The current genera;on of open-‐source monitoring tools is giving us easier access to deep insight, be[er visibility into faults, and amazing interoperability. These solu;ons are quickly becoming cri;cal sources of not just opera;onal and developmental intelligence, but of business intelligence that has value outside of technical departments. This helps Dev, DevOps and IT teams more effec;vely communicate their overall value, and makes life a lot easer managing high-‐demand 24/7 plauorms. The technology is moving way too fast for “Enterprise” solu;ons to keep pace, meaning that as a user of open-‐source monitoring solu;ons, you don’t have to wonder what you’re missing out on from commercial products. Open-‐source is now at the vanguard of monitoring and telemetry so]ware development, and it’s a great ;me to be involved.

@vo_mike
If you have any ques;ons, I’d love to answer them now.