open pharmaceutical sciences journal€¦ · · 2017-05-15believed to be dependent on the state...
TRANSCRIPT
Send Orders for Reprints to [email protected]
32 Open Pharmaceutical Sciences Journal, 2017, 4, 32-42
1874-8449/17 2017 Bentham Open
Open Pharmaceutical Sciences Journal
Content list available at: www.benthamopen.com/PHARMSCI/
DOI: 10.2174/1874844901704010032
RESEARCH ARTICLE
High Performance Liquid Chromatography (HPLC) StabilityIndicating Method for the Determination of Bromazepam Via itsCopper (II) Chelates
Assefa Takele1, Abdel-Maaboud I. Mohamed Attaya2, Ariaya Hymete3 and Melisew TadeleAlula4,5,*
1Department of Chemistry & Pharmacy; Faculty of Science and Technology, University of Algarve, Faro, Portugal2Department of Pharmaceutical Analytical Chemistry, Faculty of Pharmacy, Assiut University, Assiut, Egypt3Department of Pharmaceutical Chemistry, School of Pharmacy, Addis Ababa University, Addis Ababa, Ethiopia4Department of Chemical and Forensic Sciences; College of Science, Botswana International University of Science andTechnology, Palapye, Botswana5Department of Chemistry; College of Science; Bahir Dar University, Bahir Dar, Ethiopia
Received: January 19, 2017 Revised: March 08, 2017 Accepted: March 31, 2017
Abstract:
Introduction:
Bromazepam is hydrolyzed in acidic aqueous solution leading to a series of degradation products. The rate of acidic hydrolysis isbelieved to be dependent on the state of protonation of the pyridyl and azomethine nitrogen atoms. Stability test is important inpharmaceutical industry to provide evidence on how the quality of an active substance or pharmaceutical product varies with timeunder the influence of a variety of environmental factors.
Objective:
The aim of the study was to develop a simple stability indicating method for the determination of bromazepam.
Method:
Bromazepam solution was prepared and forced degradation of bromazepam was performed under acid hydrolysis using sulphuricacid. High performance liquid chromatography determination of pure and degraded bromazepam and bromazepam-copper (II)complex was performed using reversed phase octyl C-8 column under isocratic conditions and the chromatographic conditions wereset as follows; the flow rate of the mobile phase was 1.5 mL/min; injection volume was 10 μL, column temperature was 30oC and thedetector wavelength being 309 nm.
Results:
Bromazepam, its degradation product and bromazepam chelated with copper (II) were determined using the developed mobile phasewith flow rate of 1.5 mL/min. Good separation with sharp peak, minimum tailing and retention time repeatability was obtained. Therate order, rate constant and half-life of degradation were also determined, and it was observed that the degradation reaction followsthe first order kinetics.
* Address correspondence to this author at the Department of Chemical and Forensic Sciences; College of Science, Botswana International Universityof Science and Technology, Palapye, Plot 10071, Private Bag 16, Botswana; Tel: +26777424353; Fax: +267-4900102; E-mails: [email protected],[email protected]
High Performance Liquid Chromatography (HPLC) Open Pharmaceutical Sciences Journal, 2017, Volume 4 33
Conclusion:
Chromatographic separation of bromazepam chelated with copper (II) was achieved and the method can be further used in drugmanufacturing quality control.
Keywords: Bromazepam, HPLC, Method development, Stability, Anxiolytics, Kinetic study.
1. INTRODUCTION
Anxiolytics are drugs used to relieve anxiety or prevent anxiety attack which is broadly defined as a state ofunwarranted or inappropriate worry, often accompanied by restlessness, tension, destruction, irritability, and sleepdisturbances [1]. Benzodiazepines are among the most frequently used psychotropic drugs because of their efficiency,rapid effect and low toxicity. Since the introduction of the first benzodiazepine, chlordiazepoxide, in 1960, more than50 benzodiazepine drugs has been made available for the treatment of anxiety.
Bromazepam (C14H10BrN3O), chemically known as 7-bromo-1, 3-dihydro-5(2-pyridyl)-2H-1, 4-benzodiazepin-2-one, is a member of the 1, 4-benzodiazepine drug that was first synthesized by Fryer, in 1964 [2, 3]. Bromazepam, likemost of the benzodiazepine derivatives, is hydrolyzed in acidic aqueous solution leading to a series of degradationproducts [2]. The rate of acidic hydrolysis of bromazepam is believed to be dependent on the state of protonation of thepyridyl and azomethine nitrogen atoms [4, 5]. It is hydrolyzed in acidic condition via intermediate product to give thefinal product of 2(2-amino-5-bromobenzoyl) pyridine (II) and glycine [6, 7].
Different methods such as non-aqueous titration [8] flow injection [9], sequential injection [10], voltammetric [4,11], spectrophotometric [12, 13], chromatographic [14 - 16], capillary electrophoresis [17], and ion selective sensormethods [18] have been reported for the determination of bromazepam in pharmaceutical preparations, blood andplasma. Though BP recommends non-aqueous titration and spectrophotometric methods for the analysis ofbromazepam in raw materials [8], there is no official method for its analysis in tablets.
In addition to determination of the active components in a specific drug, stability test is important in pharmaceuticalindustry to provide evidence on how the quality of an active substance or pharmaceutical product varies with time underthe influence of a variety of environmental factors such as temperature, humidity, and light.
Although different chromatographic methods such as thin layer chromatography (TLC) [19, 20], HPTLC [21, 22],and gas chromatography (GC) [23, 24] have been reported for stability indicating assay, their application is limited; forexample, the variability and non-quantitative nature of TLC, expensiveness of HPTLC, and thermally unstability of thedrug in case of GC can be taken as limitations.
Alternatively, HPLC has been very widely employed. It has been used in stability studies due to its high resolutioncapacity, sensitivity and specificity. Non- volatile, thermally unstable or polar/ionic compounds can also be analyzed bythis technique. Therefore, most of the stability indicating assay methods have been established using HPLC [25, 26].Therefore, in this study, we developed a simple analytical and stability indicating method for the determination ofbromazepam based on bromazepam-copper (II) complex formation using the –N=C-C=N- moiety, that enablesbromazepam to form complex with some divalent metal ions such as copper (II), cobalt (II), nickel (II) and iron (II)[11].
2. EXPERIMENTAL
2.1. Chemicals and Solvents
Bromazepam (of 99.3% purity) working standard was obtained from Remedica Pharmaceuticals Ltd. (Remedica,Cyprus). HPLC grade methanol and acetonitrile, methanol absolute acetone free, copper (II) nitrate, ammonium acetate,potassium dihydrogen phosphate, glacial acetic acid, sodium hydroxide, chloroform and acetone were purchased fromFisher Scientific (UK). Sulfuric acid was obtained from BDH (England). Bromazepam tablets (Lexotanil®, Roche,Switzerland) were obtained from local pharmacy in Addis Ababa, Ethiopia. Deionized water was used throughout theexperimental works.
2.2. Instruments and Equipment
Spectronic unicam Ultraviolet-visible double beam spectrophotometer (model number-UVA 083430 type Helisonalpha) using 1 cm quartz cells was used to obtain UV-visible spectra by scanning from 200 to 500 nm wavelength
34 Open Pharmaceutical Sciences Journal, 2017, Volume 4 Takele et al.
range. HPLC with Ultraviolet-visible detector (Shimadzu, Class VP, Japan) equipped with degasser unit (DGU-20As),pumping system (LC-20AT), auto sampler unit (SIL-20A), column oven (CTO-20AC), Ultraviolet-visible detector(SPD-20AV), communication bus module (CBM-20A), personal computer installed with class VP software for dataintegration and analysis was used for HPLC analysis.
2.3. Preparations of Solutions
2.3.1. Preparation of Bromazepam-Copper (II) Complex
Initially 500 μg/mL methanolic standard bromazepam solution was prepared and the working solutions wereprepared from the standard solution just before the experiments. Similarly standard copper (II) solution was prepared bydissolving 60.5 mg of copper (II) nitrate in 50 mL volumetric flask using methanol as the solvent. From these solutionsbromazepam- Cu (II) complex was prepared.
2.3.2. Preparation of Degraded Bromazepam Solution for Kinetic Study
Forced degradation of bromazepam was performed under acid hydrolysis using 10 N sulphuric acid. Laboratorydegraded bromazepam solution (200 μg/mL) was prepared by taking 50 mg of pure bromazepam in a quick fit flask andthen adding 10 mL of 10 N sulfuric acid. This solution was refluxed in boiling water bath for 3 hours and thenneutralized with 10 N sodium hydroxide. The mixture was then quantitatively transferred into a separatory funnel andextracted with 15 mL diethyl ether three times by shaking with magnetic shaker for 10 minutes. The ether extracts(upper layers) were collected in an evaporating dish and evaporated to dryness in a hot water bath (approximately 50oC)and dried in a vacuum desiccator over sulfuric acid for 30 minutes. Finally, the residue was transferred to a 250 mlvolumetric flask with methanol. The degraded was tested for its complete degradation by TLC using silica gel 60 F254
plates and a mobile phase of chloroform: acetone (4:1, v/v), and chloroform: methanol (2:1, v/v). The developed platewas visualized under UV light at 254 nm.
2.3.3. Sample Preparation Using the Dosage Form
Twenty tablets were taken and their mean weight was determined. They were powdered with mortar and pestle andmixed to homogeneity. The powdered tablets equivalent to 25 mg of bromazepam was weighed and transferred into a250 mL beaker. The drug from the powder was extracted three times with 80 mL of methanol at a time. To ensurecomplete extraction of the drugs, the mixture was sonicated for about 20 minutes before separation of the two phases.Whatman filter paper wetted with methanol was used to filter the resulting methanol extract and diluted in 250 mLvolumetric flask using methanol.
2.4. Chromatographic Condition
Chromatographic separation of bromazepam chelated with copper (II) was performed using reversed phase octylC-8 column (Beckman) (250 x 4.6 mm internal diameter and 5 μm particle size). Separation was achieved underisocratic conditions using a mobile phase consisting of a mixture of HPLC grade methanol and acetonitrile, and buffer(26.5:21.5:52). The buffer was composed of 0.005 M potassium dihydrogen phosphate and 0.1 M ammonium acetateadjusted to pH 6.2 with 0.1 M glacial acetic acid. The mobile phase was filtered through a 0.45 μm Millipore filter anddegassed in ultrasonic bath prior to use. HPLC measurements were done by setting the conditions as follows: the flowrate of the mobile phase was 1.5 mL/min; injection volume was 10 μL, column temperature was 30oC with the detectorwavelength of 309 nm. Then, the condition of chromatographic system assumed to give good separation efficiency suchas good resolution between peaks, minimum tailing or fronting and retention time repeatability were optimized.
2.5. UV-Visible Spectrophotometry and HPLC Measurements
2.5.1. UV-Visible Spectrophotometric Measurement of Pure Bromazepam Solution
The maximum absorbance of bromazepam solution was determined from working solutions of bromazepam ofconcentration 10, 15, 20, 30, 40 and 50 µg/mL. Similarly, for the degraded bromazepam solution, three solutions ofconcentrations 16, 20 and 50 µg/mL were taken and scanned with the same wavelength range.
2.5.2. UV-Visible Spectrophotometric Measurement Bromazepam-Copper (II) Complex
A range of bromazepam solution (10 to 50 µg/mL) were prepared and transferred to 50 mL volumetric flasks
High Performance Liquid Chromatography (HPLC) Open Pharmaceutical Sciences Journal, 2017, Volume 4 35
followed by addition of 2.5 mL of copper (II) nitrate stock solution and completed to volume with methanol and thenscanned. Similarly, for the complex of degraded bromazepam with copper (II), degraded bromazepam solution (16, 20and 50 µg/mL) were prepared and transferred to a 50 mL volumetric flasks followed by addition of 2.5 mL of copper(II) nitrate stock solution and completed to volume with methanol. The resulting solutions were sonicated andabsorbance measurements were done.
2.5.3. HPLC Determination of Pure and Degraded Bromazepam
For HPLC determination of pure bromazepam 10, 15 and 25 mL were taken from the working solution andtransferred to 50 mL volumetric flask and completed to volume with methanol. Then the solutions were sonicated forabout 20 minutes and filtered through a 0.45 µm Millipore filter and injected into the HPLC column. Similarly, fordegraded bromazepam 5, 7.5 and 12.5 mL were taken from the stock solution and transferred to 50 mL volumetric flaskand completed to volume with methanol. Then the solutions were sonicated for about 20 minutes and filtered through a0.45 µm Millipore filter and injected into the HPLC column.
2.5.4. HPLC Determination of Bromazepam-Copper (II) Complex
In order to obtain the calibration curve for bromazepam- copper (II) complex, seven working solutions ofconcentrations 20, 25, 30, 35, 40, 45 and 50 µg/mL were prepared and transferred to a 50 mL volumetric flasksfollowed by addition of 2.5 mL of copper (II) nitrate stock solution and completed to volume with methanol. Theresulting solutions sonicated for about 20 minutes and filtered through a 0.45 µm Millipore filter and injected into theHPLC column.
2.5.5. HPLC Determination of the Dosage Form
From the stock sample solution of the dosage form 10 mL was taken and transferred to a 50 mL volumetric flaskfollowed by addition of 2.5 mL of copper (II) nitrate stock solution and completed to volume with methanol. Then theresulting sample solution was sonicated for about 20 minutes and filtered through a 0.45 µm Millipore filter andinjected in triplicate into the HPLC column.
3. RESULTS AND DISCUSSION
3.1. Spectrophotometric Study
Initially, spectrophotometric measurements were performed to study the absorption features of bromazepam,degraded bromazepam, copper (II) solution, bromazepam and degraded bromazepam in the presence of copper (II)solution in wavelength range of 200 to 500 nm.
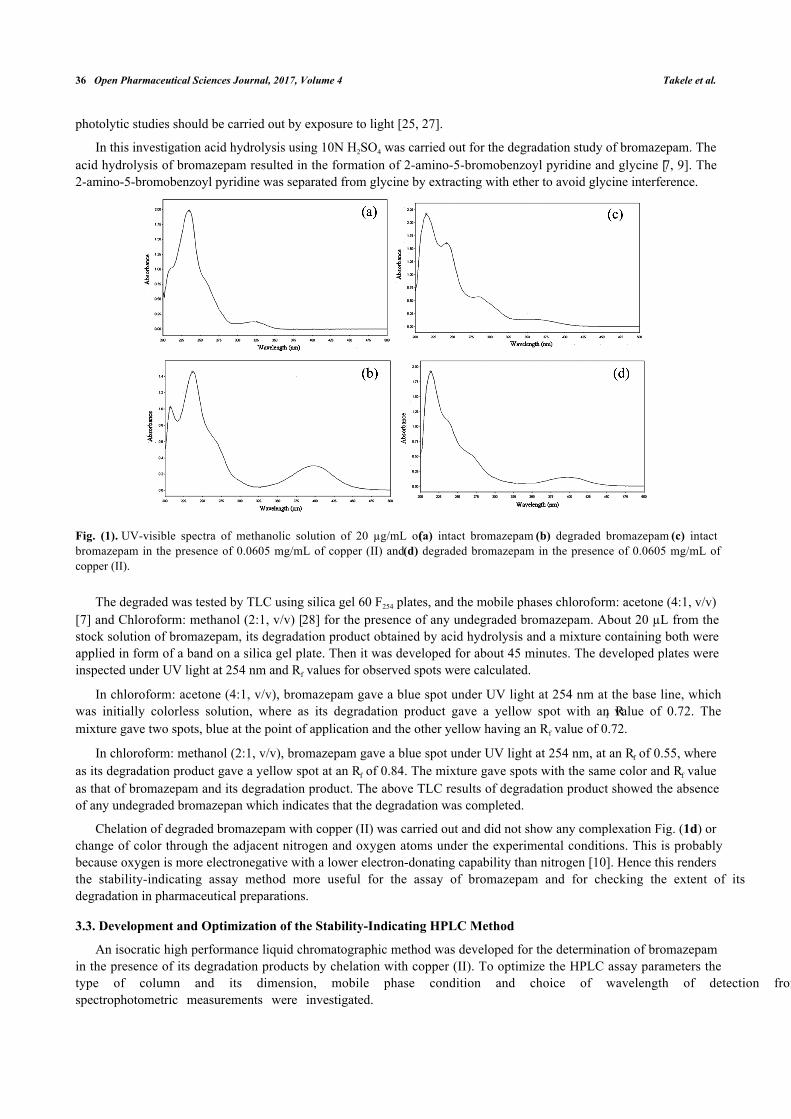
As shown in the UV-visible spectrum of bromazepam in Fig. (1a), two maximum absorption bands were observedat 234 and 325 nm from which 234 nm was selected for HPLC determination of bromazepam for it is more intense.Similarly two maximum absorption bands at 237 and 396 nm were observed for the degradation product ofbromazepam as demonstrated in Fig. (1b). Only one maximum absorbance was available for copper (II) solution around214 nm (spectrum not shown).
Complex formation of copper (II) with bromazepam with copper (II) resulted in appearance of four bands atwavelengths of 214, 241 and 284 nm and a small hump at 357 nm Fig. (1c) and the maximum absorption band at 284was taken for HPLC study of bromazepam-copper (II) complex for 214 and 241 nm could be highly dependent on theconcentration of copper (II) so that band overlaps would be a problem. The two bands that have been observed forcopper (II) and the degraded bromazepam are observed for their mixture UV-visible absorbance spectrum. Theformation of no new bands in the mixture as shown on Fig. (1d) confirms that degraded bromazepam cannot formcomplex with copper (II).
3.2. Forced Degradation Study
Forced decomposition studies were conducted to generate degradation products of the drug for the development ofstability indicating assay method. These studies are employed under different conditions such as hydrolytic, photolyticand oxidative decomposition. The hydrolytic degradation of a drug can be studied by refluxing the drug in acidic andalkaline conditions. In a similar manner, degradation under neutral condition can be studied by refluxing the drug inwater. To test for oxidation, it is suggested to use hydrogen peroxide in the concentration range of 3-30% and the
36 Open Pharmaceutical Sciences Journal, 2017, Volume 4 Takele et al.
photolytic studies should be carried out by exposure to light [25, 27].
In this investigation acid hydrolysis using 10N H2SO4 was carried out for the degradation study of bromazepam. Theacid hydrolysis of bromazepam resulted in the formation of 2-amino-5-bromobenzoyl pyridine and glycine [7, 9]. The2-amino-5-bromobenzoyl pyridine was separated from glycine by extracting with ether to avoid glycine interference.
Fig. (1). UV-visible spectra of methanolic solution of 20 µg/mL of (a) intact bromazepam (b) degraded bromazepam (c) intactbromazepam in the presence of 0.0605 mg/mL of copper (II) and (d) degraded bromazepam in the presence of 0.0605 mg/mL ofcopper (II).
The degraded was tested by TLC using silica gel 60 F254 plates, and the mobile phases chloroform: acetone (4:1, v/v)[7] and Chloroform: methanol (2:1, v/v) [28] for the presence of any undegraded bromazepam. About 20 µL from thestock solution of bromazepam, its degradation product obtained by acid hydrolysis and a mixture containing both wereapplied in form of a band on a silica gel plate. Then it was developed for about 45 minutes. The developed plates wereinspected under UV light at 254 nm and Rf values for observed spots were calculated.
In chloroform: acetone (4:1, v/v), bromazepam gave a blue spot under UV light at 254 nm at the base line, whichwas initially colorless solution, where as its degradation product gave a yellow spot with an Rf value of 0.72. Themixture gave two spots, blue at the point of application and the other yellow having an Rf value of 0.72.
In chloroform: methanol (2:1, v/v), bromazepam gave a blue spot under UV light at 254 nm, at an Rf of 0.55, whereas its degradation product gave a yellow spot at an Rf of 0.84. The mixture gave spots with the same color and Rf valueas that of bromazepam and its degradation product. The above TLC results of degradation product showed the absenceof any undegraded bromazepan which indicates that the degradation was completed.
Chelation of degraded bromazepam with copper (II) was carried out and did not show any complexation Fig. (1d) orchange of color through the adjacent nitrogen and oxygen atoms under the experimental conditions. This is probablybecause oxygen is more electronegative with a lower electron-donating capability than nitrogen [10]. Hence this rendersthe stability-indicating assay method more useful for the assay of bromazepam and for checking the extent of itsdegradation in pharmaceutical preparations.
3.3. Development and Optimization of the Stability-Indicating HPLC Method
An isocratic high performance liquid chromatographic method was developed for the determination of bromazepamin the presence of its degradation products by chelation with copper (II). To optimize the HPLC assay parameters thetype of column and its dimension, mobile phase condition and choice of wavelength of detection fromspectrophotometric measurements were investigated.
High Performance Liquid Chromatography (HPLC) Open Pharmaceutical Sciences Journal, 2017, Volume 4 37
Different types of columns were used, such as ODS-2 C-18 column (Inertrsil), ODS C-18 column (Beckman) andoctyl C-8 column (Beckman) with 250 x 4.6 mm internal diameter and 5 µm particle size.
Different mobile phases with different composition were used, such as acetonitrile and methanol (3:1, v/v);acetonitrile, methanol and 0.1 M acetic acid (3:1:1, v/v/v); methanol, acetonitrile and a mixture of potassiumdihydrogen phosphate and ammonium acetate in the ratio 2:1:1, 1:2:1 and 26.5:21.5:52 (v/v/v) by adjusting the pH withglacial acetic acid. The injection volume was varied from 5 to 20 µL, and the flow rate varied from 0.8 to 2 mL/min.The temperature was varied from 25 to 35oC and that of run time was also varied from 10 to 25 minutes.
We followed Panderi et al. [2] procedure to optimize the conditions for the chromatographic system and resulted ingood separation efficiency such as good resolution between peaks, minimum tailing or fronting and retention timerepeatability.
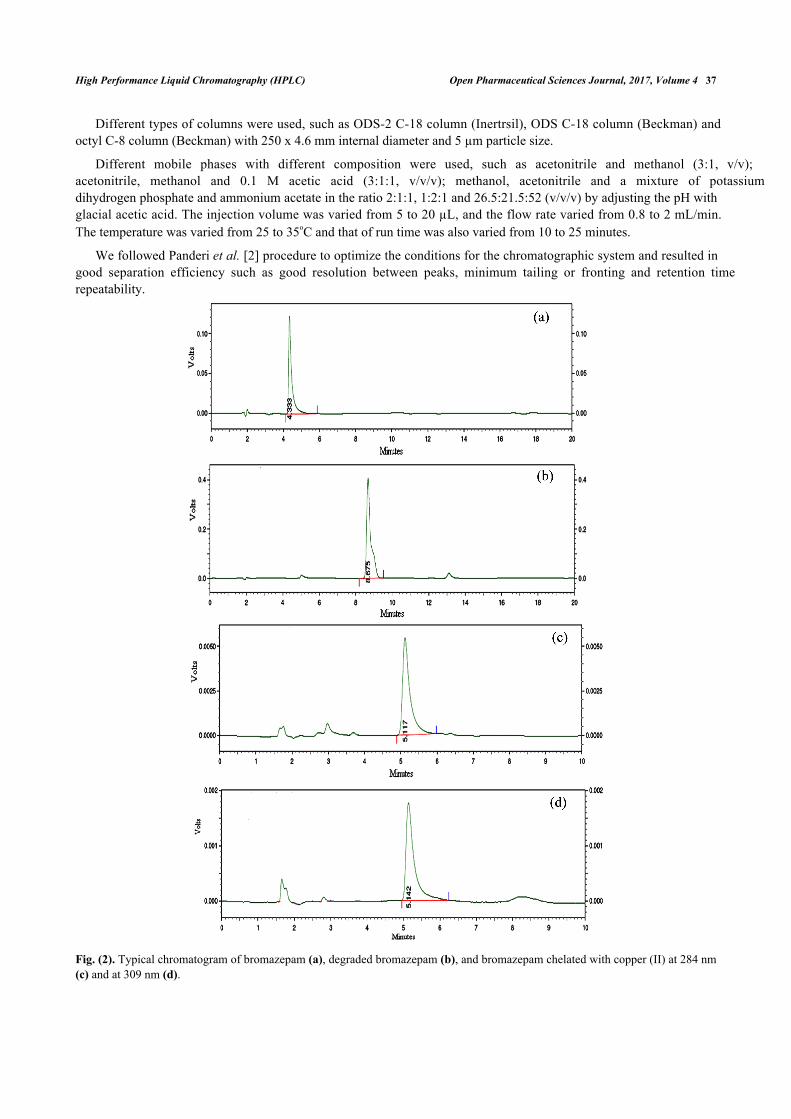
Fig. (2). Typical chromatogram of bromazepam (a), degraded bromazepam (b), and bromazepam chelated with copper (II) at 284 nm(c) and at 309 nm (d).
38 Open Pharmaceutical Sciences Journal, 2017, Volume 4 Takele et al.
3.4. HPLC Determination
Based on the UV-visible spectrophotometric results, bromazepam, its degradation product and bromazepamchelated with copper (II) were determined using the developed mobile phase with flow rate of 1.5 mL/min. The detectorwas set at 234 nm for the determination of bromazepam and its degradation product, and wavelengths of 284 and 309nm were used for the determination of bromazepam chelated with copper (II) as shown in Fig. (2). Good separationwith sharp peak, minimum tailing and retention time repeatability was obtained. Retention time for bromazepam and forits degradation was found to be 4.333 and 8.675 min respectively. Bromazepam chelated with copper (II) had almost thesame retention time of 5.117 and 5.142 min at wavelengths of 284 and 309 nm respectively.
3.5. Hydrolysis of Bromazepam Under Acidic Condition
Benzodiazepines are unstable substances, because they easily hydrolyze in acidic solution and also decompose inUV light. Hydrolysis in acidic solution leads generally to 2-aminobenzophenone derivatives, through the splitting of theN1-C2 bond of the diazepine ring [29]. Bromazepam like most of the benzodiazepine derivatives is hydrolyzed in acidicaqueous solutions leading to a series of degradation products. The mechanism of acid hydrolysis of bromazepamproceeds through the intermediate N-(4-bromo-2(2-pyridylcarbonyl) phenyl)-2-aminoacetamide leading to the finalproducts, 2-amino-5-bromobenzoyl pyridine and glycine. As it was reported, formation of the intermediate is very fastwhile the formation of the final product is rather slow [2].
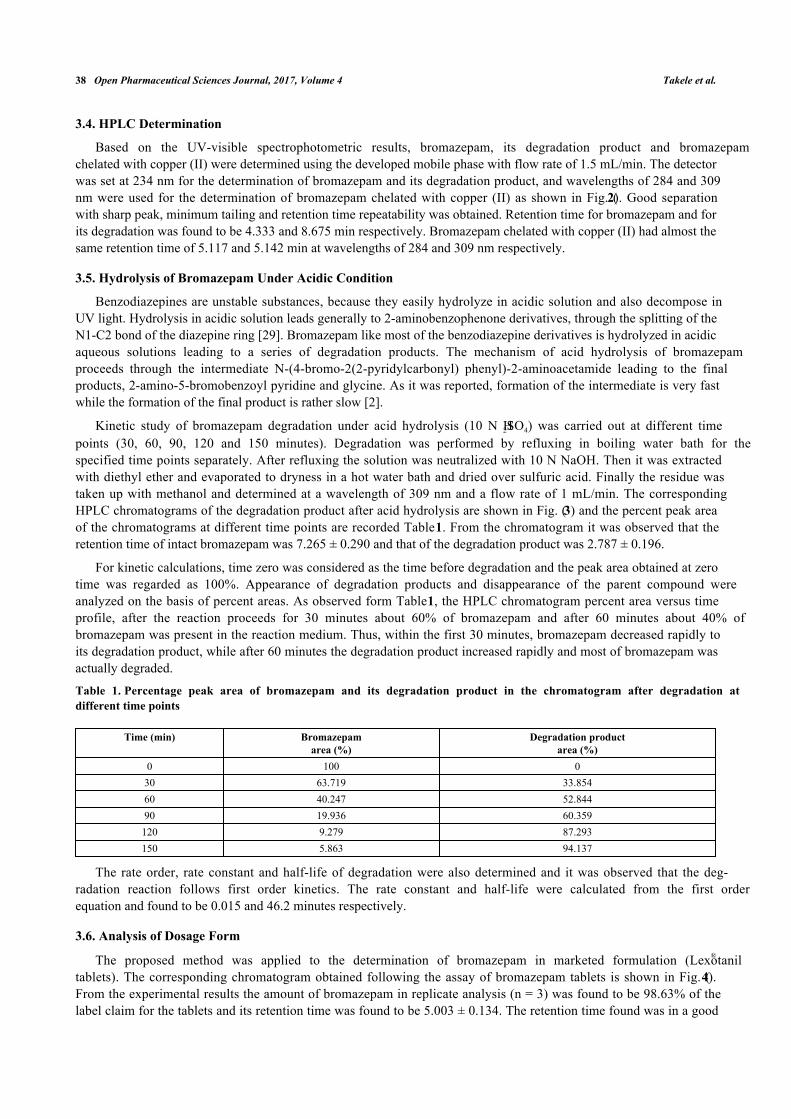
Kinetic study of bromazepam degradation under acid hydrolysis (10 N H2SO4) was carried out at different timepoints (30, 60, 90, 120 and 150 minutes). Degradation was performed by refluxing in boiling water bath for thespecified time points separately. After refluxing the solution was neutralized with 10 N NaOH. Then it was extractedwith diethyl ether and evaporated to dryness in a hot water bath and dried over sulfuric acid. Finally the residue wastaken up with methanol and determined at a wavelength of 309 nm and a flow rate of 1 mL/min. The correspondingHPLC chromatograms of the degradation product after acid hydrolysis are shown in Fig. (3) and the percent peak areaof the chromatograms at different time points are recorded Table 1. From the chromatogram it was observed that theretention time of intact bromazepam was 7.265 ± 0.290 and that of the degradation product was 2.787 ± 0.196.
For kinetic calculations, time zero was considered as the time before degradation and the peak area obtained at zerotime was regarded as 100%. Appearance of degradation products and disappearance of the parent compound wereanalyzed on the basis of percent areas. As observed form Table 1, the HPLC chromatogram percent area versus timeprofile, after the reaction proceeds for 30 minutes about 60% of bromazepam and after 60 minutes about 40% ofbromazepam was present in the reaction medium. Thus, within the first 30 minutes, bromazepam decreased rapidly toits degradation product, while after 60 minutes the degradation product increased rapidly and most of bromazepam wasactually degraded.
Table 1. Percentage peak area of bromazepam and its degradation product in the chromatogram after degradation atdifferent time points
Time (min) Bromazepamarea (%)
Degradation productarea (%)
0 100 030 63.719 33.85460 40.247 52.84490 19.936 60.359120 9.279 87.293150 5.863 94.137
The rate order, rate constant and half-life of degradation were also determined and it was observed that the deg-radation reaction follows first order kinetics. The rate constant and half-life were calculated from the first orderequation and found to be 0.015 and 46.2 minutes respectively.
3.6. Analysis of Dosage Form
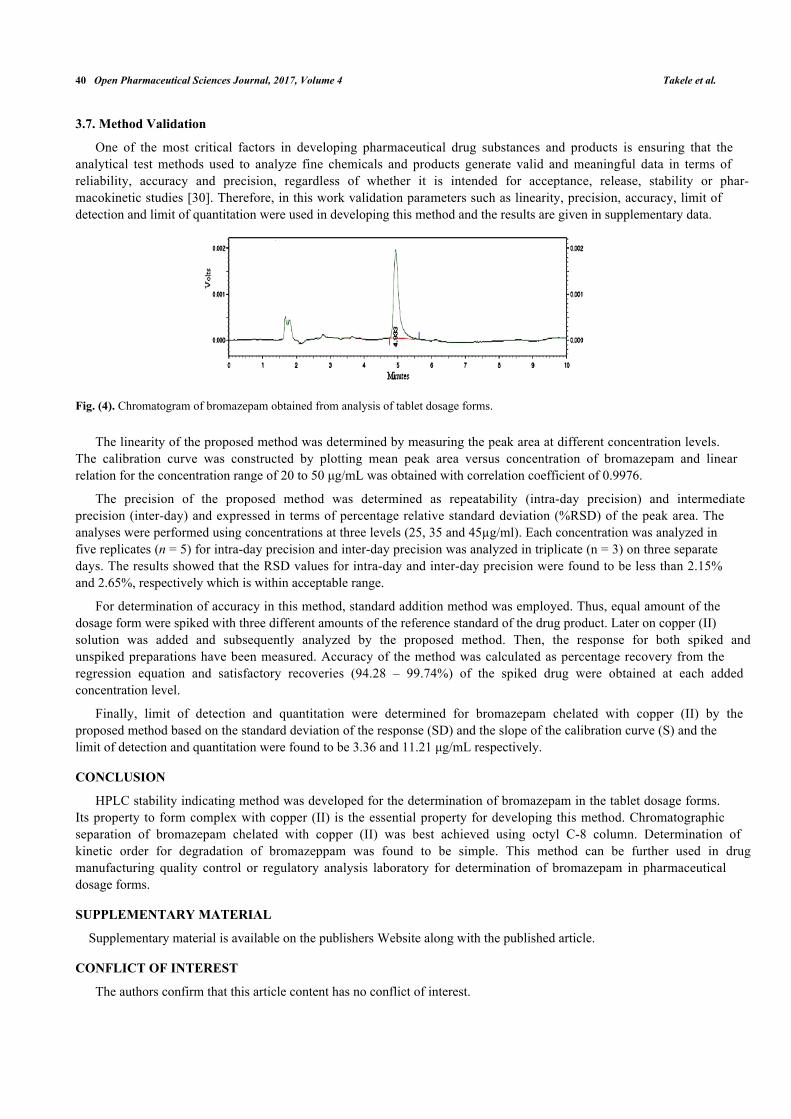
The proposed method was applied to the determination of bromazepam in marketed formulation (Lexotanil®
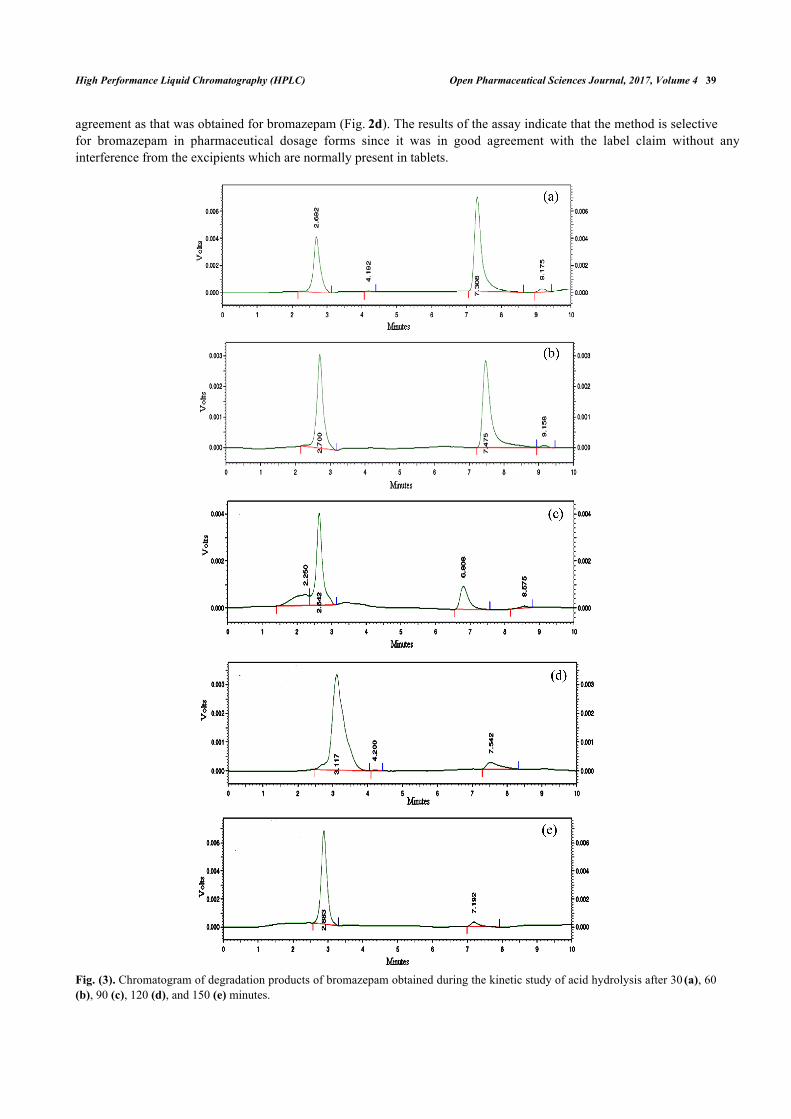
tablets). The corresponding chromatogram obtained following the assay of bromazepam tablets is shown in Fig. (4).From the experimental results the amount of bromazepam in replicate analysis (n = 3) was found to be 98.63% of thelabel claim for the tablets and its retention time was found to be 5.003 ± 0.134. The retention time found was in a good
High Performance Liquid Chromatography (HPLC) Open Pharmaceutical Sciences Journal, 2017, Volume 4 39
agreement as that was obtained for bromazepam (Fig. 2d). The results of the assay indicate that the method is selectivefor bromazepam in pharmaceutical dosage forms since it was in good agreement with the label claim without anyinterference from the excipients which are normally present in tablets.
Fig. (3). Chromatogram of degradation products of bromazepam obtained during the kinetic study of acid hydrolysis after 30 (a), 60(b), 90 (c), 120 (d), and 150 (e) minutes.
40 Open Pharmaceutical Sciences Journal, 2017, Volume 4 Takele et al.
3.7. Method Validation
One of the most critical factors in developing pharmaceutical drug substances and products is ensuring that theanalytical test methods used to analyze fine chemicals and products generate valid and meaningful data in terms ofreliability, accuracy and precision, regardless of whether it is intended for acceptance, release, stability or phar-macokinetic studies [30]. Therefore, in this work validation parameters such as linearity, precision, accuracy, limit ofdetection and limit of quantitation were used in developing this method and the results are given in supplementary data.
Fig. (4). Chromatogram of bromazepam obtained from analysis of tablet dosage forms.
The linearity of the proposed method was determined by measuring the peak area at different concentration levels.The calibration curve was constructed by plotting mean peak area versus concentration of bromazepam and linearrelation for the concentration range of 20 to 50 μg/mL was obtained with correlation coefficient of 0.9976.
The precision of the proposed method was determined as repeatability (intra-day precision) and intermediateprecision (inter-day) and expressed in terms of percentage relative standard deviation (%RSD) of the peak area. Theanalyses were performed using concentrations at three levels (25, 35 and 45µg/ml). Each concentration was analyzed infive replicates (n = 5) for intra-day precision and inter-day precision was analyzed in triplicate (n = 3) on three separatedays. The results showed that the RSD values for intra-day and inter-day precision were found to be less than 2.15%and 2.65%, respectively which is within acceptable range.
For determination of accuracy in this method, standard addition method was employed. Thus, equal amount of thedosage form were spiked with three different amounts of the reference standard of the drug product. Later on copper (II)solution was added and subsequently analyzed by the proposed method. Then, the response for both spiked andunspiked preparations have been measured. Accuracy of the method was calculated as percentage recovery from theregression equation and satisfactory recoveries (94.28 – 99.74%) of the spiked drug were obtained at each addedconcentration level.
Finally, limit of detection and quantitation were determined for bromazepam chelated with copper (II) by theproposed method based on the standard deviation of the response (SD) and the slope of the calibration curve (S) and thelimit of detection and quantitation were found to be 3.36 and 11.21 μg/mL respectively.
CONCLUSION
HPLC stability indicating method was developed for the determination of bromazepam in the tablet dosage forms.Its property to form complex with copper (II) is the essential property for developing this method. Chromatographicseparation of bromazepam chelated with copper (II) was best achieved using octyl C-8 column. Determination ofkinetic order for degradation of bromazeppam was found to be simple. This method can be further used in drugmanufacturing quality control or regulatory analysis laboratory for determination of bromazepam in pharmaceuticaldosage forms.
SUPPLEMENTARY MATERIAL
Supplementary material is available on the publishers Website along with the published article.
CONFLICT OF INTEREST
The authors confirm that this article content has no conflict of interest.
High Performance Liquid Chromatography (HPLC) Open Pharmaceutical Sciences Journal, 2017, Volume 4 41
ACKNOWLEDGEMENTS
The authors thank Gulele Education Bureau and Addis Ababa University for the financial support and Ethiopianpharmaceutical manufacturing (EPHARM) for the laboratory facilities.
REFERENCES
[1] Sandford JJ, Argyropoulos SV, Nutt DJ. The psychobiology of anxiolytic drugs. Part 1: Basic neurobiology. Pharmacol Ther 2000; 88(3):197-212.[http://dx.doi.org/10.1016/S0163-7258(00)00082-6] [PMID: 11337025]
[2] Panderi I, Archontaki H, Gikas E, Parissi-Poulou M. Acidic hydrolysis of bromazepam studied by high performance liquid chromatography.Isolation and identification of its degradation products. J Pharm Biomed Anal 1998; 17(2): 327-35.[http://dx.doi.org/10.1016/S0731-7085(97)00201-X] [PMID: 9638586]
[3] Nevado JJ, Penalvo GC, Bernardo FJ. A contribution on the determination of bromazepam by its ferrous complex formation. Anal Lett 1997;30: 2515-25.[http://dx.doi.org/10.1080/00032719708001762]
[4] Valdeon MJ, Escribano TS, Hernandez L. Determination of bromazepam and its urinary metabolites, with a previous hydrolysis reaction, byvoltametric and spectrophotometric techniques. Analyst (Lond) 1987; 112: 1365-8.[http://dx.doi.org/10.1039/AN9871201365]
[5] Smyth MR, Beng TS, Smyth WF. A spectral and polarographic study of the acidbase and complexing behaviour of bromazepam. Anal ChimActa 1977; 92(1): 129-38.[http://dx.doi.org/10.1016/S0003-2670(01)84579-7] [PMID: 18952]
[6] Tache F, Mutihac L, Medvedovici A, et al. Considerations on MS/MS detection of bromazepam after liquid chromatographic separation fromplasma samples: Application to a bioequivalence study. J Liq Chromatogr Tech 2007; 30: 2699-715.[http://dx.doi.org/10.1080/10826070701560603]
[7] Amer MM, Abdel Razek SA. Stability indicating method for the determination of bromazepam via its mercury (ii), silver (i) and zirconium(iv) chelates. Anal Lett 1998; 31: 631-49.[http://dx.doi.org/10.1080/00032719808001867]
[8] British pharmacopoeia. London: Her Majesty’s Stationary Office Publication 2004.
[9] Sultan SM, Suliman FE. Use of sequential injection technique for mechanistic studies and kinetic determination of bromazepam complexedwith iron (ii) in hydrochloric acid. Analyst (Lond) 1996; 121: 617-21.[http://dx.doi.org/10.1039/an9962100617]
[10] Sultan SM. Flow injection stopped-flow kinetic determination of the anxiolytic sedative bromazepam in dosage forms. Analyst (Lond) 1992;117: 773-6.[http://dx.doi.org/10.1039/an9921700773]
[11] Correia Dos Santos MM, Famila V, Simoes GM. A voltametric study of the complexation of copper by the psychoactive compounds 1,4-benzodiazepines. Electroanalysis 2000; 12: 216-22.[http://dx.doi.org/10.1002/(SICI)1521-4109(200002)12:3<216::AID-ELAN216>3.0.CO;2-Q]
[12] Pencheva I, Obreshkova D. Comparative analytical study of bromazepam in pharmaceutical dosage forms. Acta Pharmaceutica Turcica 2002;44: 52-5.
[13] Salem AA, Barsoum BN, Izake EL. Spectrophotometric and fluorimetric determination of diazepam, bromazepam and clonazepam inpharmaceutical and urine samples. Spectrochim Acta A Mol Biomol Spectrosc 2004; 60(4): 771-80.[http://dx.doi.org/10.1016/S1386-1425(03)00300-7] [PMID: 15036087]
[14] Andraus MH, Wong A, Silva OA, et al. Determination of bromazepam in human plasma by high-performance liquid chromatography withelectrospray ionization tandem mass spectrometric detection: application to a bioequivalence study. J Mass Spectrom 2004; 39(11): 1348-55.[http://dx.doi.org/10.1002/jms.667] [PMID: 15532067]
[15] Zhang XX, Kudo K, Imamura T, Jitsufuchi N, Nagata T. Sensitive determination of bromazepam in human tissues using capillary gaschromatography-mass spectrometry. J Chromatogr B Biomed Appl 1996; 677(1): 111-6.[http://dx.doi.org/10.1016/0378-4347(95)00427-0] [PMID: 8925082]
[16] Chèze M, Villain M, Pépin G. Determination of bromazepam, clonazepam and metabolites after a single intake in urine and hair by LC-MS/MS. Application to forensic cases of drug facilitated crimes. Forensic Sci Int 2004; 145(2-3): 123-30.[http://dx.doi.org/10.1016/j.forsciint.2004.04.066] [PMID: 15451083]
[17] Hansen SH, Sheribah ZA. Comparison of CZE, MEKC, MEEKC and non-aqueous capillary electrophoresis for the determination ofimpurities in bromazepam. J Pharm Biomed Anal 2005; 39(1-2): 322-7.[http://dx.doi.org/10.1016/j.jpba.2005.03.017] [PMID: 15935599]
[18] Al Attas AS. Construction and analytical application of ion selective bromazepam sensor. Int J Electrochem Sci 2009; 4: 20-9.
[19] Fabre H, Hussam-Eddine N. Separation and quantitative determination of dipyrone and its degradation products by thin-layerchromatography. J Pharm Pharmacol 1982; 34: 425-8.
42 Open Pharmaceutical Sciences Journal, 2017, Volume 4 Takele et al.
[http://dx.doi.org/10.1111/j.2042-7158.1982.tb04749.x] [PMID: 6126537]
[20] Baveja SK, Singh S. Thin-layer chromatographic examination of the degradation of centbucridine in aqueous solutions. J Chromatogr A 1987;396: 337-44.[http://dx.doi.org/10.1016/S0021-9673(01)94071-3] [PMID: 3624379]
[21] Puthli SP, Vavia PR. Stability indicating HPTLC determination of piroxicam. J Pharm Biomed Anal 2000; 22(4): 673-7.[http://dx.doi.org/10.1016/S0731-7085(99)00300-3] [PMID: 10768357]
[22] Salo JP, Salomies H. High performance thin layer chromatographic analysis of hydrolyzed tinidazole solutions. I. Development and validationmethod. J Pharm Biomed Anal 1996; 14(8-10): 1261-6.[http://dx.doi.org/10.1016/S0731-7085(96)01769-4] [PMID: 8818043]
[23] Bergh JJ, Lotter AP. A stability-indicating gas-liquid chromatographic method for the determination of acetaminophen and aspirin insuppositories. Drug Dev Ind Pharm 1984; 10: 127-36.[http://dx.doi.org/10.3109/03639048409038297]
[24] Stavchansky S, Wu P, Wallace JE. Gas liquid chromatographic determination of promethazine hydrochloride in cocoa butter-white waxsuppositories. Drug Dev Ind Pharm 1983; 9: 989-98.[http://dx.doi.org/10.3109/03639048309042837]
[25] Bakshi M, Singh S. Development of validated stability-indicating assay methodscritical review. J Pharm Biomed Anal 2002; 28(6): 1011-40.[http://dx.doi.org/10.1016/S0731-7085(02)00047-X] [PMID: 12049968]
[26] Blessy M, Patel RD, Prajapati PN, Agrawal YK. Development of forced degradation and stability indicating studies of drugs-A review. JPharm Anal 2014; 4: 159-65.[http://dx.doi.org/10.1016/j.jpha.2013.09.003]
[27] Singh S, Bakshi SM. Guidance on the conduct of stress tests to determine inherent stability of drugs. Pharm Technol 2000; 24: 1-14.
[28] Fukumato M, Cornning KK. Spectrophotometric determination of bromazepam. Chem Pharm Bull (Tokyo) 1980; 28: 3678-81.[http://dx.doi.org/10.1248/cpb.28.3678]
[29] Hancu G, Gáspár A, Gyéresi A. Separation of 1,4-benzodiazepines by micellar elektrokinetic capillary chromatography. J Biochem BiophysMethods 2007; 69(3): 251-9.[http://dx.doi.org/10.1016/j.jbbm.2006.02.003] [PMID: 16563516]
[30] Shabir GA. Validation of high-performance liquid chromatography methods for pharmaceutical analysis. Understanding the differences andsimilarities between validation requirements of the US Food and Drug Administration, the US Pharmacopeia and the International Conferenceon Harmonization. J Chromatogr A 2003; 987(1-2): 57-66.[http://dx.doi.org/10.1016/S0021-9673(02)01536-4] [PMID: 12613797]
© 2017 Takele et al.
This is an open access article distributed under the terms of the Creative Commons Attribution 4.0 International Public License (CC-BY 4.0), acopy of which is available at: https://creativecommons.org/licenses/by/4.0/legalcode. This license permits unrestricted use, distribution, andreproduction in any medium, provided the original author and source are credited.