open access identification and characterization of skin ... · open access identification and...
TRANSCRIPT
38 The Open Medicinal Chemistry Journal, 2008, 2, 38-48
1874-1045/08 2008 Bentham Open
Open Access
Identification and Characterization of Skin Biomolecules for Drug Targeting and Monitoring by Vibrational Spectroscopy
Natalja Skrebova Eikje*,1
, Katsuo Aizawa1, Takayuki Sota
1, Yukihiro Ozaki
2 and Seiji Arase
3
1Department of Electrical Engineering and Bioscience, Waseda University, Tokyo, Japan
2Department of Chemistry, School of Science and Technology, Kwansei-Gakuin University, Hyogo, Japan
3Department of Dermatology, School of Medicine, Tokushima University, Tokushima, Japan
Abstract: The article discusses the application of vibrational spectroscopy techniques for in vivo identification and
characterization of glucose biomolecules monitored in the skin of healthy, prediabetes and diabetes subjects; for
molecular characterization of water and proteins in in vivo monitored patch tested inflamed skin of the patients with
contact dermatitis; for description of nucleic acids and proteins at the molecular level with progression to malignancy in
skin cancerous lesions. The results of the studies show new possibilities to assess activity levels of glucose metabolism in
the skin tissue of healthy, prediabetes and diabetes subjects; activity and severity of inflammation; activity of the
processes of carcinogenesis with regard to benign, premalignant and malignant transformation. Based on our findings, we
suggest that vibrational spectroscopy might be a rapid screening tool with sufficient sensitivity and specificity to identify and
characterize skin biomolecules in described diseases for drug targeting and monitoring by the pharmacological community.
Keywords: Vibrational spectroscopy, Raman spectroscopy, infrared spectroscopy, skin biomolecules, molecular diagnosis,
molecular characterization, skin monitoring, skin cancer, skin inflammation, skin glucose.
INTRODUCTION
Vibrational spectroscopy, both infrared (IR) and Raman,
is a well-known structural and analytical laboratory method,
because of the high sensitivity of vibrational spectra to
characterize structures of biological molecules – water,
proteins, nucleic acids, lipids, carbohydrates, etc. [1]. Due to
the fact that IR and Raman spectroscopies are also highly
sensitive to detect structural changes with the diseased state,
vibrational spectroscopy has recently received much
attention from the medical community, including
dermatology, as a new promising tool for rapid,
highly-informative, non-destructive, qualitative and (semi-)
quantitative molecular characterization of normal and
pathological tissues in vitro, ex vivo and in vivo [1-7].
The skin is a very complex and heterogeneous tissue.
However, as the human body, on a simple level, is composed
primarily of biomolecules of water, proteins, nucleic acids,
lipids and carbohydrates, the relative ratios and the absolute
concentrations of each of them can be determined in vibra-
tional spectra.
Isolated biomolecules of the nucleic acids, water, pro-
teins, lipids, carbohydrates and others have been intensively
studied and well-described by vibrational spectroscopy tech-
niques [1].
IR spectroscopy has an advantage to identify and
characterize nucleic acids, in comparison to Raman
*Address correspondence to this author at the Department of Electrical
Engineering and Bioscience, Waseda University, 3-4-1 Ohkubo, Shinjuku-
ku, Tokyo 169-8555, Japan;
E-mail: [email protected]; [email protected]
spectroscopy, which provides information related to individual
nucleotides only. So, IR spectra in the 1620-1750 cm-1
region
corres-ponds to in-plane double-bond vibrations of the bases;
the 1230 cm-1
and 1090 cm-1
bands are assigned to antisym-
metric and symmetric phosphate stretching vibrations, re-
spectively; ribose has a strong C-O band at 1120 cm-1
[1, 3].
Both IR and Raman provide information on the secon-
dary structure of proteins, ligand interactions and folding. In
the vibrational spectra, amide I in the 1600-1700 cm-1
region
is by far the best characterized, which is due mostly to the
C=O stretching vibrations of the peptide backbone. The
amide II band in the 1480-1575 cm-1
region, due largely to a
coupling of CN stretching and in-plane bending of N-H
group, is strong in IR, but extremely weak in Raman. The
amide III band in the 1230-1300 cm-1
region, arising from
coupling of C-N stretching and N-H bending, is fairly weak
in IR but quite strong in Raman [1, 3].
The major absorption bands of lipids are at 1738, 1465,
1255, 1168, 1095, 1057 and 968 cm-1
[1, 3].
Sugars are the most common carbohydrates. They are
presented in biological media primarily as hexose sugars,
such as glucose, and as pentose sugars, mainly as the ribose
component of the nucleic acid backbone of DNA and RNA.
Polysaccharides in the body are found either in a free state or
combined with proteins, in a complex known as glycopro-
teins. The only polysaccharide in the body that is not bound
to a protein is glycogen, the spectrum of which is highly de-
pendent on the degree of hydration. The major absorption
bands of glycogen in solution are observed in IR spectra at
1153, 1105, 1082, 1043, 1025, 996 (weak shoulder) and 931
cm-1
. The corresponding bands for the solid spectrum are
Identification and Characterization of Skin Biomolecules The Open Medicinal Chemistry Journal, 2008, Volume 2 39
1149, 1078, 1043 (weak shoulder), 1016, 996 and 931 cm1
[1].
As a consequence of the complexity of skin tissue, com-
prising several components and various cell types, the band
assignment of different biomolecules in vibrational spectra
of the skin is difficult, especially in the diseased state, be-
cause it is influenced by numerous intermolecular interac-
tions. Therefore, it is important not only to identify (facili-
tate) and compare the band assignment of spectra of major
constituents of skin and its compounds in normal and patho-
logical tissue, but also to molecularly characterize them with
regard to numerous skin diseases and conditions. Since all
diseased states and conditions, without exception, are caused
by fundamental alterations in cellular and/or tissue bioche-
mistry due to specific changes in one or all biomolecular
components, then these changes should be reflected in vibra-
tional spectra and, in principle, may to be further used as
phenotypic markers of the diseases for diagnoses, drug tar-
geting and monitoring [1, 6].
Such an approach would be much needed in the new
fields of applications, such as the individualization of drug or
treatment in certain diseases and monitoring the effects of
therapies, based on the already demonstrated potential of IR
and Raman spectroscopies to non-invasively diagnose and
continuously monitor patients in the clinical environment. At
a more fundamental level, the in-depth analysis of the wealth
of information contained in IR- and Raman spectra of certain
skin diseases about specific molecular composition and
structure can be used not only to further explore pathological
processes and their progression, but also to further transform
for directing real-time therapeutic intervention.
In this article we discuss the state of the art of applying
vibrational spectroscopy techniques for in vivo identification
and characterization of glucose biomolecules monitored in
the skin of healthy, prediabetes and diabetes subjects; for
molecular characterization of water and protein biomolecules
in in vivo monitored patch tested inflamed skin of the pa-
tients with contact dermatitis; for description of nucleic acids
and proteins at the molecular level with progression to ma-
lignancy in skin cancerous lesions. The intended reader is
directed to recent review and research articles that address
these issues in more detail [3, 8-11]. Rather, we would like
to take the perspective of the intended end user of described
vibrational spectroscopy techniques from pharmaceutical
community. The path toward implementing vibrational spec-
troscopy technique for molecular drug targeting and moni-
toring is discussed, based on how far have we progressed in
our studies.
SUBJECTS AND METHODOLOGY
Very few vibrational spectroscopy techniques have been
translated into patient`s health care in dermatological clinics,
in spite of the rapid developments and progress in technology
for using them in laboratories [10]. Mainly, it is because
measuring of the skin requires certain technical prerequisites,
like availability of remote fiber optic probes able to measure at
any anatomical location, availability of the desired measuring
aperture area in the used instrumentation, short measuring
time, appropriate wavelength for laser light excitation in order
to overcome skin tissue autofluorescence, and measurement of
skin spectra with a high (adequate) signal-to-noise ratio
(SNR). Moreover, it is important to use an appropriate method
with desired depth penetration of skin tissue for the study, so
that it is relevant with regard to the skin layer origin of inves-
tigated disease or a (patho-)physiological condition in question
[3, 8, 10]. Based on these issues, the FT-IR spectroscopy with
the ATR (attenuated total reflection) accessory was chosen for
our study to in vivo identify and characterize glucose bio-
molecules in monitored skin of healthy, prediabetes and diabe-
tes subjects; NIR FT Raman spectroscopy technique with a
remote fiber optic probe to molecularly characterize and in
vivo monitor skin inflammation on the back of patch tested
patients with contact dermatitis; and FT-IR spectroscopy with
a microscope accessory to in vitro characterize spectra of be-
nign, premalignant and malignant skin lesions at the molecular
level, which is discussed below in detail.
ATR-FTIR Spectroscopy for Real-Time Non-Invasive Skin Glucose Characterization and Monitoring
A high throughput ATR accessory, the PIKE Technolo-
gies Horizontal ATR (HATR) (ATR-8200 HA), is designed
for use in commercially available Shimadzu FTIR spec-
trometer (Shimadzu IRPrestige-21/FTIR-8400S, Japan). The
ATR accessory is available with two basic types of mounted
crystal, the trough plate and the flat plate, both is of a trape-
zoid shape and is 80 mm long, 10 mm wide and 4 mm thick.
This thickness of the crystal was carefully chosen by manu-
facturer in order to produce optimum performance from the
accessory, and the crystal dimensions have been chosen to
maximize SNR in the resulting spectra. To perform in vivo
measurements from the inner wrists of the subjects, the flat
plate has been used for the collection of mid-infrared spectra
in our study. Before each measurement the spectrum was
obtained by rationing a scan measured from the inner wrist
area to a background scan. In vivo infrared ATR spectra were
recorded in the 700-4000 cm-1
wavenumber region at a reso-
lution of 4 cm-1
, using number 20 of accumulation for the
collection of interferogram.
Eleven subjects participated in the study: one with diabe-
tes (type 2); three, as suspects of having impaired glucose
tolerance (prediabetes), due to randomly measured post-
prandial hyperglycemia; and seven healthy subjects. The
following measurements were done: 1) randomly, i.e. casu-
ally measured regardless of when the patient last ate; 2) on
mornings, when a subject has refrained from eating for 10 to
16 hours (fasting measurements); 3) measured from 1 to 3
hours after a meal (postprandial measurements); 4) during
OGTT (oral glucose tolerance test), after given orally a glu-
cose solution to drink, including 5 g (minimum dose), 20 g
(medium dose) and/or 75 g (maximum dose, i.e. clinical test
dose) of glucose.
All measurements by ATR-FTIR spectroscopy were per-
formed immediately after determining blood glucose level
by a portable glucosemeter (SKK GluTestS, Sanwa Chemi-
cal Institute, Nagoya, Japan) in mg/dL.
40 The Open Medicinal Chemistry Journal, 2008, Volume 2 Eikje et al.
The techniques applied to treat in vivo HATR-FTIR spec-
tra included: 1) normalization to amide I; 2) multiple base-
line correction; 3) in the present study, the amide I band near
1645 cm-1
was considered constant, and therefore was used
in calculating the intensities of the peaks at around 1030 cm-1
,
1041 cm-1
, 1080 cm-1
, 1118 cm-1
and 1153 cm-1
.
Fiberoptic NIR FT Raman Spectroscopy for Direct Mo-lecular Characterization and In Vivo Monitoring of In-flammation in the Skin (Type IV Allergic Reaction)
Fiber optic NIR FT RFS 100-Raman spectrometer on a
Bruker IFS 66 optics system (Bruker Analytik GmbH,
Karlsruhe, Germany), equipped with a liquid nitrogen-cooled
Ge detector, was using the excitation source of a 1064 nm
line (virtually elicits almost no fluorescence) from a continu-
ous wave Nd:YAG laser at 200 mW. In vivo Raman spectra
of normal control and skin reacting to patches (inflamed
skin) on the back of the patients, as suspects of contact der-
matitis, were measured in 400-3500 cm-1
region within 250
scans by using a resolution of 8 cm-1
.
In the present study fiberoptic NIR FT Raman spectros-
copy was used to instrumentally assess 63 positive patch test
(PT) reactions at 48 h and 72 h, at the time of their readings
in a contact dermatitis clinic. The application of commer-
cially available allergens for 48 h was used to clinically re-
produce contact dermatitis, in miniature, in the patients sus-
pected to have this disease. The common method of clinical
reading includes scoring into irritant, doubtful (+?; faint
erythema only), weak (+; erythema, oedema, possibly pa-
pules), strong (++; erythema, oedema, papules, vesicles) and
extremely strong (+++; intense erythema and oedema; coa-
lescing vesicles) positive PT reactions [12].
For assessment of water content in the skin, the intensity
of an O-H stretching mode of water at 3250 cm-1
, that is pre-
sented in vivo Raman spectra in a broad feature between
3100 and 3500 cm-1
, was used in the calculated ratio
I3250/I2940 [13,14].
The Wilcoxon Rank-Sum test, a nonparametric Mann-
Whitney U-test was used to compare different PT reaction
groups at 48 h and 72 h. A value of p < 0.05 was considered
to indicate a statistically significant difference.
FT-IR Microspectroscopy for In Vitro Description of Skin Cancerous Tissue
An FT-IR microspectrometer (IR-MAU200, JEOL Co.,
Tokyo, Japan) was used to obtain spectra with a resolution of
4 cm-1
over a spectral range of 800-4000 cm-1
, using a knife
edge aperture reduced to a 25 25 μm. Spectra of 47 normal
and lesional, epidermal (Bowen`s disease, solar keratosis,
basal cell carcinoma (BCC), squamous cell carcinoma
(SCC), malignant melanoma (MM)) and dermal (intradermal
nevus), skin components were acquired from a 6 μm cut-
sections on a CaF2 (calcium fluoride) slide glasses, with
speed scans of 127 [15].
RESULTS
ATR-FTIR Spectroscopy for In Vivo Identification,
Characterization and Monitoring of Glucose Bio-
molecules in the Skin of Healthy, Prediabetes and Diabe-
tes Subjects
In all measured volunteers a closer assessment of the
glucose-related region between 1000 and 1180 cm-1
in ATR-
FTIR spectra found glucose-specific peaks at about 1030
(±2-3) cm-1
, 1041 (± 4) cm-1
, 1080 (± 4) cm-1
, 1118 (- 7; + 4)
cm-1
and 1153 (± 4) cm-1
.
In vivo spectra of monitored skin in 8 subjects during
OGTT showed shifts, at most at 1041 cm-1
and at 1118 cm-1
peaks, and at less at 1030 cm-1
, 1080 cm-1
and at 1153 cm-1
peaks. Shifts to the left were more seen in healthy volunteers
and shifts to the right were noticed in prediabetes and diabe-
tes subjects (see peak captions in Fig. 2a-c).
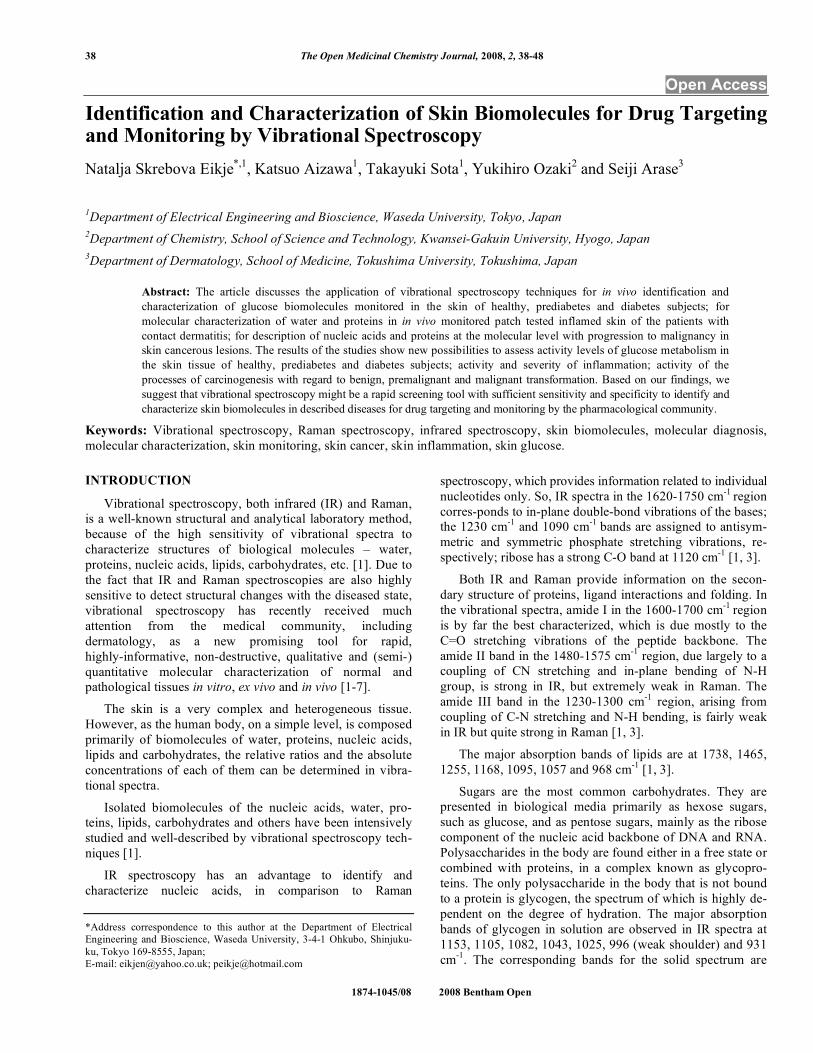
Fig. (1) demonstrates examples of spectral variations of
the intensity of the peaks at 1041 cm-1
and at 1118 cm-1
in
the skin of the patients with type 2 diabetes, prediabetes and
a healthy measured subject. In vivo spectra of all measured
prediabetes and diabetes volunteers showed the prominence
of the peak near 1118 cm-1
over the peak intensity near 1041
cm-1
, that was not seen in healthy subjects. Therefore, based
on the differences of the intensities near peaks at 1041 cm-1
and at 1118 cm-1
, two spectral patterns could be seen: I1118 >
I1041 for prediabetes and diabetes subjects, and I1118 < I1041 for
non-diabetes subjects. These differences were seen inde-
pendently on the screening tests performed.
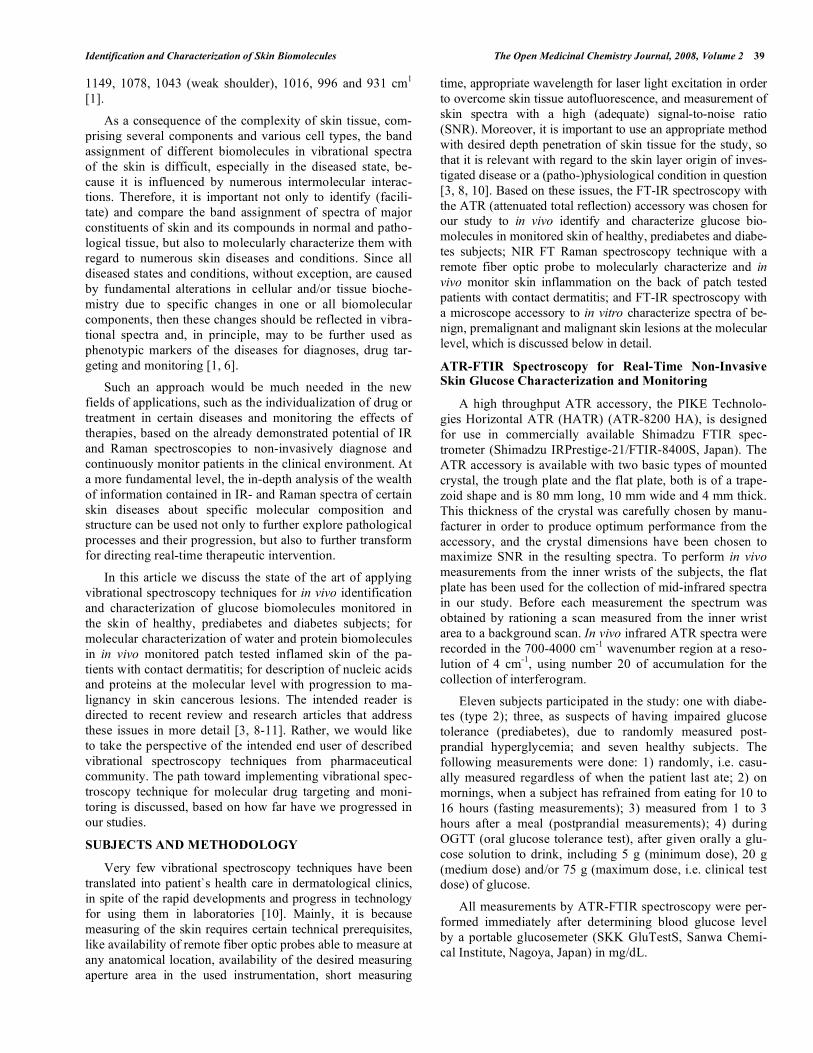
Real-time non-invasive monitoring of absorbances of the
glucose peak near 1030 cm-1
during a 4-hour OGTT after
intake of a clinical dose of glucose (75 g) in the patient with
type 2 diabetes demonstrates an ability to monitor glucose
activity changes in the skin tissue by ATR-FTIR spectro-
scopy in vivo (Fig. 2).
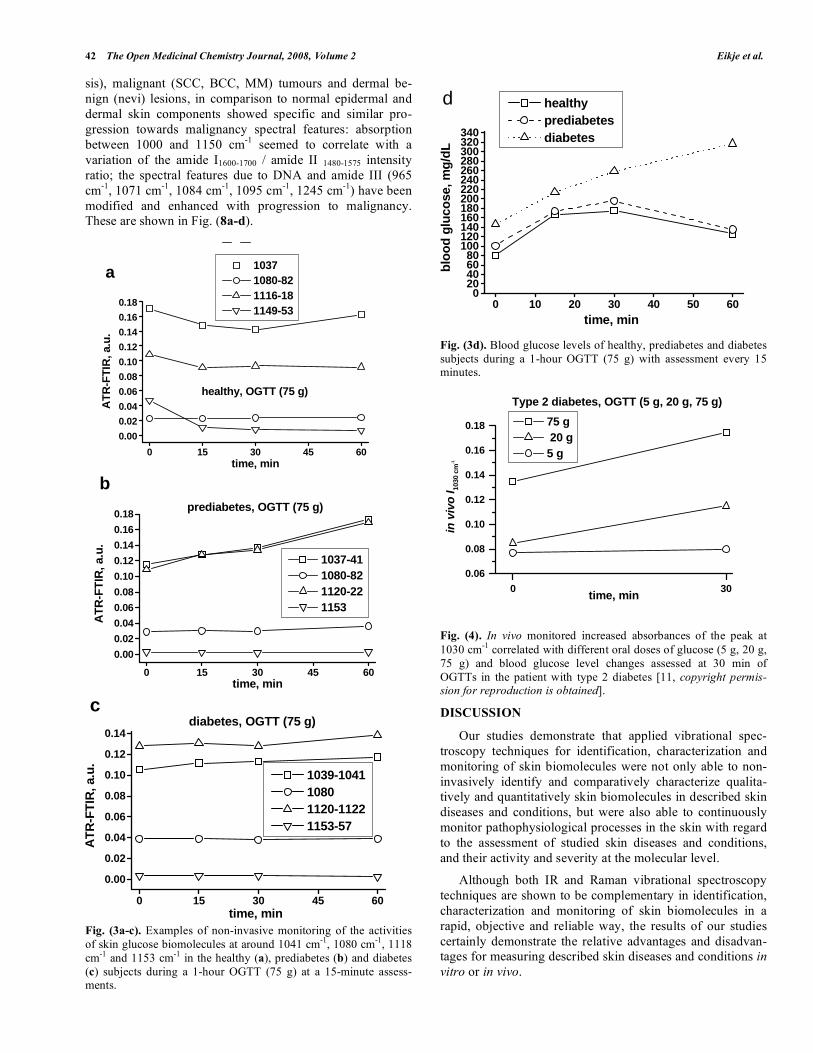
Fig. (3a-c) demonstrates examples of in vivo skin glucose
monitoring based on calculated absorbances of glucose bio-
molecules at wavelengths of 1041 cm-1
, 1080 cm-1
, 1118 cm-1
and 1153 cm-1
during a 1-hour OGTT (75 g) at a 15-min
interval in a healthy, prediabetes and diabetes subjects. It
also shows evidences of indirect correlation between the
intensities of these peaks and blood glucose levels in a time-
dependent manner (Fig. 3d). During OGTT this in vivo
monitoring revealed that specific for a healthy, prediabetes
and diabetes subjects levels of each glucose molecule acti-
vity changed at different time-points by means of measured
intensities of the peaks at 1041 cm-1
, 1080 cm-1
, 1118 cm-1
and 1153 cm-1
. Moreover, based on the intensities of the
peaks at 1041 cm-1
and 1118 cm-1
we could again recognise
2 spectral patterns in monitored spectra of healthy and diabe-
tes subjects.
Fig. (4) shows clear differences between mean values of
the peak near 1030 cm-1
in a dose-dependent manner, mea-
sured in the patient with type 2 diabetes during a 30-minute
OGTT monitoring after taking 5g, 20 g and 75 g of glucose
orally.
Identification and Characterization of Skin Biomolecules The Open Medicinal Chemistry Journal, 2008, Volume 2 41
Fiberoptic NIR FT Raman Spectroscopy for Molecular Diagnosis and In Vivo Monitoring of Inflammation in the
Skin of Patch Tested Patients with Contact Dermatitis
The most significant changes in the spectra were detected
in the regions specific for water content (2800-3400 cm-1
)
and protein structure (600-1800 cm-1
) in all positive PT reac-
tions at 48 h and 72 h, when compared to normal skin.
Fig. (2). Example of non-invasive glucose monitoring in the patient
with type 2 diabetes by means of calculated intensities of the peak
near 1030 cm-1
, that are indirectly followed by blood glucose level
changes (shown in numbers along the line at determined time inter-vals) [11, copyright permission for reproduction is obtained].
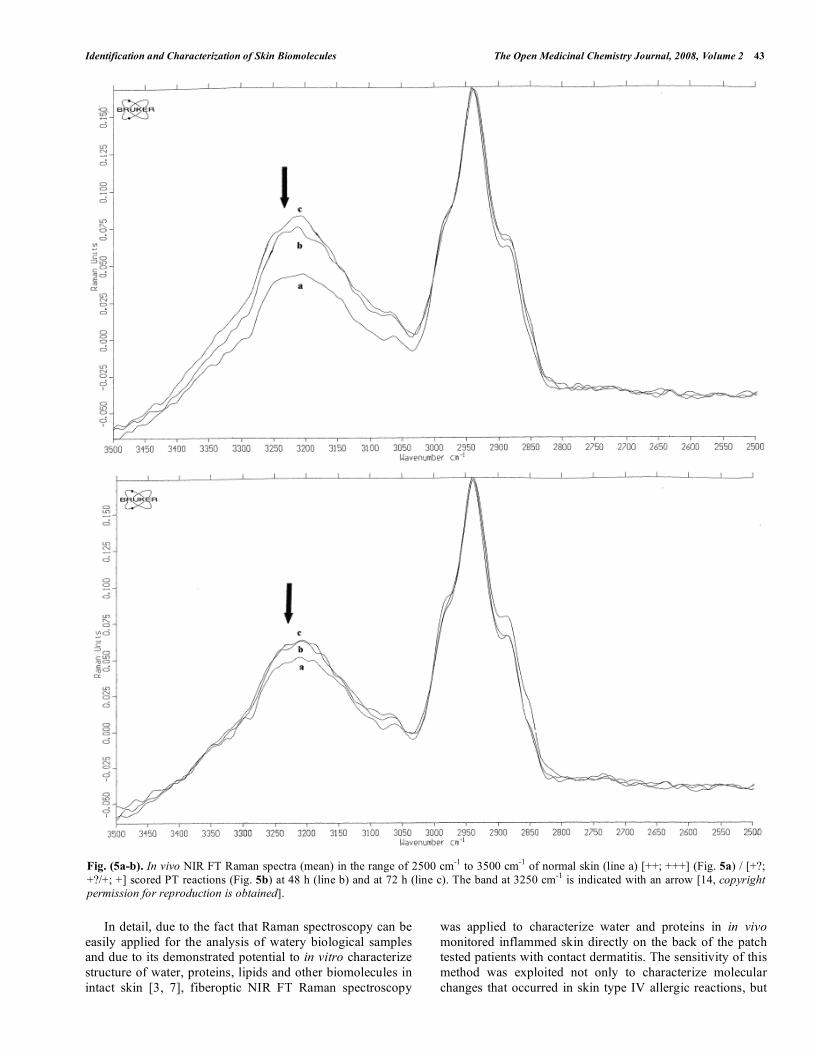
Based on these spectral changes, primarily spectra of all
positive PT reactions were divided into 2 groups: mean spec-
tra of irritant (IR), doubtful (+?) and weak (+) positive PT
reactions and mean spectra of strong (++) and extremely
strong (+++) positive PT reactions (Fig. 5a-b and Fig. 6a-b).
By means of measured differences in absolute values of the
3250 cm-1
peak (ratio I3250/I2940) mean Raman spectra of [IR;
+?; +] positive PT reactions were calculated as 0.37 (normal
control) < 0.42 ( 48 h) < 0.51 (72 h), and mean Raman spec-
tra of [++; +++] were calculated as 0.37 (normal control) <
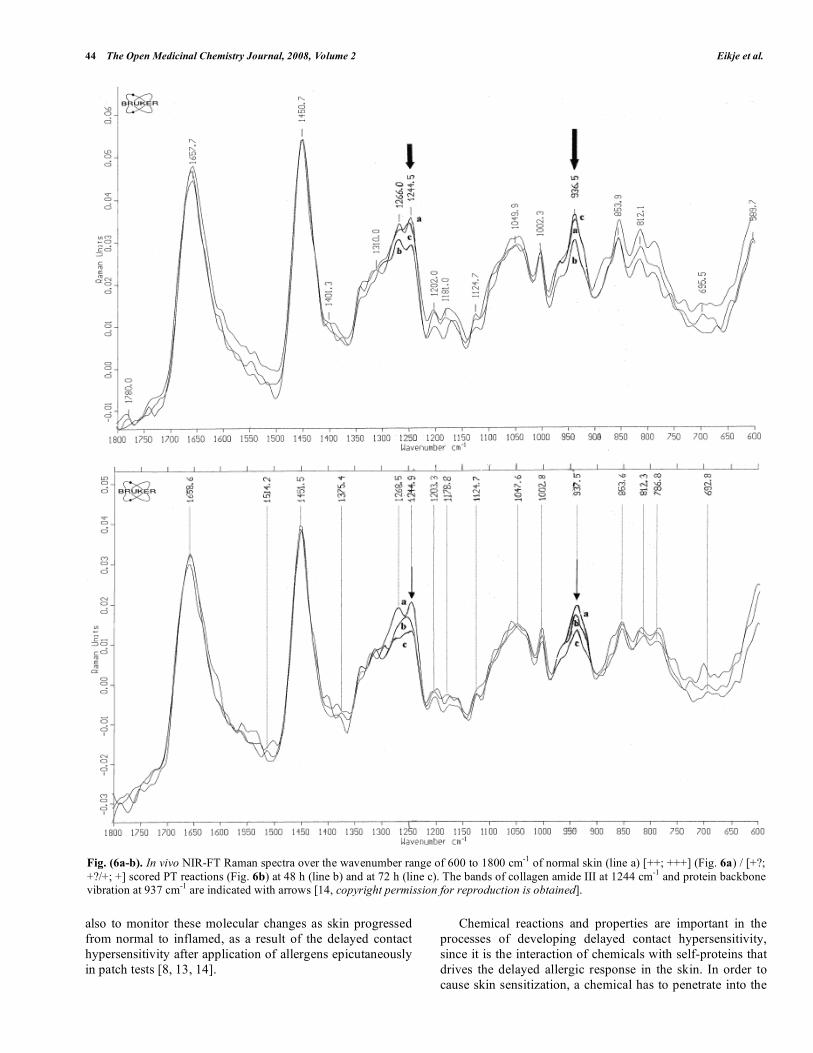
0.59 (48 h) < 0.58 (72 h) (Fig. 5a-b). Protein structure
changes differed mostly between 2 groups of positive PT
reactions after 72 h, showing stable decrease at 48 h and 72 h
at 1244 cm-1
(amide III) and at 937 cm-1
(protein backbone
vibration) for the [++; +++]-group and coming back to nor-
mal at 72 h after transient decrease at 48 h for [IR; +?; +]-
group (Fig. 6a-b).
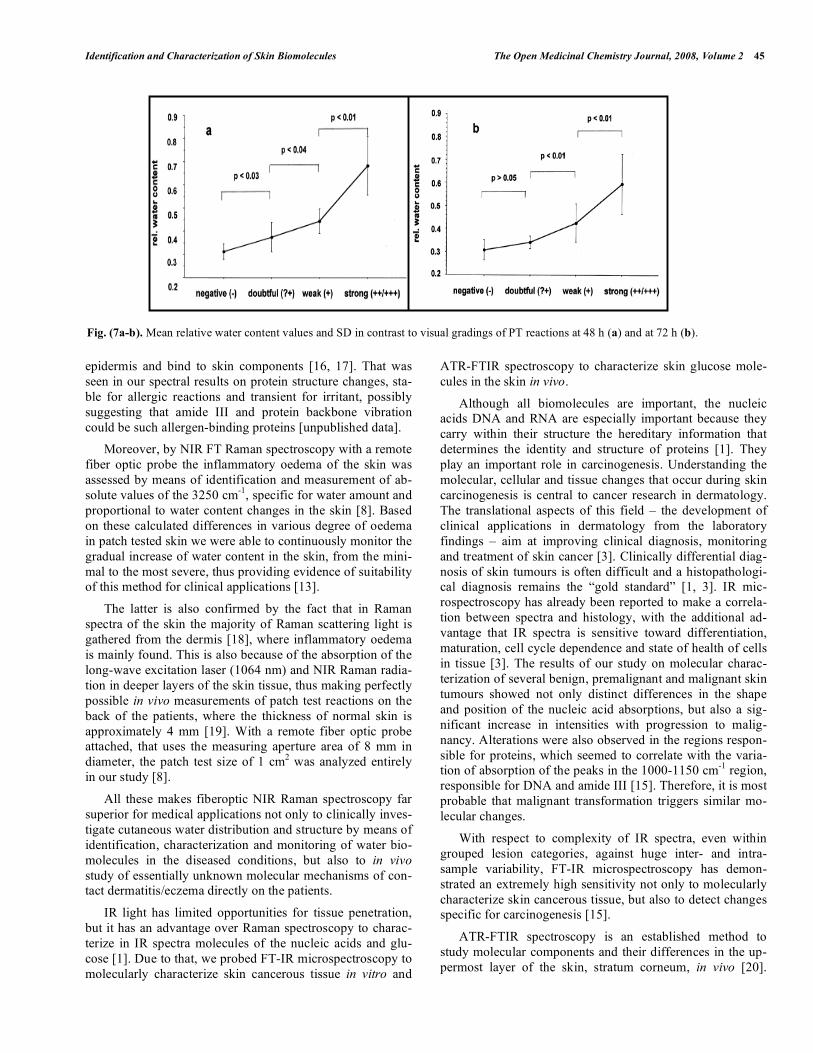
The measurement of water content with further calcula-
tion of the ratio I3250/I2940 for mean degrees of all reactions
was 0.31 (-) < 0.34 (+?) < 0.41 (+) < 0.59 (++/+++) at 48 h
and 0.31 (-) < 0.40 (+?) < 0.44 (+) < 0.69 (++/+++) at 72 h.
The results of the Mann-Whitney U-test showed significant
differences between (-) and (+?) [p < 0.03/48 h], (+?) and (+)
[p < 0.04/48 h; p < 0.01/72 h], (+) and (++/+++) [p < 0.01/48
h; p < 0.01/72h], but not between negative and doubtful PT
reactions [p > 0.05] at 72 h [12] (Fig. 7a-b).
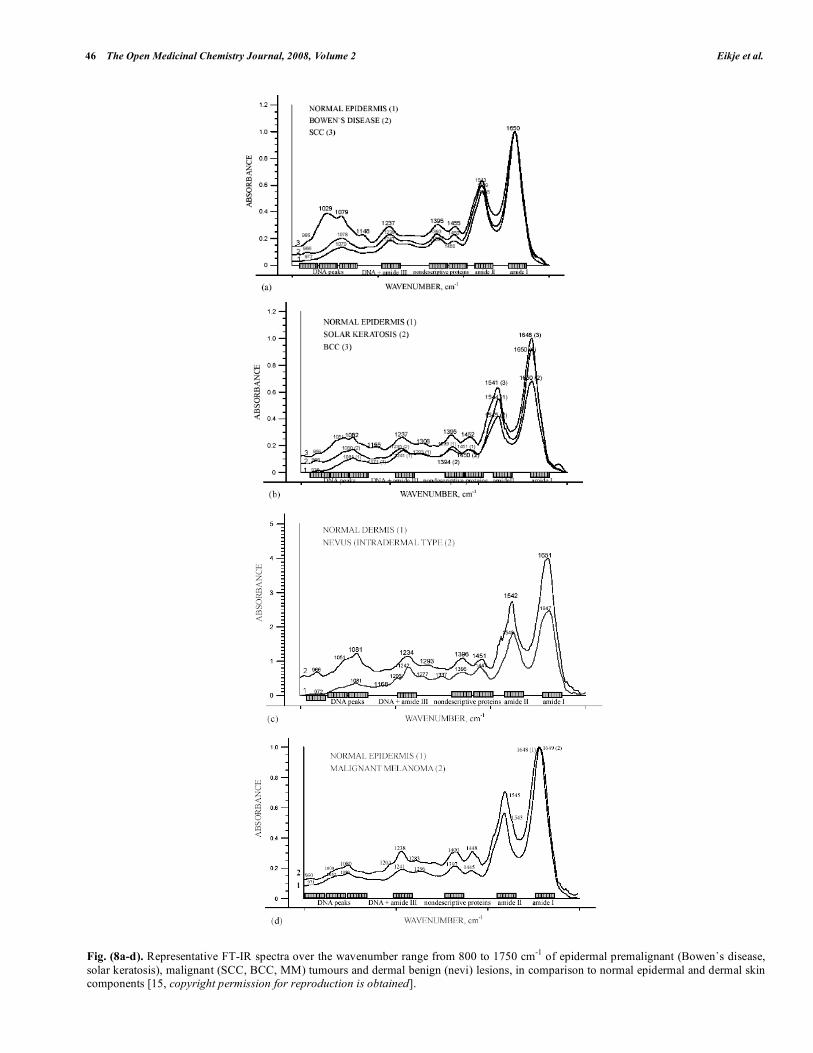
FT-IR Microspectroscopy for In Vitro Molecular De-scription of Skin Cancerous Tissue
Representative FT-IR spectra in the 800-1750 cm-1
region
of epidermal premalignant (Bowen`s disease, solar kerato-
Fig. (1). Two spectral patterns: pattern 1 for prediabetes (blue line)/diabetes (black line) (I1118 > I1041) and pattern 2 for a healthy subject
(yellow line) (I1118 < I1041).
99010051020103510501065108 010951110112511401155
1157
.33
1120
.68
1082
.10 10
41.6
0
1122
.61
1082
.10
1041
.6011
57.3
3
1114
.89
1080
.17
1045
.45
ヒ ゚ー ク 規 格 化ヒ ゚ー ク 規 格 化ヒ ゚ー ク 規 格 化
Abs
orba
nce,
a.u
.
Wavelength, cm-1
0 30 60 90 120 150 180 210 240
0.14
0.15
0.16
0.17
0.18
209
247
266
310317258
214
146
OGTT, 75 g glucose
in v
ivo
I 1030
cm
-1
time, min
42 The Open Medicinal Chemistry Journal, 2008, Volume 2 Eikje et al.
sis), malignant (SCC, BCC, MM) tumours and dermal be-
nign (nevi) lesions, in comparison to normal epidermal and
dermal skin components showed specific and similar pro-
gression towards malignancy spectral features: absorption
between 1000 and 1150 cm-1
seemed to correlate with a
variation of the amide I1600-1700 / amide II 1480-1575 intensity
ratio; the spectral features due to DNA and amide III (965
cm-1
, 1071 cm-1
, 1084 cm-1
, 1095 cm-1
, 1245 cm-1
) have been
modified and enhanced with progression to malignancy.
These are shown in Fig. (8a-d).
Fig. (3a-c). Examples of non-invasive monitoring of the activities
of skin glucose biomolecules at around 1041 cm-1
, 1080 cm-1
, 1118
cm-1
and 1153 cm-1
in the healthy (a), prediabetes (b) and diabetes
(c) subjects during a 1-hour OGTT (75 g) at a 15-minute assess-ments.
Fig. (3d). Blood glucose levels of healthy, prediabetes and diabetes
subjects during a 1-hour OGTT (75 g) with assessment every 15 minutes.
Fig. (4). In vivo monitored increased absorbances of the peak at
1030 cm-1
correlated with different oral doses of glucose (5 g, 20 g,
75 g) and blood glucose level changes assessed at 30 min of
OGTTs in the patient with type 2 diabetes [11, copyright permis-sion for reproduction is obtained].
DISCUSSION
Our studies demonstrate that applied vibrational spec-
troscopy techniques for identification, characterization and
monitoring of skin biomolecules were not only able to non-
invasively identify and comparatively characterize qualita-
tively and quantitatively skin biomolecules in described skin
diseases and conditions, but were also able to continuously
monitor pathophysiological processes in the skin with regard
to the assessment of studied skin diseases and conditions,
and their activity and severity at the molecular level.
Although both IR and Raman vibrational spectroscopy
techniques are shown to be complementary in identification,
characterization and monitoring of skin biomolecules in a
rapid, objective and reliable way, the results of our studies
certainly demonstrate the relative advantages and disadvan-
tages for measuring described skin diseases and conditions in
vitro or in vivo.
0 15 30 45 600.000.020.040.060.080.100.120.140.160.18
a
healthy, OGTT (75 g)
1037 1080-82 1116-18 1149-53
ATR
-FTI
R, a
.u.
time, min
0 15 30 45 60
0.000.020.040.060.080.100.120.140.160.18
bprediabetes, OGTT (75 g)
1037-41 1080-82 1120-22 1153
ATR
-FTI
R, a
.u.
time, min
0 15 30 45 60
0.00
0.02
0.04
0.06
0.08
0.10
0.12
0.14
cdiabetes, OGTT (75 g)
1039-1041 1080 1120-1122 1153-57
ATR
-FTI
R, a
.u.
time, min
0 10 20 30 40 50 600
20406080
100120140160180200220240260280300320340
d healthy prediabetes diabetes
bloo
d gl
ucos
e, m
g/dL
time, min
0 300.06
0.08
0.10
0.12
0.14
0.16
0.18
Type 2 diabetes, OGTT (5 g, 20 g, 75 g) 75 g 20 g 5 g
in v
ivo
I 1030
cm
-1
time, min
Identification and Characterization of Skin Biomolecules The Open Medicinal Chemistry Journal, 2008, Volume 2 43
In detail, due to the fact that Raman spectroscopy can be
easily applied for the analysis of watery biological samples
and due to its demonstrated potential to in vitro characterize
structure of water, proteins, lipids and other biomolecules in
intact skin [3, 7], fiberoptic NIR FT Raman spectroscopy
was applied to characterize water and proteins in in vivo
monitored inflammed skin directly on the back of the patch
tested patients with contact dermatitis. The sensitivity of this
method was exploited not only to characterize molecular
changes that occurred in skin type IV allergic reactions, but
Fig. (5a-b). In vivo NIR FT Raman spectra (mean) in the range of 2500 cm-1
to 3500 cm-1
of normal skin (line a) [++; +++] (Fig. 5a) / [+?;
+?/+; +] scored PT reactions (Fig. 5b) at 48 h (line b) and at 72 h (line c). The band at 3250 cm-1
is indicated with an arrow [14, copyright permission for reproduction is obtained].
44 The Open Medicinal Chemistry Journal, 2008, Volume 2 Eikje et al.
also to monitor these molecular changes as skin progressed
from normal to inflamed, as a result of the delayed contact
hypersensitivity after application of allergens epicutaneously
in patch tests [8, 13, 14].
Chemical reactions and properties are important in the
processes of developing delayed contact hypersensitivity,
since it is the interaction of chemicals with self-proteins that
drives the delayed allergic response in the skin. In order to
cause skin sensitization, a chemical has to penetrate into the
Fig. (6a-b). In vivo NIR-FT Raman spectra over the wavenumber range of 600 to 1800 cm-1
of normal skin (line a) [++; +++] (Fig. 6a) / [+?;
+?/+; +] scored PT reactions (Fig. 6b) at 48 h (line b) and at 72 h (line c). The bands of collagen amide III at 1244 cm-1
and protein backbone vibration at 937 cm
-1 are indicated with arrows [14, copyright permission for reproduction is obtained].
Identification and Characterization of Skin Biomolecules The Open Medicinal Chemistry Journal, 2008, Volume 2 45
epidermis and bind to skin components [16, 17]. That was
seen in our spectral results on protein structure changes, sta-
ble for allergic reactions and transient for irritant, possibly
suggesting that amide III and protein backbone vibration
could be such allergen-binding proteins [unpublished data].
Moreover, by NIR FT Raman spectroscopy with a remote
fiber optic probe the inflammatory oedema of the skin was
assessed by means of identification and measurement of ab-
solute values of the 3250 cm-1
, specific for water amount and
proportional to water content changes in the skin [8]. Based
on these calculated differences in various degree of oedema
in patch tested skin we were able to continuously monitor the
gradual increase of water content in the skin, from the mini-
mal to the most severe, thus providing evidence of suitability
of this method for clinical applications [13].
The latter is also confirmed by the fact that in Raman
spectra of the skin the majority of Raman scattering light is
gathered from the dermis [18], where inflammatory oedema
is mainly found. This is also because of the absorption of the
long-wave excitation laser (1064 nm) and NIR Raman radia-
tion in deeper layers of the skin tissue, thus making perfectly
possible in vivo measurements of patch test reactions on the
back of the patients, where the thickness of normal skin is
approximately 4 mm [19]. With a remote fiber optic probe
attached, that uses the measuring aperture area of 8 mm in
diameter, the patch test size of 1 cm2 was analyzed entirely
in our study [8].
All these makes fiberoptic NIR Raman spectroscopy far
superior for medical applications not only to clinically inves-
tigate cutaneous water distribution and structure by means of
identification, characterization and monitoring of water bio-
molecules in the diseased conditions, but also to in vivo
study of essentially unknown molecular mechanisms of con-
tact dermatitis/eczema directly on the patients.
IR light has limited opportunities for tissue penetration,
but it has an advantage over Raman spectroscopy to charac-
terize in IR spectra molecules of the nucleic acids and glu-
cose [1]. Due to that, we probed FT-IR microspectroscopy to
molecularly characterize skin cancerous tissue in vitro and
ATR-FTIR spectroscopy to characterize skin glucose mole-
cules in the skin in vivo.
Although all biomolecules are important, the nucleic
acids DNA and RNA are especially important because they
carry within their structure the hereditary information that
determines the identity and structure of proteins [1]. They
play an important role in carcinogenesis. Understanding the
molecular, cellular and tissue changes that occur during skin
carcinogenesis is central to cancer research in dermatology.
The translational aspects of this field – the development of
clinical applications in dermatology from the laboratory
findings – aim at improving clinical diagnosis, monitoring
and treatment of skin cancer [3]. Clinically differential diag-
nosis of skin tumours is often difficult and a histopathologi-
cal diagnosis remains the “gold standard” [1, 3]. IR mic-
rospectroscopy has already been reported to make a correla-
tion between spectra and histology, with the additional ad-
vantage that IR spectra is sensitive toward differentiation,
maturation, cell cycle dependence and state of health of cells
in tissue [3]. The results of our study on molecular charac-
terization of several benign, premalignant and malignant skin
tumours showed not only distinct differences in the shape
and position of the nucleic acid absorptions, but also a sig-
nificant increase in intensities with progression to malig-
nancy. Alterations were also observed in the regions respon-
sible for proteins, which seemed to correlate with the varia-
tion of absorption of the peaks in the 1000-1150 cm-1
region,
responsible for DNA and amide III [15]. Therefore, it is most
probable that malignant transformation triggers similar mo-
lecular changes.
With respect to complexity of IR spectra, even within
grouped lesion categories, against huge inter- and intra-
sample variability, FT-IR microspectroscopy has demon-
strated an extremely high sensitivity not only to molecularly
characterize skin cancerous tissue, but also to detect changes
specific for carcinogenesis [15].
ATR-FTIR spectroscopy is an established method to
study molecular components and their differences in the up-
permost layer of the skin, stratum corneum, in vivo [20].
Fig. (7a-b). Mean relative water content values and SD in contrast to visual gradings of PT reactions at 48 h (a) and at 72 h (b).
46 The Open Medicinal Chemistry Journal, 2008, Volume 2 Eikje et al.
Fig. (8a-d). Representative FT-IR spectra over the wavenumber range from 800 to 1750 cm
-1 of epidermal premalignant (Bowen`s disease,
solar keratosis), malignant (SCC, BCC, MM) tumours and dermal benign (nevi) lesions, in comparison to normal epidermal and dermal skin components [15, copyright permission for reproduction is obtained].
Identification and Characterization of Skin Biomolecules The Open Medicinal Chemistry Journal, 2008, Volume 2 47
Although early studies intensively describe in vivo regional
variations and depth-dependent non-homogeneity in the
1000-4000 cm-1
region, so far the glucose-specific region
between 1000 cm-1
and 1180 cm-1
has not been fully de-
scribed in the literature. [11] In our study HATR-FTIR has
been probed to in vivo identify and characterize molecules of
glucose in the skin tissue from the inner wrists of measured
non-diabetes and (pre-)diabetes subjects.
Spectral results from 7 healthy subjects identified glucose-
specific peaks at about 1030 cm-1
, 1041 cm-1
, 1080 cm-1
, 1118
cm-1
and 1153 cm-1
under different screening test conditions.
Although IR spectra of studied absorbances of glucose at a
wavelength of 1030 cm-1
is well-known for its good correla-
tion with a range of glucose concentrations in vitro [11], the
behaviour of that glucose molecule in the skin in vivo is re-
mained to be elucidated [unpublished data]. Nevertheless,
the previous study shows evidence of the possibility not only
to assess glucose activity levels in the skin by means of cal-
culating the 1030 cm-1
peak intensity values in measured
spectra in vivo, but also to determine its changes in a dose-
dependent manner [11].
Among 11 subjects another two prominent glucose-
specific peaks at 1041 cm-1
and 1118 cm-1
were identified
and showed differences in their intensities in the measured
spectra of non-diabetes, prediabetes and diabetes subjects.
Based on that, two spectral patterns were seen for non-
diabetes and for (pre-)diabetes subjects: I1118 < I1041 for
healthy, and I1118 > I1041 for prediabetes and diabetes subjects.
In the present study ATR-FTIR spectroscopy has also
demonstrated its potential to in vivo simultaneously monitor
glucose-specific peaks at 1030 cm-1
, 1041 cm-1
, 1080 cm-1
,
1118 cm-1
and 1153 cm-1
at different time intervals and after
intake of different doses of glucose. Our shown results sug-
gest that by means of measuring intensities of these peaks in
the skin tissue we could not only determine differences in
glucose activity levels in the skin of each subject, but could
also to characterize and differentiate the activity of each glu-
cose molecule between healthy, prediabetes and diabetes
subjects in real time.
CONCLUSION
The results of the presented studies clearly demonstrate
how vibrational spectroscopy techniques can be applied for
identification, characterization and monitoring of several
skin biomolecules in certain skin diseases and conditions,
thus showing new possibilities to assess activity and severity
of inflammation, activity of processes of carcinogenesis to-
wards progression to malignancy, and activity levels of glu-
cose metabolism in the skin tissue of healthy, prediabetes
and diabetes subjects.
FUTURE ASPECTS
Although vibrational spectroscopy techniques has already
started to be recognized with regard to their potentials to
molecularly characterize and monitor numerous diseases and
conditions, new fields of applications are still to be found.
Among those are how to implement these techniques for
direct real-time therapeutic interventions, based on already
received information on molecular aspects of the diseases;
how to monitor the effects of therapies based on molecular
monitoring of severity and activity of pathological condi-
tions and processes; and how to use normal and diseased
vibrational spectra information for individualization of drug
or treatment. Only the focused research and development of
applications to further identify, characterize and monitor skin
diseases and conditions undescribed at the molecular level
will provide future ability to treat and control not only can-
cers, eczema and carbohydrate metabolism disorders, but
also many others that await their medical needs and scien-
tific opportunities.
ACKNOWLEDGEMENTS
Author NSE is thankful to Prof. P. Nielsen from Panum
Institute, University of Copenhagen, Denmark, for his offi-
cial invitation to present this paper at the 1st International
Conference on Drug Design and Discovery, Dubai, UAE,
February 4-7, 2007. Author NSE is grateful to JSPS (Japan
Society for Promotion and Science) for present financial
support as a postdoctoral fellow; to Waseda University, To-
kyo, Japan for sponsoring a presentation at the 1st Interna-
tional Conference on Drug Design and Discovery, Dubai,
UAE, February 4-7, 2007; to Monbusho (Japanese Ministry
of Education) and to Danish Ministry of Education for finan-
cial support while at the Department of Dermatology, Bis-
pebjerg Hospital, University of Copenhagen, Denmark, and
at the Department of Dermatology, Tokushima University
School of Medicine, Japan. She wants to thank again all
those who helped during the studies on vibrational spectro-
scopy techniques: Dr. Gniadecka, Dr. Wessel, Prof. Wulf
and the entire staff at the Department of Dermatology, Bis-
pebjerg Hospital, University of Copenhagen, Denmark; Prof.
N.I. Afanasyeva, Spectro Optical Sensing, Inc., USA; Fuji-
moto-san, Takeishi-san, all dermatologists in training for
their support with skin tissue samples at the Department of
Dermatology, Dr. Umehara at the Department of Orthopae-
dic Surgery, Prof. Yoshizaki and Dr. Ikehara at the Depart-
ment of Physiology, Tokushima University School of Medi-
cine; Dr. Huehne and staff at Kwansei-Gakuin University
School of Science and Technology; Department of Physio-
logy, Tokyo Medical University, Japan; Prof. Sota, students
and members at the Department of Electrical Engineering
and Bioscience, Waseda University, Japan.
REFERENCES
[1] Dukor, R.K. In Handbook of Vibrational Spectroscopy; Chalmers,
J.M., Griffiths, P.R., Eds.; John Wiley and Sons Ltd.: 2002; Vol. 5, 3335-3361.
[2] Diem, M.; Boydston-White, S.; Chiriboga, L. Appl. Spectro., 1999, 53(4), 148A-161A.
[3] Eikje Skrebova, N.; Aizawa, K.; Ozaki, Y.; Arase, S. Biotechnol. Ann. Rev., 2005; 11, 191-225.
[4] McIntosh, L.M.; Summers, R.; Jackson, M.; Mantsch, H.; Mans-field, J.R.; Howlett, M.; Crowson, A.N.; Toole, J.W.P. J. Invest.
Dermatol., 2001, 116, 175-181. [5] Schrader, B.; Dippel, B.; Fendel, S.; Keller, S.; Löchte, T.; Riedl,
M.; Schulte, R.; Tatsch, E. J. Mol. Struct., 1997, 408/409, 23-31. [6] Choo-Smith, L.-P.; Edwards, H.G.M.; Endtz, H.P.; Kros, J.M.;
Heule, F.; Barr, H.; Robinson, J.S.; Bruining, H.A.; Puppels, G.J. Biopolymers (Biospectroscopy), 2002, 67, 1-9
[7] Gniadecka, M. Skin Res. Technol., 1997, 3, 139-146. [8] Eikje Skrebova, N.; Ozaki, Y.; Aizawa, K.; Arase, S. J. Biomed.
Optics, 2005; 10(1), 014013.
48 The Open Medicinal Chemistry Journal, 2008, Volume 2 Eikje et al.
[9] Eikje Skrebova, N. In Optical Technologies in Biophysics and
Medicine II, Proceedings of SPIE Saratov Fall Meeting, Saratov, Russia, September 27-30, 2005; Tuchin, V.V., Ed.; International
Society of Optical Engineering: Washington, USA, 2006, 6163, 616309 (invited paper).
[10] Eikje Skrebova, N. In Optical Technologies in Biophysics and Medicine II, Proceedings of SPIE Saratov Fall Meeting, Saratov,
Russia, September 25-28, 2007; Tuchin, V.V., Ed.; International Society of Optical Engineering: Washington, USA, 2008, 6791-5,
in press (invited paper). [11] Eikje Skrebova, N.; Sota, T.; Aizawa, K. In Diagnostic Optical
Spectroscopy in Biomedicine IV, Proceedings of SPIE European Conference on Biomedical Optics, Munich, Germany, 17-21 June,
2007; Schweitzer, D.; Fitzmaurice, M.; Eds; International Society of Optical Engineering: Washington, USA, 2007, 6628, 66281M.
[12] Wahlberg, J.E. In Textbook of Contact Dermatitis; Rycroft, R.J.G.; Mennè, T.; Frosch, P.J.; Benezra, C.; Eds.; Springer-Verlag: Berlin,
Heidelberg, New York, 1995; Ch. 10.1, 239-268. [13] Skrebova, N.; Ozaki, Y.; Arase, S. Subsurface Sens. Technol. Ap-
pl., 2002, 3, 19-34. [14] Skrebova, N. In Subsurface Sensing Technologies & Applications
II, Proceedings of SPIE`s 45th Annual Meeting of the International
Society for Optical Engineering, San Diego, USA, July 31-August
3, 2000; Nguyen, C.; Ed.; International Society of Optical Engi-neering: Washington, USA, 2000; 4129, 218-230.
[15] Skrebova, N.; Aizawa, K.; Ozaki, Y.; Arase, S. In Smart Nonde-structive Evaluation and Health Monitoring of Structural and Bio-
logical Systems, Proceedings of SPIE`s 8th Annual International Symposium on Non-destructive Evaluation for Health Monitoring
and Diagnostics, San Diego, California, USA, March 2-6, 2003; Kundu, T.; Ed.; International Society of Optical Engineering:
Washington, USA, 2003; 5047; 378-385. [16] Arndt, K.A. Manual of Dermatological Therapeutics (with essen-
tials of diagnosis), 5th ed.; Little, Brown and Company: Boston/ New York/ Toronto/ London, 1995.
[17] Lepoittevin, J.-P.; Basketter, D.A.; Goossens, A.; Karlberg, A.-T. Allergic Contact Dermatitis, Springer-Verlag: Berlin/Heidelberg/
New York, 1998. [18] Jacobsen, A.D.T. Thesis, University of Odense, 1997.
[19] Goldsmith, L.A. In Physiology, Biochemistry and Molecular Biol-ogy of the Skin, Oxford University Press: New York, 1991.
[20] Brancaleon, M.P.; Bamberg, M.P.; Sakamaki, T; Kollias, N. J. Invest. Dermatol., 2001, 116, 380-386.
Received: March 14, 2008 Revised: April 8, 2008 Accepted: April 9, 2008
© Eikje et al.; Licensee Bentham Open.
This is an open access article distributed under the terms of the Creative Commons Attribution License (http://creativecommons.org/license/by/2.5/), which permits unrestrictive use, distribution, and reproduction in any medium, provided the original work is properly cited.