onondaga lake tissue and biological monitoring report for … · executive summary the objectives...
TRANSCRIPT
PARSONS
ONONDAGA LAKE TISSUE AND BIOLOGICAL MONITORING REPORT FOR 2012
Prepared For:
301 Plainfield Road, Suite 330
Syracuse, NY 13212
Prepared By:
Parsons 301 Plainfield Road, Suite 350
Syracuse, New York 13212
and
290 Elwood Davis Road Liverpool, NY 13088
AUGUST 2013
ONONDAGA LAKE TISSUE AND BIOLOGICAL
MONITORING REPORT FOR 2012
PARSONS
P:\Honeywell -SYR\447479 - 2012 Remedial Goal Monitoring\09.0 Reports\9.2 Monitoring Summary - 2012\2012 Tissue Monitoring Report_FINAL.docx August 29, 2013
i
TABLE OF CONTENTS Page
LIST OF ACRONYMS ................................................................................................... iv
EXECUTIVE SUMMARY ........................................................................................ ES-1
SECTION 1 INTRODUCTION................................................................................... 1-1
SECTION 2 SAMPLING AND ANALYSIS SUMMARY FOR 2012 ..................... 2-1
2.1 FISH SAMPLING ............................................................................................. 2-1
2.2 ZOOPLANKTON SAMPLING ........................................................................ 2-3
2.3 ANALYTICAL WORK SCOPE ....................................................................... 2-3
SECTION 3 DATA MANAGEMENT AND VALIDATION SUMMARY ............. 3-1
3.1 DATABASE ...................................................................................................... 3-1
3.2 QUALITY ASSURANCE/QUALITY CONTROL (QA/QC) .......................... 3-1
3.3 DATA VALIDATION ...................................................................................... 3-1
SECTION 4 DATA ASSESSMENT FOR 2012 ......................................................... 4-1
4.1 FISH TISSUE CHEMICAL RESULTS ............................................................ 4-1
4.2 FISH COMMUNITY MONITORING RESULTS ........................................... 4-2
4.2.1 Fish Community Assessment .................................................................. 4-2
4.2.2 Fish Population Assessment for Adult Pumpkinseed, Bluegill and
Largemouth Bass ..................................................................................... 4-3
4.3 ZOOPLANKTON RESULTS ........................................................................... 4-4
SECTION 5 REFERENCES ........................................................................................ 5-1
ONONDAGA LAKE TISSUE AND BIOLOGICAL
MONITORING REPORT FOR 2012
PARSONS
P:\Honeywell -SYR\447479 - 2012 Remedial Goal Monitoring\09.0 Reports\9.2 Monitoring Summary - 2012\2012 Tissue Monitoring Report_FINAL.docx August 29, 2013
ii
TABLE OF CONTENTS
(CONTINUED)
LIST OF TABLES
Table 1 Onondaga Lake Tissue Monitoring Program Objectives, Program Elements, and
Data Uses for 2012
Table 2 Summary of Tissue Monitoring Work Completed During 2012
Table 3 Summary of 2012 Fish Tissue Chemical Concentrations Measured in Onondaga
Lake (wet weight basis)
Table 4 Calculated Dioxin/Furan Human/Mammalian TEQs in 2012 Fish Tissue Samples
Table 5 Summary of Species Collected by Gear Type: May - October 2012
Table 6 Summary of Number of Individuals per Species Captured in Trap Nets: June -
October 2012
Table 7 2012 Gill Net Sampling Locations in Onondaga Lake
Table 8 Summary of Number of Individuals per Species Captured in Gill Nets: May –
October 2012
Table 9 Lake Sturgeon Catch and Tag Information – 2012
Table 10 Summary of Number of Individuals per Species Captured by Seining – August
2012
Table 11 Mercury Concentrations in Zooplankton Samples Collected at South Deep in 2012
LIST OF FIGURES
Figure 1 Fish Sampling Locations for 2012 Tissue Chemical Analyses
Figure 2 Sampling Locations for 2012 Fish Community Assessment
Figure 3 Mercury versus Age in Onondaga Lake Fish Sampled in 2012
Figure 4A/ 4B Total Mercury and Methylmercury Concentrations in Zooplankton
at South Deep in 2012
ONONDAGA LAKE TISSUE AND BIOLOGICAL
MONITORING REPORT FOR 2012
PARSONS
P:\Honeywell -SYR\447479 - 2012 Remedial Goal Monitoring\09.0 Reports\9.2 Monitoring Summary - 2012\2012 Tissue Monitoring Report_FINAL.docx August 29, 2013
iii
TABLE OF CONTENTS
(CONTINUED)
LIST OF APPENDICES
APPENDIX A DATA USABILITY AND SUMMARY REPORT: ONONDAGA LAKE
2012 TISSUE MONITORING: FISH AND ZOOPLANKTON
ONONDAGA LAKE TISSUE AND BIOLOGICAL
MONITORING REPORT FOR 2012
PARSONS
P:\Honeywell -SYR\447479 - 2012 Remedial Goal Monitoring\09.0 Reports\9.2 Monitoring Summary - 2012\2012 Tissue Monitoring Report_FINAL.docx August 29, 2013
iv
LIST OF ACRONYMS
CPUE catch (of fish) per unit of effort
DDT dichloro diphenyl trichloroethane
DUSR Data Usability and Summary Report
mg/kg milligrams per kilogram (or parts per million in water)
NYSDEC New York State Department of Environmental Conservation
PCBs polychlorinated biphenyls
PIT passive integrated transponder
PHM Permanent Habitat Module
QA/QC quality assurance / quality control
RI remedial investigation
ROD Record of Decision
SMU sediment management unit
SUNY-ESF State University of New York College of Environmental Science and
Forestry
UFI Upstate Freshwater Institute
USEPA United States Environmental Protection Agency
DEFINITIONS
Benthic Bottom dwelling (i.e., in sediment)
Littoral Zone within a body of water adjacent to shore where waters do not
thermally stratify. In Onondaga Lake, the outer extent of the littoral zone
corresponds to a water depth of 30 ft. (9 meters).
ng/L Nanogram per liter or part per trillion in water. 1 ng/L is the same as
0.000001 milligram per liter (mg/L) or part per million.
Profundal Offshore zone within a water body where water depths are greater than the
depth to which sunlight can penetrate to support aquatic plants, in contrast
with the littoral zone closer to shore. In Onondaga Lake, the profundal
zone stratifies each year from May to October based on water temperature.
The profundal zone of Onondaga Lake occupies 64 percent of the lake
surface area based on a minimum water depth of 30 ft. (9 meters).
ONONDAGA LAKE TISSUE AND BIOLOGICAL
MONITORING REPORT FOR 2012
PARSONS
P:\Honeywell -SYR\447479 - 2012 Remedial Goal Monitoring\09.0 Reports\9.2 Monitoring Summary - 2012\2012 Tissue Monitoring Report_FINAL.docx August 29, 2013
ES-1
EXECUTIVE SUMMARY
The objectives of tissue and biological monitoring conducted on behalf of Honeywell in
2012 were to document conditions in Onondaga Lake based on parameters established to
evaluate the effectiveness of lake remediation. This report includes results from the 2012
Onondaga Lake tissue monitoring and fish community monitoring efforts consistent with two
different work plans approved by the New York State Department of Environmental
Conservation (NYSDEC).
Adult sport fish and also alewife and gizzard shad prey fish tissue sampling were completed
in June before the first year of lake sediment dredging was initiated in late July 2012; the
remaining prey fish tissue sampling was completed in August. Fish community and zooplankton
monitoring were conducted before and after the start of dredging.
Preliminary remediation goals as fish tissue chemical concentrations were established for
fish in the lake bottom Record of Decision (ROD) issued by the NYSDEC and the United States
Environmental Protection Agency (USEPA) in 2005. Fish tissue monitoring that was completed
in 2012 included collection and chemical analysis of 75 adult sport fish and 40 composited
samples of prey fish, fish community assessments and fish population surveys. Fish community
monitoring was conducted to maintain continuity with fish community data collected from 2008
through 2011 that helps to characterize fish community dynamics in Onondaga Lake prior to
habitat restoration. Zooplankton mercury concentrations were monitored in 2012 as a
continuation of lake monitoring work conducted since 2008 to help assess mercury movement
within the lake’s food web.
ONONDAGA LAKE TISSUE AND BIOLOGICAL
MONITORING REPORT FOR 2012
PARSONS
P:\Honeywell -SYR\447479 - 2012 Remedial Goal Monitoring\09.0 Reports\9.2 Monitoring Summary - 2012\2012 Tissue Monitoring Report_FINAL.docx August 29, 2013
1-1
SECTION 1
INTRODUCTION
Tissue and biological monitoring in Onondaga Lake were conducted on behalf of Honeywell
in 2012 to document lake conditions during the year when remedial dredging and capping in the
lake were initiated. Tissue monitoring forms a portion of the basis for evaluating the
effectiveness of the lake bottom remedy identified in the ROD issued by the NYSDEC and the
USEPA (NYSDEC and USEPA, 2005) and described in the Remedial Design Work Plan for the
Lake Bottom (Parsons, 2009). Fish community monitoring provides data to help facilitate an
understanding of fish community dynamics in Onondaga Lake. Most of the 2012 tissue and
biological monitoring was conducted in the lake before July 17, 2012 when the first year of
dredging was initiated. Capping of lake sediment was initiated following the start of dredging.
The program objectives for fish tissue and fish community monitoring completed in 2012
were to provide additional data for future understanding of:
Remedy effectiveness in achieving remediation goals for Onondaga Lake
Fish community response to habitat restoration
As in previous years, the 2012 work scope for tissue monitoring efforts was submitted as a
work plan approved by NYSDEC (Parsons, Anchor QEA and Exponent, 2012b). The 2012 work
scope for fish community monitoring was submitted as a separate work plan also approved by
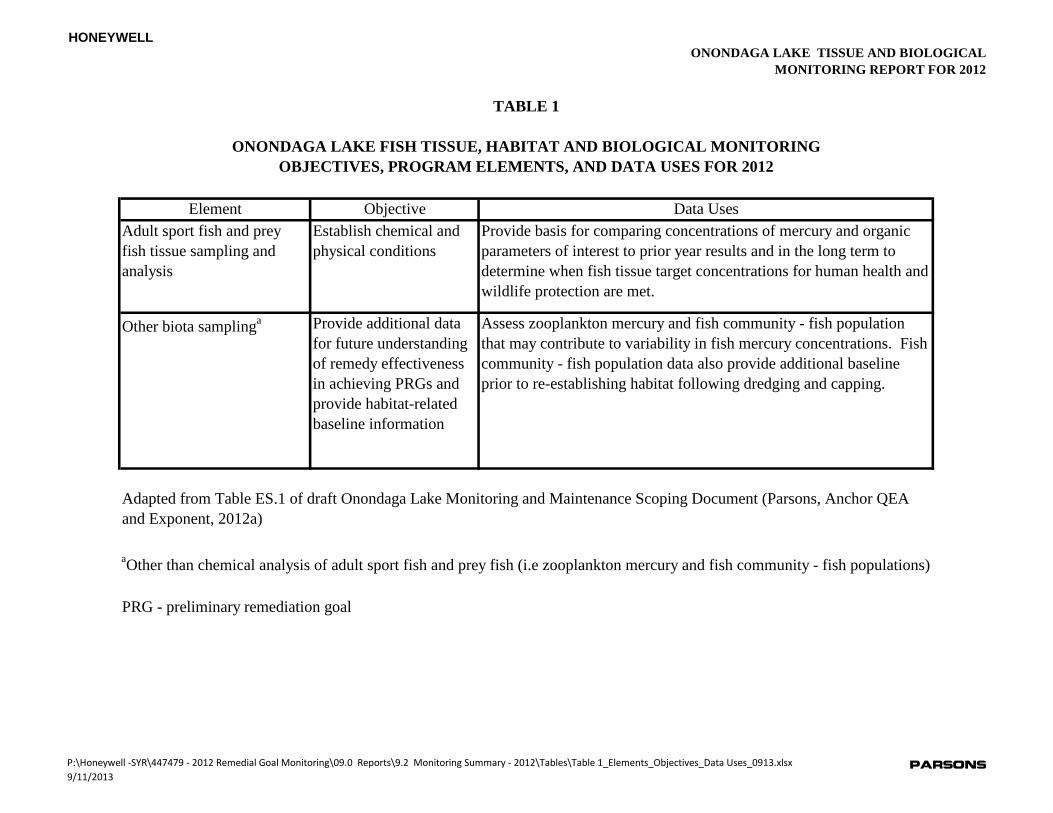
NYSDEC (Parsons and Anchor QEA, 2012). Tissue and fish community monitoring objectives,
program elements, and data uses are presented in Table 1.
This report follows the format applied in the Baseline Monitoring Reports for Onondaga
Lake for 2008 through 2011 (Parsons, Exponent, and Anchor QEA, 2011a, 2011b, 2011c and
2012). Section 1 provides an introduction. Section 2 presents a summary of the sampling and
analytical work. Section 3 provides a summary of data management and data validation.
Section 4 presents a brief assessment of the 2012 tissue data. Appendix A provides the 2012
Data Usability and Summary Reports (DUSR) for tissue monitoring and follows the format from
prior monitoring years including laboratory data verification, data validation, and data usability.
ONONDAGA LAKE TISSUE AND BIOLOGICAL
MONITORING REPORT FOR 2012
PARSONS
P:\Honeywell -SYR\447479 - 2012 Remedial Goal Monitoring\09.0 Reports\9.2 Monitoring Summary - 2012\2012 Tissue Monitoring Report_FINAL.docx August 29, 2013
2-1
SECTION 2
SAMPLING AND ANALYSIS SUMMARY FOR 2012
Sample collection, sample management, equipment decontamination, and other lake
monitoring field procedures were conducted in accordance with work plans for tissue and
biological monitoring approved in advance by NYSDEC (Parsons, Anchor QEA and Exponent,
2012b and Parsons and Anchor QEA, 2012). Field and analytical procedures used to conduct the
work reported herein are documented in a quality assurance project plan (Parsons, Anchor QEA
and Upstate Freshwater Institute (UFI), 2012). Surface water and sediment trap monitoring
completed as part of the work scope for the 2012 portion of the nitrate addition pilot test
(Parsons and UFI, 2012) are summarized in the report for 2012 nitrate addition efforts (Parsons
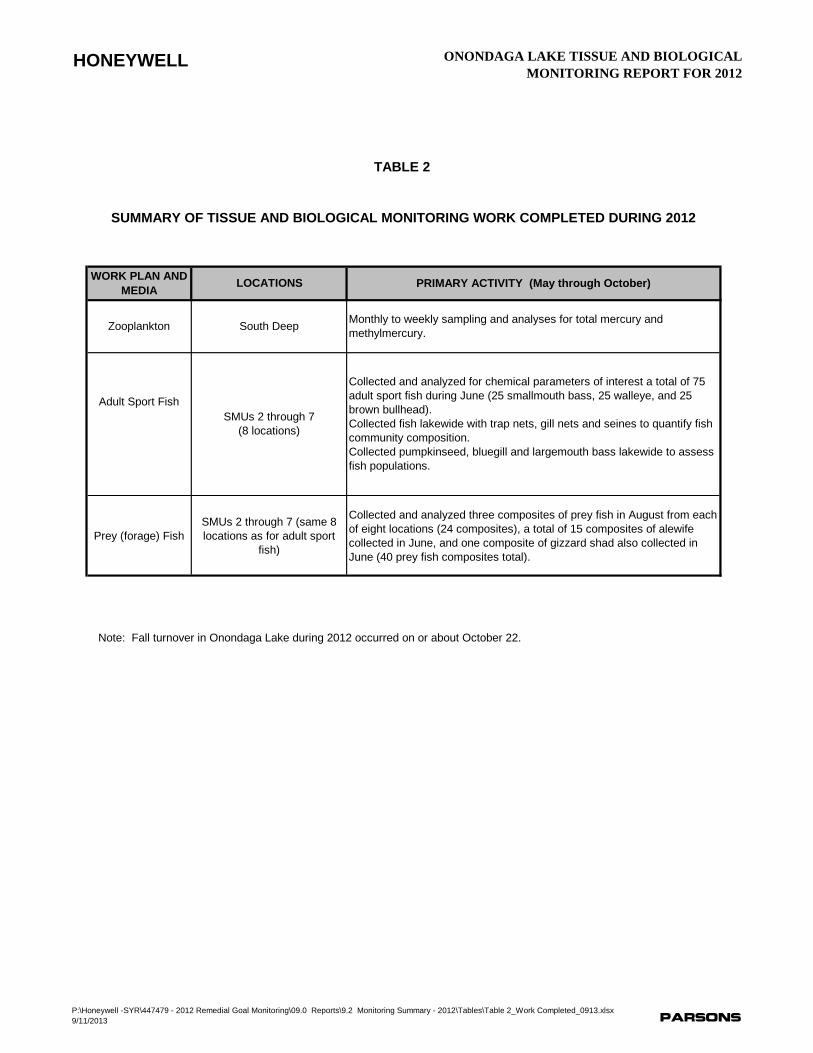
and UFI, 2013). Table 2 summarizes the media, sampling locations, and primary activities
completed for the 2012 tissue monitoring efforts.
Each of the 2012 tissue monitoring efforts were completed using standard procedures
described in a quality assurance project plan (Parsons, Anchor QEA and Upstate Freshwater
Institute, 2012).
2.1 FISH SAMPLING
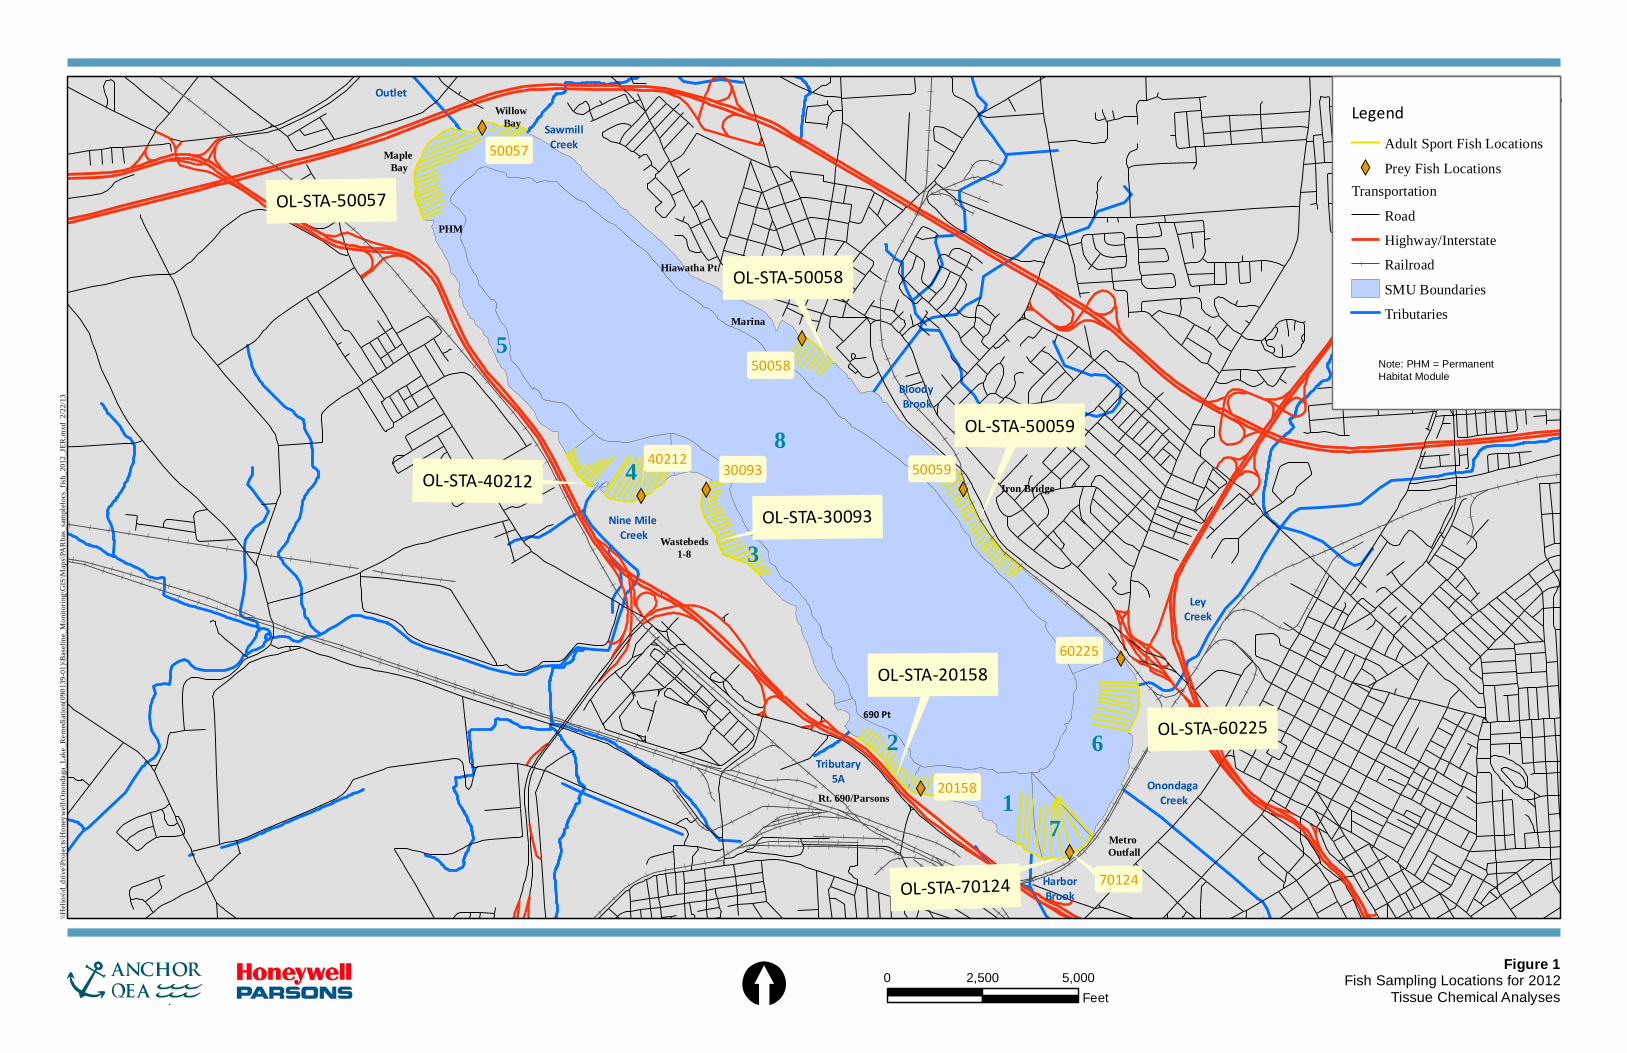
Fish tissue monitoring during 2012 included adult sport fish and prey fish sample collection
throughout the lake (Figure 1). Fish sampling for tissue chemical analyses was conducted by
Anchor QEA with assistance from the Onondaga County Department of Water Environment
Protection and the State University of New York College of Environmental Science and Forestry
(SUNY-ESF). Fish population and community assessments (including lake sturgeon) were
conducted during 2012 throughout the lake (Figure 2) primarily by SUNY-ESF under the
supervision of Dr. Neil Ringler with support and oversight by Anchor QEA.
Sampling locations for fish tissue chemical analyses were the same as those occupied during
2008 through 2011, coinciding with historical locations sampled for fish tissue during the
remedial investigation for Onondaga Lake (TAMS Consultants, 2002), as well as locations
sampled as part of Onondaga County’s Ambient Monitoring Program.
Adult sport fish sampling for tissue chemical analyses was conducted from June 14 through
July 3, 2012. Prey fish sampling for tissue chemical analyses was conducted from June 14 to
June 20 for alewife and gizzard shad and on August 8 and August 9 for other prey fish. Fish
samples for tissue analyses were collected and analyzed using the same methods as prior years,
including electrofishing, gill netting, trap netting, and seining. Electrofishing was the preferred
method for sampling brown bullhead, because bullhead tend to move inshore during the night
and are susceptible to capture. Trap nets were a secondary source for collection of bullhead
which can be captured in these passive nets while moving along the shoreline. Walleye and
smallmouth bass were primarily captured in gill nets set at the 13- to 23-ft. (4- to 7-meter) water
depth also during night time hours when walleye and smallmouth bass are more active.
ONONDAGA LAKE TISSUE AND BIOLOGICAL
MONITORING REPORT FOR 2012
PARSONS
P:\Honeywell -SYR\447479 - 2012 Remedial Goal Monitoring\09.0 Reports\9.2 Monitoring Summary - 2012\2012 Tissue Monitoring Report_FINAL.docx August 29, 2013
2-2
Occasionally, walleye or smallmouth bass were captured by electroshocking. Prey fish were
captured with seines and gill nets along the shoreline where they typically congregate during day
time hours.
Samples from three adult sport fish species and three prey fish families were collected for
tissue chemical analyses. For adult sport fish, 25 individuals from each of the three species
[smallmouth bass (Micropterus dolomieu), walleye (Sander vitreus), and brown bullhead
(Ameiurus nebulosus)], were targeted from eight locations (based on a target of three to four
individual fish from each species at each location) for a total of 75 adult sport fish tissue
samples. The three adult sport fish species were also collected in previous years. Legal size fish
were targeted, with a maximum size identified to try to restrict the variability of size on mercury
concentration; 305 to 500 mm total length for smallmouth bass, 200 to 350 mm total length for
brown bullhead, and 380 mm to 575 mm total length for walleye. Three walleye that were
captured exceeded the targeted size range but were retained because they would not have
survived capture.
A pectoral spine from each adult brown bullhead and otoliths (small ear bones) from each
smallmouth bass and walleye were collected to estimate fish age. Total length and weight of each
adult fish sample for tissue chemical analyses were recorded as well.
Prey fish samples collected for tissue chemical analyses included fish from the topminnow,
silversides, and shad families (Fundulidae, Atherinidae, Clupeidae). Species of prey fish were
determined based on availability and included 21 banded killifish (Fundulus diaphanus)
composites, 3 brook silversides (Labidesthes sicculus) composites, 1 gizzard shad (Dorosoma
cepedianum) composite, and 15 alewife (Alosa pseudoharengus) composites. Alewife and
gizzard shad were collected by gill netting at the eight prey fish locations (2 composites per
location) in mid-June 2012, because alewife move into shallower waters during the spring and
early summer allowing for easier capture at that time. The remaining prey fish composites were
collected by seining at each of the eight locations (three composites per location), for a total of
24 composite samples submitted for mercury analysis. Composite samples included 10 to 15
prey fish per sample, depending on weights of individual fish.
Fish population and community composition were assessed again in 2012 as part of the
Onondaga Lake fish monitoring effort. In addition to the smaller-mesh gill net used during
community surveys, a larger-sized gill net was used to better understand lake sturgeon
abundance and distribution. Community sampling was conducted with 5.9-inch stretch mesh
netting, and sturgeon gill netting was conducted with an eight-panel experimental gill net with
two panels each of 6-, 8-, 10-, and 12-inch stretch mesh in sequence for two series. Captured
sturgeon were measured for total length in mm, weighed in grams, tagged with an individually
marked Carline dangler tag and a passive integrated transponder (PIT) tag, and the basal portion
of the pelvic fin ray was removed for age estimation. Double tagging was conducted to minimize
the loss of information due to tag loss.
ONONDAGA LAKE TISSUE AND BIOLOGICAL
MONITORING REPORT FOR 2012
PARSONS
P:\Honeywell -SYR\447479 - 2012 Remedial Goal Monitoring\09.0 Reports\9.2 Monitoring Summary - 2012\2012 Tissue Monitoring Report_FINAL.docx August 29, 2013
2-3
Distributions of adult sport fish were assessed monthly from May through October at 10
locations around the lake using gill and trap netting to determine overall community structure
(Figure 2). The trap net location in SMU 2 was only sampled in May and June, because that
location became inaccessible when dredging started in that area of the lake.
Sampling using electroshocking equipment on a boat was conducted in June to estimate
population density of several species. Individual largemouth bass, pumpkinseed, and bluegill
sunfish were measured for total length (mm), marked with a fin clip (for smaller fish) or
uniquely numbered t-bar anchor floy tag (for larger fish), and examined for visible marks.
Sampling using electroshocking was condensed in 2012 to four events over a two-week period in
an attempt to get a more rigorous population estimate, which was different from the monthly
sampling conducted in 2008 through 2011. Population estimates for largemouth bass,
pumpkinseed sunfish, and bluegill sunfish were calculated using the modified Schnabel estimator
(Ricker, 1975), as described in the Book 2 Work Plan for 2008 (Parsons, Exponent, and
QEA, 2008). Sample size was not sufficient to conduct smallmouth bass population estimates.
These species were assessed based on their dominance over the years in the lake and the
likelihood of obtaining enough samples to calculate a population estimate.
2.2 ZOOPLANKTON SAMPLING
Zooplankton samples were collected at South Deep at a frequency ranging from weekly to
monthly from June 11 to November 19, 2012. UFI also attempted to collect samples of large
Daphnia zooplankton (at least 1 millimeter in length); however, similar to 2010 and 2011,
quantities of Daphnia large enough for chemical analysis were not found during any of the 2012
zooplankton sampling events.
Zooplankton community composition was not assessed in 2012.
2.3 ANALYTICAL WORK SCOPE
Fillet samples (NYSDEC standard fish fillet based on NYSDEC 2000; skin-on except for
brown bullhead) were collected from each adult sport fish for mercury analysis. In addition to
being analyzed for mercury, a subset of adult sport fish fillet samples (12 per species for a total
of 36 samples) were analyzed for polychlorinated biphenyl (PCB) aroclors, dichlorodiphenyl
trichlorethane (DDT) and metabolites, hexachlorobenzene, and lipids. Dioxins/furans were also
analyzed in five fillet samples from each of the species of adult sport fish for a total of 15
samples. Samples selected for analysis of PCBs, DDT and its metabolites, hexachlorobenzene,
lipid content and dioxins/furans were representative of the various locations in the lake and were
similar to samples selected annually since 2008 for chemical analyses.
Prey fish samples consisted of 40 composite samples that were analyzed for mercury. Ten
composite samples also were analyzed for PCBs, DDT and metabolites, hexachlorobenzene, and
lipids.
Zooplankton samples collected at South Deep were analyzed for total mercury and
methylmercury.
ONONDAGA LAKE TISSUE AND BIOLOGICAL
MONITORING REPORT FOR 2012
PARSONS
P:\Honeywell -SYR\447479 - 2012 Remedial Goal Monitoring\09.0 Reports\9.2 Monitoring Summary - 2012\2012 Tissue Monitoring Report_FINAL.docx August 29, 2013
3-1
SECTION 3
DATA MANAGEMENT AND VALIDATION SUMMARY
3.1 DATABASE
Validated results from each of the 2012 tissue monitoring efforts have been stored and
accounted for in Honeywell’s Locus Focus data management system for Onondaga Lake.
3.2 QUALITY ASSURANCE/QUALITY CONTROL (QA/QC)
Sample identification, QA/QC procedures, sample collection, data entry, and data validation
were conducted in accordance with the three agency-approved work plan addenda. Verification
of sampling information and chemical data occurred at several levels during the field and
laboratory work. Data verification included checking procedures for compliance with the project
plan, correctness of protocols used in the field and at the laboratory, comparability of the data
collection and analysis procedures, and completeness of the data set and supporting
documentation.
TestAmerica Laboratories located in Pittsburgh, PA; North Canton, OH; and Knoxville, TN
performed the 2012 tissue monitoring laboratory analyses on behalf of Honeywell.
TestAmerica’s laboratory in North Canton, Ohio conducted the analyses of zooplankton for low-
level mercury and low-level methylmercury. TestAmerica’s laboratory in Knoxville, Tennessee
conducted the analyses of fish samples for dioxins and furans. Other analyses of fish samples
were performed by TestAmerica in their Pittsburgh, PA laboratory.
3.3 DATA VALIDATION
Chemical analytical data generated by TestAmerica were reviewed and validated by Parsons
for usability in accordance with data validation procedures described in the Data Usability and
Summary Report (DUSR) that is presented as Appendix A to this report.
ONONDAGA LAKE TISSUE AND BIOLOGICAL
MONITORING REPORT FOR 2012
PARSONS
P:\Honeywell -SYR\447479 - 2012 Remedial Goal Monitoring\09.0 Reports\9.2 Monitoring Summary - 2012\2012 Tissue Monitoring Report_FINAL.docx August 29, 2013
4-1
SECTION 4
DATA ASSESSMENT
4.1 FISH TISSUE CHEMCIAL RESULTS FOR 2012
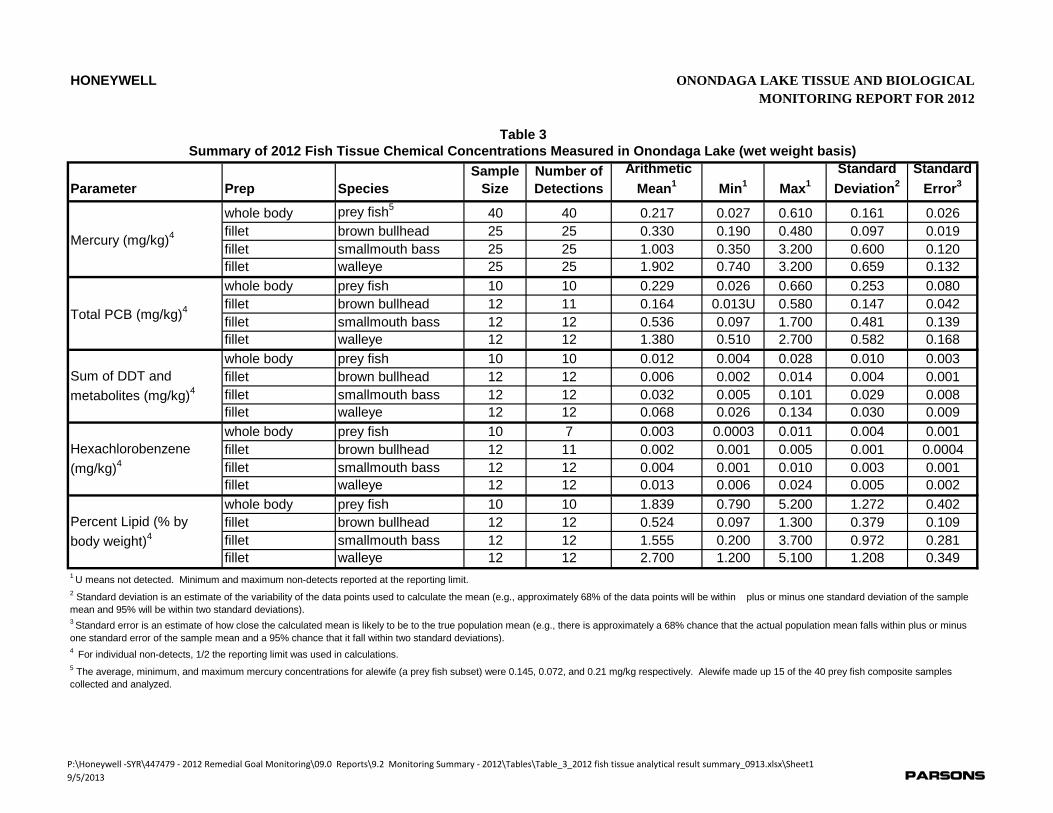
Mercury was detected in each of the 75 samples from adult sport fish fillets (0.19 to 3.2
milligram per kilogram or mg/kg [approximately the same as one part per million]), and in each
of the 40 whole-body prey fish composite samples (0.027 to 0.61 mg/kg) (Table 3). Mercury
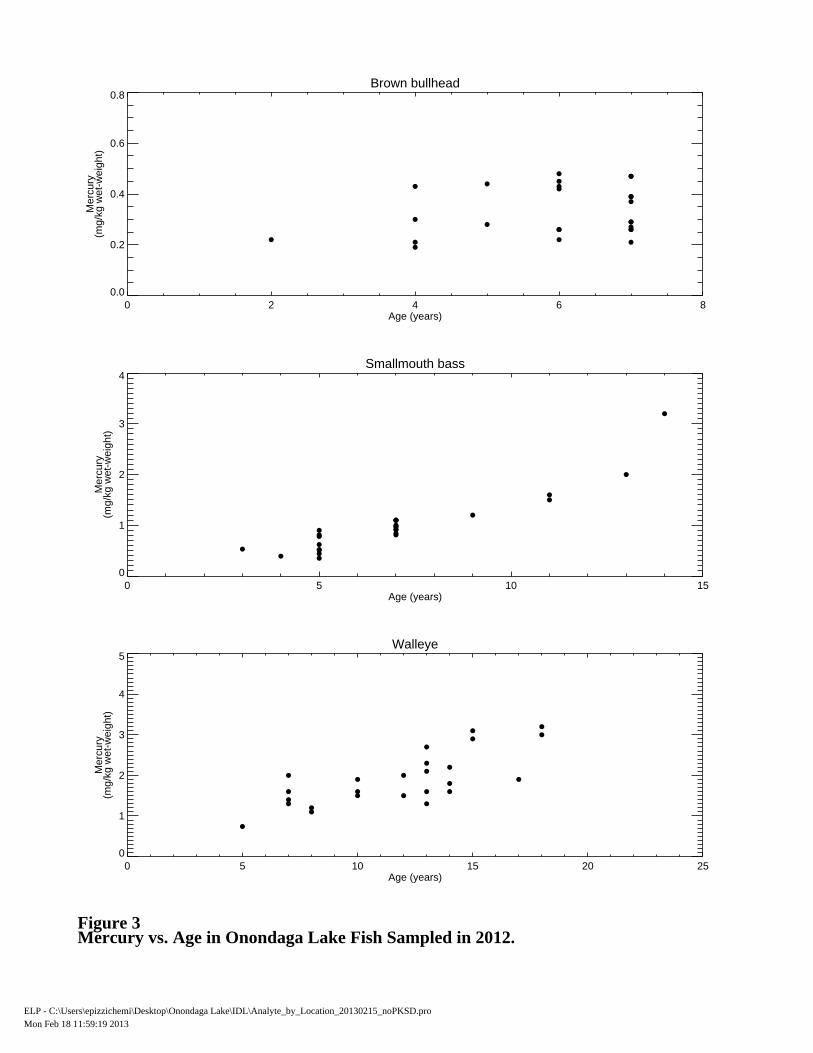
concentration versus age in adult sport fish was evaluated to assess trends with age. Mercury
concentration tends to increase with age in smallmouth bass and walleye, while no trend is
apparent for brown bullhead (Figure 3).
PCB aroclors were detected in each of the 12 of the smallmouth bass, in each of the 12
walleye samples, in 11 of the 12 brown bullhead samples, and in each of the 10 of the prey fish
composite samples collected in 2012 that were analyzed for organic compounds. PCB aroclors
were detected in 2012 fish tissue samples at concentrations ranging from 0.097 to 1.7 mg/kg in
smallmouth bass; 0.51 to 2.7 mg/kg in walleye; non-detect to 0.58 mg/kg in brown bullhead and
0.026 to 0.66 mg/kg in prey fish composites (Table 3).
DDT and metabolites were detected in each of the 12 of the smallmouth bass, walleye, and
brown bullhead adult sport fish fillet samples and in each of the 10 of the prey fish composite
samples collected in 2012 that were analyzed for organic compounds. DDT and metabolites were
detected in 2012 fish tissue samples at concentrations ranging from 0.005 to 0.10 mg/kg in
smallmouth bass, 0.026 to 0.13 mg/kg in walleye, 0.002 to 0.014 mg/kg in brown bullhead and
0.004 to 0.028 mg/kg in prey fish composites (Table 3).
Hexachlorobenzene was detected in each of the 12 of the smallmouth bass, in each of the 12
walleye, in 11 of the 12 brown bullhead adult sport fish fillet samples and in 7 of the 10 prey fish
composite samples collected in 2012 that were analyzed for organic compounds.
Hexachlorobenzene was detected in 2012 fish tissue samples at concentrations ranging from
0.001 to 0.010 mg/kg in smallmouth bass, 0.006 to 0.024 mg/kg in walleye, 0.001 to 0.005
mg/kg in brown bullhead, and 0.0003 to 0.011 mg/kg in prey fish composites (Table 3).
Lipid contents in 2012 fish tissue samples ranged from 0.20 to 3.7 percent in smallmouth
bass fillets, 1.2 to 5.1 percent in walleye fillets, and 0.097 to 1.3 percent in brown bullhead fillets
and 0.79 to 5.2 percent in prey fish composites (Table 3).
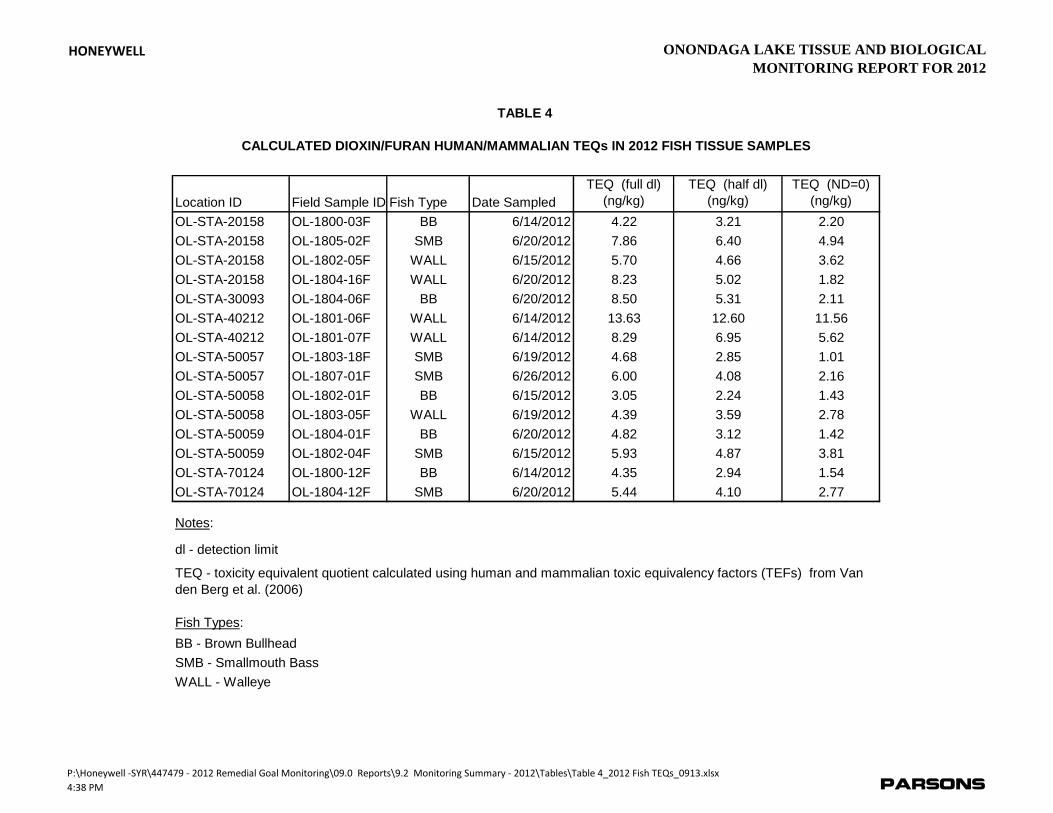
Dioxins and furans were detected in each of the five smallmouth bass, walleye, and brown
bullhead adult sport fish fillet samples collected in 2012 that were analyzed for dioxins.
Detections of dioxins and furans are reported in Table 4 as toxicity equivalent quotients on a
nanogram per kilogram basis. One ng/kg is the same as one part per trillion or 0.000001 part per
million.
ONONDAGA LAKE TISSUE AND BIOLOGICAL
MONITORING REPORT FOR 2012
PARSONS
P:\Honeywell -SYR\447479 - 2012 Remedial Goal Monitoring\09.0 Reports\9.2 Monitoring Summary - 2012\2012 Tissue Monitoring Report_FINAL.docx August 29, 2013
4-2
4.2 FISH COMMUNITY MONITORING RESULTS FOR 2012
4.2.1 Fish Community Assessment
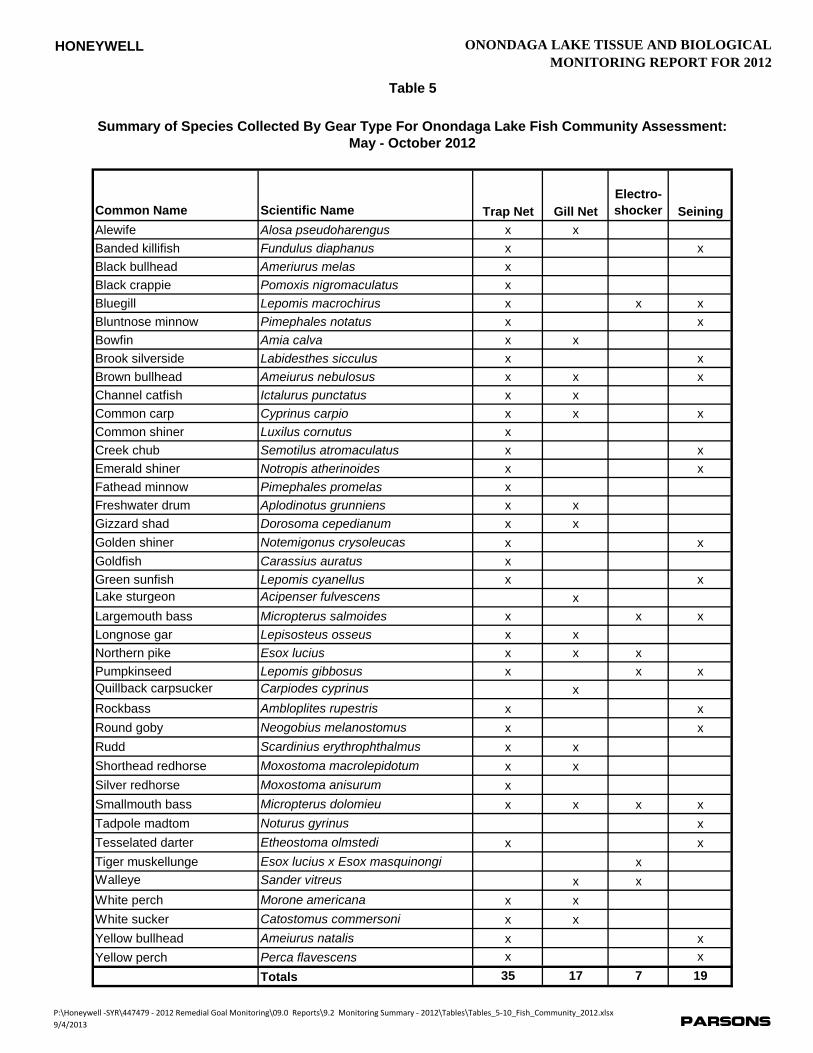
Fish representing 40 species were captured or observed in Onondaga Lake during fish
community sampling at 10 locations from May through October of 2012. Fish representing 35
species were captured with trapnets, 17 species with gill nets, 7 species with a boat
electroshocker, and 19 species with seines (Table 5).
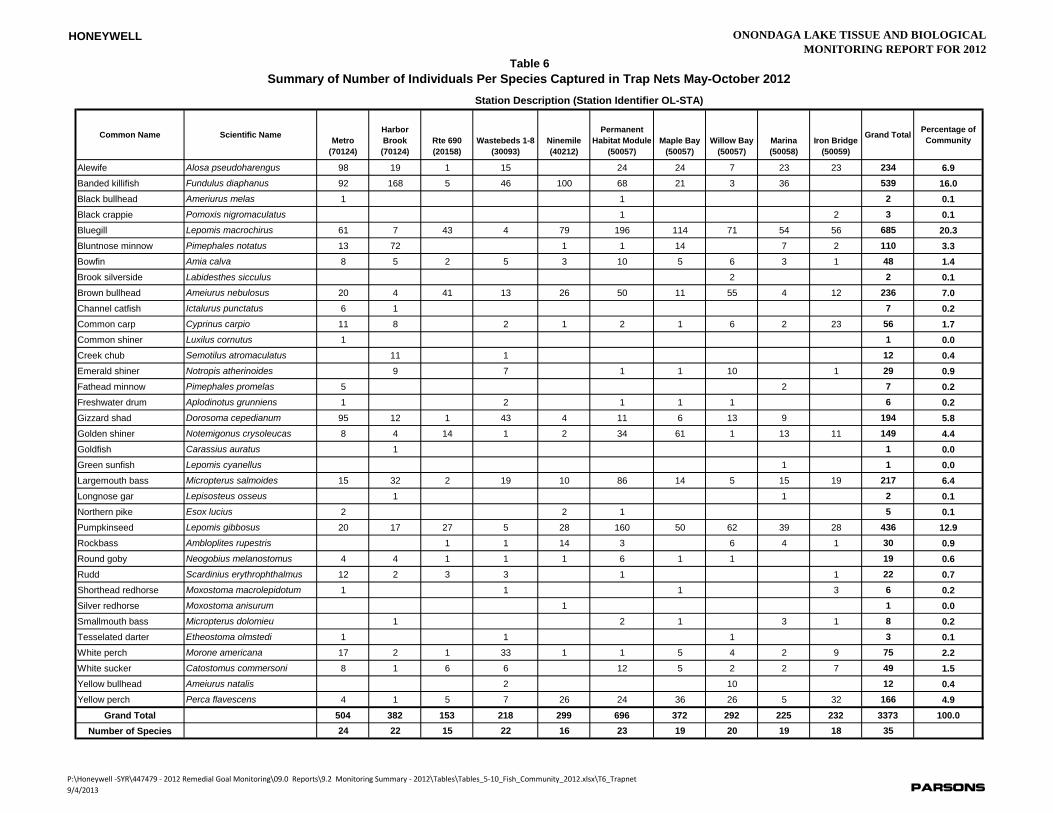
During trap net sampling, nets were set at each location once per month during the late
afternoon/evening and checked the following morning. Trap net locations were sampled from
May through October except at the Route 690 location where sampling was conducted in May
and June. A total of 3,373 fish representing 35 species were captured during 57 nights of trap
netting during 2012 (Table 6). The 2012 fish community from trap net sampling was dominated
by bluegill (20 percent of the total catch). Banded killifish made up 16 percent of the community
from trap net sampling followed by pumpkinseed (13 percent), and brown bullhead (7 percent).
Seven species made up between one and six percent of the catch and 21 species contributed less
than one percent of the total catch. The number of species captured with trap nets in 2012 at each
location varied from 15 species at the Rte. 690 location (sampled for only two months) to 24
species at the Metro location (Table 6).
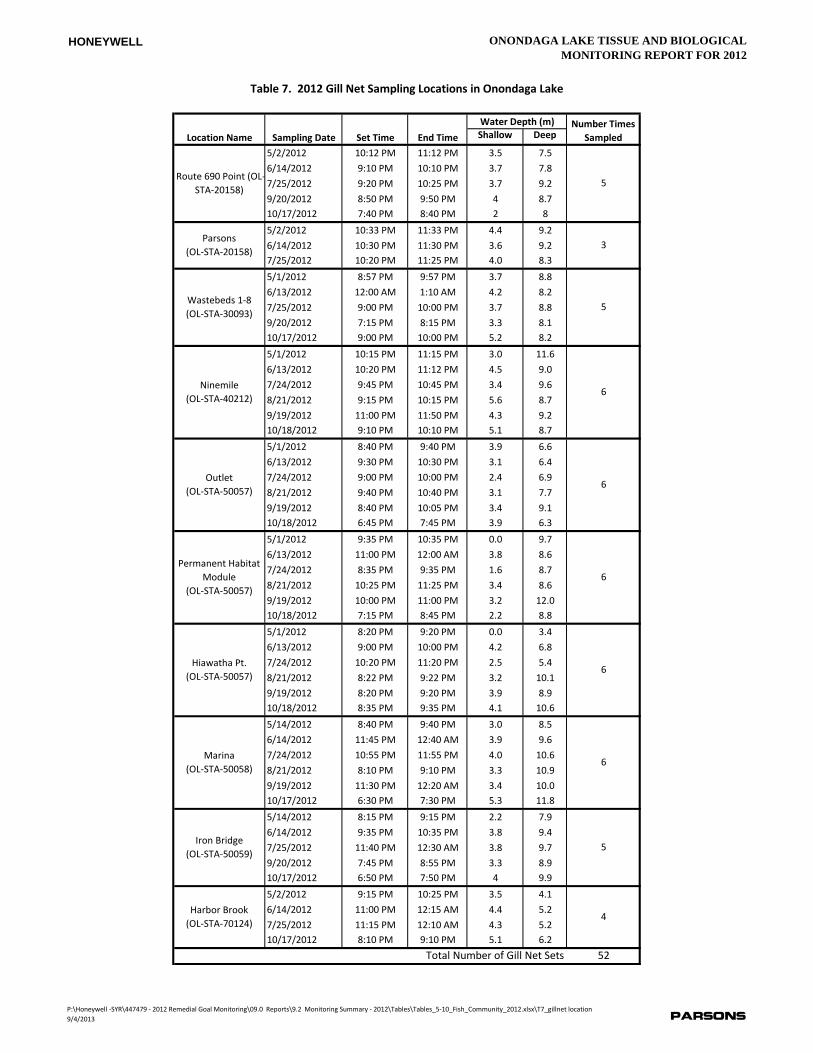
Data were collected from fifty-two gill nets that were each set for approximately two hours
between May 1 and October 18, 2012. These 52 gill nets were set on three to six different dates
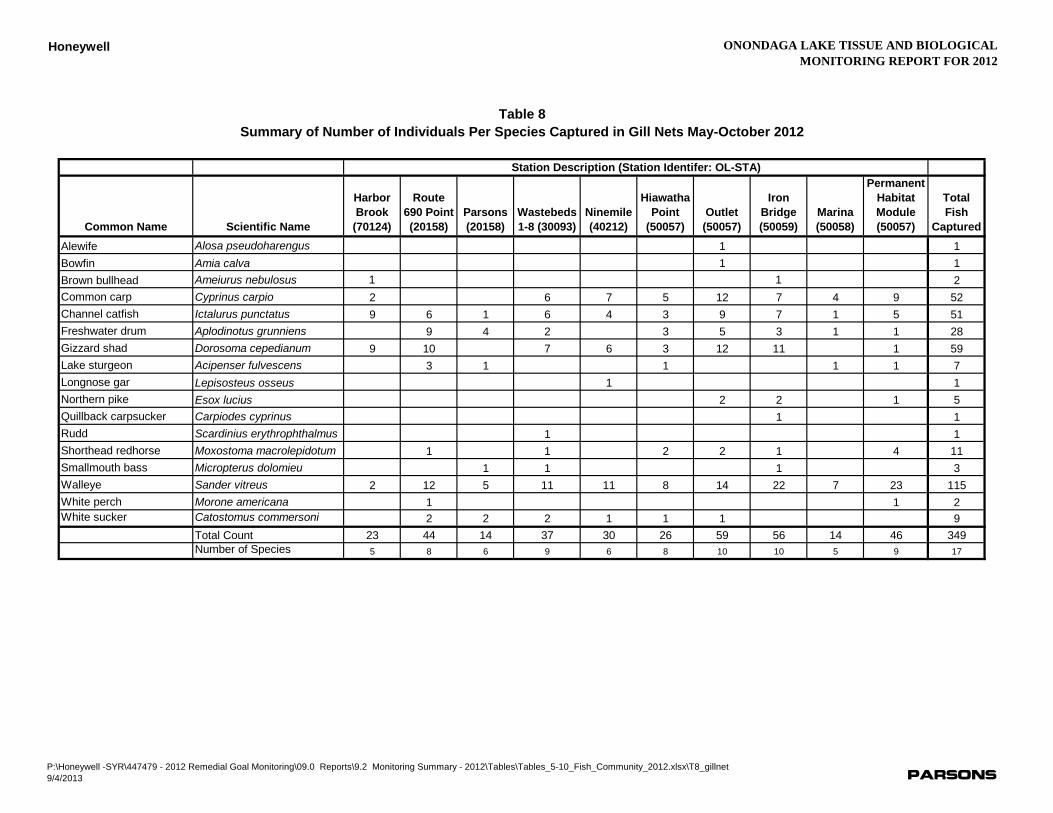
at 10 different locations throughout Onondaga Lake (Table 7). A total of 349 fish and 17 species
were captured during sampling (Table 8). The most abundant fish captured was walleye (33
percent of the total catch), followed by gizzard shad (17 percent), common carp (15 percent), and
channel catfish (15 percent). In addition, seven lake sturgeons were captured during regular gill
netting as follows: three from 690 Point, and one each from Parsons, Marina, PHM, and
Hiawatha Point. The number of species per location varied between five species at both the
Marina and Harbor Brook locations and 10 species at both the Outlet and Iron Bridge locations.
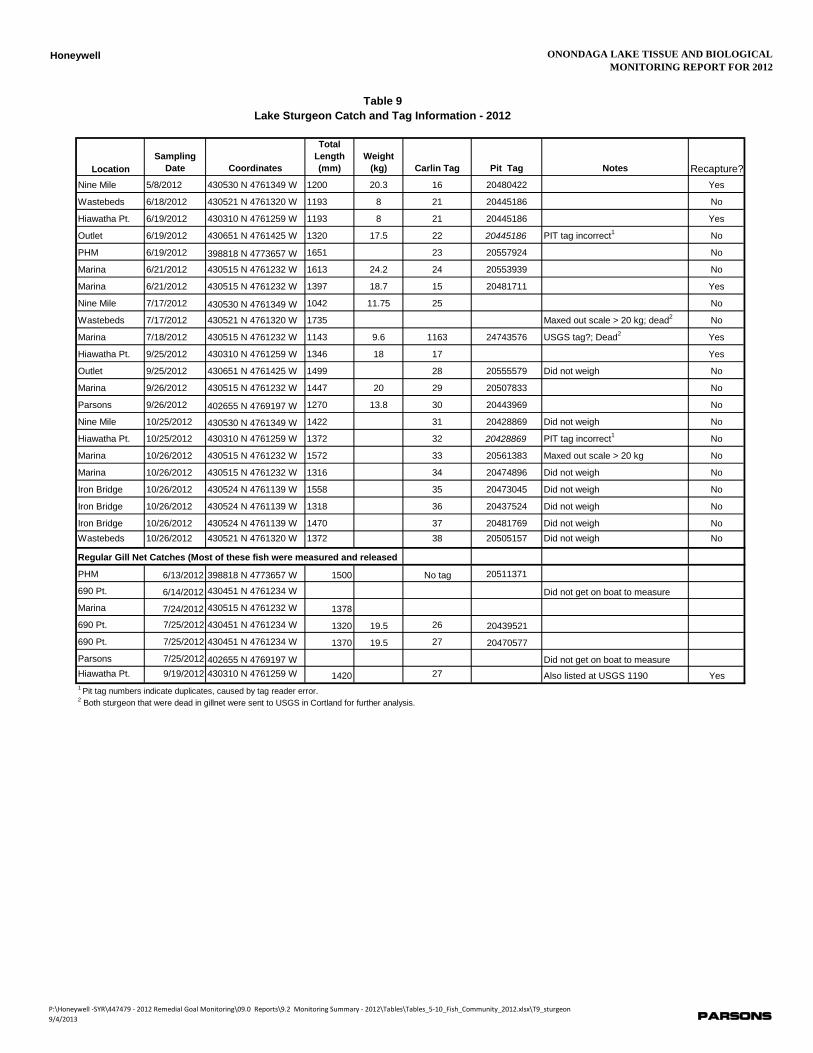
Thirty-nine lake sturgeon gill nets were set at eight locations from May 8 through October
26. They were fished for an average of four hours per net. Twenty-two sturgeon were captured
with a catch per unit of effort (CPUE) (fish per hour) of approximately 0.15 (excluding the seven
sturgeon captured during community sampling). High temperatures in July resulted in the
mortality of two sturgeon, one on July 17 and the other on July 18. Following the first mortality,
sampling was reduced to shorter sets and then completely suspended following the second
mortality through the month of August (until temperatures were below 25oC). Both of the dead
sturgeon were sent to Dr. Dawn Dittman at US Geological Survey’s Tunison lab in Cortland,
NY. Sixteen lake sturgeon were tagged in 2012 with Carlin dangler tags (Table 9). Mean total
length of the 22 sturgeon was 54.5 in. (1384 mm) with a range from 41 to 68.3 in. (1042 mm to
1735 mm). Weights were not collected for each fish because some of the fish surpassed the
maximum weight limit (20 kg) of the scale that was used. Eleven lake sturgeon caught with lake
sturgeon gill nets were weighed and weights ranging from 17.6 and 53.4 pounds (8 to 24.2 kg)
were recorded. At least one sturgeon was collected at each sampling location during targeted
sampling with six collected at the marina, three each collected at Hiawatha Point, Iron Bridge,
ONONDAGA LAKE TISSUE AND BIOLOGICAL
MONITORING REPORT FOR 2012
PARSONS
P:\Honeywell -SYR\447479 - 2012 Remedial Goal Monitoring\09.0 Reports\9.2 Monitoring Summary - 2012\2012 Tissue Monitoring Report_FINAL.docx August 29, 2013
4-3
Ninemile Creek, and Wastebed 1-8 locations, two collected at the Outlet location, and one each
collected at the Parsons and the Permanent Habitat Module (PHM) locations (Table 9).
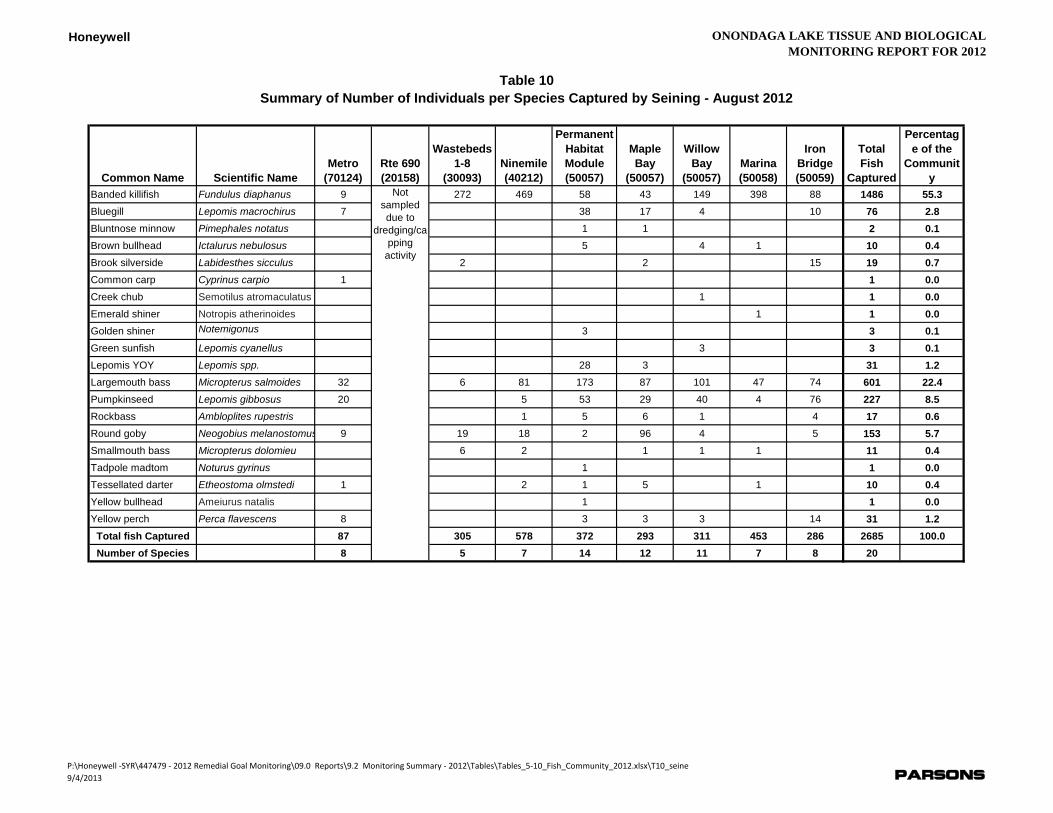
Seining was conducted during the week of August 13 at eight locations (Figure 1 and
Table 10). Two thousand six hundred and eighty five (2,685) fish were captured from 20 species.
Fish catch was dominated by banded killifish (55 percent of the total catch) and largemouth bass
(22 percent), pumpkinseed (8.5 percent), round goby (5.7 percent), bluegill (2.8 percent), and
yellow perch (1.2 percent) made up the majority of the other species captured. The other 13
species captured each contributed one percent or less of the total catch and three percent of the
total catch combined. The number of species captured at each location ranged from five at the
Wastebeds 1 through 8 location to 14 at the PHM location (Table 10).
4.2.2 Fish Population Assessment for Adult Pumpkinseed, Bluegill and Largemouth
Bass
A total of 929 pumpkinseed with total lengths of 100 mm [3.9 in.] or more were captured
and marked during four electroshocking sampling events in June 2012 with 10 recaptures. The
lakewide pumpkinseed population for 2012 was estimated at 28,655 with a 95 percent
confidence interval of 18,328 to 65,641 fish.
A total of 833 bluegill with total lengths of 100 mm [3.9 in.] or more were captured and
marked during four sampling events in June 2012 with six recaptures. The lakewide bluegill
population for 2012 was estimated at 36,415 with a 95 percent confidence interval of 21,600 to
115,920 fish.
A total of 286 largemouth bass with total lengths of 300 mm [11.8 in.] or more were
captured and marked during four sampling events in June 2012 with 14 recaptures. The lakewide
largemouth bass population for 2012 was estimated at 1,930 with a 95 percent confidence
interval of 1,297 to 3,777 fish.
4.3 ZOOPLANKTON MERCURY RESULTS FOR 2012
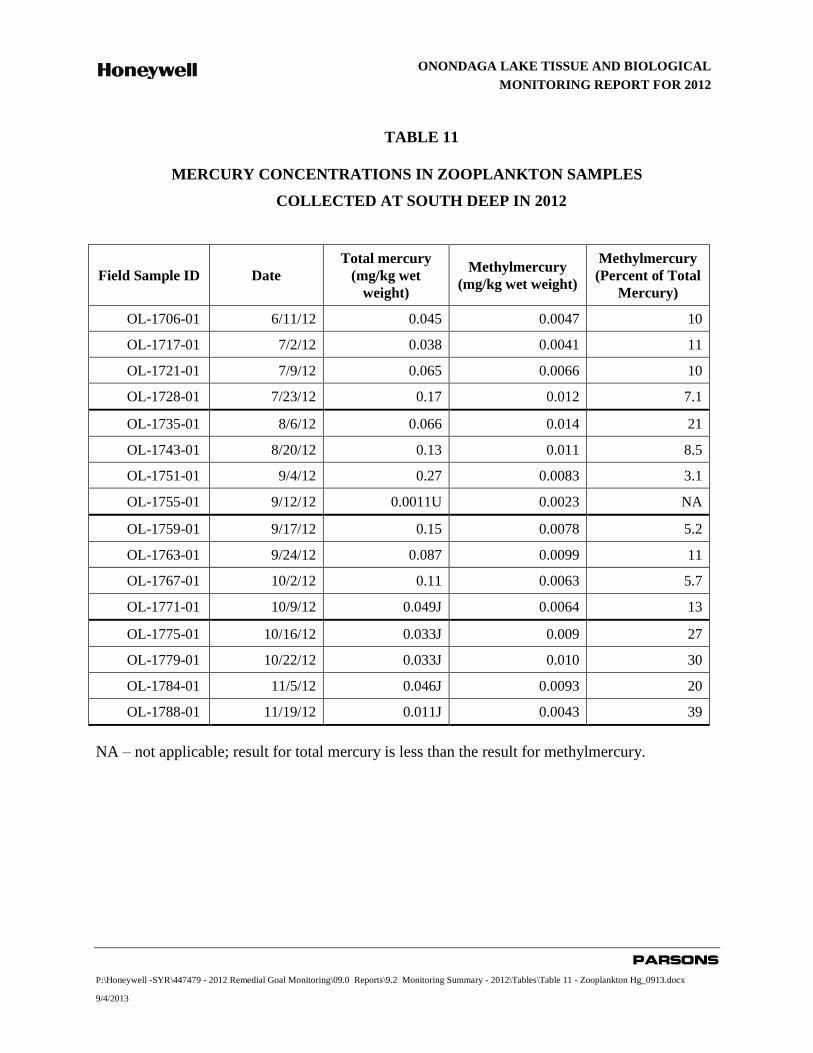
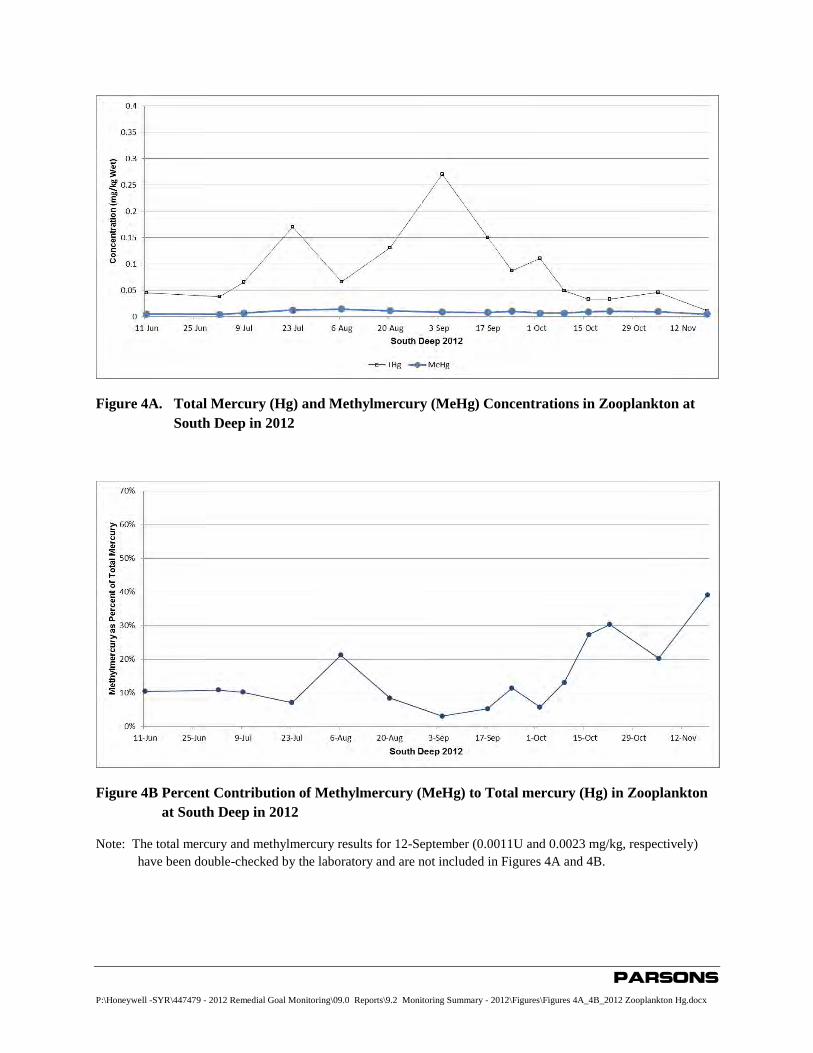
Table 11 and Figure 4A present total mercury and methylmercury concentrations measured
in zooplankton collected at South Deep in 2012. Methylmercury as a percentage of total mercury
in the 2012 zooplankton samples is presented in Figure 4B. Figures 4A and 4B do not include
results from September 12, 2012, because mercury results from September 12 show a
concentration of methylmercury that is relatively small but higher than the concentration of total
mercury
The highest total mercury concentration observed in 2012 in zooplankton was 0.27
milligrams per kilogram (or parts per million) (mg/kg) on a wet-weight basis observed on
September 4 more than a month prior to fall turnover. The highest methylmercury concentrations
observed in 2012 in zooplankton was 0.014 mg/kg on August 6. The highest portion of
methylmercury observed in 2012 as a percentage of total mercury was 21 percent prior to the
start of fall turnover and ranged from 20 to 39 percent following fall turnover.
ONONDAGA LAKE TISSUE AND BIOLOGICAL
MONITORING REPORT FOR 2012
PARSONS
P:\Honeywell -SYR\447479 - 2012 Remedial Goal Monitoring\09.0 Reports\9.2 Monitoring Summary - 2012\2012 Tissue Monitoring Report_FINAL.docx August 29, 2013
5-1
SECTION 5
REFERENCES
New York State Department of Environmental Conservation. 2000. Standard Operating
Procedures for General Fish Collection and Handling. Bureau of Habitat, Division of
Fish and Wildlife, New York State Department of Environmental Conservation. Albany,
NY.
New York State Department of Environmental Conservation and United States Environmental
Protection Agency Region 2. 2005. Record of Decision. Onondaga Lake Bottom Subsite
of the Onondaga Lake Superfund Site. July 2005.
Parsons, Exponent, and QEA, 2008. Baseline Monitoring Book 2 Work Plan: Fish, Invertebrate
and Littoral Water Monitoring for 2008. Prepared for Honeywell. September 2008.
Parsons, 2009. Remedial Design Work Plan for the Onondaga Lake Bottom Subsite. Prepared for
Honeywell. March 2009.
Parsons and Anchor QEA, 2012. Onondaga Lake Habitat and Biological Monitoring Work Plan
for 2012. Prepared for Honeywell. June 2012.
Parsons, Anchor QEA and Exponent, 2012a. Onondaga Lake Monitoring and Maintenance
Scoping Document. Prepared for Honeywell. Draft for agency review. April 2012.
Parsons, Anchor QEA and Exponent, 2012b. Onondaga Lake Tissue Monitoring Work Plan for
2012. Prepared for Honeywell. June 2012.
Parsons, Anchor QEA, and Upstate Freshwater Institute, 2012. Quality Assurance Project Plan
for Onondaga Lake Construction and Post-Construction Media Monitoring (Surface
Water, Biota and Sediment). Prepared for Honeywell. October 2012.
Parsons, Exponent, and Anchor QEA, 2011a. Baseline Monitoring Report for 2009. Prepared for
Honeywell. October 2011.
Parsons, Exponent, and Anchor QEA, 2011b. Baseline Monitoring Report for 2008. Prepared for
Honeywell. November 2011.
Parsons, Exponent, and Anchor QEA, 2011c. Baseline Monitoring Report for 2010. Prepared for
Honeywell. December 2011.
Parsons, Exponent, and Anchor QEA, 2012. Baseline Monitoring Report for 2011. Prepared for
Honeywell. December 2012.
Parsons and UFI, 2011. Work Plan for the Pilot Test to Add Nitrate to the Hypolimnion of
Onondaga Lake. Prepared for Honeywell. March 2011. Also, Addendum 1 (2012). May
2012.
ONONDAGA LAKE TISSUE AND BIOLOGICAL
MONITORING REPORT FOR 2012
PARSONS
P:\Honeywell -SYR\447479 - 2012 Remedial Goal Monitoring\09.0 Reports\9.2 Monitoring Summary - 2012\2012 Tissue Monitoring Report_FINAL.docx August 29, 2013
5-2
Parsons and UFI, 2013. Report for the Second Year of the Nitrate Addition Pilot Test (2013) in
the Hypolimnion of Onondaga Lake. Prepared for Honeywell. Draft for agency review.
January 2013.
Ricker, W.E. 1975. Computation and Interpretation of Biological Statistics of Fish Populations.
Fisheries Research Board of Canada Bulletin 191. 382 pp.
TAMS Consultants, Inc.. 2002. Onondaga Lake Remedial Investigation Report. Prepared with
YEC, Inc. for NYSDEC, Division of Environmental Remediation, Albany, New York.
Van den Berg, M., L.S. Birnbaum, M. Denison, M. De Vito, W. Farland, M. Feeley, H. Fiedler,
H. Hakansson, A. Hanberg, L. Haws, M. Rose, S. Safe, D. Schrenk, C. Tohyama, A.
Tritscher, J., Tuomisto, M. Tysklind, N. Walker, and R. Peterson. 2006. The World
Health Organization Re-Evaluation of Human and Mammalian Toxic Equivalency
Factors for Dioxins and Dioxin-Like Compounds. Toxicological Sciences. 93(2):223–
241 (doi:10.1093/toxics/kfl055).
.
ONONDAGA LAKE TISSUE AND BIOLOGICAL
MONITORING REPORT FOR 2012
PARSONS
P:\Honeywell -SYR\447479 - 2012 Remedial Goal Monitoring\09.0 Reports\9.2 Monitoring Summary - 2012\2012 Tissue Monitoring Report_FINAL.docx August 29, 2013
TABLES
HONEYWELLONONDAGA LAKE TISSUE AND BIOLOGICAL
MONITORING REPORT FOR 2012
Element Objective Data Uses
Adult sport fish and prey
fish tissue sampling and
analysis
Establish chemical and
physical conditions
Provide basis for comparing concentrations of mercury and organic
parameters of interest to prior year results and in the long term to
determine when fish tissue target concentrations for human health and
wildlife protection are met.
Other biota samplinga Provide additional data
for future understanding
of remedy effectiveness
in achieving PRGs and
provide habitat-related
baseline information
Assess zooplankton mercury and fish community - fish population
that may contribute to variability in fish mercury concentrations. Fish
community - fish population data also provide additional baseline
prior to re-establishing habitat following dredging and capping.
PRG - preliminary remediation goal
TABLE 1
ONONDAGA LAKE FISH TISSUE, HABITAT AND BIOLOGICAL MONITORING
OBJECTIVES, PROGRAM ELEMENTS, AND DATA USES FOR 2012
Adapted from Table ES.1 of draft Onondaga Lake Monitoring and Maintenance Scoping Document (Parsons, Anchor QEA
and Exponent, 2012a)
aOther than chemical analysis of adult sport fish and prey fish (i.e zooplankton mercury and fish community - fish populations)
P:\Honeywell -SYR\447479 - 2012 Remedial Goal Monitoring\09.0 Reports\9.2 Monitoring Summary - 2012\Tables\Table 1_Elements_Objectives_Data Uses_0913.xlsx
9/11/2013 parsons
HONEYWELL ONONDAGA LAKE TISSUE AND BIOLOGICAL
MONITORING REPORT FOR 2012
Adult Sport Fish
Prey (forage) Fish
SMUs 2 through 7 (same 8
locations as for adult sport
fish)
Collected and analyzed three composites of prey fish in August from each
of eight locations (24 composites), a total of 15 composites of alewife
collected in June, and one composite of gizzard shad also collected in
June (40 prey fish composites total).
SUMMARY OF TISSUE AND BIOLOGICAL MONITORING WORK COMPLETED DURING 2012
TABLE 2
PRIMARY ACTIVITY (May through October)WORK PLAN AND
MEDIALOCATIONS
Collected and analyzed for chemical parameters of interest a total of 75
adult sport fish during June (25 smallmouth bass, 25 walleye, and 25
brown bullhead).
Collected fish lakewide with trap nets, gill nets and seines to quantify fish
community composition.
Collected pumpkinseed, bluegill and largemouth bass lakewide to assess
fish populations.
SMUs 2 through 7
(8 locations)
Note: Fall turnover in Onondaga Lake during 2012 occurred on or about October 22.
South Deep Monthly to weekly sampling and analyses for total mercury and
methylmercury. Zooplankton
P:\Honeywell -SYR\447479 - 2012 Remedial Goal Monitoring\09.0 Reports\9.2 Monitoring Summary - 2012\Tables\Table 2_Work Completed_0913.xlsx
9/11/2013 PARSONS
HONEYWELL
Parameter Prep Species
Sample
Size
Number of
Detections
Arithmetic
Mean1
Min1
Max1
Standard
Deviation2
Standard
Error3
whole body prey fish5
40 40 0.217 0.027 0.610 0.161 0.026
fillet brown bullhead 25 25 0.330 0.190 0.480 0.097 0.019
fillet smallmouth bass 25 25 1.003 0.350 3.200 0.600 0.120
fillet walleye 25 25 1.902 0.740 3.200 0.659 0.132
whole body prey fish 10 10 0.229 0.026 0.660 0.253 0.080
fillet brown bullhead 12 11 0.164 0.013U 0.580 0.147 0.042
fillet smallmouth bass 12 12 0.536 0.097 1.700 0.481 0.139
fillet walleye 12 12 1.380 0.510 2.700 0.582 0.168
whole body prey fish 10 10 0.012 0.004 0.028 0.010 0.003
fillet brown bullhead 12 12 0.006 0.002 0.014 0.004 0.001
fillet smallmouth bass 12 12 0.032 0.005 0.101 0.029 0.008
fillet walleye 12 12 0.068 0.026 0.134 0.030 0.009
whole body prey fish 10 7 0.003 0.0003 0.011 0.004 0.001
fillet brown bullhead 12 11 0.002 0.001 0.005 0.001 0.0004
fillet smallmouth bass 12 12 0.004 0.001 0.010 0.003 0.001
fillet walleye 12 12 0.013 0.006 0.024 0.005 0.002
whole body prey fish 10 10 1.839 0.790 5.200 1.272 0.402
fillet brown bullhead 12 12 0.524 0.097 1.300 0.379 0.109
fillet smallmouth bass 12 12 1.555 0.200 3.700 0.972 0.281
fillet walleye 12 12 2.700 1.200 5.100 1.208 0.349
ONONDAGA LAKE TISSUE AND BIOLOGICAL
MONITORING REPORT FOR 2012
Table 3
Percent Lipid (% by
body weight)4
1 U means not detected. Minimum and maximum non-detects reported at the reporting limit.
2 Standard deviation is an estimate of the variability of the data points used to calculate the mean (e.g., approximately 68% of the data points will be within plus or minus one standard deviation of the sample
mean and 95% will be within two standard deviations).3 Standard error is an estimate of how close the calculated mean is likely to be to the true population mean (e.g., there is approximately a 68% chance that the actual population mean falls within plus or minus
one standard error of the sample mean and a 95% chance that it fall within two standard deviations).4 For individual non-detects, 1/2 the reporting limit was used in calculations.
5 The average, minimum, and maximum mercury concentrations for alewife (a prey fish subset) were 0.145, 0.072, and 0.21 mg/kg respectively. Alewife made up 15 of the 40 prey fish composite samples
collected and analyzed.
Summary of 2012 Fish Tissue Chemical Concentrations Measured in Onondaga Lake (wet weight basis)
Mercury (mg/kg)4
Total PCB (mg/kg)4
Sum of DDT and
metabolites (mg/kg)4
Hexachlorobenzene
(mg/kg)4
P:\Honeywell -SYR\447479 - 2012 Remedial Goal Monitoring\09.0 Reports\9.2 Monitoring Summary - 2012\Tables\Table_3_2012 fish tissue analytical result summary_0913.xlsx\Sheet1
9/5/2013 Parsons
HONEYWELL ONONDAGA LAKE TISSUE AND BIOLOGICAL
MONITORING REPORT FOR 2012
Location ID Field Sample ID Fish Type Date Sampled
TEQ (full dl)
(ng/kg)
TEQ (half dl)
(ng/kg)
TEQ (ND=0)
(ng/kg)
OL-STA-20158 OL-1800-03F BB 6/14/2012 4.22 3.21 2.20
OL-STA-20158 OL-1805-02F SMB 6/20/2012 7.86 6.40 4.94
OL-STA-20158 OL-1802-05F WALL 6/15/2012 5.70 4.66 3.62
OL-STA-20158 OL-1804-16F WALL 6/20/2012 8.23 5.02 1.82
OL-STA-30093 OL-1804-06F BB 6/20/2012 8.50 5.31 2.11
OL-STA-40212 OL-1801-06F WALL 6/14/2012 13.63 12.60 11.56
OL-STA-40212 OL-1801-07F WALL 6/14/2012 8.29 6.95 5.62
OL-STA-50057 OL-1803-18F SMB 6/19/2012 4.68 2.85 1.01
OL-STA-50057 OL-1807-01F SMB 6/26/2012 6.00 4.08 2.16
OL-STA-50058 OL-1802-01F BB 6/15/2012 3.05 2.24 1.43
OL-STA-50058 OL-1803-05F WALL 6/19/2012 4.39 3.59 2.78
OL-STA-50059 OL-1804-01F BB 6/20/2012 4.82 3.12 1.42
OL-STA-50059 OL-1802-04F SMB 6/15/2012 5.93 4.87 3.81
OL-STA-70124 OL-1800-12F BB 6/14/2012 4.35 2.94 1.54
OL-STA-70124 OL-1804-12F SMB 6/20/2012 5.44 4.10 2.77
Notes:
dl - detection limit
Fish Types:
BB - Brown Bullhead
SMB - Smallmouth Bass
WALL - Walleye
CALCULATED DIOXIN/FURAN HUMAN/MAMMALIAN TEQs IN 2012 FISH TISSUE SAMPLES
TABLE 4
TEQ - toxicity equivalent quotient calculated using human and mammalian toxic equivalency factors (TEFs) from Van
den Berg et al. (2006)
P:\Honeywell -SYR\447479 - 2012 Remedial Goal Monitoring\09.0 Reports\9.2 Monitoring Summary - 2012\Tables\Table 4_2012 Fish TEQs_0913.xlsx
4:38 PM Parsons
HONEYWELL ONONDAGA LAKE TISSUE AND BIOLOGICAL
MONITORING REPORT FOR 2012
Common Name Scientific Name Trap Net Gill Net
Electro-
shocker Seining
Alewife Alosa pseudoharengus x x
Banded killifish Fundulus diaphanus x x
Black bullhead Ameriurus melas x
Black crappie Pomoxis nigromaculatus x
Bluegill Lepomis macrochirus x x x
Bluntnose minnow Pimephales notatus x x
Bowfin Amia calva x x
Brook silverside Labidesthes sicculus x x
Brown bullhead Ameiurus nebulosus x x x
Channel catfish Ictalurus punctatus x x
Common carp Cyprinus carpio x x x
Common shiner Luxilus cornutus x
Creek chub Semotilus atromaculatus x x
Emerald shiner Notropis atherinoides x x
Fathead minnow Pimephales promelas x
Freshwater drum Aplodinotus grunniens x x
Gizzard shad Dorosoma cepedianum x x
Golden shiner Notemigonus crysoleucas x x
Goldfish Carassius auratus x
Green sunfish Lepomis cyanellus x x
Lake sturgeon Acipenser fulvescens x
Largemouth bass Micropterus salmoides x x x
Longnose gar Lepisosteus osseus x x
Northern pike Esox lucius x x x
Pumpkinseed Lepomis gibbosus x x x
Quillback carpsucker Carpiodes cyprinus x
Rockbass Ambloplites rupestris x x
Round goby Neogobius melanostomus x x
Rudd Scardinius erythrophthalmus x x
Shorthead redhorse Moxostoma macrolepidotum x x
Silver redhorse Moxostoma anisurum x
Smallmouth bass Micropterus dolomieu x x x x
Tadpole madtom Noturus gyrinus x
Tesselated darter Etheostoma olmstedi x x
Tiger muskellunge Esox lucius x Esox masquinongi x
Walleye Sander vitreus x x
White perch Morone americana x x
White sucker Catostomus commersoni x x
Yellow bullhead Ameiurus natalis x x
Yellow perch Perca flavescens x x
Totals 35 17 7 19
Summary of Species Collected By Gear Type For Onondaga Lake Fish Community Assessment:
May - October 2012
Table 5
P:\Honeywell -SYR\447479 - 2012 Remedial Goal Monitoring\09.0 Reports\9.2 Monitoring Summary - 2012\Tables\Tables_5-10_Fish_Community_2012.xlsx
9/4/2013 Parsons
HONEYWELL ONONDAGA LAKE TISSUE AND BIOLOGICAL
MONITORING REPORT FOR 2012
Common Name Scientific NameMetro
(70124)
Harbor
Brook
(70124)
Rte 690
(20158)
Wastebeds 1-8
(30093)
Ninemile
(40212)
Permanent
Habitat Module
(50057)
Maple Bay
(50057)
Willow Bay
(50057)
Marina
(50058)
Iron Bridge
(50059)
Grand TotalPercentage of
Community
Alewife Alosa pseudoharengus 98 19 1 15 24 24 7 23 23 234 6.9
Banded killifish Fundulus diaphanus 92 168 5 46 100 68 21 3 36 539 16.0
Black bullhead Ameriurus melas 1 1 2 0.1
Black crappie Pomoxis nigromaculatus 1 2 3 0.1
Bluegill Lepomis macrochirus 61 7 43 4 79 196 114 71 54 56 685 20.3
Bluntnose minnow Pimephales notatus 13 72 1 1 14 7 2 110 3.3
Bowfin Amia calva 8 5 2 5 3 10 5 6 3 1 48 1.4
Brook silverside Labidesthes sicculus 2 2 0.1
Brown bullhead Ameiurus nebulosus 20 4 41 13 26 50 11 55 4 12 236 7.0
Channel catfish Ictalurus punctatus 6 1 7 0.2
Common carp Cyprinus carpio 11 8 2 1 2 1 6 2 23 56 1.7
Common shiner Luxilus cornutus 1 1 0.0
Creek chub Semotilus atromaculatus 11 1 12 0.4
Emerald shiner Notropis atherinoides 9 7 1 1 10 1 29 0.9
Fathead minnow Pimephales promelas 5 2 7 0.2
Freshwater drum Aplodinotus grunniens 1 2 1 1 1 6 0.2
Gizzard shad Dorosoma cepedianum 95 12 1 43 4 11 6 13 9 194 5.8
Golden shiner Notemigonus crysoleucas 8 4 14 1 2 34 61 1 13 11 149 4.4
Goldfish Carassius auratus 1 1 0.0
Green sunfish Lepomis cyanellus 1 1 0.0
Largemouth bass Micropterus salmoides 15 32 2 19 10 86 14 5 15 19 217 6.4
Longnose gar Lepisosteus osseus 1 1 2 0.1
Northern pike Esox lucius 2 2 1 5 0.1
Pumpkinseed Lepomis gibbosus 20 17 27 5 28 160 50 62 39 28 436 12.9
Rockbass Ambloplites rupestris 1 1 14 3 6 4 1 30 0.9
Round goby Neogobius melanostomus 4 4 1 1 1 6 1 1 19 0.6
Rudd Scardinius erythrophthalmus 12 2 3 3 1 1 22 0.7
Shorthead redhorse Moxostoma macrolepidotum 1 1 1 3 6 0.2
Silver redhorse Moxostoma anisurum 1 1 0.0
Smallmouth bass Micropterus dolomieu 1 2 1 3 1 8 0.2
Tesselated darter Etheostoma olmstedi 1 1 1 3 0.1
White perch Morone americana 17 2 1 33 1 1 5 4 2 9 75 2.2
White sucker Catostomus commersoni 8 1 6 6 12 5 2 2 7 49 1.5
Yellow bullhead Ameiurus natalis 2 10 12 0.4
Yellow perch Perca flavescens 4 1 5 7 26 24 36 26 5 32 166 4.9
Grand Total 504 382 153 218 299 696 372 292 225 232 3373 100.0
Number of Species 24 22 15 22 16 23 19 20 19 18 35
Station Description (Station Identifier OL-STA)
Summary of Number of Individuals Per Species Captured in Trap Nets May-October 2012
Table 6
P:\Honeywell -SYR\447479 - 2012 Remedial Goal Monitoring\09.0 Reports\9.2 Monitoring Summary - 2012\Tables\Tables_5-10_Fish_Community_2012.xlsx\T6_Trapnet
9/4/2013 Parsons
HONEYWELL ONONDAGA LAKE TISSUE AND BIOLOGICAL
MONITORING REPORT FOR 2012
Shallow Deep
5/2/2012 10:12 PM 11:12 PM 3.5 7.5
6/14/2012 9:10 PM 10:10 PM 3.7 7.8
7/25/2012 9:20 PM 10:25 PM 3.7 9.2
9/20/2012 8:50 PM 9:50 PM 4 8.7
10/17/2012 7:40 PM 8:40 PM 2 8
5/2/2012 10:33 PM 11:33 PM 4.4 9.2
6/14/2012 10:30 PM 11:30 PM 3.6 9.2
7/25/2012 10:20 PM 11:25 PM 4.0 8.3
5/1/2012 8:57 PM 9:57 PM 3.7 8.8
6/13/2012 12:00 AM 1:10 AM 4.2 8.2
7/25/2012 9:00 PM 10:00 PM 3.7 8.8
9/20/2012 7:15 PM 8:15 PM 3.3 8.1
10/17/2012 9:00 PM 10:00 PM 5.2 8.2
5/1/2012 10:15 PM 11:15 PM 3.0 11.6
6/13/2012 10:20 PM 11:12 PM 4.5 9.0
7/24/2012 9:45 PM 10:45 PM 3.4 9.6
8/21/2012 9:15 PM 10:15 PM 5.6 8.7
9/19/2012 11:00 PM 11:50 PM 4.3 9.2
10/18/2012 9:10 PM 10:10 PM 5.1 8.7
5/1/2012 8:40 PM 9:40 PM 3.9 6.6
6/13/2012 9:30 PM 10:30 PM 3.1 6.4
7/24/2012 9:00 PM 10:00 PM 2.4 6.9
8/21/2012 9:40 PM 10:40 PM 3.1 7.7
9/19/2012 8:40 PM 10:05 PM 3.4 9.1
10/18/2012 6:45 PM 7:45 PM 3.9 6.3
5/1/2012 9:35 PM 10:35 PM 0.0 9.7
6/13/2012 11:00 PM 12:00 AM 3.8 8.6
7/24/2012 8:35 PM 9:35 PM 1.6 8.7
8/21/2012 10:25 PM 11:25 PM 3.4 8.6
9/19/2012 10:00 PM 11:00 PM 3.2 12.0
10/18/2012 7:15 PM 8:45 PM 2.2 8.8
5/1/2012 8:20 PM 9:20 PM 0.0 3.4
6/13/2012 9:00 PM 10:00 PM 4.2 6.8
7/24/2012 10:20 PM 11:20 PM 2.5 5.4
8/21/2012 8:22 PM 9:22 PM 3.2 10.1
9/19/2012 8:20 PM 9:20 PM 3.9 8.9
10/18/2012 8:35 PM 9:35 PM 4.1 10.6
5/14/2012 8:40 PM 9:40 PM 3.0 8.5
6/14/2012 11:45 PM 12:40 AM 3.9 9.6
7/24/2012 10:55 PM 11:55 PM 4.0 10.6
8/21/2012 8:10 PM 9:10 PM 3.3 10.9
9/19/2012 11:30 PM 12:20 AM 3.4 10.0
10/17/2012 6:30 PM 7:30 PM 5.3 11.8
5/14/2012 8:15 PM 9:15 PM 2.2 7.9
6/14/2012 9:35 PM 10:35 PM 3.8 9.4
7/25/2012 11:40 PM 12:30 AM 3.8 9.7
9/20/2012 7:45 PM 8:55 PM 3.3 8.9
10/17/2012 6:50 PM 7:50 PM 4 9.9
5/2/2012 9:15 PM 10:25 PM 3.5 4.1
6/14/2012 11:00 PM 12:15 AM 4.4 5.2
7/25/2012 11:15 PM 12:10 AM 4.3 5.2
10/17/2012 8:10 PM 9:10 PM 5.1 6.2
52
Table 7. 2012 Gill Net Sampling Locations in Onondaga Lake
Location Name Sampling Date Set Time End Time
Water Depth (m) Number Times
Sampled
Harbor Brook
(OL-STA-70124)
Hiawatha Pt.
(OL-STA-50057)
Iron Bridge
(OL-STA-50059)
Marina
(OL-STA-50058)
Ninemile
(OL-STA-40212)
Outlet
(OL-STA-50057)
Parsons
(OL-STA-20158)
Permanent Habitat
Module
(OL-STA-50057)
Wastebeds 1-8
(OL-STA-30093)
5
6
Route 690 Point (OL-
STA-20158)
6
3
6
5
Total Number of Gill Net Sets
4
6
5
6
P:\Honeywell -SYR\447479 - 2012 Remedial Goal Monitoring\09.0 Reports\9.2 Monitoring Summary - 2012\Tables\Tables_5-10_Fish_Community_2012.xlsx\T7_gillnet location
9/4/2013 Parsons
Honeywell ONONDAGA LAKE TISSUE AND BIOLOGICAL
MONITORING REPORT FOR 2012
Common Name Scientific Name
Harbor
Brook
(70124)
Route
690 Point
(20158)
Parsons
(20158)
Wastebeds
1-8 (30093)
Ninemile
(40212)
Hiawatha
Point
(50057)
Outlet
(50057)
Iron
Bridge
(50059)
Marina
(50058)
Permanent
Habitat
Module
(50057)
Total
Fish
Captured
Alewife Alosa pseudoharengus 1 1
Bowfin Amia calva 1 1
Brown bullhead Ameiurus nebulosus 1 1 2
Common carp Cyprinus carpio 2 6 7 5 12 7 4 9 52
Channel catfish Ictalurus punctatus 9 6 1 6 4 3 9 7 1 5 51
Freshwater drum Aplodinotus grunniens 9 4 2 3 5 3 1 1 28
Gizzard shad Dorosoma cepedianum 9 10 7 6 3 12 11 1 59
Lake sturgeon Acipenser fulvescens 3 1 1 1 1 7
Longnose gar Lepisosteus osseus 1 1
Northern pike Esox lucius 2 2 1 5
Quillback carpsucker Carpiodes cyprinus 1 1
Rudd Scardinius erythrophthalmus 1 1
Shorthead redhorse Moxostoma macrolepidotum 1 1 2 2 1 4 11
Smallmouth bass Micropterus dolomieu 1 1 1 3
Walleye Sander vitreus 2 12 5 11 11 8 14 22 7 23 115
White perch Morone americana 1 1 2
White sucker Catostomus commersoni 2 2 2 1 1 1 9
Total Count 23 44 14 37 30 26 59 56 14 46 349
Number of Species 5 8 6 9 6 8 10 10 5 9 17
Summary of Number of Individuals Per Species Captured in Gill Nets May-October 2012
Station Description (Station Identifer: OL-STA)
Table 8
P:\Honeywell -SYR\447479 - 2012 Remedial Goal Monitoring\09.0 Reports\9.2 Monitoring Summary - 2012\Tables\Tables_5-10_Fish_Community_2012.xlsx\T8_gillnet
9/4/2013 Parsons
Honeywell ONONDAGA LAKE TISSUE AND BIOLOGICAL
MONITORING REPORT FOR 2012
Location
Sampling
Date Coordinates
Total
Length
(mm)
Weight
(kg) Carlin Tag Pit Tag Notes Recapture?
Nine Mile 5/8/2012 430530 N 4761349 W 1200 20.3 16 20480422 Yes
Wastebeds 6/18/2012 430521 N 4761320 W 1193 8 21 20445186 No
Hiawatha Pt. 6/19/2012 430310 N 4761259 W 1193 8 21 20445186 Yes
Outlet 6/19/2012 430651 N 4761425 W 1320 17.5 22 20445186 PIT tag incorrect1
No
PHM 6/19/2012 398818 N 4773657 W 1651 23 20557924 No
Marina 6/21/2012 430515 N 4761232 W 1613 24.2 24 20553939 No
Marina 6/21/2012 430515 N 4761232 W 1397 18.7 15 20481711 Yes
Nine Mile 7/17/2012 430530 N 4761349 W 1042 11.75 25 No
Wastebeds 7/17/2012 430521 N 4761320 W 1735 Maxed out scale > 20 kg; dead2
No
Marina 7/18/2012 430515 N 4761232 W 1143 9.6 1163 24743576 USGS tag?; Dead2
Yes
Hiawatha Pt. 9/25/2012 430310 N 4761259 W 1346 18 17 Yes
Outlet 9/25/2012 430651 N 4761425 W 1499 28 20555579 Did not weigh No
Marina 9/26/2012 430515 N 4761232 W 1447 20 29 20507833 No
Parsons 9/26/2012 402655 N 4769197 W 1270 13.8 30 20443969 No
Nine Mile 10/25/2012 430530 N 4761349 W 1422 31 20428869 Did not weigh No
Hiawatha Pt. 10/25/2012 430310 N 4761259 W 1372 32 20428869 PIT tag incorrect1
No
Marina 10/26/2012 430515 N 4761232 W 1572 33 20561383 Maxed out scale > 20 kg No
Marina 10/26/2012 430515 N 4761232 W 1316 34 20474896 Did not weigh No
Iron Bridge 10/26/2012 430524 N 4761139 W 1558 35 20473045 Did not weigh No
Iron Bridge 10/26/2012 430524 N 4761139 W 1318 36 20437524 Did not weigh No
Iron Bridge 10/26/2012 430524 N 4761139 W 1470 37 20481769 Did not weigh No
Wastebeds 10/26/2012 430521 N 4761320 W 1372 38 20505157 Did not weigh No
Regular Gill Net Catches (Most of these fish were measured and released
PHM 6/13/2012 398818 N 4773657 W 1500 No tag 20511371
690 Pt. 6/14/2012 430451 N 4761234 W Did not get on boat to measure
Marina 7/24/2012 430515 N 4761232 W 1378
690 Pt. 7/25/2012 430451 N 4761234 W 1320 19.5 26 20439521
690 Pt. 7/25/2012 430451 N 4761234 W 1370 19.5 27 20470577
Parsons 7/25/2012 402655 N 4769197 W Did not get on boat to measure
Hiawatha Pt. 9/19/2012 430310 N 4761259 W 1420 27 Also listed at USGS 1190 Yes1 Pit tag numbers indicate duplicates, caused by tag reader error.
2 Both sturgeon that were dead in gillnet were sent to USGS in Cortland for further analysis.
Lake Sturgeon Catch and Tag Information - 2012
Table 9
P:\Honeywell -SYR\447479 - 2012 Remedial Goal Monitoring\09.0 Reports\9.2 Monitoring Summary - 2012\Tables\Tables_5-10_Fish_Community_2012.xlsx\T9_sturgeon
9/4/2013 Parsons
Honeywell ONONDAGA LAKE TISSUE AND BIOLOGICAL
MONITORING REPORT FOR 2012
Common Name Scientific Name
Metro
(70124)
Rte 690
(20158)
Wastebeds
1-8
(30093)
Ninemile
(40212)
Permanent
Habitat
Module
(50057)
Maple
Bay
(50057)
Willow
Bay
(50057)
Marina
(50058)
Iron
Bridge
(50059)
Total
Fish
Captured
Percentag
e of the
Communit
y
Banded killifish Fundulus diaphanus 9 272 469 58 43 149 398 88 1486 55.3
Bluegill Lepomis macrochirus 7 38 17 4 10 76 2.8
Bluntnose minnow Pimephales notatus 1 1 2 0.1
Brown bullhead Ictalurus nebulosus 5 4 1 10 0.4
Brook silverside Labidesthes sicculus 2 2 15 19 0.7
Common carp Cyprinus carpio 1 1 0.0
Creek chub Semotilus atromaculatus 1 1 0.0
Emerald shiner Notropis atherinoides 1 1 0.0
Golden shiner Notemigonus
crysoleucas3 3 0.1
Green sunfish Lepomis cyanellus 3 3 0.1
Lepomis YOY Lepomis spp. 28 3 31 1.2
Largemouth bass Micropterus salmoides 32 6 81 173 87 101 47 74 601 22.4
Pumpkinseed Lepomis gibbosus 20 5 53 29 40 4 76 227 8.5
Rockbass Ambloplites rupestris 1 5 6 1 4 17 0.6
Round goby Neogobius melanostomus 9 19 18 2 96 4 5 153 5.7
Smallmouth bass Micropterus dolomieu 6 2 1 1 1 11 0.4
Tadpole madtom Noturus gyrinus 1 1 0.0
Tessellated darter Etheostoma olmstedi 1 2 1 5 1 10 0.4
Yellow bullhead Ameiurus natalis 1 1 0.0
Yellow perch Perca flavescens 8 3 3 3 14 31 1.2
Total fish Captured 87 305 578 372 293 311 453 286 2685 100.0
Number of Species 8 5 7 14 12 11 7 8 20
Not
sampled
due to
dredging/ca
pping
activity
Summary of Number of Individuals per Species Captured by Seining - August 2012
Table 10
P:\Honeywell -SYR\447479 - 2012 Remedial Goal Monitoring\09.0 Reports\9.2 Monitoring Summary - 2012\Tables\Tables_5-10_Fish_Community_2012.xlsx\T10_seine
9/4/2013 Parsons
ONONDAGA LAKE TISSUE AND BIOLOGICAL
MONITORING REPORT FOR 2012
Parsons
P:\Honeywell -SYR\447479 - 2012 Remedial Goal Monitoring\09.0 Reports\9.2 Monitoring Summary - 2012\Tables\Table 11 - Zooplankton Hg_0913.docx
9/4/2013
TABLE 11
MERCURY CONCENTRATIONS IN ZOOPLANKTON SAMPLES
COLLECTED AT SOUTH DEEP IN 2012
Field Sample ID Date
Total mercury
(mg/kg wet
weight)
Methylmercury
(mg/kg wet weight)
Methylmercury
(Percent of Total
Mercury)
OL-1706-01 6/11/12 0.045 0.0047 10
OL-1717-01 7/2/12 0.038 0.0041 11
OL-1721-01 7/9/12 0.065 0.0066 10
OL-1728-01 7/23/12 0.17 0.012 7.1
OL-1735-01 8/6/12 0.066 0.014 21
OL-1743-01 8/20/12 0.13 0.011 8.5
OL-1751-01 9/4/12 0.27 0.0083 3.1
OL-1755-01 9/12/12 0.0011U 0.0023 NA
OL-1759-01 9/17/12 0.15 0.0078 5.2
OL-1763-01 9/24/12 0.087 0.0099 11
OL-1767-01 10/2/12 0.11 0.0063 5.7
OL-1771-01 10/9/12 0.049J 0.0064 13
OL-1775-01 10/16/12 0.033J 0.009 27
OL-1779-01 10/22/12 0.033J 0.010 30
OL-1784-01 11/5/12 0.046J 0.0093 20
OL-1788-01 11/19/12 0.011J 0.0043 39
NA – not applicable; result for total mercury is less than the result for methylmercury.

ONONDAGA LAKE TISSUE AND BIOLOGICAL
MONITORING REPORT FOR 2012
PARSONS
P:\Honeywell -SYR\447479 - 2012 Remedial Goal Monitoring\09.0 Reports\9.2 Monitoring Summary - 2012\2012 Tissue Monitoring Report_FINAL.docx August 29, 2013
FIGURES
\\Heli
os\d_
drive
\Proje
cts\H
oney
well\O
nond
aga_
Lake
_Rem
ediat
ion(09
0139
-01)\B
aselin
e_M
onito
ring\G
IS\M
aps\P
ARba
s_sam
pleloc
s_fis
h_20
12_J
ER.m
xd 2
/22/13
XW
XW XW
XW
XW
XW
XW
XW
Nine Mile Creek
Bloody Brook
LeyCreek
Onondaga Creek
Tributary5A
Outlet
Maple Bay
Willow Bay
Metro Outfall
Wastebeds1-8
Marina
Iron Bridge
PHM
690 Pt
Rt. 690/Parsons
SawmillCreek
Hiawatha Pt
HarborBrook
OL-STA-50059
OL-STA-30093
OL-STA-50057
OL-STA-20158
OL-STA-70124
OL-STA-50058
OL-STA-40212
OL-STA-60225
20158
60225
70124
500593009340212
50057
50058
8
5
6
1
4
7
3
2
0 2,500 5,000Feet
Note: PHM = Permanent Habitat Module
LegendAdult Sport Fish Locations
XW Prey Fish LocationsTransportation
RoadHighway/InterstateRailroadSMU BoundariesTributaries
Figure 1Fish Sampling Locations for 2012
Tissue Chemical Analyses[
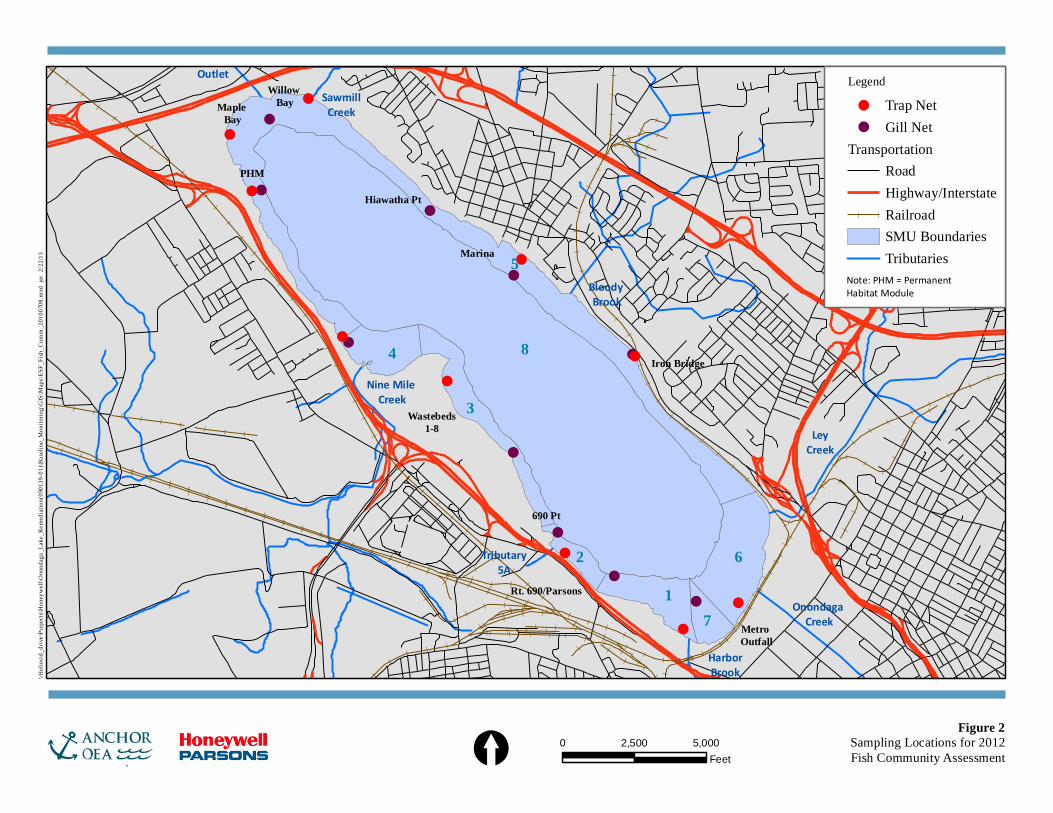
Figure 2Sampling Locations for 2012Fish Community Assessment
\\Heli
os\d_
drive
\Proje
cts\H
oney
well\O
nond
aga_
Lake
_Rem
ediat
ion(09
0139
-01)\B
aselin
e_Mo
nitori
ng\G
IS\Ma
ps\ES
F_Fis
h_Co
mm_2
0100
708.m
xd je
r 2/22
/13
!
!
!
!
!
!
!
!
!
!
!
!
!
!
!
!
!
!
!
!Nine Mile Creek
Bloody Brook
LeyCreek
Onondaga Creek
Tributary5A
OutletSawmill
Creek
HarborBrook
Maple Bay
Willow Bay
Metro Outfall
Wastebeds1-8
Marina
Iron Bridge
PHM
Rt. 690/Parsons
Hiawatha Pt
690 Pt
8
5
6
3
1
4
7
2
0 2,500 5,000Feet
Note: PHM = Permanent Habitat Module
Legend! Trap Net! Gill Net
TransportationRoadHighway/InterstateRailroadSMU BoundariesTributaries
[
Brown bullhead
0 2 4 6 8Age (years)
0.0
0.2
0.4
0.6
0.8M
ercu
ry(m
g/kg
wet
-wei
ght)
Smallmouth bass
0 5 10 15Age (years)
0
1
2
3
4
Mer
cury
(mg/
kg w
et-w
eigh
t)
Walleye
0 5 10 15 20 25Age (years)
0
1
2
3
4
5
Mer
cury
(mg/
kg w
et-w
eigh
t)
Figure 3Mercury vs. Age in Onondaga Lake Fish Sampled in 2012.
ELP - C:\Users\epizzichemi\Desktop\Onondaga Lake\IDL\Analyte_by_Location_20130215_noPKSD.proMon Feb 18 11:59:19 2013
Parsons
P:\Honeywell -SYR\447479 - 2012 Remedial Goal Monitoring\09.0 Reports\9.2 Monitoring Summary - 2012\Figures\Figures 4A_4B_2012 Zooplankton Hg.docx
Figure 4A. Total Mercury (Hg) and Methylmercury (MeHg) Concentrations in Zooplankton at
South Deep in 2012
Figure 4B Percent Contribution of Methylmercury (MeHg) to Total mercury (Hg) in Zooplankton
at South Deep in 2012
Note: The total mercury and methylmercury results for 12-September (0.0011U and 0.0023 mg/kg, respectively)
have been double-checked by the laboratory and are not included in Figures 4A and 4B.
ONONDAGA LAKE TISSUE AND BIOLOGICAL
MONITORING REPORT FOR 2012
PARSONS
P:\Honeywell -SYR\447479 - 2012 Remedial Goal Monitoring\09.0 Reports\9.2 Monitoring Summary - 2012\2012 Tissue Monitoring Report_FINAL.docx August 29, 2013
APPENDIX A
DATA USABILITY AND SUMMARY REPORT: ONONDAGA LAKE 2012
TISSUE MONITORING: FISH AND ZOOPLANKTON
PARSONS
APPENDIX A:
DATA USABILITY SUMMARY REPORT
ONONDAGA LAKE 2012 TISSUE MONITORING
Prepared For:
Prepared By:
Parsons
301 Plainfield Road, Suite 350
Syracuse, New York 13212
Phone: (315) 451-9560
Fax: (315) 451-9570
AUGUST 2013
ONONDAGA LAKE 2012 TISSUE MONITORING
DATA USABILITY SUMMARY REPORT
PARSONS
P:\Honeywell -SYR\447479 - 2012 Remedial Goal Monitoring\09.0 Reports\9.2 Monitoring Summary - 2012\Appendix A - DUSR\OL 2012 Tissue Monitoring DUSR_Final.DOCX
A-i
TABLE OF CONTENTS Page
SECTION A1 DATA USABILITY SUMMARY .................................................... A1-1
A1.1 LABORATORY DATA PACKAGES ........................................................ A1-1
A1.2 SAMPLING AND CHAIN-OF-CUSTODY ............................................... A1-1
A1.3 LABORATORY ANALYTICAL METHODS ........................................... A1-1
A1.3.1 Mercury, Low Level Mercury, and Methyl Mercury Analysis ......... A1-2
A1.3.2 PCB Analysis ..................................................................................... A1-2
A1.3.3 Hexachlorobenzene, 4,4’-DDT, and Metabolites Analysis ............... A1-2
A1.3.4 Dioxins and Furans ............................................................................ A1-3
A1.3.5 Percent Lipids .................................................................................... A1-3
SECTION A2 DATA VALIDATION REPORT ..................................................... A2-1
A2.1 FISH ............................................................................................................. A2-1
A2.1.1 Mercury ............................................................................................. A2-1
A2.1.2 PCBs .................................................................................................. A2-2
A2.1.3 Hexachlorobenzene, 4,4’-DDT, and Metabolites .............................. A2-3
A2.1.4 Dioxins and Furans ............................................................................ A2-5
A2.1.5 Percent Lipids .................................................................................... A2-6
A2.2 ZOOPLANKTON SAMPLES ..................................................................... A2-7
A2.2.1 Low Level Mercury ........................................................................... A2-7
A2.2.2 Methyl Mercury ................................................................................. A2-8
LIST OF ATTACHMENTS
ATTACHMENT A VALIDATED LABORATORY DATA
ATTACHMENT A-1 VALIDATED LABORATORY DATA FOR FISH SAMPLES
ATTACHMENT A-2 VALIDATED LABORATORY DATA FOR ZOOPLANKTON
SAMPLES
ONONDAGA LAKE 2012 TISSUE MONITORING
DATA USABILITY SUMMARY REPORT
PARSONS
P:\Honeywell -SYR\447479 - 2012 Remedial Goal Monitoring\09.0 Reports\9.2 Monitoring Summary - 2012\Appendix A - DUSR\OL 2012 Tissue Monitoring DUSR_Final.DOCX
A1-1
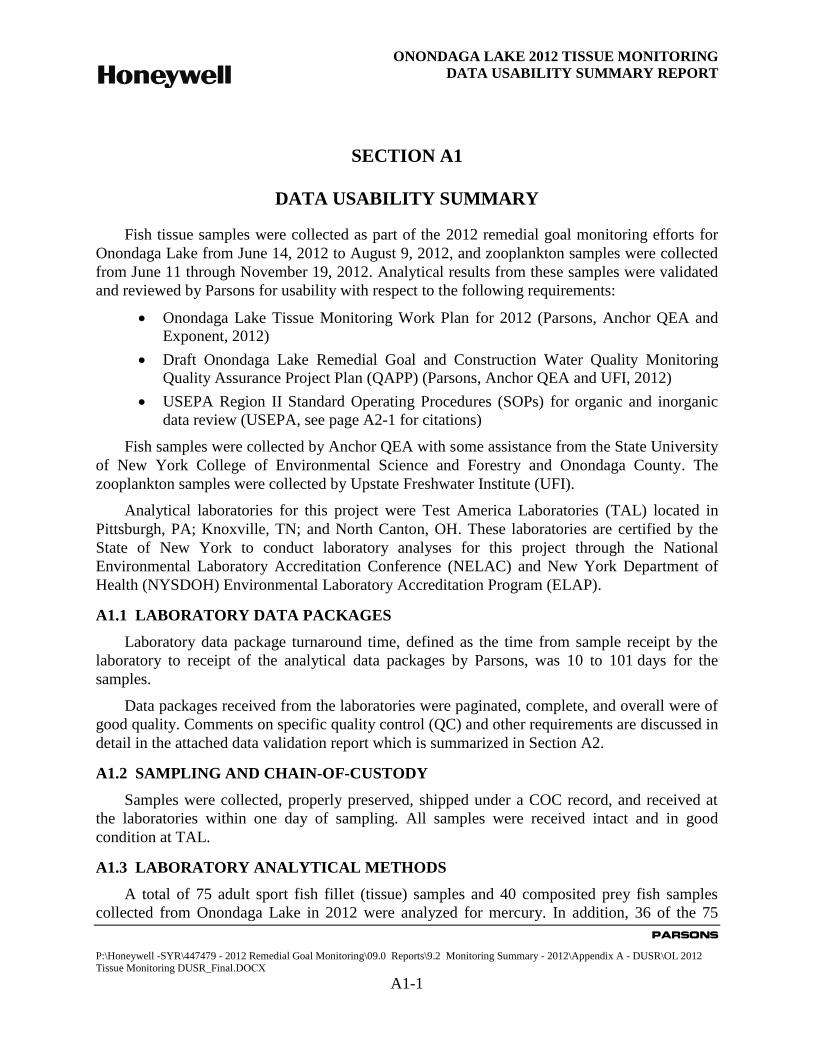
SECTION A1
DATA USABILITY SUMMARY
Fish tissue samples were collected as part of the 2012 remedial goal monitoring efforts for
Onondaga Lake from June 14, 2012 to August 9, 2012, and zooplankton samples were collected
from June 11 through November 19, 2012. Analytical results from these samples were validated
and reviewed by Parsons for usability with respect to the following requirements:
Onondaga Lake Tissue Monitoring Work Plan for 2012 (Parsons, Anchor QEA and
Exponent, 2012)
Draft Onondaga Lake Remedial Goal and Construction Water Quality Monitoring
Quality Assurance Project Plan (QAPP) (Parsons, Anchor QEA and UFI, 2012)
USEPA Region II Standard Operating Procedures (SOPs) for organic and inorganic
data review (USEPA, see page A2-1 for citations)
Fish samples were collected by Anchor QEA with some assistance from the State University
of New York College of Environmental Science and Forestry and Onondaga County. The
zooplankton samples were collected by Upstate Freshwater Institute (UFI).
Analytical laboratories for this project were Test America Laboratories (TAL) located in
Pittsburgh, PA; Knoxville, TN; and North Canton, OH. These laboratories are certified by the
State of New York to conduct laboratory analyses for this project through the National
Environmental Laboratory Accreditation Conference (NELAC) and New York Department of
Health (NYSDOH) Environmental Laboratory Accreditation Program (ELAP).
A1.1 LABORATORY DATA PACKAGES
Laboratory data package turnaround time, defined as the time from sample receipt by the
laboratory to receipt of the analytical data packages by Parsons, was 10 to 101 days for the
samples.
Data packages received from the laboratories were paginated, complete, and overall were of
good quality. Comments on specific quality control (QC) and other requirements are discussed in
detail in the attached data validation report which is summarized in Section A2.
A1.2 SAMPLING AND CHAIN-OF-CUSTODY
Samples were collected, properly preserved, shipped under a COC record, and received at
the laboratories within one day of sampling. All samples were received intact and in good
condition at TAL.
A1.3 LABORATORY ANALYTICAL METHODS
A total of 75 adult sport fish fillet (tissue) samples and 40 composited prey fish samples
collected from Onondaga Lake in 2012 were analyzed for mercury. In addition, 36 of the 75
ONONDAGA LAKE 2012 TISSUE MONITORING
DATA USABILITY SUMMARY REPORT
PARSONS
P:\Honeywell -SYR\447479 - 2012 Remedial Goal Monitoring\09.0 Reports\9.2 Monitoring Summary - 2012\Appendix A - DUSR\OL 2012 Tissue Monitoring DUSR_Final.DOCX
A1-2
adult fish tissue samples and 10 of the prey fish samples collected from Onondaga Lake in 2012
were analyzed for hexachlorobenzene, 4,4’-DDT and metabolites, polychlorinated biphenyls
(PCBs), and percent lipids. Dioxins and furans were analyzed in 15 of the 75 adult sport fish
fillet samples. A total of 16 zooplankton samples were collected from Onondaga Lake in 2012
and analyzed for low level mercury and methyl mercury. Summaries of deviations from the
Work Plan, QAPP, or USEPA Region II SOPs concerning these laboratory analyses are
presented in Subsections A1.3.1 through A1.3.5. The data qualifications resulting from the data
validation review and statements on the laboratory analytical precision, accuracy,
representativeness, completeness, and comparability (PARCC) are discussed for each analytical
method by matrix in Section A2. The laboratory data were reviewed and may be qualified with
the following validation flags:
"U" - not detected at the value given
"UJ" - estimated and not detected at the value given
"J" - estimated at the value given
"N" - presumptive evidence at the value given
"R" - unusable value
The validated laboratory data were tabulated and are presented in Attachment A.
A1.3.1 Mercury, Low Level Mercury, and Methyl Mercury Analysis
Fish samples collected from Onondaga Lake in 2012 were analyzed by TAL’s Pittsburgh,
PA laboratory for mercury using the USEPA SW846 7471A analytical method. Zooplankton
samples collected from Onondaga Lake in 2012 were analyzed by TAL’s North Canton, OH
laboratory for low level mercury using the USEPA 1631E analytical method; and methyl
mercury using the USEPA 1630 analytical method. Certain reported results for the mercury and
low level mercury samples were considered estimated based upon matrix spike/matrix spike
duplicate (MS/MSD) recoveries and laboratory control sample (LCS) recoveries. The reported
mercury, low level mercury, and methyl mercury analytical results were considered 100%
complete (i.e., usable) for the data presented by TAL. PARCC requirements were met.
A1.3.2 PCB Analysis
Fish samples collected from Onondaga Lake in 2012 were analyzed by TAL’s Pittsburgh,
PA laboratory for PCB aroclors using the USEPA SW846 8082 analytical method. The reported
results for these samples did not require qualification resulting from data validation. The reported
PCB analytical results were considered 100% complete with all data considered usable and valid
as reported by TAL. PARCC requirements were met.
A1.3.3 Hexachlorobenzene, 4,4’-DDT, and Metabolites Analysis
Fish samples collected from Onondaga Lake in 2012 were analyzed by TAL’s Pittsburgh,
PA laboratory for hexachlorobenzene, 4,4’-DDT, and metabolites using the USEPA SW846
8081A analytical method. Certain reported results for these samples were qualified as estimated
ONONDAGA LAKE 2012 TISSUE MONITORING
DATA USABILITY SUMMARY REPORT
PARSONS
P:\Honeywell -SYR\447479 - 2012 Remedial Goal Monitoring\09.0 Reports\9.2 Monitoring Summary - 2012\Appendix A - DUSR\OL 2012 Tissue Monitoring DUSR_Final.DOCX
A1-3
based upon sample surrogate recoveries, MS/MSD recoveries, and sample result identifications.
The reported analytical results for these samples were considered 100% complete with all data
considered usable and valid as reported by TAL. PARCC requirements were met.
A1.3.4 Dioxins and Furans
Fish samples collected from Onondaga Lake in 2012 were analyzed by TAL’s Knoxville,
TN laboratory for dioxins and furans using the USEPA SW846 8290 analytical method. Certain
reported results for these samples were qualified as estimated based upon laboratory control
sample recoveries. The reported analytical results for these samples were considered 100%
complete with all data considered usable and valid as reported by TAL. PARCC requirements
were met.
A1.3.5 Percent Lipids
Fish samples collected from the site were analyzed by TAL’s Pittsburgh, PA laboratory for
percent lipids using the TAL SOP analytical method. The reported results for these samples did
not require qualification resulting from data validation. The reported analytical results for these
samples were considered 100% complete with all data considered usable and valid as reported by
TAL. PARCC requirements were met.
ONONDAGA LAKE 2012 TISSUE MONITORING
DATA USABILITY SUMMARY REPORT
PARSONS
P:\Honeywell -SYR\447479 - 2012 Remedial Goal Monitoring\09.0 Reports\9.2 Monitoring Summary - 2012\Appendix A - DUSR\OL 2012 Tissue Monitoring DUSR_Final.DOCX
A2-1
SECTION A2
DATA VALIDATION REPORT
A2.1 FISH
Data review has been completed for data packages generated by TAL containing fish
samples collected from the site. The specific samples contained in these data packages, the
analyses performed, and validated laboratory data are tabulated and presented in
Attachment A-1. All of these samples were properly preserved, shipped under a COC record, and
received intact by the analytical laboratory.
Data validation was performed for all samples in accordance with the project work plan and
QAPP as well as the USEPA Region II SOPs HW-44, Revision 1 “Data Validation SOP of
Organochlorine Pesticides by Gas Chromatography SW-846 Method 8081B”; HW-45,
Revision 1 “Data Validation SOP of Organic Analysis of PCBs by Gas Chromatography
SW-846 Method 8082A; HW-2, Revision 13 “Evaluation of Metals Data for the CLP Program”;
and HW-19, Revision 1 “USEPA Region II Data Validation SOP for SW-846 Method 8290
Polychlorinated Dibenzodioxins (PCDDs) and Polychlorinated Dibenzofurans (PCDFs) By
High-Resolution Gas Chromatography/High-Resolution Mass Spectrometry (HRGC/HRMS)”.
This data validation and usability report is presented by analysis type.
A2.1.1 Mercury
The following items were reviewed for compliancy in the mercury analysis:
Custody documentation
Holding times
Initial and continuing calibration verifications
Initial and continuing calibration, and laboratory preparation blank contamination
Matrix spike/matrix spike duplicate (MS/MSD) recoveries
Laboratory duplicate precision
Laboratory control sample (LCS) recoveries
Interference check sample recoveries
Sample result verification and identification
Quantitation limits
Data completeness
These items were considered compliant and acceptable in accordance with the validation
protocols with the exception of MS/MSD recoveries as discussed below.
ONONDAGA LAKE 2012 TISSUE MONITORING
DATA USABILITY SUMMARY REPORT
PARSONS
P:\Honeywell -SYR\447479 - 2012 Remedial Goal Monitoring\09.0 Reports\9.2 Monitoring Summary - 2012\Appendix A - DUSR\OL 2012 Tissue Monitoring DUSR_Final.DOCX
A2-2
MS/MSD Recoveries
All MS/MSD recoveries were considered acceptable and within the 75-125%R QC limit for
designated spiked project samples with the exception of the low MSD mercury recovery (58%R)
associated with fish samples collected on 6/14/12; and the high MSD mercury recovery (130%R)
associated with fish samples collected on 6/21/12. Therefore, mercury results for those samples
where the MSD recovery fell below the QC limit were considered estimated, possibly biased
low, with positive results qualified “J” and nondetected results qualified “UJ” for the affected
samples. The positive mercury results for those samples where the MSD recovery exceeded the
QC limit were considered estimated, possibly biased high, and qualified “J” for the affected
samples.
Usability
All mercury sample results for the fish samples were considered usable following data
validation.
Summary
The quality assurance objectives for measurement data included considerations for
precision, accuracy, representativeness, completeness, and comparability. The mercury data
presented by TAL were 100% complete (i.e., usable). The validated mercury laboratory data are
tabulated and presented in Attachment A-1.
A2.1.2 PCBs
The following items were reviewed for compliancy in the PCB analysis:
Custody documentation
Holding times
Surrogate recoveries
Matrix spike/matrix spike duplicate (MS/MSD) precision and accuracy
Laboratory control sample (LCS) recoveries
Laboratory method blank contamination
Initial calibrations
Verification calibrations
Chromatogram quality
Sample result verification and identification
Quantitation limits
Data completeness
ONONDAGA LAKE 2012 TISSUE MONITORING
DATA USABILITY SUMMARY REPORT
PARSONS
P:\Honeywell -SYR\447479 - 2012 Remedial Goal Monitoring\09.0 Reports\9.2 Monitoring Summary - 2012\Appendix A - DUSR\OL 2012 Tissue Monitoring DUSR_Final.DOCX
A2-3
These items were considered compliant and acceptable in accordance with the validation
protocols.
Usability
All PCB sample results for the fish samples were considered usable following data
validation.
Summary
The quality assurance objectives for measurement data included considerations for
precision, accuracy, representativeness, completeness, and comparability. The PCB data
presented by TAL were 100% complete with all data considered usable and valid. The validated
data are tabulated and presented in Attachment A-1.
A2.1.3 Hexachlorobenzene, 4,4’-DDT, and Metabolites
The following items were reviewed for compliancy in the hexachlorobenzene, 4,4’-DDT,
and metabolites analysis:
Custody documentation
Holding times
Surrogate recoveries
Matrix spike/matrix spike duplicate (MS/MSD) precision and accuracy
Laboratory control sample (LCS) recoveries
Laboratory method blank contamination
Initial calibrations
Verification calibrations
4,4’-DDT breakdown
Chromatogram quality
Sample result verification and identification
Quantitation limits
Data completeness
These items were considered compliant and acceptable in accordance with the validation
protocols with the exceptions of surrogate recoveries, MS/MSD precision and accuracy, and
sample result identifications as discussed below.
Surrogate Recoveries
All sample surrogate recoveries were considered acceptable and within QC limits with the
exception of the low tetrachloro-m-xylene recovery (QC limit 45-130%R) on both the primary
quantitation column and secondary confirmation column in samples OL-1803-07F (43%R,
ONONDAGA LAKE 2012 TISSUE MONITORING
DATA USABILITY SUMMARY REPORT
PARSONS
P:\Honeywell -SYR\447479 - 2012 Remedial Goal Monitoring\09.0 Reports\9.2 Monitoring Summary - 2012\Appendix A - DUSR\OL 2012 Tissue Monitoring DUSR_Final.DOCX
A2-4
41%R) and OL-1806-03F (42%R, 40%R); the low decachlorobiphenyl recovery (QC limit 45-
130%R) on the primary quantitation column in sample OL-1803-07F (44%R); and the high
decachlorobiphenyl recovery (QC limit 45-130%R) on the secondary confirmation column in
samples OL-1801-05F (185%R), OL-1801-06F (133%R), OL-1802-01F (167%R), OL-1803-05F
(133%R), and OL-1804-15F (154%R). Validation qualification was not required for these
samples with the exception of OL-1803-07F. The positive results for this sample were
considered estimated, possibly biased low, and qualified “J”.
MS/MSD Precision and Accuracy
All MS/MSD precision and accuracy measurements for spiked compounds were considered
acceptable and within QC limits for designated spiked project samples with the exception of the
low MS accuracy result for 4,4’-DDE (60%R; QC limit 70-133%R) during the spiked analyses
of sample OL-1801-06F; the low MS/MSD accuracy results for 4,4’-DDE (39%R/13%R; QC
limit 70-1333%R), 4,4’-DDT (54%R/41%R; QC limit 61-126%R), and 4,4’-DDD
(62%R/50%R; QC limit 70-135%R) during the spiked analyses of sample OL-1803-04F; the
high MS/MSD accuracy results for 4,4’-DDE (144%R/155%R; QC limit 70-133%R) during the
spiked analyses of sample OL-1804-15F; and the low MS/MSD accuracy results for 4,4’-DDE (-
34%R/-9%R; QC limit 70-133%R), 4,4’-DDT (-7%R/8%R; QC limit 61-126%R), and 4,4’-DDD
(50%R/63%R; QC limit 70-135%R) during the spiked analyses of sample OL-1805-02F.
Validation qualification of the parent sample OL-1801-06F was not required based upon one
accuracy result outside the QC limit. However, results for those compounds where MS/MSD
accuracy results fell below QC limits were considered estimated, possibly biased low, with
positive results qualified “J” and nondetected results qualified “UJ” for the parent sample.
Positive results for those compounds where MS/MSD accuracy results exceeded the QC limit
were considered estimated, possibly biased high, and qualified “J” for the parent samples.
Sample Result Identifications
Positive sample results were verified and confirmed present using dual column
confirmation. The precision (%RPD) between the results on the dual columns was less than 25%
with the exception of hexachlorobenzene for samples OL-1810-07 (31.5%RPD) and -10
(176.6%RPD); 4,4’-DDE for samples OL-1800-02F (38.5%RPD), -03F (45%RPD), -06F
(47.8%RPD), -07F (49.4%RPD), -11F (40.4%RPD), -12F (29%RPD), OL-1802-01F
(49.5%RPD), -04F (28.1%RPD), -05F (28.3%RPD), OL-1803-04F (26%RPD), -05F
(28.9%RPD), -13F (33.8%RPD), -18F (27.1%RPD), OL-1804-01F (38.4%RPD), -02F
(33.4%RPD), -04 (25.2%RPD), -06F (29.5%RPD), -11F (32.3%RPD), -13F (43.8%RPD), -14F
(29.5%RPD), OL-1806-03F (26.8%RPD), -04F (26.3%RPD), and OL-1807-01F (25.2%RPD);
4,4’-DDT for samples OL-1800-02F (142.4%RPD), -03F (142.4%RPD), -06F (150.3%RPD), -
07F (152%RPD), -09 (152.8%RPD), -11F (154.8%RPD), -12F (150.7%RPD), OL-1801-05F
(150.9%RPD), -06F (151.3%RPD), -07F (148.9%RPD), OL-1802-01F (143.6%RPD), -02F
(150.3%RPD), -04F (147.2%RPD), -05F (147.2%RPD), -06F (150.9%RPD), -07F
ONONDAGA LAKE 2012 TISSUE MONITORING
DATA USABILITY SUMMARY REPORT
PARSONS
P:\Honeywell -SYR\447479 - 2012 Remedial Goal Monitoring\09.0 Reports\9.2 Monitoring Summary - 2012\Appendix A - DUSR\OL 2012 Tissue Monitoring DUSR_Final.DOCX
A2-5
(151.6%RPD), OL-1803-04F (148.5%RPD), -05F (147.8%RPD), -07F (151.5%RPD), -11
(147.9%RPD), -13F (144.4%RPD), -18F (138.9%RPD), OL-1804-01F (146.9%RPD), -02F
(152%RPD), -04 (147.4%RPD), -06F (151.2%RPD), -11F (154%RPD), -12F (139.9%RPD), -
13F (140.6%RPD), -14F (159.7%RPD), -15F (159.7%RPD), -16F (167.2%RPD), OL-1805-02F
(160.9%RPD), -03F (161.5%RPD), -04F (161.5%RPD), OL-1806-03F (159.2%RPD), -04F
(158.7%RPD), OL-1807-01F (157%RPD), and OL-1810-05 (54.7%RPD); and 4,4’-DDD for
samples OL-1800-02F (133.2%RPD), -03F (146%RPD), -06F (138.6%RPD), -07F
(141.5%RPD), -09 (132.8%RPD), -11F (135.7%RPD), -12F (106.1%RPD), OL-1801-05F
(145.9%RPD), -06F (144.8%RPD), -07F (139.6%RPD), OL-1802-01F (138.8%RPD), -02F
(149.6%RPD), -04F (151%RPD), -05F (153.2%RPD), -06F (161.1%RPD), -07F (140.6%RPD),
OL-1803-04F (143.5%RPD), -05F (155.2%RPD), -07F (146.6%RPD), -11 (113.1%RPD), -13F
(135.6%RPD), -18F (138%RPD), OL-1804-01F (128.6%RPD), -02F (141.1%RPD), -04
(185.9%RPD), -06F (153%RPD), -11F (135.2%RPD), -12F (156%RPD), -13F (158%RPD), -
14F (143.3%RPD), -15F (160.6%RPD), -16F (143.4%RPD), OL-1805-02F (148%RPD), -03F
(153.2%RPD), -04F (152.5%RPD), OL-1806-03F (154%RPD), -04F (156.9%RPD), OL-1807-
01F (159.4%RPD), OL-1810-01 (91%RPD), -05 (96.6%RPD), -07 (79%RPD), -10
(130.5%RPD), and -13 (139%RPD). These results were considered estimated and qualified “J”
for the affected samples. However, for those compounds where the %RPD was greater than 90%,
the results were considered estimated, tentatively identified, and qualified “JN” for the affected
samples.
Usability
All hexachlorobenzene, 4,4’-DDT, and metabolite sample results for the fish samples were
considered usable following data validation.
Summary
The quality assurance objectives for measurement data included considerations for
precision, accuracy, representativeness, completeness, and comparability. The
hexachlorobenzene, 4,4’-DDT, and metabolite data presented by TAL were 100% complete with
all data considered usable and valid. The validated data are tabulated and presented in
Attachment A-1.
A2.1.4 Dioxins and Furans
The following items were reviewed for compliancy in the dioxins and furans analysis:
Custody documentation
Holding times
Surrogate recoveries
Matrix spike/matrix spike duplicate (MS/MSD) precision and accuracy
Laboratory control sample (LCS) recoveries
ONONDAGA LAKE 2012 TISSUE MONITORING
DATA USABILITY SUMMARY REPORT
PARSONS
P:\Honeywell -SYR\447479 - 2012 Remedial Goal Monitoring\09.0 Reports\9.2 Monitoring Summary - 2012\Appendix A - DUSR\OL 2012 Tissue Monitoring DUSR_Final.DOCX
A2-6
Laboratory method blank contamination
Initial calibrations
Verification calibrations
Internal standard recoveries
Clean-up recoveries
Sample result verification and identification
Quantitation limits
Data completeness
These items were considered compliant and acceptable in accordance with the validation
protocols with the exception of LCS recoveries and blank contamination as discussed below.
LCS Recoveries
All LCS recoveries were considered acceptable and within QC limits for all dioxins and
furans with the exception of the low LCS recovery for OCDF (62%R; QC limit 70-130%R)
associated with all sport fish samples. Therefore, the OCDF results for these samples which were
nondetects were considered estimated, possibly biased low, and qualified “UJ”.
Blank Contamination
The laboratory method blank associated with all sport fish samples contained OCDD and
OCDF below the reporting limit at concentrations of 0.66 and 0.42 pg/g, respectively. Therefore,
associated sample results less than validation action concentrations were considered not detected
and qualified “U” for the affected samples.
Usability
All dioxin and furan results for the sport fish samples were considered usable following data
validation.
Summary
The quality assurance objectives for measurement data included considerations for
precision, accuracy, representativeness, completeness, and comparability. The dioxin and furan
data presented by TAL were 100% complete with all data considered usable and valid. The
validated data are tabulated and presented in Attachment A-1.
A2.1.5 Percent Lipids
The following items were reviewed for compliancy in the percent lipids analysis:
Custody documentation
Holding times
ONONDAGA LAKE 2012 TISSUE MONITORING
DATA USABILITY SUMMARY REPORT
PARSONS
P:\Honeywell -SYR\447479 - 2012 Remedial Goal Monitoring\09.0 Reports\9.2 Monitoring Summary - 2012\Appendix A - DUSR\OL 2012 Tissue Monitoring DUSR_Final.DOCX
A2-7
Laboratory blank contamination
Laboratory duplicate precision
Sample result verification and identification
Quantitation limits
Data completeness
These items were considered compliant and acceptable in accordance with the validation
protocols.
Usability
All percent lipids sample results for the fish samples were considered usable following data
validation.
Summary
The quality assurance objectives for measurement data included considerations for
precision, accuracy, representativeness, completeness, and comparability. The percent lipids data
presented by TAL were 100% complete (i.e., usable). The validated laboratory data are tabulated
and presented in Attachment A-1.
A2.2 ZOOPLANKTON SAMPLES
Data review has been completed for data packages generated by TAL containing
zooplankton samples collected from the site. The specific samples contained in these data
packages, the analyses performed, and the validated laboratory data were tabulated and are
presented in Attachment A-2. All of these samples were shipped under a COC record and
received intact by the analytical laboratory.
Data validation was performed for all samples in accordance with the project work plan and
QAPP as well as the USEPA Region II SOP HW-2, Revision 13 “Evaluation of Metals Data for
the CLP Program”. This data validation and usability report is presented by analysis type.
A2.2.1 Low Level Mercury
The following items were reviewed for compliancy in the low level mercury analysis:
Custody documentation
Holding times
Initial and continuing calibration verifications
Initial and continuing calibration, and laboratory preparation blank contamination
Matrix spike / matrix spike duplicate (MS/MSD) recoveries
Laboratory duplicate precision
ONONDAGA LAKE 2012 TISSUE MONITORING
DATA USABILITY SUMMARY REPORT
PARSONS
P:\Honeywell -SYR\447479 - 2012 Remedial Goal Monitoring\09.0 Reports\9.2 Monitoring Summary - 2012\Appendix A - DUSR\OL 2012 Tissue Monitoring DUSR_Final.DOCX
A2-8
Laboratory control sample (LCS) recoveries
Sample result verification and identification
Quantitation limits
Data completeness
These items were considered compliant and acceptable in accordance with the validation
protocols with the exception of blank contamination and laboratory control sample recoveries as
discussed below.
Blank Contamination
Initial and continuing calibration blanks contained low level mercury below the reporting
limit associated with project samples at a concentration ranging 0.128 – 0.269 ng/L. Validation
qualification of the project samples was not required since the samples were not affected by the
contamination detected in these blanks.
LCS Recoveries
All LCS recoveries were considered acceptable and within the 65-130%R QC limit for low
level mercury with the exception of the low LCS recovery (20%R) associated with samples OL-
1771-01, OL-1775-01, and OL-1779-01. Therefore, the positive low level mercury results for
these samples were considered estimated, possibly biased low, and qualified “J”.
Usability
All low level mercury sample results for the zooplankton samples were considered usable
following data validation.
Summary
The quality assurance objectives for measurement data included considerations for
precision, accuracy, representativeness, completeness, and comparability. The low level mercury
data presented by TAL were 100% complete (i.e., usable). The validated low level mercury
laboratory data are tabulated and presented in Attachment A-2.
A2.2.2 Methyl Mercury
The following items were reviewed for compliancy in the methyl mercury analysis:
Custody documentation
Holding times
Surrogate recoveries
Initial and continuing calibration verifications
Initial and continuing calibration, and laboratory preparation blank contamination
Matrix spike / matrix spike duplicate (MS/MSD) recoveries
ONONDAGA LAKE 2012 TISSUE MONITORING
DATA USABILITY SUMMARY REPORT
PARSONS
P:\Honeywell -SYR\447479 - 2012 Remedial Goal Monitoring\09.0 Reports\9.2 Monitoring Summary - 2012\Appendix A - DUSR\OL 2012 Tissue Monitoring DUSR_Final.DOCX
A2-9
Laboratory duplicate precision
Laboratory control sample (LCS) recoveries
Sample result verification and identification
Quantitation limits
Data completeness
These items were considered compliant and acceptable in accordance with the validation
protocols with the exception of blank contamination as discussed below.
Blank Contamination
Initial and continuing calibration blanks contained methyl mercury below the reporting limit
associated with project samples at a concentration ranging 0.0105 – 0.0315 ng/L. The methyl
mercury sample results did not require qualification since sample concentrations were not
affected by the contamination in these blanks.
Usability
All methyl mercury sample results for the zooplankton samples were considered usable
following data validation.
Summary
The quality assurance objectives for measurement data included considerations for
precision, accuracy, representativeness, completeness, and comparability. The methyl mercury
data presented by TAL were 100% complete (i.e., usable). The validated methyl mercury
laboratory data are tabulated and presented in Attachment A-2.
-
ONONDAGA LAKE 2012 TISSUE MONITORING
DATA USABILITY SUMMARY REPORT
PARSONS
P:\Honeywell -SYR\447479 - 2012 Remedial Goal Monitoring\09.0 Reports\9.2 Monitoring Summary - 2012\Appendix A - DUSR\OL 2012 Tissue Monitoring DUSR_Final.DOCX
ATTACHMENT A
VALIDATED LABORATORY DATA
-
ONONDAGA LAKE 2012 TISSUE MONITORING
DATA USABILITY SUMMARY REPORT
PARSONS
P:\Honeywell -SYR\447479 - 2012 Remedial Goal Monitoring\09.0 Reports\9.2 Monitoring Summary - 2012\Appendix A - DUSR\OL 2012 Tissue Monitoring DUSR_Final.DOCX
ATTACHMENT A-1
VALIDATED LABORATORY DATA FOR FISH SAMPLES
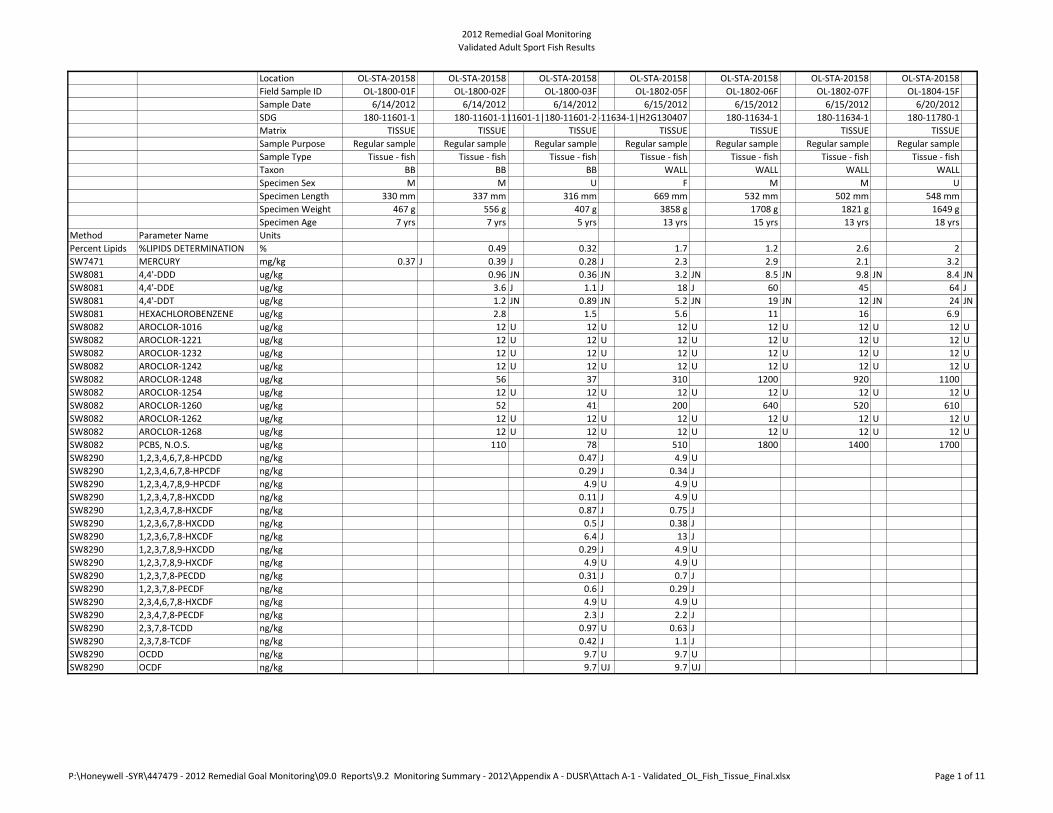
2012 Remedial Goal Monitoring
Validated Adult Sport Fish Results
Location OL-STA-20158 OL-STA-20158 OL-STA-20158 OL-STA-20158 OL-STA-20158 OL-STA-20158 OL-STA-20158
Field Sample ID OL-1800-01F OL-1800-02F OL-1800-03F OL-1802-05F OL-1802-06F OL-1802-07F OL-1804-15F
Sample Date 6/14/2012 6/14/2012 6/14/2012 6/15/2012 6/15/2012 6/15/2012 6/20/2012
SDG 180-11601-1 180-11601-1180-11601-1|180-11601-2180-11634-1|H2G130407 180-11634-1 180-11634-1 180-11780-1
Matrix TISSUE TISSUE TISSUE TISSUE TISSUE TISSUE TISSUE
Sample Purpose Regular sample Regular sample Regular sample Regular sample Regular sample Regular sample Regular sample
Sample Type Tissue - fish Tissue - fish Tissue - fish Tissue - fish Tissue - fish Tissue - fish Tissue - fish
Taxon BB BB BB WALL WALL WALL WALL
Specimen Sex M M U F M M U
Specimen Length 330 mm 337 mm 316 mm 669 mm 532 mm 502 mm 548 mm
Specimen Weight 467 g 556 g 407 g 3858 g 1708 g 1821 g 1649 g
Specimen Age 7 yrs 7 yrs 5 yrs 13 yrs 15 yrs 13 yrs 18 yrs
Method Parameter Name Units
Percent Lipids %LIPIDS DETERMINATION % 0.49 0.32 1.7 1.2 2.6 2
SW7471 MERCURY mg/kg 0.37 J 0.39 J 0.28 J 2.3 2.9 2.1 3.2
SW8081 4,4'-DDD ug/kg 0.96 JN 0.36 JN 3.2 JN 8.5 JN 9.8 JN 8.4 JN
SW8081 4,4'-DDE ug/kg 3.6 J 1.1 J 18 J 60 45 64 J
SW8081 4,4'-DDT ug/kg 1.2 JN 0.89 JN 5.2 JN 19 JN 12 JN 24 JN
SW8081 HEXACHLOROBENZENE ug/kg 2.8 1.5 5.6 11 16 6.9
SW8082 AROCLOR-1016 ug/kg 12 U 12 U 12 U 12 U 12 U 12 U
SW8082 AROCLOR-1221 ug/kg 12 U 12 U 12 U 12 U 12 U 12 U
SW8082 AROCLOR-1232 ug/kg 12 U 12 U 12 U 12 U 12 U 12 U
SW8082 AROCLOR-1242 ug/kg 12 U 12 U 12 U 12 U 12 U 12 U
SW8082 AROCLOR-1248 ug/kg 56 37 310 1200 920 1100
SW8082 AROCLOR-1254 ug/kg 12 U 12 U 12 U 12 U 12 U 12 U
SW8082 AROCLOR-1260 ug/kg 52 41 200 640 520 610
SW8082 AROCLOR-1262 ug/kg 12 U 12 U 12 U 12 U 12 U 12 U
SW8082 AROCLOR-1268 ug/kg 12 U 12 U 12 U 12 U 12 U 12 U
SW8082 PCBS, N.O.S. ug/kg 110 78 510 1800 1400 1700
SW8290 1,2,3,4,6,7,8-HPCDD ng/kg 0.47 J 4.9 U
SW8290 1,2,3,4,6,7,8-HPCDF ng/kg 0.29 J 0.34 J
SW8290 1,2,3,4,7,8,9-HPCDF ng/kg 4.9 U 4.9 U
SW8290 1,2,3,4,7,8-HXCDD ng/kg 0.11 J 4.9 U
SW8290 1,2,3,4,7,8-HXCDF ng/kg 0.87 J 0.75 J
SW8290 1,2,3,6,7,8-HXCDD ng/kg 0.5 J 0.38 J
SW8290 1,2,3,6,7,8-HXCDF ng/kg 6.4 J 13 J
SW8290 1,2,3,7,8,9-HXCDD ng/kg 0.29 J 4.9 U
SW8290 1,2,3,7,8,9-HXCDF ng/kg 4.9 U 4.9 U
SW8290 1,2,3,7,8-PECDD ng/kg 0.31 J 0.7 J
SW8290 1,2,3,7,8-PECDF ng/kg 0.6 J 0.29 J
SW8290 2,3,4,6,7,8-HXCDF ng/kg 4.9 U 4.9 U
SW8290 2,3,4,7,8-PECDF ng/kg 2.3 J 2.2 J
SW8290 2,3,7,8-TCDD ng/kg 0.97 U 0.63 J
SW8290 2,3,7,8-TCDF ng/kg 0.42 J 1.1 J
SW8290 OCDD ng/kg 9.7 U 9.7 U
SW8290 OCDF ng/kg 9.7 UJ 9.7 UJ
P:\Honeywell -SYR\447479 - 2012 Remedial Goal Monitoring\09.0 Reports\9.2 Monitoring Summary - 2012\Appendix A - DUSR\Attach A-1 - Validated_OL_Fish_Tissue_Final.xlsx Page 1 of 11
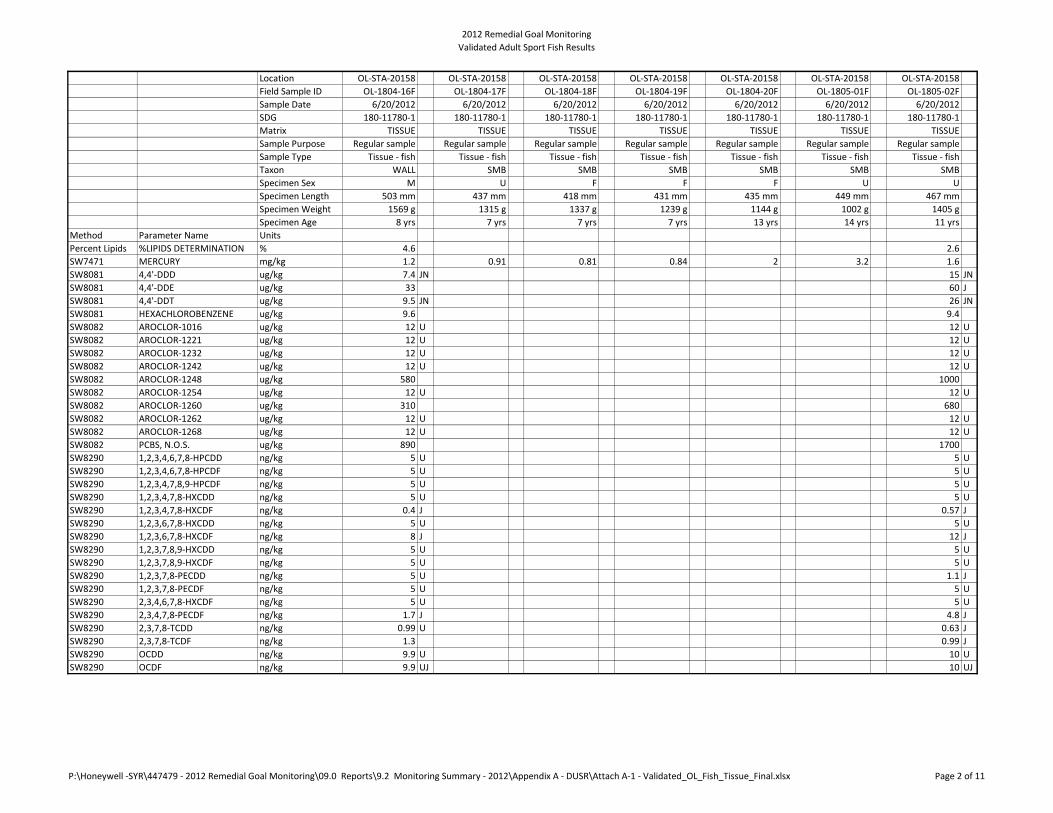
2012 Remedial Goal Monitoring
Validated Adult Sport Fish Results
Location
Field Sample ID
Sample Date
SDG
Matrix
Sample Purpose
Sample Type
Taxon
Specimen Sex
Specimen Length
Specimen Weight
Specimen Age
Method Parameter Name Units
Percent Lipids %LIPIDS DETERMINATION %
SW7471 MERCURY mg/kg
SW8081 4,4'-DDD ug/kg
SW8081 4,4'-DDE ug/kg
SW8081 4,4'-DDT ug/kg
SW8081 HEXACHLOROBENZENE ug/kg
SW8082 AROCLOR-1016 ug/kg
SW8082 AROCLOR-1221 ug/kg
SW8082 AROCLOR-1232 ug/kg
SW8082 AROCLOR-1242 ug/kg
SW8082 AROCLOR-1248 ug/kg
SW8082 AROCLOR-1254 ug/kg
SW8082 AROCLOR-1260 ug/kg
SW8082 AROCLOR-1262 ug/kg
SW8082 AROCLOR-1268 ug/kg
SW8082 PCBS, N.O.S. ug/kg
SW8290 1,2,3,4,6,7,8-HPCDD ng/kg
SW8290 1,2,3,4,6,7,8-HPCDF ng/kg
SW8290 1,2,3,4,7,8,9-HPCDF ng/kg
SW8290 1,2,3,4,7,8-HXCDD ng/kg
SW8290 1,2,3,4,7,8-HXCDF ng/kg
SW8290 1,2,3,6,7,8-HXCDD ng/kg
SW8290 1,2,3,6,7,8-HXCDF ng/kg
SW8290 1,2,3,7,8,9-HXCDD ng/kg
SW8290 1,2,3,7,8,9-HXCDF ng/kg
SW8290 1,2,3,7,8-PECDD ng/kg
SW8290 1,2,3,7,8-PECDF ng/kg
SW8290 2,3,4,6,7,8-HXCDF ng/kg
SW8290 2,3,4,7,8-PECDF ng/kg
SW8290 2,3,7,8-TCDD ng/kg
SW8290 2,3,7,8-TCDF ng/kg
SW8290 OCDD ng/kg
SW8290 OCDF ng/kg
OL-STA-20158 OL-STA-20158 OL-STA-20158 OL-STA-20158 OL-STA-20158 OL-STA-20158 OL-STA-20158
OL-1804-16F OL-1804-17F OL-1804-18F OL-1804-19F OL-1804-20F OL-1805-01F OL-1805-02F
6/20/2012 6/20/2012 6/20/2012 6/20/2012 6/20/2012 6/20/2012 6/20/2012
180-11780-1 180-11780-1 180-11780-1 180-11780-1 180-11780-1 180-11780-1 180-11780-1
TISSUE TISSUE TISSUE TISSUE TISSUE TISSUE TISSUE
Regular sample Regular sample Regular sample Regular sample Regular sample Regular sample Regular sample
Tissue - fish Tissue - fish Tissue - fish Tissue - fish Tissue - fish Tissue - fish Tissue - fish
WALL SMB SMB SMB SMB SMB SMB
M U F F F U U
503 mm 437 mm 418 mm 431 mm 435 mm 449 mm 467 mm
1569 g 1315 g 1337 g 1239 g 1144 g 1002 g 1405 g
8 yrs 7 yrs 7 yrs 7 yrs 13 yrs 14 yrs 11 yrs
4.6 2.6
1.2 0.91 0.81 0.84 2 3.2 1.6
7.4 JN 15 JN
33 60 J
9.5 JN 26 JN
9.6 9.4
12 U 12 U
12 U 12 U
12 U 12 U
12 U 12 U
580 1000
12 U 12 U
310 680
12 U 12 U
12 U 12 U
890 1700
5 U 5 U
5 U 5 U
5 U 5 U
5 U 5 U
0.4 J 0.57 J
5 U 5 U
8 J 12 J
5 U 5 U
5 U 5 U
5 U 1.1 J
5 U 5 U
5 U 5 U
1.7 J 4.8 J
0.99 U 0.63 J
1.3 0.99 J
9.9 U 10 U
9.9 UJ 10 UJ
P:\Honeywell -SYR\447479 - 2012 Remedial Goal Monitoring\09.0 Reports\9.2 Monitoring Summary - 2012\Appendix A - DUSR\Attach A-1 - Validated_OL_Fish_Tissue_Final.xlsx Page 2 of 11
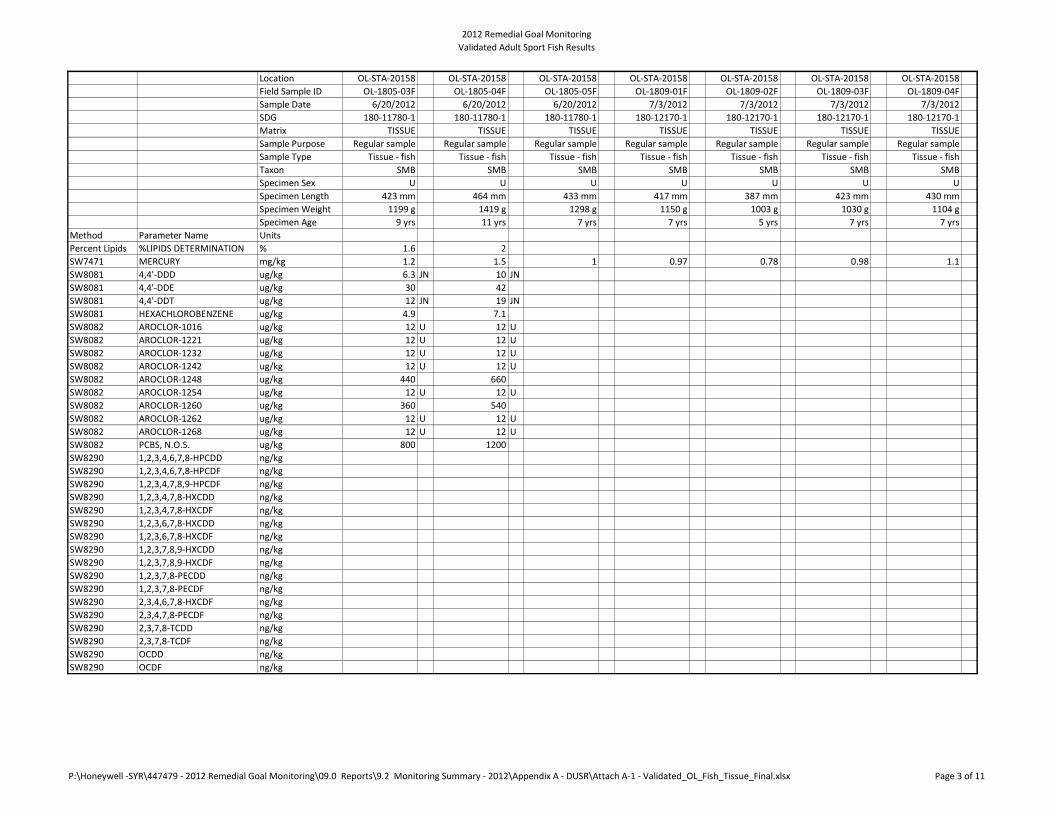
2012 Remedial Goal Monitoring
Validated Adult Sport Fish Results
Location
Field Sample ID
Sample Date
SDG
Matrix
Sample Purpose
Sample Type
Taxon
Specimen Sex
Specimen Length
Specimen Weight
Specimen Age
Method Parameter Name Units
Percent Lipids %LIPIDS DETERMINATION %
SW7471 MERCURY mg/kg
SW8081 4,4'-DDD ug/kg
SW8081 4,4'-DDE ug/kg
SW8081 4,4'-DDT ug/kg
SW8081 HEXACHLOROBENZENE ug/kg
SW8082 AROCLOR-1016 ug/kg
SW8082 AROCLOR-1221 ug/kg
SW8082 AROCLOR-1232 ug/kg
SW8082 AROCLOR-1242 ug/kg
SW8082 AROCLOR-1248 ug/kg
SW8082 AROCLOR-1254 ug/kg
SW8082 AROCLOR-1260 ug/kg
SW8082 AROCLOR-1262 ug/kg
SW8082 AROCLOR-1268 ug/kg
SW8082 PCBS, N.O.S. ug/kg
SW8290 1,2,3,4,6,7,8-HPCDD ng/kg
SW8290 1,2,3,4,6,7,8-HPCDF ng/kg
SW8290 1,2,3,4,7,8,9-HPCDF ng/kg
SW8290 1,2,3,4,7,8-HXCDD ng/kg
SW8290 1,2,3,4,7,8-HXCDF ng/kg
SW8290 1,2,3,6,7,8-HXCDD ng/kg
SW8290 1,2,3,6,7,8-HXCDF ng/kg
SW8290 1,2,3,7,8,9-HXCDD ng/kg
SW8290 1,2,3,7,8,9-HXCDF ng/kg
SW8290 1,2,3,7,8-PECDD ng/kg
SW8290 1,2,3,7,8-PECDF ng/kg
SW8290 2,3,4,6,7,8-HXCDF ng/kg
SW8290 2,3,4,7,8-PECDF ng/kg
SW8290 2,3,7,8-TCDD ng/kg
SW8290 2,3,7,8-TCDF ng/kg
SW8290 OCDD ng/kg
SW8290 OCDF ng/kg
OL-STA-20158 OL-STA-20158 OL-STA-20158 OL-STA-20158 OL-STA-20158 OL-STA-20158 OL-STA-20158
OL-1805-03F OL-1805-04F OL-1805-05F OL-1809-01F OL-1809-02F OL-1809-03F OL-1809-04F
6/20/2012 6/20/2012 6/20/2012 7/3/2012 7/3/2012 7/3/2012 7/3/2012
180-11780-1 180-11780-1 180-11780-1 180-12170-1 180-12170-1 180-12170-1 180-12170-1
TISSUE TISSUE TISSUE TISSUE TISSUE TISSUE TISSUE
Regular sample Regular sample Regular sample Regular sample Regular sample Regular sample Regular sample
Tissue - fish Tissue - fish Tissue - fish Tissue - fish Tissue - fish Tissue - fish Tissue - fish
SMB SMB SMB SMB SMB SMB SMB
U U U U U U U
423 mm 464 mm 433 mm 417 mm 387 mm 423 mm 430 mm
1199 g 1419 g 1298 g 1150 g 1003 g 1030 g 1104 g
9 yrs 11 yrs 7 yrs 7 yrs 5 yrs 7 yrs 7 yrs
1.6 2
1.2 1.5 1 0.97 0.78 0.98 1.1
6.3 JN 10 JN
30 42
12 JN 19 JN
4.9 7.1
12 U 12 U
12 U 12 U
12 U 12 U
12 U 12 U
440 660
12 U 12 U
360 540
12 U 12 U
12 U 12 U
800 1200
P:\Honeywell -SYR\447479 - 2012 Remedial Goal Monitoring\09.0 Reports\9.2 Monitoring Summary - 2012\Appendix A - DUSR\Attach A-1 - Validated_OL_Fish_Tissue_Final.xlsx Page 3 of 11

2012 Remedial Goal Monitoring
Validated Adult Sport Fish Results
Location
Field Sample ID
Sample Date
SDG
Matrix
Sample Purpose
Sample Type
Taxon
Specimen Sex
Specimen Length
Specimen Weight
Specimen Age
Method Parameter Name Units
Percent Lipids %LIPIDS DETERMINATION %
SW7471 MERCURY mg/kg
SW8081 4,4'-DDD ug/kg
SW8081 4,4'-DDE ug/kg
SW8081 4,4'-DDT ug/kg
SW8081 HEXACHLOROBENZENE ug/kg
SW8082 AROCLOR-1016 ug/kg
SW8082 AROCLOR-1221 ug/kg
SW8082 AROCLOR-1232 ug/kg
SW8082 AROCLOR-1242 ug/kg
SW8082 AROCLOR-1248 ug/kg
SW8082 AROCLOR-1254 ug/kg
SW8082 AROCLOR-1260 ug/kg
SW8082 AROCLOR-1262 ug/kg
SW8082 AROCLOR-1268 ug/kg
SW8082 PCBS, N.O.S. ug/kg
SW8290 1,2,3,4,6,7,8-HPCDD ng/kg
SW8290 1,2,3,4,6,7,8-HPCDF ng/kg
SW8290 1,2,3,4,7,8,9-HPCDF ng/kg
SW8290 1,2,3,4,7,8-HXCDD ng/kg
SW8290 1,2,3,4,7,8-HXCDF ng/kg
SW8290 1,2,3,6,7,8-HXCDD ng/kg
SW8290 1,2,3,6,7,8-HXCDF ng/kg
SW8290 1,2,3,7,8,9-HXCDD ng/kg
SW8290 1,2,3,7,8,9-HXCDF ng/kg
SW8290 1,2,3,7,8-PECDD ng/kg
SW8290 1,2,3,7,8-PECDF ng/kg
SW8290 2,3,4,6,7,8-HXCDF ng/kg
SW8290 2,3,4,7,8-PECDF ng/kg
SW8290 2,3,7,8-TCDD ng/kg
SW8290 2,3,7,8-TCDF ng/kg
SW8290 OCDD ng/kg
SW8290 OCDF ng/kg
OL-STA-30093 OL-STA-30093 OL-STA-30093 OL-STA-30093 OL-STA-30093 OL-STA-30093 OL-STA-30093
OL-1801-01F OL-1802-08F OL-1802-09F OL-1803-01F OL-1804-06F OL-1804-07F OL-1804-08F
6/14/2012 6/15/2012 6/15/2012 6/19/2012 6/20/2012 6/20/2012 6/20/2012
180-11601-1 180-11634-1 180-11634-1 180-11715-1 180-11780-1 180-11780-1 180-11780-1
TISSUE TISSUE TISSUE TISSUE TISSUE TISSUE TISSUE
Regular sample Regular sample Regular sample Regular sample Regular sample Regular sample Regular sample
Tissue - fish Tissue - fish Tissue - fish Tissue - fish Tissue - fish Tissue - fish Tissue - fish
WALL WALL WALL WALL BB BB BB
M M M U U F U
528 mm 560 mm 523 mm 555 mm 342 mm 336 mm 305 mm
2054 g 2066 g 1926 g 2091 g 511 g 550 g 446 g
10 yrs 14 yrs 7 yrs 7 yrs 6 yrs 6 yrs 7 yrs
0.28
1.5 J 2.2 2 1.3 0.43 0.48 0.47
0.83 JN
7.1 J
2.6 JN
2.6
13 U
13 U
13 U
13 U
88
13 U
100
13 U
13 U
190
4.9 U
4.9 U
4.9 U
4.9 U
0.63 J
4.9 U
7.5 J
4.9 U
4.9 U
4.9 U
4.9 U
4.9 U
2.6 J
0.98 U
0.98 U
9.8 U
9.8 UJ
P:\Honeywell -SYR\447479 - 2012 Remedial Goal Monitoring\09.0 Reports\9.2 Monitoring Summary - 2012\Appendix A - DUSR\Attach A-1 - Validated_OL_Fish_Tissue_Final.xlsx Page 4 of 11
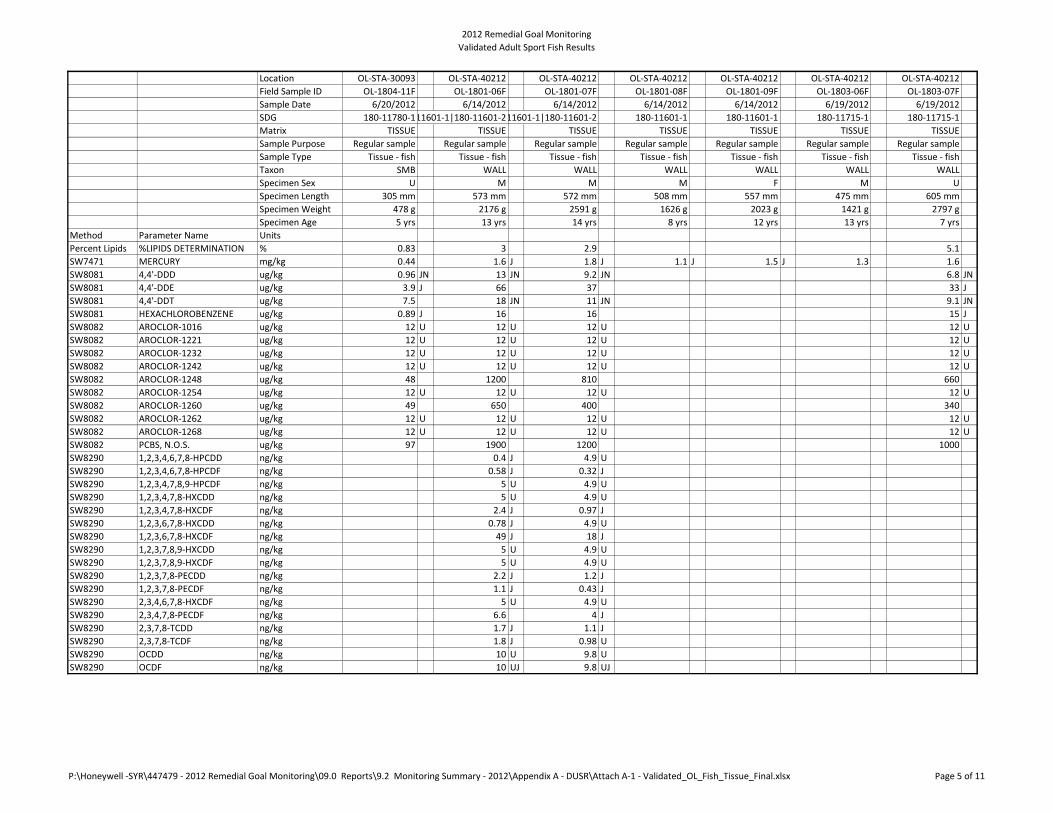
2012 Remedial Goal Monitoring
Validated Adult Sport Fish Results
Location
Field Sample ID
Sample Date
SDG
Matrix
Sample Purpose
Sample Type
Taxon
Specimen Sex
Specimen Length
Specimen Weight
Specimen Age
Method Parameter Name Units
Percent Lipids %LIPIDS DETERMINATION %
SW7471 MERCURY mg/kg
SW8081 4,4'-DDD ug/kg
SW8081 4,4'-DDE ug/kg
SW8081 4,4'-DDT ug/kg
SW8081 HEXACHLOROBENZENE ug/kg
SW8082 AROCLOR-1016 ug/kg
SW8082 AROCLOR-1221 ug/kg
SW8082 AROCLOR-1232 ug/kg
SW8082 AROCLOR-1242 ug/kg
SW8082 AROCLOR-1248 ug/kg
SW8082 AROCLOR-1254 ug/kg
SW8082 AROCLOR-1260 ug/kg
SW8082 AROCLOR-1262 ug/kg
SW8082 AROCLOR-1268 ug/kg
SW8082 PCBS, N.O.S. ug/kg
SW8290 1,2,3,4,6,7,8-HPCDD ng/kg
SW8290 1,2,3,4,6,7,8-HPCDF ng/kg
SW8290 1,2,3,4,7,8,9-HPCDF ng/kg
SW8290 1,2,3,4,7,8-HXCDD ng/kg
SW8290 1,2,3,4,7,8-HXCDF ng/kg
SW8290 1,2,3,6,7,8-HXCDD ng/kg
SW8290 1,2,3,6,7,8-HXCDF ng/kg
SW8290 1,2,3,7,8,9-HXCDD ng/kg
SW8290 1,2,3,7,8,9-HXCDF ng/kg
SW8290 1,2,3,7,8-PECDD ng/kg
SW8290 1,2,3,7,8-PECDF ng/kg
SW8290 2,3,4,6,7,8-HXCDF ng/kg
SW8290 2,3,4,7,8-PECDF ng/kg
SW8290 2,3,7,8-TCDD ng/kg
SW8290 2,3,7,8-TCDF ng/kg
SW8290 OCDD ng/kg
SW8290 OCDF ng/kg
OL-STA-30093 OL-STA-40212 OL-STA-40212 OL-STA-40212 OL-STA-40212 OL-STA-40212 OL-STA-40212
OL-1804-11F OL-1801-06F OL-1801-07F OL-1801-08F OL-1801-09F OL-1803-06F OL-1803-07F
6/20/2012 6/14/2012 6/14/2012 6/14/2012 6/14/2012 6/19/2012 6/19/2012
180-11780-1180-11601-1|180-11601-2180-11601-1|180-11601-2 180-11601-1 180-11601-1 180-11715-1 180-11715-1
TISSUE TISSUE TISSUE TISSUE TISSUE TISSUE TISSUE
Regular sample Regular sample Regular sample Regular sample Regular sample Regular sample Regular sample
Tissue - fish Tissue - fish Tissue - fish Tissue - fish Tissue - fish Tissue - fish Tissue - fish
SMB WALL WALL WALL WALL WALL WALL
U M M M F M U
305 mm 573 mm 572 mm 508 mm 557 mm 475 mm 605 mm
478 g 2176 g 2591 g 1626 g 2023 g 1421 g 2797 g
5 yrs 13 yrs 14 yrs 8 yrs 12 yrs 13 yrs 7 yrs
0.83 3 2.9 5.1
0.44 1.6 J 1.8 J 1.1 J 1.5 J 1.3 1.6
0.96 JN 13 JN 9.2 JN 6.8 JN
3.9 J 66 37 33 J
7.5 18 JN 11 JN 9.1 JN
0.89 J 16 16 15 J
12 U 12 U 12 U 12 U
12 U 12 U 12 U 12 U
12 U 12 U 12 U 12 U
12 U 12 U 12 U 12 U
48 1200 810 660
12 U 12 U 12 U 12 U
49 650 400 340
12 U 12 U 12 U 12 U
12 U 12 U 12 U 12 U
97 1900 1200 1000
0.4 J 4.9 U
0.58 J 0.32 J
5 U 4.9 U
5 U 4.9 U
2.4 J 0.97 J
0.78 J 4.9 U
49 J 18 J
5 U 4.9 U
5 U 4.9 U
2.2 J 1.2 J
1.1 J 0.43 J
5 U 4.9 U
6.6 4 J
1.7 J 1.1 J
1.8 J 0.98 U
10 U 9.8 U
10 UJ 9.8 UJ
P:\Honeywell -SYR\447479 - 2012 Remedial Goal Monitoring\09.0 Reports\9.2 Monitoring Summary - 2012\Appendix A - DUSR\Attach A-1 - Validated_OL_Fish_Tissue_Final.xlsx Page 5 of 11
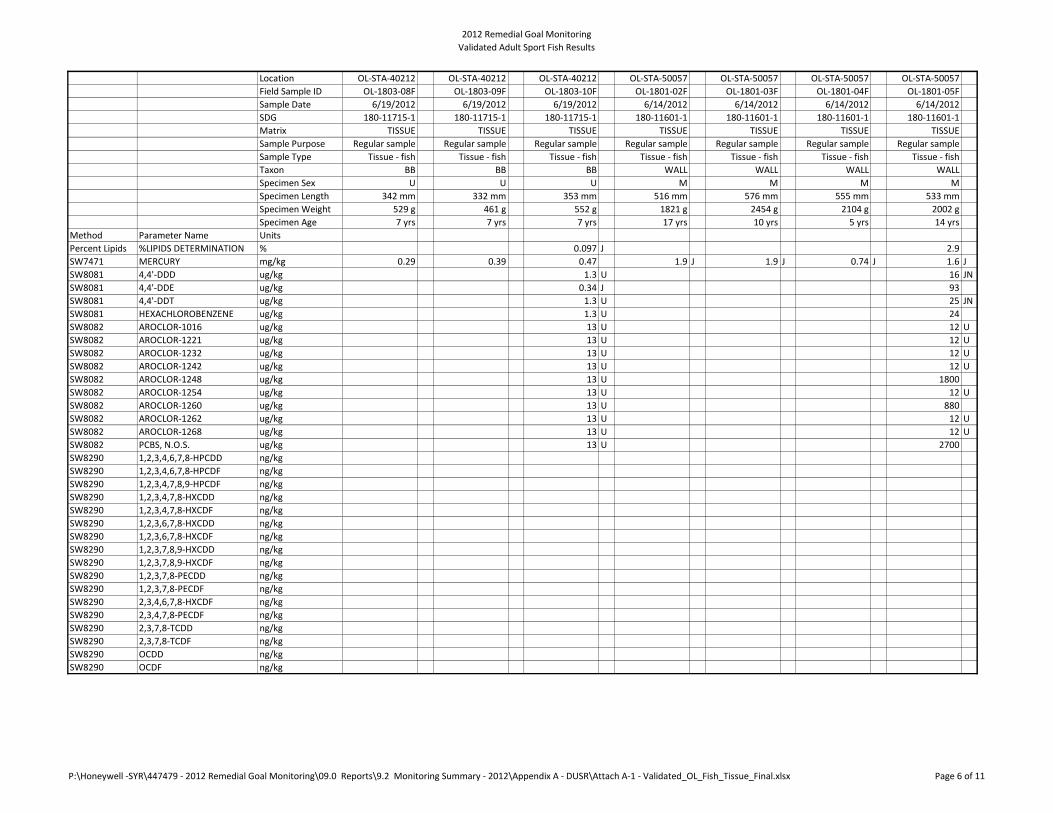
2012 Remedial Goal Monitoring
Validated Adult Sport Fish Results
Location
Field Sample ID
Sample Date
SDG
Matrix
Sample Purpose
Sample Type
Taxon
Specimen Sex
Specimen Length
Specimen Weight
Specimen Age
Method Parameter Name Units
Percent Lipids %LIPIDS DETERMINATION %
SW7471 MERCURY mg/kg
SW8081 4,4'-DDD ug/kg
SW8081 4,4'-DDE ug/kg
SW8081 4,4'-DDT ug/kg
SW8081 HEXACHLOROBENZENE ug/kg
SW8082 AROCLOR-1016 ug/kg
SW8082 AROCLOR-1221 ug/kg
SW8082 AROCLOR-1232 ug/kg
SW8082 AROCLOR-1242 ug/kg
SW8082 AROCLOR-1248 ug/kg
SW8082 AROCLOR-1254 ug/kg
SW8082 AROCLOR-1260 ug/kg
SW8082 AROCLOR-1262 ug/kg
SW8082 AROCLOR-1268 ug/kg
SW8082 PCBS, N.O.S. ug/kg
SW8290 1,2,3,4,6,7,8-HPCDD ng/kg
SW8290 1,2,3,4,6,7,8-HPCDF ng/kg
SW8290 1,2,3,4,7,8,9-HPCDF ng/kg
SW8290 1,2,3,4,7,8-HXCDD ng/kg
SW8290 1,2,3,4,7,8-HXCDF ng/kg
SW8290 1,2,3,6,7,8-HXCDD ng/kg
SW8290 1,2,3,6,7,8-HXCDF ng/kg
SW8290 1,2,3,7,8,9-HXCDD ng/kg
SW8290 1,2,3,7,8,9-HXCDF ng/kg
SW8290 1,2,3,7,8-PECDD ng/kg
SW8290 1,2,3,7,8-PECDF ng/kg
SW8290 2,3,4,6,7,8-HXCDF ng/kg
SW8290 2,3,4,7,8-PECDF ng/kg
SW8290 2,3,7,8-TCDD ng/kg
SW8290 2,3,7,8-TCDF ng/kg
SW8290 OCDD ng/kg
SW8290 OCDF ng/kg
OL-STA-40212 OL-STA-40212 OL-STA-40212 OL-STA-50057 OL-STA-50057 OL-STA-50057 OL-STA-50057
OL-1803-08F OL-1803-09F OL-1803-10F OL-1801-02F OL-1801-03F OL-1801-04F OL-1801-05F
6/19/2012 6/19/2012 6/19/2012 6/14/2012 6/14/2012 6/14/2012 6/14/2012
180-11715-1 180-11715-1 180-11715-1 180-11601-1 180-11601-1 180-11601-1 180-11601-1
TISSUE TISSUE TISSUE TISSUE TISSUE TISSUE TISSUE
Regular sample Regular sample Regular sample Regular sample Regular sample Regular sample Regular sample
Tissue - fish Tissue - fish Tissue - fish Tissue - fish Tissue - fish Tissue - fish Tissue - fish
BB BB BB WALL WALL WALL WALL
U U U M M M M
342 mm 332 mm 353 mm 516 mm 576 mm 555 mm 533 mm
529 g 461 g 552 g 1821 g 2454 g 2104 g 2002 g
7 yrs 7 yrs 7 yrs 17 yrs 10 yrs 5 yrs 14 yrs
0.097 J 2.9
0.29 0.39 0.47 1.9 J 1.9 J 0.74 J 1.6 J
1.3 U 16 JN
0.34 J 93
1.3 U 25 JN
1.3 U 24
13 U 12 U
13 U 12 U
13 U 12 U
13 U 12 U
13 U 1800
13 U 12 U
13 U 880
13 U 12 U
13 U 12 U
13 U 2700
P:\Honeywell -SYR\447479 - 2012 Remedial Goal Monitoring\09.0 Reports\9.2 Monitoring Summary - 2012\Appendix A - DUSR\Attach A-1 - Validated_OL_Fish_Tissue_Final.xlsx Page 6 of 11
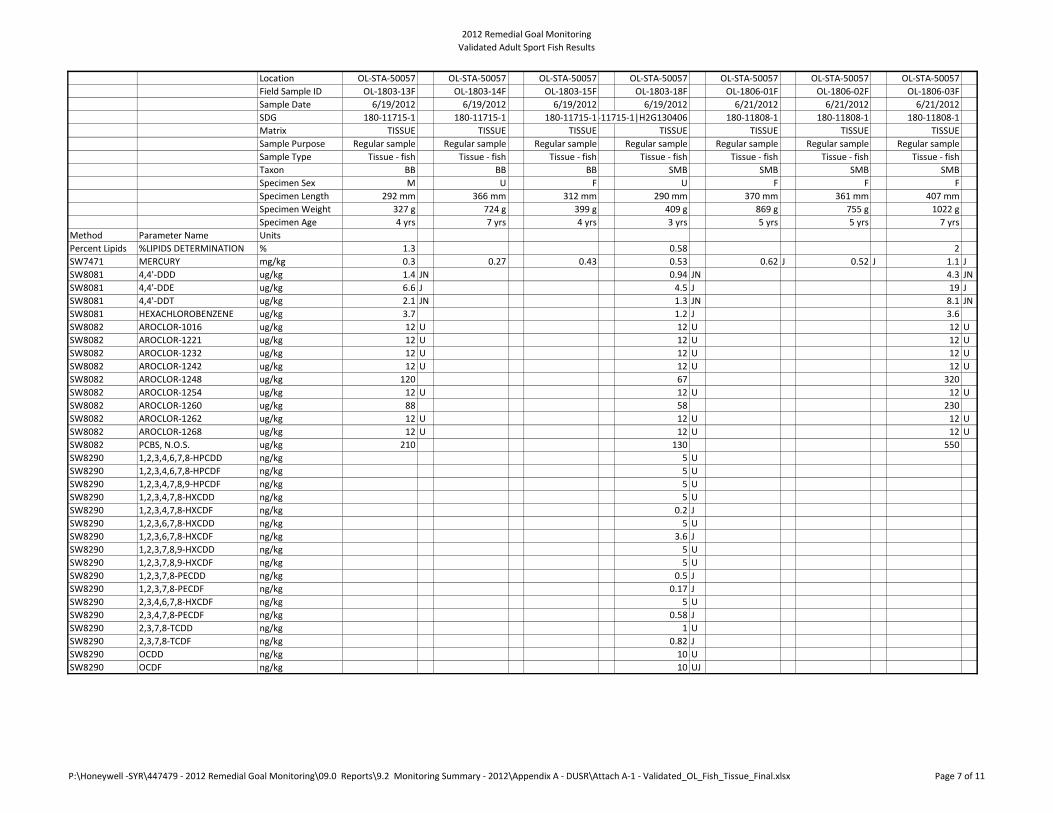
2012 Remedial Goal Monitoring
Validated Adult Sport Fish Results
Location
Field Sample ID
Sample Date
SDG
Matrix
Sample Purpose
Sample Type
Taxon
Specimen Sex
Specimen Length
Specimen Weight
Specimen Age
Method Parameter Name Units
Percent Lipids %LIPIDS DETERMINATION %
SW7471 MERCURY mg/kg
SW8081 4,4'-DDD ug/kg
SW8081 4,4'-DDE ug/kg
SW8081 4,4'-DDT ug/kg
SW8081 HEXACHLOROBENZENE ug/kg
SW8082 AROCLOR-1016 ug/kg
SW8082 AROCLOR-1221 ug/kg
SW8082 AROCLOR-1232 ug/kg
SW8082 AROCLOR-1242 ug/kg
SW8082 AROCLOR-1248 ug/kg
SW8082 AROCLOR-1254 ug/kg
SW8082 AROCLOR-1260 ug/kg
SW8082 AROCLOR-1262 ug/kg
SW8082 AROCLOR-1268 ug/kg
SW8082 PCBS, N.O.S. ug/kg
SW8290 1,2,3,4,6,7,8-HPCDD ng/kg
SW8290 1,2,3,4,6,7,8-HPCDF ng/kg
SW8290 1,2,3,4,7,8,9-HPCDF ng/kg
SW8290 1,2,3,4,7,8-HXCDD ng/kg
SW8290 1,2,3,4,7,8-HXCDF ng/kg
SW8290 1,2,3,6,7,8-HXCDD ng/kg
SW8290 1,2,3,6,7,8-HXCDF ng/kg
SW8290 1,2,3,7,8,9-HXCDD ng/kg
SW8290 1,2,3,7,8,9-HXCDF ng/kg
SW8290 1,2,3,7,8-PECDD ng/kg
SW8290 1,2,3,7,8-PECDF ng/kg
SW8290 2,3,4,6,7,8-HXCDF ng/kg
SW8290 2,3,4,7,8-PECDF ng/kg
SW8290 2,3,7,8-TCDD ng/kg
SW8290 2,3,7,8-TCDF ng/kg
SW8290 OCDD ng/kg
SW8290 OCDF ng/kg
OL-STA-50057 OL-STA-50057 OL-STA-50057 OL-STA-50057 OL-STA-50057 OL-STA-50057 OL-STA-50057
OL-1803-13F OL-1803-14F OL-1803-15F OL-1803-18F OL-1806-01F OL-1806-02F OL-1806-03F
6/19/2012 6/19/2012 6/19/2012 6/19/2012 6/21/2012 6/21/2012 6/21/2012
180-11715-1 180-11715-1 180-11715-1180-11715-1|H2G130406 180-11808-1 180-11808-1 180-11808-1
TISSUE TISSUE TISSUE TISSUE TISSUE TISSUE TISSUE
Regular sample Regular sample Regular sample Regular sample Regular sample Regular sample Regular sample
Tissue - fish Tissue - fish Tissue - fish Tissue - fish Tissue - fish Tissue - fish Tissue - fish
BB BB BB SMB SMB SMB SMB
M U F U F F F
292 mm 366 mm 312 mm 290 mm 370 mm 361 mm 407 mm
327 g 724 g 399 g 409 g 869 g 755 g 1022 g
4 yrs 7 yrs 4 yrs 3 yrs 5 yrs 5 yrs 7 yrs
1.3 0.58 2
0.3 0.27 0.43 0.53 0.62 J 0.52 J 1.1 J
1.4 JN 0.94 JN 4.3 JN
6.6 J 4.5 J 19 J
2.1 JN 1.3 JN 8.1 JN
3.7 1.2 J 3.6
12 U 12 U 12 U
12 U 12 U 12 U
12 U 12 U 12 U
12 U 12 U 12 U
120 67 320
12 U 12 U 12 U
88 58 230
12 U 12 U 12 U
12 U 12 U 12 U
210 130 550
5 U
5 U
5 U
5 U
0.2 J
5 U
3.6 J
5 U
5 U
0.5 J
0.17 J
5 U
0.58 J
1 U
0.82 J
10 U
10 UJ
P:\Honeywell -SYR\447479 - 2012 Remedial Goal Monitoring\09.0 Reports\9.2 Monitoring Summary - 2012\Appendix A - DUSR\Attach A-1 - Validated_OL_Fish_Tissue_Final.xlsx Page 7 of 11
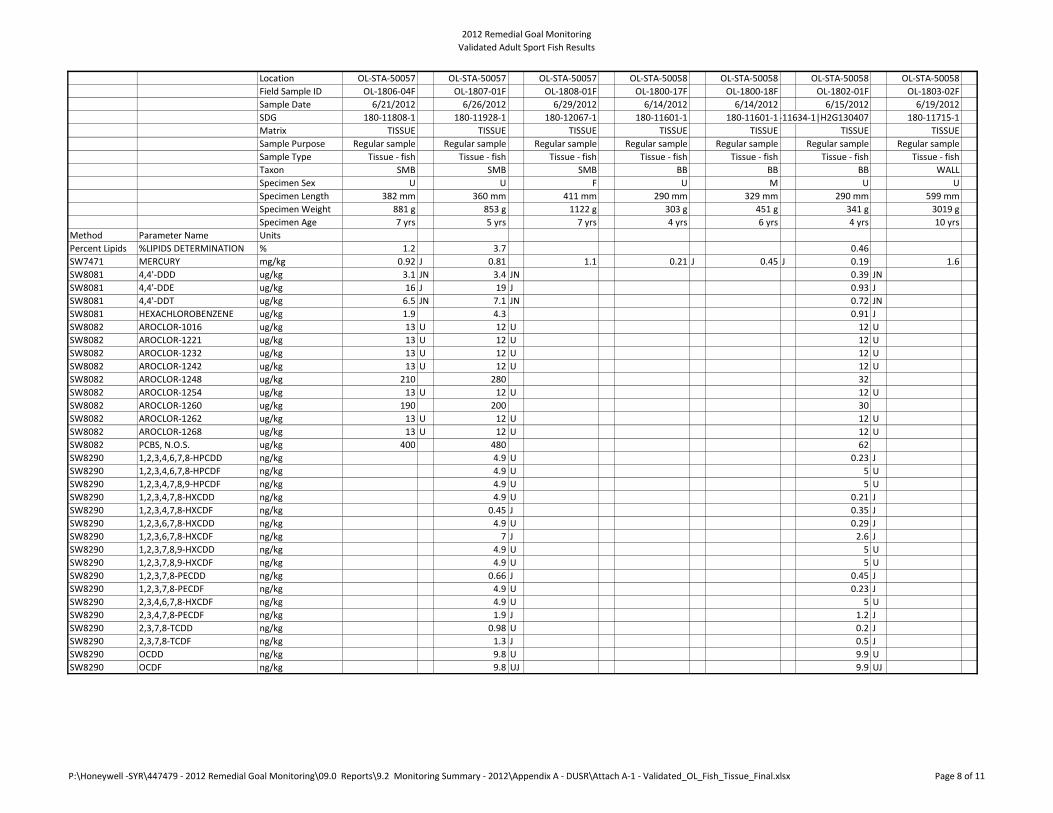
2012 Remedial Goal Monitoring
Validated Adult Sport Fish Results
Location
Field Sample ID
Sample Date
SDG
Matrix
Sample Purpose
Sample Type
Taxon
Specimen Sex
Specimen Length
Specimen Weight
Specimen Age
Method Parameter Name Units
Percent Lipids %LIPIDS DETERMINATION %
SW7471 MERCURY mg/kg
SW8081 4,4'-DDD ug/kg
SW8081 4,4'-DDE ug/kg
SW8081 4,4'-DDT ug/kg
SW8081 HEXACHLOROBENZENE ug/kg
SW8082 AROCLOR-1016 ug/kg
SW8082 AROCLOR-1221 ug/kg
SW8082 AROCLOR-1232 ug/kg
SW8082 AROCLOR-1242 ug/kg
SW8082 AROCLOR-1248 ug/kg
SW8082 AROCLOR-1254 ug/kg
SW8082 AROCLOR-1260 ug/kg
SW8082 AROCLOR-1262 ug/kg
SW8082 AROCLOR-1268 ug/kg
SW8082 PCBS, N.O.S. ug/kg
SW8290 1,2,3,4,6,7,8-HPCDD ng/kg
SW8290 1,2,3,4,6,7,8-HPCDF ng/kg
SW8290 1,2,3,4,7,8,9-HPCDF ng/kg
SW8290 1,2,3,4,7,8-HXCDD ng/kg
SW8290 1,2,3,4,7,8-HXCDF ng/kg
SW8290 1,2,3,6,7,8-HXCDD ng/kg
SW8290 1,2,3,6,7,8-HXCDF ng/kg
SW8290 1,2,3,7,8,9-HXCDD ng/kg
SW8290 1,2,3,7,8,9-HXCDF ng/kg
SW8290 1,2,3,7,8-PECDD ng/kg
SW8290 1,2,3,7,8-PECDF ng/kg
SW8290 2,3,4,6,7,8-HXCDF ng/kg
SW8290 2,3,4,7,8-PECDF ng/kg
SW8290 2,3,7,8-TCDD ng/kg
SW8290 2,3,7,8-TCDF ng/kg
SW8290 OCDD ng/kg
SW8290 OCDF ng/kg
OL-STA-50057 OL-STA-50057 OL-STA-50057 OL-STA-50058 OL-STA-50058 OL-STA-50058 OL-STA-50058
OL-1806-04F OL-1807-01F OL-1808-01F OL-1800-17F OL-1800-18F OL-1802-01F OL-1803-02F
6/21/2012 6/26/2012 6/29/2012 6/14/2012 6/14/2012 6/15/2012 6/19/2012
180-11808-1 180-11928-1 180-12067-1 180-11601-1 180-11601-1180-11634-1|H2G130407 180-11715-1
TISSUE TISSUE TISSUE TISSUE TISSUE TISSUE TISSUE
Regular sample Regular sample Regular sample Regular sample Regular sample Regular sample Regular sample
Tissue - fish Tissue - fish Tissue - fish Tissue - fish Tissue - fish Tissue - fish Tissue - fish
SMB SMB SMB BB BB BB WALL
U U F U M U U
382 mm 360 mm 411 mm 290 mm 329 mm 290 mm 599 mm
881 g 853 g 1122 g 303 g 451 g 341 g 3019 g
7 yrs 5 yrs 7 yrs 4 yrs 6 yrs 4 yrs 10 yrs
1.2 3.7 0.46
0.92 J 0.81 1.1 0.21 J 0.45 J 0.19 1.6
3.1 JN 3.4 JN 0.39 JN
16 J 19 J 0.93 J
6.5 JN 7.1 JN 0.72 JN
1.9 4.3 0.91 J
13 U 12 U 12 U
13 U 12 U 12 U
13 U 12 U 12 U
13 U 12 U 12 U
210 280 32
13 U 12 U 12 U
190 200 30
13 U 12 U 12 U
13 U 12 U 12 U
400 480 62
4.9 U 0.23 J
4.9 U 5 U
4.9 U 5 U
4.9 U 0.21 J
0.45 J 0.35 J
4.9 U 0.29 J
7 J 2.6 J
4.9 U 5 U
4.9 U 5 U
0.66 J 0.45 J
4.9 U 0.23 J
4.9 U 5 U
1.9 J 1.2 J
0.98 U 0.2 J
1.3 J 0.5 J
9.8 U 9.9 U
9.8 UJ 9.9 UJ
P:\Honeywell -SYR\447479 - 2012 Remedial Goal Monitoring\09.0 Reports\9.2 Monitoring Summary - 2012\Appendix A - DUSR\Attach A-1 - Validated_OL_Fish_Tissue_Final.xlsx Page 8 of 11
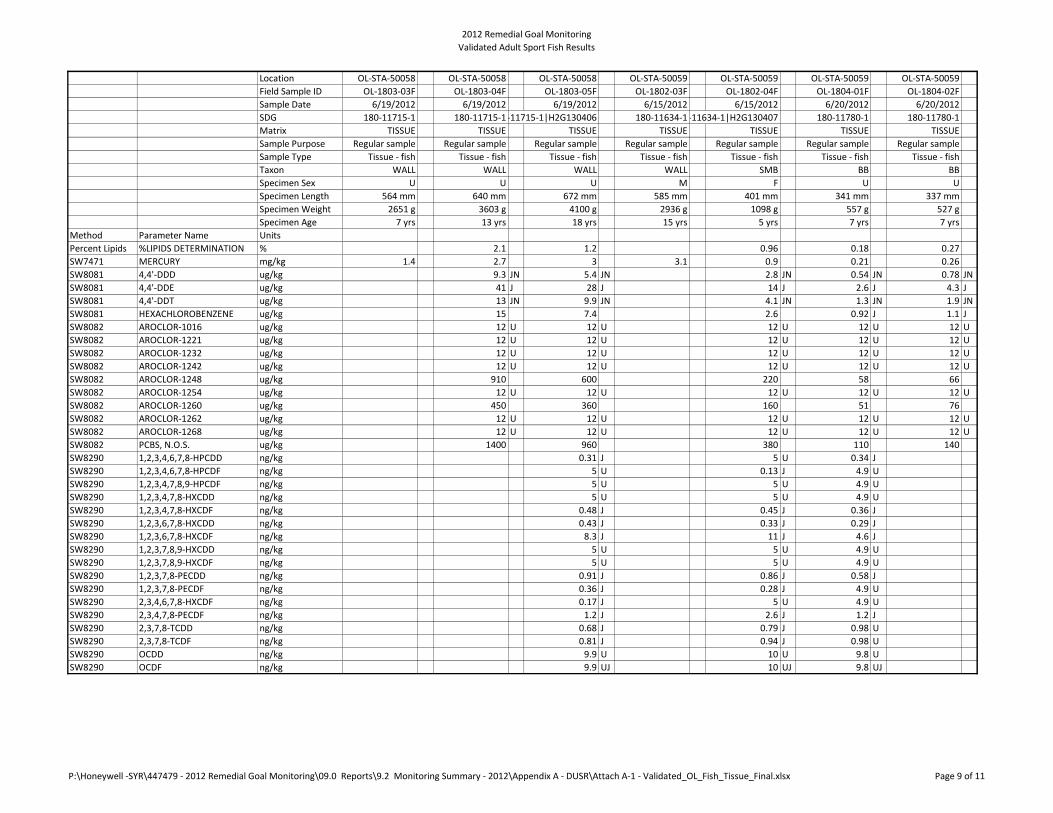
2012 Remedial Goal Monitoring
Validated Adult Sport Fish Results
Location
Field Sample ID
Sample Date
SDG
Matrix
Sample Purpose
Sample Type
Taxon
Specimen Sex
Specimen Length
Specimen Weight
Specimen Age
Method Parameter Name Units
Percent Lipids %LIPIDS DETERMINATION %
SW7471 MERCURY mg/kg
SW8081 4,4'-DDD ug/kg
SW8081 4,4'-DDE ug/kg
SW8081 4,4'-DDT ug/kg
SW8081 HEXACHLOROBENZENE ug/kg
SW8082 AROCLOR-1016 ug/kg
SW8082 AROCLOR-1221 ug/kg
SW8082 AROCLOR-1232 ug/kg
SW8082 AROCLOR-1242 ug/kg
SW8082 AROCLOR-1248 ug/kg
SW8082 AROCLOR-1254 ug/kg
SW8082 AROCLOR-1260 ug/kg
SW8082 AROCLOR-1262 ug/kg
SW8082 AROCLOR-1268 ug/kg
SW8082 PCBS, N.O.S. ug/kg
SW8290 1,2,3,4,6,7,8-HPCDD ng/kg
SW8290 1,2,3,4,6,7,8-HPCDF ng/kg
SW8290 1,2,3,4,7,8,9-HPCDF ng/kg
SW8290 1,2,3,4,7,8-HXCDD ng/kg
SW8290 1,2,3,4,7,8-HXCDF ng/kg
SW8290 1,2,3,6,7,8-HXCDD ng/kg
SW8290 1,2,3,6,7,8-HXCDF ng/kg
SW8290 1,2,3,7,8,9-HXCDD ng/kg
SW8290 1,2,3,7,8,9-HXCDF ng/kg
SW8290 1,2,3,7,8-PECDD ng/kg
SW8290 1,2,3,7,8-PECDF ng/kg
SW8290 2,3,4,6,7,8-HXCDF ng/kg
SW8290 2,3,4,7,8-PECDF ng/kg
SW8290 2,3,7,8-TCDD ng/kg
SW8290 2,3,7,8-TCDF ng/kg
SW8290 OCDD ng/kg
SW8290 OCDF ng/kg
OL-STA-50058 OL-STA-50058 OL-STA-50058 OL-STA-50059 OL-STA-50059 OL-STA-50059 OL-STA-50059
OL-1803-03F OL-1803-04F OL-1803-05F OL-1802-03F OL-1802-04F OL-1804-01F OL-1804-02F
6/19/2012 6/19/2012 6/19/2012 6/15/2012 6/15/2012 6/20/2012 6/20/2012
180-11715-1 180-11715-1180-11715-1|H2G130406 180-11634-1180-11634-1|H2G130407 180-11780-1 180-11780-1
TISSUE TISSUE TISSUE TISSUE TISSUE TISSUE TISSUE
Regular sample Regular sample Regular sample Regular sample Regular sample Regular sample Regular sample
Tissue - fish Tissue - fish Tissue - fish Tissue - fish Tissue - fish Tissue - fish Tissue - fish
WALL WALL WALL WALL SMB BB BB
U U U M F U U
564 mm 640 mm 672 mm 585 mm 401 mm 341 mm 337 mm
2651 g 3603 g 4100 g 2936 g 1098 g 557 g 527 g
7 yrs 13 yrs 18 yrs 15 yrs 5 yrs 7 yrs 7 yrs
2.1 1.2 0.96 0.18 0.27
1.4 2.7 3 3.1 0.9 0.21 0.26
9.3 JN 5.4 JN 2.8 JN 0.54 JN 0.78 JN
41 J 28 J 14 J 2.6 J 4.3 J
13 JN 9.9 JN 4.1 JN 1.3 JN 1.9 JN
15 7.4 2.6 0.92 J 1.1 J
12 U 12 U 12 U 12 U 12 U
12 U 12 U 12 U 12 U 12 U
12 U 12 U 12 U 12 U 12 U
12 U 12 U 12 U 12 U 12 U
910 600 220 58 66
12 U 12 U 12 U 12 U 12 U
450 360 160 51 76
12 U 12 U 12 U 12 U 12 U
12 U 12 U 12 U 12 U 12 U
1400 960 380 110 140
0.31 J 5 U 0.34 J
5 U 0.13 J 4.9 U
5 U 5 U 4.9 U
5 U 5 U 4.9 U
0.48 J 0.45 J 0.36 J
0.43 J 0.33 J 0.29 J
8.3 J 11 J 4.6 J
5 U 5 U 4.9 U
5 U 5 U 4.9 U
0.91 J 0.86 J 0.58 J
0.36 J 0.28 J 4.9 U
0.17 J 5 U 4.9 U
1.2 J 2.6 J 1.2 J
0.68 J 0.79 J 0.98 U
0.81 J 0.94 J 0.98 U
9.9 U 10 U 9.8 U
9.9 UJ 10 UJ 9.8 UJ
P:\Honeywell -SYR\447479 - 2012 Remedial Goal Monitoring\09.0 Reports\9.2 Monitoring Summary - 2012\Appendix A - DUSR\Attach A-1 - Validated_OL_Fish_Tissue_Final.xlsx Page 9 of 11
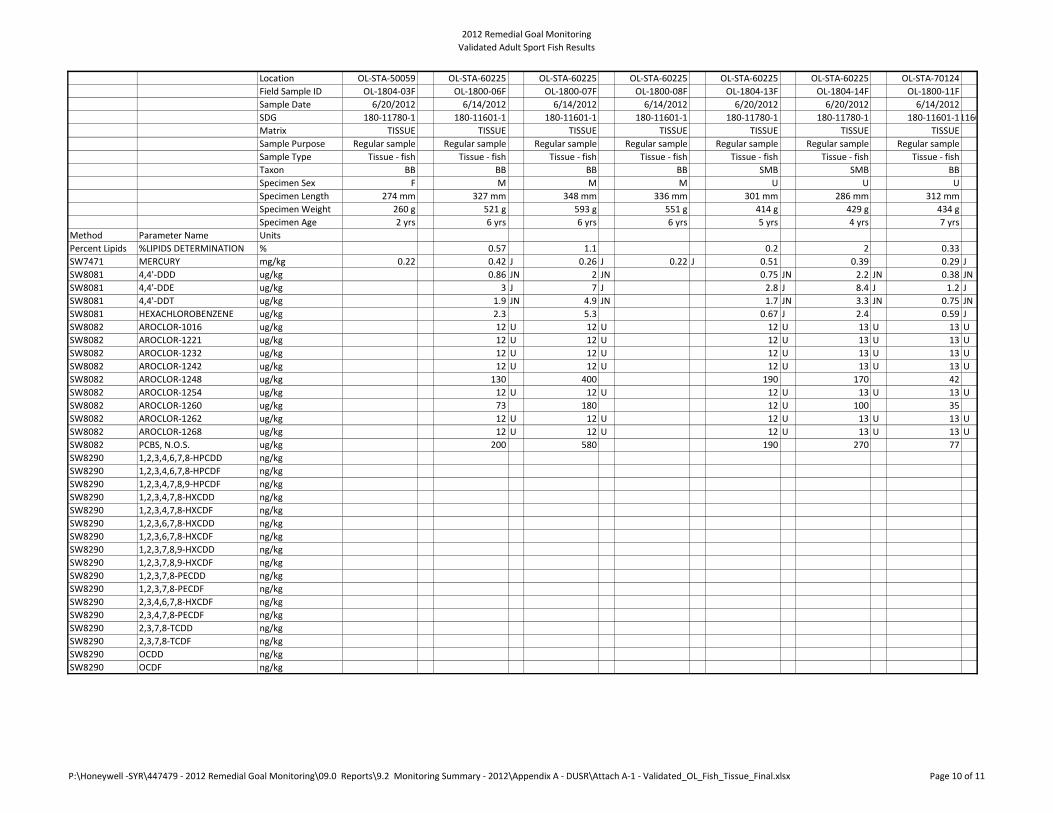
2012 Remedial Goal Monitoring
Validated Adult Sport Fish Results
Location
Field Sample ID
Sample Date
SDG
Matrix
Sample Purpose
Sample Type
Taxon
Specimen Sex
Specimen Length
Specimen Weight
Specimen Age
Method Parameter Name Units
Percent Lipids %LIPIDS DETERMINATION %
SW7471 MERCURY mg/kg
SW8081 4,4'-DDD ug/kg
SW8081 4,4'-DDE ug/kg
SW8081 4,4'-DDT ug/kg
SW8081 HEXACHLOROBENZENE ug/kg
SW8082 AROCLOR-1016 ug/kg
SW8082 AROCLOR-1221 ug/kg
SW8082 AROCLOR-1232 ug/kg
SW8082 AROCLOR-1242 ug/kg
SW8082 AROCLOR-1248 ug/kg
SW8082 AROCLOR-1254 ug/kg
SW8082 AROCLOR-1260 ug/kg
SW8082 AROCLOR-1262 ug/kg
SW8082 AROCLOR-1268 ug/kg
SW8082 PCBS, N.O.S. ug/kg
SW8290 1,2,3,4,6,7,8-HPCDD ng/kg
SW8290 1,2,3,4,6,7,8-HPCDF ng/kg
SW8290 1,2,3,4,7,8,9-HPCDF ng/kg
SW8290 1,2,3,4,7,8-HXCDD ng/kg
SW8290 1,2,3,4,7,8-HXCDF ng/kg
SW8290 1,2,3,6,7,8-HXCDD ng/kg
SW8290 1,2,3,6,7,8-HXCDF ng/kg
SW8290 1,2,3,7,8,9-HXCDD ng/kg
SW8290 1,2,3,7,8,9-HXCDF ng/kg
SW8290 1,2,3,7,8-PECDD ng/kg
SW8290 1,2,3,7,8-PECDF ng/kg
SW8290 2,3,4,6,7,8-HXCDF ng/kg
SW8290 2,3,4,7,8-PECDF ng/kg
SW8290 2,3,7,8-TCDD ng/kg
SW8290 2,3,7,8-TCDF ng/kg
SW8290 OCDD ng/kg
SW8290 OCDF ng/kg
OL-STA-50059 OL-STA-60225 OL-STA-60225 OL-STA-60225 OL-STA-60225 OL-STA-60225 OL-STA-70124
OL-1804-03F OL-1800-06F OL-1800-07F OL-1800-08F OL-1804-13F OL-1804-14F OL-1800-11F
6/20/2012 6/14/2012 6/14/2012 6/14/2012 6/20/2012 6/20/2012 6/14/2012
180-11780-1 180-11601-1 180-11601-1 180-11601-1 180-11780-1 180-11780-1 180-11601-1180-11601-1|180-11601-2
TISSUE TISSUE TISSUE TISSUE TISSUE TISSUE TISSUE
Regular sample Regular sample Regular sample Regular sample Regular sample Regular sample Regular sample
Tissue - fish Tissue - fish Tissue - fish Tissue - fish Tissue - fish Tissue - fish Tissue - fish
BB BB BB BB SMB SMB BB
F M M M U U U
274 mm 327 mm 348 mm 336 mm 301 mm 286 mm 312 mm
260 g 521 g 593 g 551 g 414 g 429 g 434 g
2 yrs 6 yrs 6 yrs 6 yrs 5 yrs 4 yrs 7 yrs
0.57 1.1 0.2 2 0.33
0.22 0.42 J 0.26 J 0.22 J 0.51 0.39 0.29 J
0.86 JN 2 JN 0.75 JN 2.2 JN 0.38 JN
3 J 7 J 2.8 J 8.4 J 1.2 J
1.9 JN 4.9 JN 1.7 JN 3.3 JN 0.75 JN
2.3 5.3 0.67 J 2.4 0.59 J
12 U 12 U 12 U 13 U 13 U
12 U 12 U 12 U 13 U 13 U
12 U 12 U 12 U 13 U 13 U
12 U 12 U 12 U 13 U 13 U
130 400 190 170 42
12 U 12 U 12 U 13 U 13 U
73 180 12 U 100 35
12 U 12 U 12 U 13 U 13 U
12 U 12 U 12 U 13 U 13 U
200 580 190 270 77
P:\Honeywell -SYR\447479 - 2012 Remedial Goal Monitoring\09.0 Reports\9.2 Monitoring Summary - 2012\Appendix A - DUSR\Attach A-1 - Validated_OL_Fish_Tissue_Final.xlsx Page 10 of 11
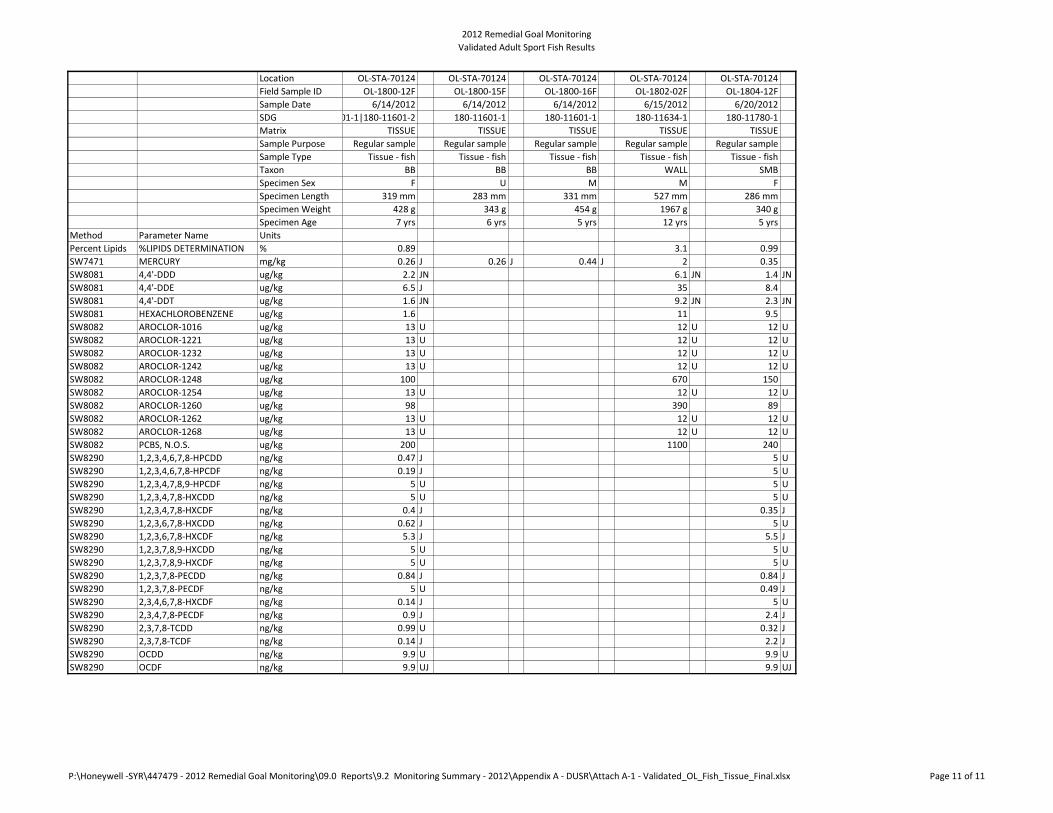
2012 Remedial Goal Monitoring
Validated Adult Sport Fish Results
Location
Field Sample ID
Sample Date
SDG
Matrix
Sample Purpose
Sample Type
Taxon
Specimen Sex
Specimen Length
Specimen Weight
Specimen Age
Method Parameter Name Units
Percent Lipids %LIPIDS DETERMINATION %
SW7471 MERCURY mg/kg
SW8081 4,4'-DDD ug/kg
SW8081 4,4'-DDE ug/kg
SW8081 4,4'-DDT ug/kg
SW8081 HEXACHLOROBENZENE ug/kg
SW8082 AROCLOR-1016 ug/kg
SW8082 AROCLOR-1221 ug/kg
SW8082 AROCLOR-1232 ug/kg
SW8082 AROCLOR-1242 ug/kg
SW8082 AROCLOR-1248 ug/kg
SW8082 AROCLOR-1254 ug/kg
SW8082 AROCLOR-1260 ug/kg
SW8082 AROCLOR-1262 ug/kg
SW8082 AROCLOR-1268 ug/kg
SW8082 PCBS, N.O.S. ug/kg
SW8290 1,2,3,4,6,7,8-HPCDD ng/kg
SW8290 1,2,3,4,6,7,8-HPCDF ng/kg
SW8290 1,2,3,4,7,8,9-HPCDF ng/kg
SW8290 1,2,3,4,7,8-HXCDD ng/kg
SW8290 1,2,3,4,7,8-HXCDF ng/kg
SW8290 1,2,3,6,7,8-HXCDD ng/kg
SW8290 1,2,3,6,7,8-HXCDF ng/kg
SW8290 1,2,3,7,8,9-HXCDD ng/kg
SW8290 1,2,3,7,8,9-HXCDF ng/kg
SW8290 1,2,3,7,8-PECDD ng/kg
SW8290 1,2,3,7,8-PECDF ng/kg
SW8290 2,3,4,6,7,8-HXCDF ng/kg
SW8290 2,3,4,7,8-PECDF ng/kg
SW8290 2,3,7,8-TCDD ng/kg
SW8290 2,3,7,8-TCDF ng/kg
SW8290 OCDD ng/kg
SW8290 OCDF ng/kg
OL-STA-70124 OL-STA-70124 OL-STA-70124 OL-STA-70124 OL-STA-70124
OL-1800-12F OL-1800-15F OL-1800-16F OL-1802-02F OL-1804-12F
6/14/2012 6/14/2012 6/14/2012 6/15/2012 6/20/2012
180-11601-1|180-11601-2 180-11601-1 180-11601-1 180-11634-1 180-11780-1
TISSUE TISSUE TISSUE TISSUE TISSUE
Regular sample Regular sample Regular sample Regular sample Regular sample
Tissue - fish Tissue - fish Tissue - fish Tissue - fish Tissue - fish
BB BB BB WALL SMB
F U M M F
319 mm 283 mm 331 mm 527 mm 286 mm
428 g 343 g 454 g 1967 g 340 g
7 yrs 6 yrs 5 yrs 12 yrs 5 yrs
0.89 3.1 0.99
0.26 J 0.26 J 0.44 J 2 0.35
2.2 JN 6.1 JN 1.4 JN
6.5 J 35 8.4
1.6 JN 9.2 JN 2.3 JN
1.6 11 9.5
13 U 12 U 12 U
13 U 12 U 12 U
13 U 12 U 12 U
13 U 12 U 12 U
100 670 150
13 U 12 U 12 U
98 390 89
13 U 12 U 12 U
13 U 12 U 12 U
200 1100 240
0.47 J 5 U
0.19 J 5 U
5 U 5 U
5 U 5 U
0.4 J 0.35 J
0.62 J 5 U
5.3 J 5.5 J
5 U 5 U
5 U 5 U
0.84 J 0.84 J
5 U 0.49 J
0.14 J 5 U
0.9 J 2.4 J
0.99 U 0.32 J
0.14 J 2.2 J
9.9 U 9.9 U
9.9 UJ 9.9 UJ
P:\Honeywell -SYR\447479 - 2012 Remedial Goal Monitoring\09.0 Reports\9.2 Monitoring Summary - 2012\Appendix A - DUSR\Attach A-1 - Validated_OL_Fish_Tissue_Final.xlsx Page 11 of 11
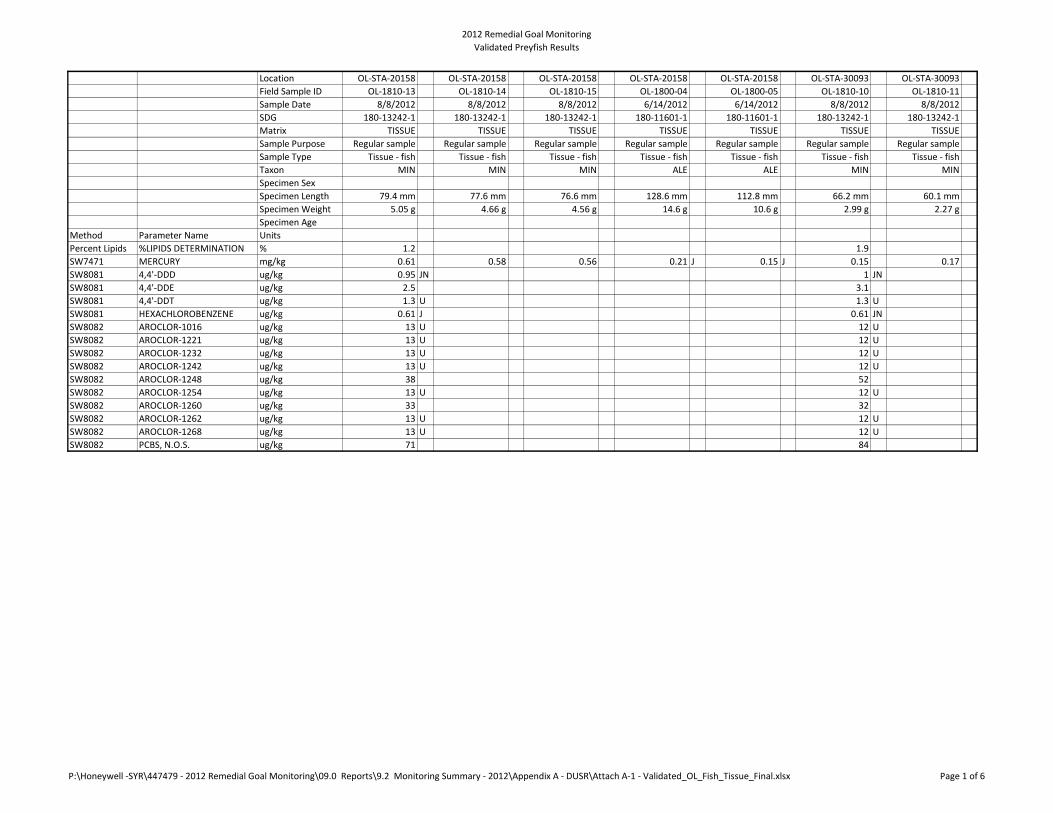
2012 Remedial Goal Monitoring
Validated Preyfish Results
Location OL-STA-20158 OL-STA-20158 OL-STA-20158 OL-STA-20158 OL-STA-20158 OL-STA-30093 OL-STA-30093
Field Sample ID OL-1810-13 OL-1810-14 OL-1810-15 OL-1800-04 OL-1800-05 OL-1810-10 OL-1810-11
Sample Date 8/8/2012 8/8/2012 8/8/2012 6/14/2012 6/14/2012 8/8/2012 8/8/2012
SDG 180-13242-1 180-13242-1 180-13242-1 180-11601-1 180-11601-1 180-13242-1 180-13242-1
Matrix TISSUE TISSUE TISSUE TISSUE TISSUE TISSUE TISSUE
Sample Purpose Regular sample Regular sample Regular sample Regular sample Regular sample Regular sample Regular sample
Sample Type Tissue - fish Tissue - fish Tissue - fish Tissue - fish Tissue - fish Tissue - fish Tissue - fish
Taxon MIN MIN MIN ALE ALE MIN MIN
Specimen Sex
Specimen Length 79.4 mm 77.6 mm 76.6 mm 128.6 mm 112.8 mm 66.2 mm 60.1 mm
Specimen Weight 5.05 g 4.66 g 4.56 g 14.6 g 10.6 g 2.99 g 2.27 g
Specimen Age
Method Parameter Name Units
Percent Lipids %LIPIDS DETERMINATION % 1.2 1.9
SW7471 MERCURY mg/kg 0.61 0.58 0.56 0.21 J 0.15 J 0.15 0.17
SW8081 4,4'-DDD ug/kg 0.95 JN 1 JN
SW8081 4,4'-DDE ug/kg 2.5 3.1
SW8081 4,4'-DDT ug/kg 1.3 U 1.3 U
SW8081 HEXACHLOROBENZENE ug/kg 0.61 J 0.61 JN
SW8082 AROCLOR-1016 ug/kg 13 U 12 U
SW8082 AROCLOR-1221 ug/kg 13 U 12 U
SW8082 AROCLOR-1232 ug/kg 13 U 12 U
SW8082 AROCLOR-1242 ug/kg 13 U 12 U
SW8082 AROCLOR-1248 ug/kg 38 52
SW8082 AROCLOR-1254 ug/kg 13 U 12 U
SW8082 AROCLOR-1260 ug/kg 33 32
SW8082 AROCLOR-1262 ug/kg 13 U 12 U
SW8082 AROCLOR-1268 ug/kg 13 U 12 U
SW8082 PCBS, N.O.S. ug/kg 71 84
P:\Honeywell -SYR\447479 - 2012 Remedial Goal Monitoring\09.0 Reports\9.2 Monitoring Summary - 2012\Appendix A - DUSR\Attach A-1 - Validated_OL_Fish_Tissue_Final.xlsx Page 1 of 6
2012 Remedial Goal Monitoring
Validated Preyfish Results
Location
Field Sample ID
Sample Date
SDG
Matrix
Sample Purpose
Sample Type
Taxon
Specimen Sex
Specimen Length
Specimen Weight
Specimen Age
Method Parameter Name Units
Percent Lipids %LIPIDS DETERMINATION %
SW7471 MERCURY mg/kg
SW8081 4,4'-DDD ug/kg
SW8081 4,4'-DDE ug/kg
SW8081 4,4'-DDT ug/kg
SW8081 HEXACHLOROBENZENE ug/kg
SW8082 AROCLOR-1016 ug/kg
SW8082 AROCLOR-1221 ug/kg
SW8082 AROCLOR-1232 ug/kg
SW8082 AROCLOR-1242 ug/kg
SW8082 AROCLOR-1248 ug/kg
SW8082 AROCLOR-1254 ug/kg
SW8082 AROCLOR-1260 ug/kg
SW8082 AROCLOR-1262 ug/kg
SW8082 AROCLOR-1268 ug/kg
SW8082 PCBS, N.O.S. ug/kg
OL-STA-30093 OL-STA-30093 OL-STA-30093 OL-STA-40212 OL-STA-40212 OL-STA-40212 OL-STA-40212
OL-1810-12 OL-1804-09 OL-1804-10 OL-1810-07 OL-1810-08 OL-1810-09 OL-1803-11
8/8/2012 6/20/2012 6/20/2012 8/8/2012 8/8/2012 8/8/2012 6/19/2012
180-13242-1 180-11780-1 180-11780-1 180-13242-1 180-13242-1 180-13242-1 180-11715-1
TISSUE TISSUE TISSUE TISSUE TISSUE TISSUE TISSUE
Regular sample Regular sample Regular sample Regular sample Regular sample Regular sample Regular sample
Tissue - fish Tissue - fish Tissue - fish Tissue - fish Tissue - fish Tissue - fish Tissue - fish
MIN ALE ALE MIN MIN MIN ALE
72.8 mm 130 mm 108.4 mm 90.6 mm 80.4 mm 81.6 mm 108.2 mm
3.78 g 16.4 g 10.6 g 8 g 5.66 g 5.64 g 11 g
1.3 5.2
0.21 0.21 0.13 0.47 0.26 0.32 0.072
0.94 J 5.8 JN
1.9 18
1.3 U 3.8 JN
1.3 J 10
12 U 13 U
12 U 13 U
12 U 13 U
12 U 13 U
14 450
12 U 13 U
12 150
12 U 13 U
12 U 13 U
26 600
P:\Honeywell -SYR\447479 - 2012 Remedial Goal Monitoring\09.0 Reports\9.2 Monitoring Summary - 2012\Appendix A - DUSR\Attach A-1 - Validated_OL_Fish_Tissue_Final.xlsx Page 2 of 6
2012 Remedial Goal Monitoring
Validated Preyfish Results
Location
Field Sample ID
Sample Date
SDG
Matrix
Sample Purpose
Sample Type
Taxon
Specimen Sex
Specimen Length
Specimen Weight
Specimen Age
Method Parameter Name Units
Percent Lipids %LIPIDS DETERMINATION %
SW7471 MERCURY mg/kg
SW8081 4,4'-DDD ug/kg
SW8081 4,4'-DDE ug/kg
SW8081 4,4'-DDT ug/kg
SW8081 HEXACHLOROBENZENE ug/kg
SW8082 AROCLOR-1016 ug/kg
SW8082 AROCLOR-1221 ug/kg
SW8082 AROCLOR-1232 ug/kg
SW8082 AROCLOR-1242 ug/kg
SW8082 AROCLOR-1248 ug/kg
SW8082 AROCLOR-1254 ug/kg
SW8082 AROCLOR-1260 ug/kg
SW8082 AROCLOR-1262 ug/kg
SW8082 AROCLOR-1268 ug/kg
SW8082 PCBS, N.O.S. ug/kg
OL-STA-40212 OL-STA-50057 OL-STA-50057 OL-STA-50057 OL-STA-50057 OL-STA-50057 OL-STA-50058
OL-1803-12 OL-1810-04 OL-1810-05 OL-1810-06 OL-1803-16 OL-1803-17 OL-1810-01
6/19/2012 8/8/2012 8/8/2012 8/8/2012 6/19/2012 6/19/2012 8/8/2012
180-11715-1 180-13242-1 180-13242-1 180-13242-1 180-11715-1 180-11715-1 180-13242-1
TISSUE TISSUE TISSUE TISSUE TISSUE TISSUE TISSUE
Regular sample Regular sample Regular sample Regular sample Regular sample Regular sample Regular sample
Tissue - fish Tissue - fish Tissue - fish Tissue - fish Tissue - fish Tissue - fish Tissue - fish
ALE MIN MIN MIN ALE ALE MIN
121.2 mm 70.8 mm 85.1 mm 90 mm 106.75 mm 126.4 mm 87 mm
13.6 g 4.24 g 6.37 g 7.76 g 10.5 g 14.4 g 8.26 g
1.1 1.2
0.17 0.096 0.11 0.16 0.094 0.17 0.21
0.89 JN 0.85 JN
1.8 1.7
3.2 J 1.3 U
1.3 U 1.3 U
12 U 13 U
12 U 13 U
12 U 13 U
12 U 13 U
20 17
12 U 13 U
15 16
12 U 13 U
12 U 13 U
35 33
P:\Honeywell -SYR\447479 - 2012 Remedial Goal Monitoring\09.0 Reports\9.2 Monitoring Summary - 2012\Appendix A - DUSR\Attach A-1 - Validated_OL_Fish_Tissue_Final.xlsx Page 3 of 6
2012 Remedial Goal Monitoring
Validated Preyfish Results
Location
Field Sample ID
Sample Date
SDG
Matrix
Sample Purpose
Sample Type
Taxon
Specimen Sex
Specimen Length
Specimen Weight
Specimen Age
Method Parameter Name Units
Percent Lipids %LIPIDS DETERMINATION %
SW7471 MERCURY mg/kg
SW8081 4,4'-DDD ug/kg
SW8081 4,4'-DDE ug/kg
SW8081 4,4'-DDT ug/kg
SW8081 HEXACHLOROBENZENE ug/kg
SW8082 AROCLOR-1016 ug/kg
SW8082 AROCLOR-1221 ug/kg
SW8082 AROCLOR-1232 ug/kg
SW8082 AROCLOR-1242 ug/kg
SW8082 AROCLOR-1248 ug/kg
SW8082 AROCLOR-1254 ug/kg
SW8082 AROCLOR-1260 ug/kg
SW8082 AROCLOR-1262 ug/kg
SW8082 AROCLOR-1268 ug/kg
SW8082 PCBS, N.O.S. ug/kg
OL-STA-50058 OL-STA-50058 OL-STA-50058 OL-STA-50058 OL-STA-50059 OL-STA-50059 OL-STA-50059
OL-1810-02 OL-1810-03 OL-1800-19 OL-1800-20 OL-1811-04 OL-1811-05 OL-1811-06
8/8/2012 8/8/2012 6/14/2012 6/14/2012 8/9/2012 8/9/2012 8/9/2012
180-13242-1 180-13242-1 180-11601-1 180-11601-1 180-13328-1 180-13328-1 180-13328-1
TISSUE TISSUE TISSUE TISSUE TISSUE TISSUE TISSUE
Regular sample Regular sample Regular sample Regular sample Regular sample Regular sample Regular sample
Tissue - fish Tissue - fish Tissue - fish Tissue - fish Tissue - fish Tissue - fish Tissue - fish
MIN MIN ALE ALE MIN BRSI BRSI
92 mm 86.8 mm 126.6 mm 113.2 mm 73.1 mm 52.5 mm 51.1 mm
9.54 g 7.28 g 16.8 g 12.4 g 4.69 g 0.72 g 0.67 g
1.9
0.29 0.18 0.17 J 0.13 J 0.14 0.16 0.13
1 JN
2.3
1.3 U
1.3 U
12 U
12 U
12 U
12 U
34
12 U
34
12 U
12 U
68
P:\Honeywell -SYR\447479 - 2012 Remedial Goal Monitoring\09.0 Reports\9.2 Monitoring Summary - 2012\Appendix A - DUSR\Attach A-1 - Validated_OL_Fish_Tissue_Final.xlsx Page 4 of 6
2012 Remedial Goal Monitoring
Validated Preyfish Results
Location
Field Sample ID
Sample Date
SDG
Matrix
Sample Purpose
Sample Type
Taxon
Specimen Sex
Specimen Length
Specimen Weight
Specimen Age
Method Parameter Name Units
Percent Lipids %LIPIDS DETERMINATION %
SW7471 MERCURY mg/kg
SW8081 4,4'-DDD ug/kg
SW8081 4,4'-DDE ug/kg
SW8081 4,4'-DDT ug/kg
SW8081 HEXACHLOROBENZENE ug/kg
SW8082 AROCLOR-1016 ug/kg
SW8082 AROCLOR-1221 ug/kg
SW8082 AROCLOR-1232 ug/kg
SW8082 AROCLOR-1242 ug/kg
SW8082 AROCLOR-1248 ug/kg
SW8082 AROCLOR-1254 ug/kg
SW8082 AROCLOR-1260 ug/kg
SW8082 AROCLOR-1262 ug/kg
SW8082 AROCLOR-1268 ug/kg
SW8082 PCBS, N.O.S. ug/kg
OL-STA-50059 OL-STA-50059 OL-STA-60225 OL-STA-60225 OL-STA-60225 OL-STA-60225 OL-STA-60225
OL-1804-04 OL-1804-05 OL-1811-01 OL-1811-02 OL-1811-03 OL-1800-09 OL-1800-10
6/20/2012 6/20/2012 8/9/2012 8/9/2012 8/9/2012 6/14/2012 6/14/2012
180-11780-1 180-11780-1 180-13328-1 180-13328-1 180-13328-1 180-11601-1 180-11601-1
TISSUE TISSUE TISSUE TISSUE TISSUE TISSUE TISSUE
Regular sample Regular sample Regular sample Regular sample Regular sample Regular sample Regular sample
Tissue - fish Tissue - fish Tissue - fish Tissue - fish Tissue - fish Tissue - fish Tissue - fish
ALE ALE MIN MIN BRSI ALE ALE
127.6 mm 110.8 mm 57.2 mm 75.9 mm 48.77 mm 101 mm 121 mm
15.2 g 12.4 g 2.1 g 5.26 g 0.65 g 8.4 g 13.6 g
0.79 1.4 2.4
0.2 0.097 0.037 0.086 0.046 0.082 J 0.15 J
1.1 JN 1.6 JN 4.1 JN
18 J 2.3 J 14
5.7 JN 15 3.7 JN
3.6 0.25 J 11
12 U 12 U 12 U
12 U 12 U 12 U
12 U 12 U 12 U
12 U 12 U 12 U
230 180 500
12 U 12 U 12 U
250 51 160
12 U 12 U 12 U
12 U 12 U 12 U
480 230 660
P:\Honeywell -SYR\447479 - 2012 Remedial Goal Monitoring\09.0 Reports\9.2 Monitoring Summary - 2012\Appendix A - DUSR\Attach A-1 - Validated_OL_Fish_Tissue_Final.xlsx Page 5 of 6
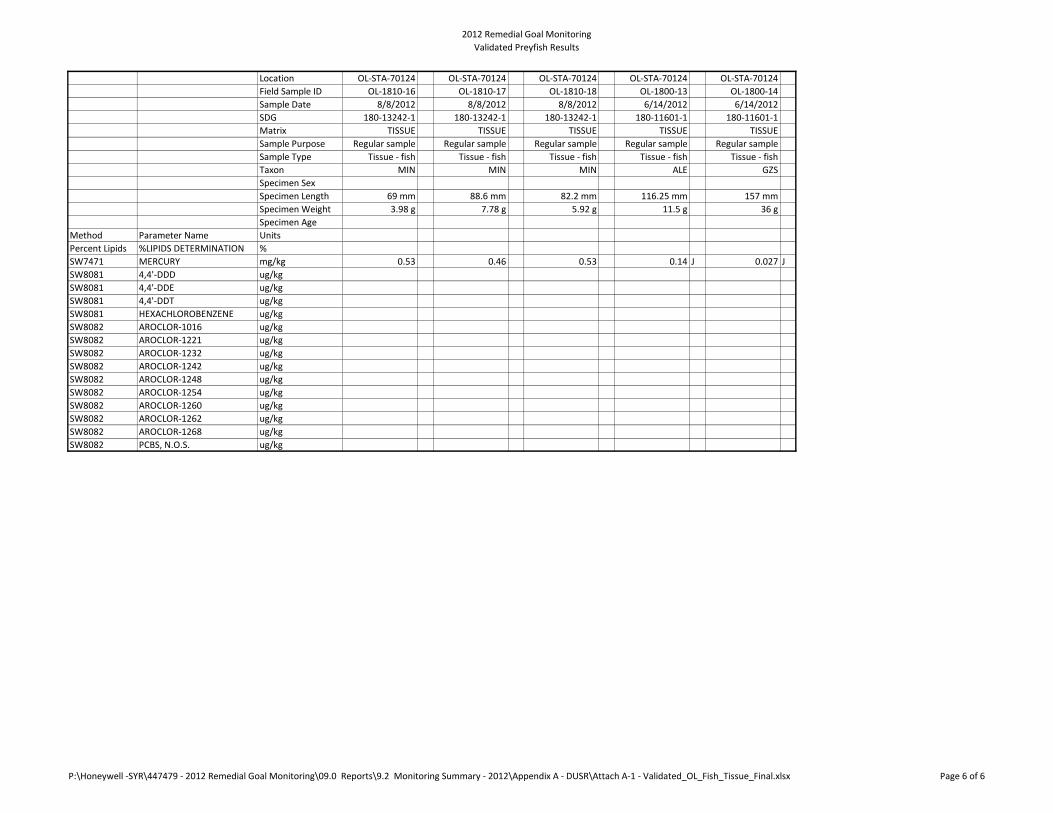
2012 Remedial Goal Monitoring
Validated Preyfish Results
Location
Field Sample ID
Sample Date
SDG
Matrix
Sample Purpose
Sample Type
Taxon
Specimen Sex
Specimen Length
Specimen Weight
Specimen Age
Method Parameter Name Units
Percent Lipids %LIPIDS DETERMINATION %
SW7471 MERCURY mg/kg
SW8081 4,4'-DDD ug/kg
SW8081 4,4'-DDE ug/kg
SW8081 4,4'-DDT ug/kg
SW8081 HEXACHLOROBENZENE ug/kg
SW8082 AROCLOR-1016 ug/kg
SW8082 AROCLOR-1221 ug/kg
SW8082 AROCLOR-1232 ug/kg
SW8082 AROCLOR-1242 ug/kg
SW8082 AROCLOR-1248 ug/kg
SW8082 AROCLOR-1254 ug/kg
SW8082 AROCLOR-1260 ug/kg
SW8082 AROCLOR-1262 ug/kg
SW8082 AROCLOR-1268 ug/kg
SW8082 PCBS, N.O.S. ug/kg
OL-STA-70124 OL-STA-70124 OL-STA-70124 OL-STA-70124 OL-STA-70124
OL-1810-16 OL-1810-17 OL-1810-18 OL-1800-13 OL-1800-14
8/8/2012 8/8/2012 8/8/2012 6/14/2012 6/14/2012
180-13242-1 180-13242-1 180-13242-1 180-11601-1 180-11601-1
TISSUE TISSUE TISSUE TISSUE TISSUE
Regular sample Regular sample Regular sample Regular sample Regular sample
Tissue - fish Tissue - fish Tissue - fish Tissue - fish Tissue - fish
MIN MIN MIN ALE GZS
69 mm 88.6 mm 82.2 mm 116.25 mm 157 mm
3.98 g 7.78 g 5.92 g 11.5 g 36 g
0.53 0.46 0.53 0.14 J 0.027 J
P:\Honeywell -SYR\447479 - 2012 Remedial Goal Monitoring\09.0 Reports\9.2 Monitoring Summary - 2012\Appendix A - DUSR\Attach A-1 - Validated_OL_Fish_Tissue_Final.xlsx Page 6 of 6
-
ONONDAGA LAKE 2012 TISSUE MONITORING
DATA USABILITY SUMMARY REPORT
PARSONS
P:\Honeywell -SYR\447479 - 2012 Remedial Goal Monitoring\09.0 Reports\9.2 Monitoring Summary - 2012\Appendix A - DUSR\OL 2012 Tissue Monitoring DUSR_Final.DOCX
ATTACHMENT A-2
VALIDATED LABORATORY DATA FOR ZOOPLANKTON SAMPLES
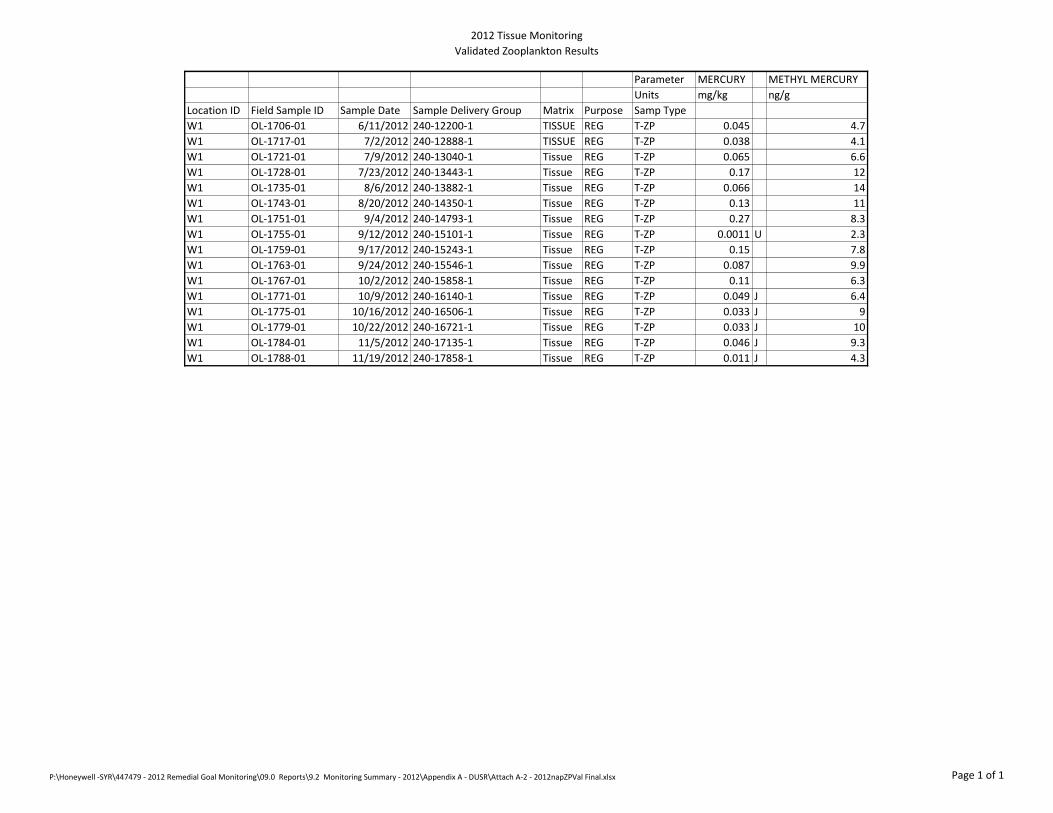
2012 Tissue Monitoring
Validated Zooplankton Results
Parameter MERCURY METHYL MERCURY
Units mg/kg ng/g
Location ID Field Sample ID Sample Date Sample Delivery Group Matrix Purpose Samp Type
W1 OL-1706-01 6/11/2012 240-12200-1 TISSUE REG T-ZP 0.045 4.7
W1 OL-1717-01 7/2/2012 240-12888-1 TISSUE REG T-ZP 0.038 4.1
W1 OL-1721-01 7/9/2012 240-13040-1 Tissue REG T-ZP 0.065 6.6
W1 OL-1728-01 7/23/2012 240-13443-1 Tissue REG T-ZP 0.17 12
W1 OL-1735-01 8/6/2012 240-13882-1 Tissue REG T-ZP 0.066 14
W1 OL-1743-01 8/20/2012 240-14350-1 Tissue REG T-ZP 0.13 11
W1 OL-1751-01 9/4/2012 240-14793-1 Tissue REG T-ZP 0.27 8.3
W1 OL-1755-01 9/12/2012 240-15101-1 Tissue REG T-ZP 0.0011 U 2.3
W1 OL-1759-01 9/17/2012 240-15243-1 Tissue REG T-ZP 0.15 7.8
W1 OL-1763-01 9/24/2012 240-15546-1 Tissue REG T-ZP 0.087 9.9
W1 OL-1767-01 10/2/2012 240-15858-1 Tissue REG T-ZP 0.11 6.3
W1 OL-1771-01 10/9/2012 240-16140-1 Tissue REG T-ZP 0.049 J 6.4
W1 OL-1775-01 10/16/2012 240-16506-1 Tissue REG T-ZP 0.033 J 9
W1 OL-1779-01 10/22/2012 240-16721-1 Tissue REG T-ZP 0.033 J 10
W1 OL-1784-01 11/5/2012 240-17135-1 Tissue REG T-ZP 0.046 J 9.3
W1 OL-1788-01 11/19/2012 240-17858-1 Tissue REG T-ZP 0.011 J 4.3
P:\Honeywell -SYR\447479 - 2012 Remedial Goal Monitoring\09.0 Reports\9.2 Monitoring Summary - 2012\Appendix A - DUSR\Attach A-2 - 2012napZPVal Final.xlsx Page 1 of 1