onlatent fingerprint image quality - michigan state …yoonsowo/publications/lfiq_iwcf12.pdfon...
TRANSCRIPT

On Latent Fingerprint Image Quality
Soweon Yoon, Eryun Liu, and Anil K. Jain
Department of Computer Science and Engineering,Michigan State University, East Lansing, MI, U.S.A.
{yoonsowo,liueryun,jain}@cse.msu.edu
Abstract. Latent fingerprints which are lifted from surfaces of objectsat crime scenes play a very important role in identifying suspects in thecrime scene investigations. Due to poor quality of latent fingerprints,automatic processing of latents can be extremely challenging. For thisreason, latent examiners need to be involved in latent identification. Toexpedite the latent identification and alleviate subjectivity and inconsis-tency in latent examiners’ feature markups and decisions, there is a needto develop latent fingerprint identification systems that can operate inthe “lights-out” mode. One of the most important steps in “lights-out”systems is to determine the quality of a given latent to predict the proba-bility that the latent can be identified in a fully automatic manner. In thispaper, we (i) propose a definition of latent value determination as a wayof establishing the quality of latents based on a specific matcher’s iden-tification performance, (ii) define a set of features based on ridge clarityand minutiae and evaluate them based on their capability to determineif a latent is of value for individualization or not, and (iii) propose alatent fingerprint image quality (LFIQ) that can be useful to reject thelatents which cannot be successfully identified in the “lights-out” mode.Experimental results show that the most salient latent features includethe average ridge clarity and the number of minutiae. The proposed la-tent quality measure improves the rank-100 identification rate from 69%to 86% by rejecting 50% of latents deemed as poor quality. In addition,the rank-100 identification is 80% when rejecting 80% of the latents inthe databases assessed as ‘NFIQ = 5’; however, the same identificationrate can be achieved by rejecting only 21% of the latents with low LFIQ.
Keywords: Latent fingerprints, “lights-out” latent identification, latentvalue determination, latent fingerprint image quality (LFIQ)
1 Introduction
Fingerprints have been widely used for reliable human identification in forensicsand law enforcement applications for over a century. Law enforcement agenciesroutinely collect tenprint records of all apprehended criminals in two forms: rolledand plain (or slap). Rolled fingerprints are obtained by rolling a finger from nailto nail to capture the complete ridge details on a finger while plain fingerprintsare captured by pressing down a finger on the flat surface of a fingerprint card

2 Soweon Yoon, Eryun Liu, and Anil K. Jain
ComparisonAnalysis
Value
ComparisonAnalysis
Candidate Pairs
Value
Determination
Feature
MarkupMarkup
Level-1 feature similari
Level-2 feature similari
Level-3 feature similari
AFIS
Level-3 feature similari
Similarity analysis
Dissimilarity analysis
omparison Evaluation Verificationomparison Evaluation Verification
Analysisidate Pairs
IndividualizationAnalysis
Exclusion
Comparison
ture similarity
ture similarity
ture similarity
Evaluation
Inconclusive
ture similarity
ty analysis Confirm or reject
the conclusion
Fig. 1. ACE-V methodology in latent identification.
or a live-scan sensor [1]. Both rolled and plain fingerprints, collectively calledreference (exemplar) fingerprints, are believed to contain sufficient ridge detailsfor individualization. To ensure good quality of fingerprint images, referencefingerprints are acquired under the supervision of a human operator; this way,fingerprints can be recaptured in case of poor quality impressions.
Automated Fingerprint Identification Systems (AFIS) are used by almost ev-ery major law enforcement agency worldwide to facilitate tenprint search; rolledor plain fingerprints are submitted as a query to an AFIS to search large-scalereference fingerprint databases. The FBI’s Integrated AFIS (IAFIS) receives tensof thousands of requests everyday to search a reference database containing ten-print cards of over 72 million criminals and 34 million civilian job applicants [2].The matching accuracy of tenprint search has already reached an impressivelevel; the 2003 Fingerprint Vendor Technology Evaluation (FpVTE) [3] reportedthat the best performing commercial matcher achieved 99.4% true accept rateat 0.01% false accept rate in searching plain fingerprints against a referencedatabase with 10,000 plain fingerprints.
Another type of important fingerprint identification involves searching latent
fingerprints against reference fingerprint databases. Latent fingerprints (or sim-ply latents) refer to the fingerprints captured at crime scenes, and are regardedas an extremely important source of evidence in crime scene investigations toidentify suspects. Unlike rolled or plain fingerprints, latents are often of poorquality; latent impressions typically contain partial ridge patterns of a finger,incomplete or missing ridge structures, mixture of ridge pattern and complexbackground noise or friction ridge structures from other fingers. Due to lowquality of latent fingerprints, human intervention is inevitable in latent search,especially for feature markup (i.e., manually marking region of interest, minu-tiae, core, delta, and extended features). In matching latents to reference prints,latent fingerprint examiners are expected to follow a methodology, called Anal-ysis, Comparison, Evaluation and Verification (ACE-V) [4]. Fig. 1 illustratesthe ACE-V methodology. In the analysis phase, an examiner evaluates the ridgeinformation contained in latent images. If the latent is determined to containsufficient information for identification or exclusion (called “of value” latent),

On Latent Fingerprint Image Quality 3
the features in the latent are manually marked by the examiner to search forits mate using an AFIS. In the comparison phase, the examiner compares the“of value” latent with the candidate mates retrieved from the reference databaseside-by-side and ascertains the similarity between the latent and mated referenceprint pairs using feature markup in the latent. In the evaluation phase, one ofthe following decisions is made about the latent in question: individualization,exclusion or inconclusive1. Finally, in the verification phase, the decision madeby the first examiner is confirmed by having a second examiner analyze theresults independently.
Although the ACE-V methodology is widely accepted by forensic commu-nity for latent print examination, the influence of human factors in the ACE-Vprocedure has raised concerns about their reliability and consistency. A notewor-thy case is the erroneous identification of Brandon Mayfield as a suspect in theMadrid train bombing incident based on an incorrect match between Mayfield’sreference fingerprint and the latent print captured at the bombing site [6, 7].The National Research Council’s report on limitations and recommendations offorensic science [8] pointed out two major shortcomings in the current forensicscience discipline: (i) “lack of mandatory and enforceable standards” that can beglobally referred to in crime labs and (ii) “unacceptable case backlogs in stateand local crime labs which likely make it difficult for laboratories to providestrong evidence for prosecutions and avoid errors that could lead to imperfectjustice”. Along with the efforts to understand the human factors in latent finger-print examination [9], standards and guidelines for latent examiners’ practiceshave also been set up. As an example, the Science Working Group on FrictionRidge Analysis, Study and Technology (SWGFAST) published standards whichdefine terminologies and establish the sufficiency level for decisions at each stepof the ACE-V methodology to alleviate subjectivity involved in feature markupsand decision makings among examiners [5].
Based on the guidelines in SWGFAST standard, latent examiners’ practiceshave been evaluated from various aspects (e.g., reliability of decisions, degreeof consensus and consistency of decisions) [10, 11, 12], mainly on two criticaldecisions that the examiners make in ACE-V methodology: (i) latent value de-termination in the analysis phase and (ii) latent individualization conclusionin the evaluation phase. Latent value determination assigns one of the follow-ing labels to each latent: value for individualization (VID), value for exclusiononly (VEO), and no value (NV). Only VID and VEO latents are further consid-ered for comparison. However, recent studies on the consensus and consistencyof latent examiners’ value determination indicate that a significant amount of
1 Individualization is the decision that a latent examiner makes on a pair of latent anda reference print indicating that the pair originates from the same finger based on asufficient agreement between the two ridge patterns. Exclusion, on the other hand,is the decision where an examiner concludes that the pair did not originate from thesame finger based on a sufficient disagreement between the two ridge patterns. Aninconclusive decision is made when an examiner cannot make a decision of eitherindividualization or exclusion due to insufficient ridge details or small correspondingarea between latent and reference print [5].

4 Soweon Yoon, Eryun Liu, and Anil K. Jain
(a) (b) (c) (d)
Fig. 2. Latents that are assessed as either VEO or NV, but the mated rolled printsare retrieved at rank-1 by AFIS. (a) NIST SD27 (U237): VEO (minutiae from AFIS)and (b) WVU (W514F02C N): VEO (minutiae from AFIS), (c) NIST SD27 (U254):NV (minutiae marked by an examiner), and (d) WVU (W605F01C I): VEO (minutiaemarked by an examiner).
subjectivity and variation exists in latent value determination. In [11], the con-sensus of the latent examiners’ value determinations was evaluated; among the356 latents which were reviewed by the examiners (each latent was reviewedby 23 examiners, on average), unanimous decisions (either VID or not-VID)were made only for about 43% of the latents. In terms of consistency, Uleryet al. [12] found that 85% of NV decisions and 93% of VID decisions were re-peated by the same examiner after a time gap while only 55% of VEO decisionswere repeated. More importantly, an examiner’s value determination is not al-ways reliable; the ELFT-EFS (Evaluation of Latent Fingerprint Technologies:Extended Feature Sets) report [13] emphasizes that a significant portion of thelatents assessed as being of VEO or NV can still be successfully identified byAFIS. Fig. 2 shows examples of latents in the NIST SD27 database [14] and theWVU latent database [15] that were assessed as either VEO or NV by latentexaminers, but whose mated reference prints were correctly retrieved at the toprank by an AFIS.
One of the most desirable properties of a latent fingerprint identification sys-tem is its ability to process latents in a “lights-out” identification mode withhigh accuracy. A “lights-out” fingerprint identification system refers to a systemthat requires only fingerprint images as input (query) and returns a short listof reference prints as potential mates [16]. The advantages of “lights-out” latentidentification mode include: (i) avoiding subjectivity in latent print examinationand (ii) increasing throughput of latent print matching, given the growing work-load on latent examiners. While state-of-the-art latent fingerprint identificationsystems have already shown excellent performance in matching latents to refer-ence databases2 [13,17], more research efforts are needed to continue to improvethis performance.
2 The best performing matcher for latent search in the ELFT-EFS achieved 63.4%rank-1 identification rate in the “lights-out” identification mode [13].
On Latent Fingerprint Image Quality 5
The first and the most significant step in achieving “lights-out” latent iden-tification capability is the quality assessment of latents to (i) determine whetheror not they have sufficient fingerprint ridge structure for either automatic featureextraction or manual feature markup and (ii) predict the reliability of latent toreference print matching with the given feature set. Although, in principle, theobjectives of latent quality assessment are the same as those of tenprint or refer-ence print quality assessment, defining a latent fingerprint image quality (LFIQ)measure is lot more difficult. Further, while the tenprint quality measures aremainly used to determine if they need to be recaptured, the main purpose ofdefining a latent quality measure is to expedite latent print examination byidentifying ‘good’ quality latents which can be processed in “lights-out” mode.An appropriate latent quality measure will also help avoid potential erroneoussubjective decisions regarding latent value.
Latent fingerprint quality can be assessed as latent value determination, andthe latent value can be determined by two different ways: (i) latent examiners and(ii) AFIS. Latent value determination by examiners simply refers to the currentpractice of assigning one of the following values (i.e., VID, VEO and NV) to a la-tent by an examiner. However, as mentioned before, the latent values determinedby examiners are not always correlated to the latent identification performance.Considering that one of the major goals of defining latent quality measure isto predict latent matching performance (assuming that the mated print in thereference database is of fairly good quality), we define a value determination byAFIS, following the comparison protocol in the ACE-V methodology: a latentfingerprint is declared to be VID in value determination by an AFIS if its matedprint in the reference database is retrieved within the top rank-100; otherwise,the latent is declared as not-VID in value determination by the AFIS.
One of the challenges in defining a value determination by AFIS is to findsalient features in latents which are directly related to the latent identificationperformance. Features that can be used in estimating latent fingerprint qualityare generally comprised of (i) quality for value and (ii) quality for identification.Quality for value (often referred to as qualitative quality [10, 18]) measures thesufficiency of Level-1 features such as fingerprint ridge clarity, pattern class, sizeof region of interest, fingerprint position (e.g., center, side, or tip of a finger), anddetermines the utility of the latent for either exclusion or identification. Qualityfor identification (often referred to as quantitative quality [10,18]) measures thesufficiency of Level-2 (i.e., minutiae) and Level-3 (e.g., pores) features whichare directly used in fingerprint identification, and determines the reliability ofmatching results by an AFIS in the “lights-out” mode.
Another important consideration in defining a latent quality measure iswhether it should depend on a specific AFIS. The issue of interoperability ofAFIS in latent search is well known [19]. Given that the matching results ofAFIS from different vendors on a given latent print can be significantly differentas revealed in ELFT-EFS [13], we believe that a latent fingerprint quality mea-sure should be designed for a specific AFIS. We call this a matcher-dependentlatent quality measure.

6 Soweon Yoon, Eryun Liu, and Anil K. Jain
In this paper, we report results of our preliminary study on defining LFIQ.First, we investigate a set of Level-1 features for qualitative quality and Level-2 features for quantitative quality that can be effectively used to define latentfingerprint image quality. The features are evaluated by constructing a 2-classclassifier to determine whether a latent is VID or not-VID. The class labels (VIDand not-VID) are determined either by latent examiners or an AFIS; this way,two different classifiers – one for value determination by examiners and the otherfor value determination by an AFIS – are obtained. Based on the observationsfrom latent value estimation, we define a latent quality measure by combininga qualitative quality feature (i.e., the average ridge clarity) and a quantitativequality feature (i.e., the number of minutiae) to estimate the objective targetquality: the probability that the mated reference print of a latent will be retrievedwithin the top rank-100.
2 Latent Fingerprint Image Quality (LFIQ)
To find the most significant features to represent latent fingerprint quality, alatent quality assessment is viewed as a 2-class classification problem: ωV ID ver-sus ωV ID, where ωV ID represents the class of VID latents and ωV ID representsthe class of not-VID latents. Feature vectors with different composition of ridgeclarity features and minutiae features are evaluated in terms of the resultingclassification accuracy. Based on the empirical results, a latent quality measureis defined by combining the two most significant features: average ridge clarityin the convex hull enclosing all the minutiae and the number of minutiae.
2.1 Ridge Clarity Feature
Given a latent fingerprint image I, the quality of its local ridge structure ismeasured by the ridge strength in a local block and the ridge continuity in theblock’s neighborhood. The computation of local ridge clarity map, RC, involvesthe following steps:
1. Preprocessing: The contrast-enhanced latent image, I∗, is obtained by [20]:
I∗ = sign(I − I)× log(1 + |I − I|), (1)
where I is the smoothed version of I by applying a 15× 15 averaging filter,and sign(x)= 1 if x > 0, otherwise sign(x)= −1.
2. Fourier analysis: The contrast-enhanced image I∗ is divided into 16×16 pixelblocks. The 64× 64 subimage, I∗mn(x, y), is constructed by taking a 32× 32subimage of I∗ around the center of the block at [m,n] and padding with0’s to get high frequency resolution in the Fourier domain. The subimage istransformed into the Fourier domain, Fmn(u, v). The top two local amplitudemaxima within the frequency range of
[116 ,
15
]are selected [21]. Let (u1, v1)
and (u2, v2) be the locations of the first and the second amplitude maxima in

On Latent Fingerprint Image Quality 7
Fmn(u, v). Then, a 2-dimensional sine wave corresponding to the i-th localmaximum of the block at [m,n] can be written as:
w(i)mn(x, y) = a(i)mn sin(2πf
(i)mn(cos(θ
(i)mn)x+ sin(θ(i)mn)y) + φ(i)
mn), i = 1, 2, (2)
where
a(i)mn = |F (ui, vi)|, f (i)mn =
√u2i + v2i64
θ(i)mn = arctan
(ui
vi
), and φ(i)
mn = arctan
[Im(F (ui, vi))
Re(F (ui, vi))
],
a(i)mn, f
(i)mn, θ
(i)mn, and φ
(i)mn represent the amplitude, frequency, direction, and
phase, respectively.
3. Ridge continuity map: The 2-dimensional sine waves, w1 and w2, in twoadjacent blocks are continuous if they satisfy the following conditions [21]:
min{|θ1, θ2|, π − |θ1, θ2|} ≤ Tθ,∣∣∣∣1
f1−
1
f2
∣∣∣∣ ≤ Tf , and
1
16
∑
(x,y)∈L
∣∣∣∣w1(x, y)
a1−
w2(x, y)
a2
∣∣∣∣ ≤ Tp, (3)
where L denotes the 16 pixels on the border of the two adjacent blocks, andthe three thresholds, Tθ, Tf , and Tp, are set to π
10 , 3, and 0.6, respectively.Define an indicator function, Ic(w1, w2), as follows:
Ic(w1, w2) =
{1, if w1 and w2 are continuous,
0, otherwise.(4)
Ridge continuity map is defined by:
RC[m,n] =∑
[m∗,n∗]∈N
max{Ic(w(1)mn, w
(1)m∗n∗), Ic(w
(1)mn, w
(2)m∗n∗)}, (5)
where N is the 8-neighborhood blocks of the block [m,n].
4. Ridge clarity map: The ridge clarity of block at [m,n] is defined by:
RC[m,n] = a(1)mn · RC[m,n]. (6)
Fig. 3 shows the ridge clarity maps and the intermediate steps for two differ-ent latents. Well-defined ridge structures present in a latent correspond to thehigh ridge clarity regions in the RC map.
8 Soweon Yoon, Eryun Liu, and Anil K. Jain
(a) (b) (c) (d)
(e) (f) (g) (h)
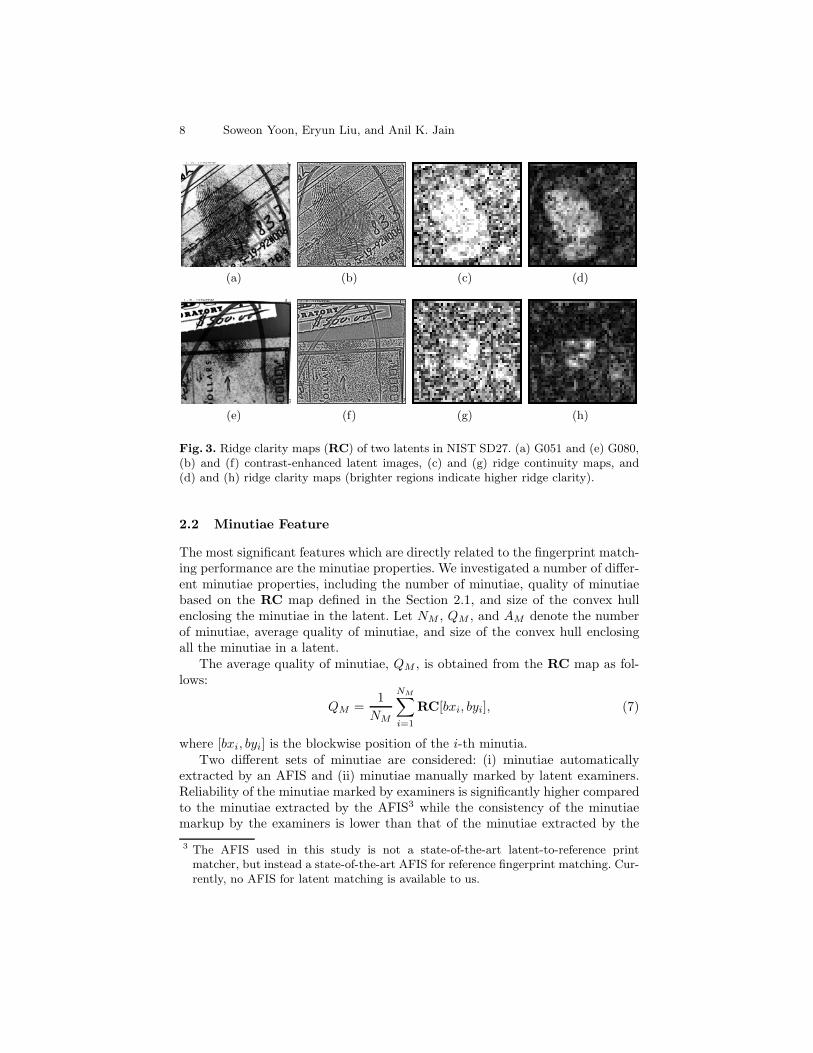
Fig. 3. Ridge clarity maps (RC) of two latents in NIST SD27. (a) G051 and (e) G080,(b) and (f) contrast-enhanced latent images, (c) and (g) ridge continuity maps, and(d) and (h) ridge clarity maps (brighter regions indicate higher ridge clarity).
2.2 Minutiae Feature
The most significant features which are directly related to the fingerprint match-ing performance are the minutiae properties. We investigated a number of differ-ent minutiae properties, including the number of minutiae, quality of minutiaebased on the RC map defined in the Section 2.1, and size of the convex hullenclosing the minutiae in the latent. Let NM , QM , and AM denote the numberof minutiae, average quality of minutiae, and size of the convex hull enclosingall the minutiae in a latent.
The average quality of minutiae, QM , is obtained from the RC map as fol-lows:
QM =1
NM
NM∑
i=1
RC[bxi, byi], (7)
where [bxi, byi] is the blockwise position of the i-th minutia.Two different sets of minutiae are considered: (i) minutiae automatically
extracted by an AFIS and (ii) minutiae manually marked by latent examiners.Reliability of the minutiae marked by examiners is significantly higher comparedto the minutiae extracted by the AFIS3 while the consistency of the minutiaemarkup by the examiners is lower than that of the minutiae extracted by the
3 The AFIS used in this study is not a state-of-the-art latent-to-reference printmatcher, but instead a state-of-the-art AFIS for reference fingerprint matching. Cur-rently, no AFIS for latent matching is available to us.

On Latent Fingerprint Image Quality 9
(a) (b) (c) (d)
Fig. 4. Minutiae in two latents shown in Fig. 3. (a) Minutiae extracted by an AFIS forthe latent in Fig. 3a, (b) minutiae marked by an examiner for the latent in Fig. 3a, (c)minutiae extracted by the AFIS for the latent in Fig. 3e, and (b) minutiae marked byan examiner for the latent in Fig. 3e.
AFIS. Fig. 4 shows the two minutiae sets – minutiae extracted by the AFISand minutiae marked by examiner – of the two latents in Fig. 3 along with theconvex hulls enclosing the minutiae.
2.3 Latent Fingerprint Quality Assessment
To establish the most discriminant features to define latent fingerprint quality,the latent quality assessment is formulated as a 2-class classification problem forωV ID and ωV ID. To build the “best” performing matcher for latents4, we fuse astate-of-the-art AFIS for tenprint with the latent fingerprint matcher developedin [22] as follows. The match score of a latent i and a reference print j is obtainedby [23]:
sij = rsAij
1NR
∑NR
k=1 sAik
+ (1− r)sBij
1NR
∑NR
k=1 sBik
, 0 ≤ r ≤ 1, (8)
where sAij and sBij are the match scores of a latent i and a reference print j frommatcher A and B, respectively, NR is the size of the reference database, and r isa weight which is empirically chosen to obtain the best rank-100 identificationaccuracy.
We evaluated feature vectors consisting of different combinations of ridgeclarity and minutiae features. The following two feature vectors were observedto be the most discriminative:
x1 = (NM ),
x2 = (QR, NM , QM , AM ),
4 Based on the latent matching performance evaluation with the fingerprint matchersavailable to us, the fusion of the two matchers described in this paper showed thebest performance to simulate the performance of a state-of-the-art AFIS for latents.

10 Soweon Yoon, Eryun Liu, and Anil K. Jain
where QR is the average ridge clarity in the convex hull of the minutiae in alatent and defined as:
QR =1
|C|
∑
[m,n]∈C
RC[m,n], (9)
where C is the set of blocks that belong to the convex hull enclosing the minutiaeand |C| is the number of blocks in the convex hull. Note that each componentof the feature vector is normalized by its minimum and maximum values. Adecision tree classifier [24] is used to determine whether a latent belongs toωV ID or ωV ID.
Based on the above observations, a latent fingerprint image quality measure,LFIQ, is defined as:
LFIQ = QR ·NM , (10)
where QR is the average ridge clarity and NM is the number of minutiae.
3 Experimental Results
3.1 Databases
The latent quality measure was evaluated on two latent fingerprint databases:NIST SD27 [14] and WVU latent database [15]. NIST SD27, the only public-domain latent database, contains 258 latents obtained from operational case-work. Although all the latents in this database are labeled as belonging to oneof three quality levels (‘Good’, ‘Bad’, and ‘Ugly’), we follow a formal definitionof value determination by latent examiners (i.e., VID, VEO, and NV) which wasreported in [10]. The numbers of VID, VEO, and NV latents in NIST SD27 are210, 41, and 7, respectively.
The WVU database contains 449 latents collected in a laboratory environ-ment. These latents come with value determination and feature markups. Thenumbers of VID, VEO, and NV latents in the WVU database are 370, 74, and5, respectively.
As a reference database, the mated rolled fingerprints of the 707 latents(258 from NIST SD27 and 449 from WVU database) are combined with 4,291additional rolled prints from the WVU database and 27,000 rolled prints of thefirst impressions in NIST SD14 [25]. In total, the size of the reference databaseis 31,998.
3.2 Classification Accuracy of Latent Value Determination
The performance of the classifiers using feature vectors, x1 and x2 defined inSection 2.3, to determine whether a given latent is VID or not-VID was evalu-ated. Two different sources of minutiae set are used to construct feature vectors:(i) minutiae extracted by an AFIS and (ii) minutiae marked by examiners. A 10-fold cross validation is conducted for evaluation: two latent databases are evenlypartitioned into 10 sets, and one set from each database is selected at random

On Latent Fingerprint Image Quality 11
Table 1. Confusion matrix of ωV ID versus ωV ID
classification from value determi-nation by examiners. ωV ID and ω
V IDare the predicted class labels. Feature vectors
are defined based on (a) minutiae extracted by AFIS and (b) minutiae marked byexaminers.
(a)
Feature x1 x2
ωV ID ωV ID
ωV ID ωV ID
ωV ID 565 14 496 83ωV ID
128 0 91 37
(b)
Feature x1 x2
ωV ID ωV ID
ωV ID ωV ID
ωV ID 564 15 523 56ωV ID
69 59 64 64
Table 2. Classification accuracy (standard deviation) for ωV ID and ωV ID
from valuedetermination by examiners. Feature vectors are defined based on (a) minutiae ex-tracted by AFIS and (b) minutiae marked by examiners.
(a)
Feature x1 x2
ωV ID classification accuracy 98% (2%) 86% (4%)ωV ID
classification accuracy 0% (0%) 29% (19%)
Total classification accuracy 80% (1%) 75% (4%)
(b)
Feature x1 x2
ωV ID classification accuracy 97% (3%) 90% (5%)ωV ID
classification accuracy 46% (12%) 50% (10%)
Total classification accuracy 88% (2%) 83% (4%)
without replacement to form a fold. Average classification accuracies along withstandard deviations are reported in Tables 2 and 4. Target class label for ωV ID
and ωV ID can be assigned by either (i) latent examiners or (ii) AFIS.
Value Determination by Examiners Value determination by latent exam-iners is one of VID, VEO, and NV. All latents determined as VID by examinerscomprise ωV ID while ωV ID consists of VEO and NV latents determined by ex-aminers. Tables 1 and 2 show the confusion matrices and classification accuracieswith standard deviations of predicting value determination by examiners.
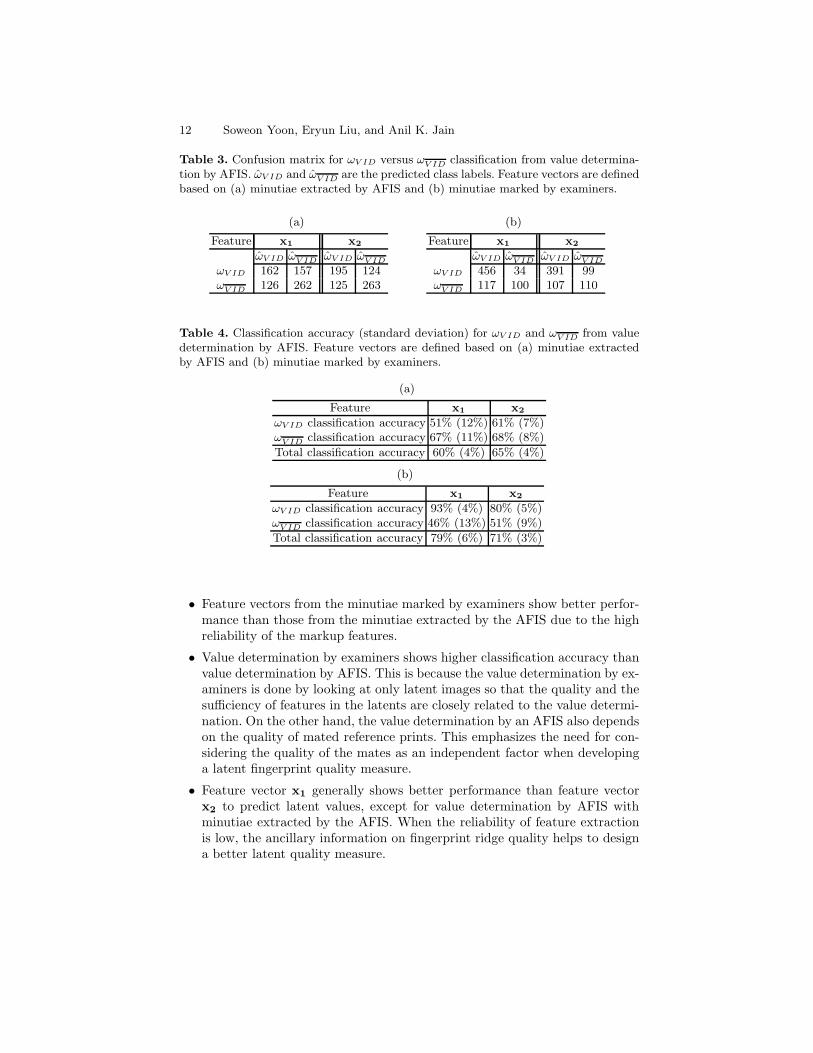
Value Determination by AFIS Value determination by AFIS is based onthe matching performance of a specific AFIS: a latent belongs to ωV ID if itsmate in the reference database is retrieved within the top rank-100; otherwise, itbelongs to ωV ID. Tables 3 and 4 show the confusion matrices and classificationaccuracies with standard deviations of predicting value determination by theAFIS.
Based on these classification results, we make the following observations:
12 Soweon Yoon, Eryun Liu, and Anil K. Jain
Table 3. Confusion matrix for ωV ID versus ωV ID
classification from value determina-tion by AFIS. ωV ID and ω
V IDare the predicted class labels. Feature vectors are defined
based on (a) minutiae extracted by AFIS and (b) minutiae marked by examiners.
(a)
Feature x1 x2
ωV ID ωV ID
ωV ID ωV ID
ωV ID 162 157 195 124ωV ID
126 262 125 263
(b)
Feature x1 x2
ωV ID ωV ID
ωV ID ωV ID
ωV ID 456 34 391 99ωV ID
117 100 107 110
Table 4. Classification accuracy (standard deviation) for ωV ID and ωV ID
from valuedetermination by AFIS. Feature vectors are defined based on (a) minutiae extractedby AFIS and (b) minutiae marked by examiners.
(a)
Feature x1 x2
ωV ID classification accuracy 51% (12%) 61% (7%)ωV ID
classification accuracy 67% (11%) 68% (8%)
Total classification accuracy 60% (4%) 65% (4%)
(b)
Feature x1 x2
ωV ID classification accuracy 93% (4%) 80% (5%)ωV ID
classification accuracy 46% (13%) 51% (9%)
Total classification accuracy 79% (6%) 71% (3%)
• Feature vectors from the minutiae marked by examiners show better perfor-mance than those from the minutiae extracted by the AFIS due to the highreliability of the markup features.
• Value determination by examiners shows higher classification accuracy thanvalue determination by AFIS. This is because the value determination by ex-aminers is done by looking at only latent images so that the quality and thesufficiency of features in the latents are closely related to the value determi-nation. On the other hand, the value determination by an AFIS also dependson the quality of mated reference prints. This emphasizes the need for con-sidering the quality of the mates as an independent factor when developinga latent fingerprint quality measure.
• Feature vector x1 generally shows better performance than feature vectorx2 to predict latent values, except for value determination by AFIS withminutiae extracted by the AFIS. When the reliability of feature extractionis low, the ancillary information on fingerprint ridge quality helps to designa better latent quality measure.
On Latent Fingerprint Image Quality 13
0 10 20 30 40 50 60 7045
50
55
60
65
70
75
Rejection Rate (%)
Ra
nk−
10
0 I
de
ntifica
tio
n R
ate
(%
)
QR
QM
QR . Q
M
(a)
0 10 20 30 40 50 60 7065
70
75
80
85
90
95
Rejection Rate (%)
Ra
nk−
10
0 I
de
ntifica
tio
n R
ate
(%
)
QR
QM
QR . Q
M
(b)
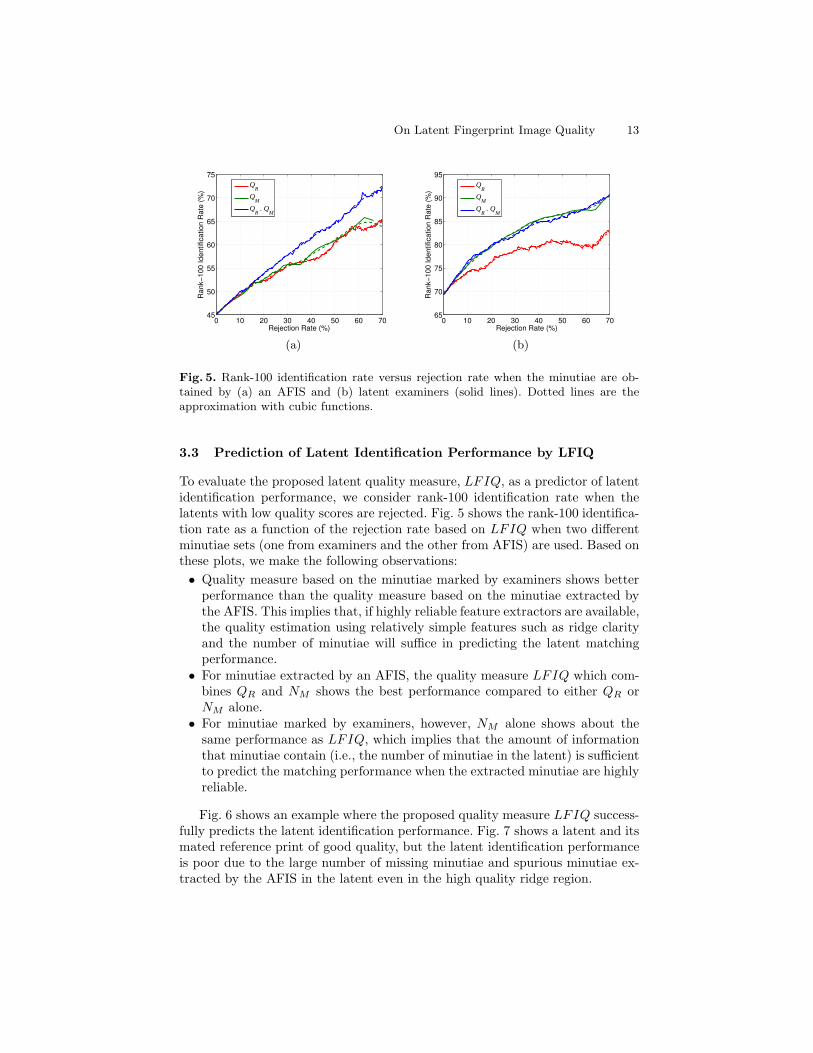
Fig. 5. Rank-100 identification rate versus rejection rate when the minutiae are ob-tained by (a) an AFIS and (b) latent examiners (solid lines). Dotted lines are theapproximation with cubic functions.
3.3 Prediction of Latent Identification Performance by LFIQ
To evaluate the proposed latent quality measure, LFIQ, as a predictor of latentidentification performance, we consider rank-100 identification rate when thelatents with low quality scores are rejected. Fig. 5 shows the rank-100 identifica-tion rate as a function of the rejection rate based on LFIQ when two differentminutiae sets (one from examiners and the other from AFIS) are used. Based onthese plots, we make the following observations:
• Quality measure based on the minutiae marked by examiners shows betterperformance than the quality measure based on the minutiae extracted bythe AFIS. This implies that, if highly reliable feature extractors are available,the quality estimation using relatively simple features such as ridge clarityand the number of minutiae will suffice in predicting the latent matchingperformance.
• For minutiae extracted by an AFIS, the quality measure LFIQ which com-bines QR and NM shows the best performance compared to either QR orNM alone.
• For minutiae marked by examiners, however, NM alone shows about thesame performance as LFIQ, which implies that the amount of informationthat minutiae contain (i.e., the number of minutiae in the latent) is sufficientto predict the matching performance when the extracted minutiae are highlyreliable.
Fig. 6 shows an example where the proposed quality measure LFIQ success-fully predicts the latent identification performance. Fig. 7 shows a latent and itsmated reference print of good quality, but the latent identification performanceis poor due to the large number of missing minutiae and spurious minutiae ex-tracted by the AFIS in the latent even in the high quality ridge region.

14 Soweon Yoon, Eryun Liu, and Anil K. Jain
(a) (b) (c) (d)
Fig. 6. Example of a latent for which the proposed latent quality LFIQ successfullydetermines it to be ‘high’ quality latent. (a) Latent U237 in NIST SD27, (b) ridgeclarity map, (c) minutiae set and its convex hull, and (d) mated reference print withminutiae extracted by an AFIS (red) and the mated minutiae with the latent (green).Note that while this latent has a high LFIQ value (corresponding to the rejectionrate of 83%) and the mated print is retrieved at rank-1, the value determination byexaminers for this latent was not-VID.
(a) (b) (c) (d)
Fig. 7. Example of a latent where the proposed latent quality measure LFIQ deter-mines it to be a ‘high’ quality latent, but the retrieval rank of the mated referenceprint is poor (ranked at 4,658). (a) Latent W944F08B N in WVU database, (b) ridgeclarity map, (c) minutiae set and its convex hull, and (d) mated reference print withminutiae extracted by an AFIS. Note that while this latent has a high LFIQ value(corresponding to the rejection rate of 88%) and the value determination by examinersis also VID, the matching performance is poor due to the large number of false minutiaeextracted by the AFIS in the latent.
As a comparison to the proposed LFIQ, NIST Fingerprint Image Quality(NFIQ)5 [26] was used to assess the quality of the latents in the two latentdatabases. When setting the rejection criterion as ‘NFIQ = 5’, the rank-100identification rate of the accepted latents with minutiae extracted by the AFISwas 66% at a rejection rate of 80%. At the same rejection rate, the rank-100identification rate of the accepted latents by NFIQ with minutiae marked by
5 NFIQ assigns one of five discrete quality levels ranging from 1 to 5 to a referenceprint; ‘1’ refers to the highest quality, and ‘5’ indicates the lowest quality. Note thatNFIQ was not designed for latent fingerprint quality assessment.

On Latent Fingerprint Image Quality 15
examiners was 80%. The proposed latent quality measure, LFIQ, on the otherhand, was able to achieve the same rank-100 identification rate at significantlylower rejection rates as follows: (i) rank-100 identification rate of 66% can beachieved, with minutiae extracted by the AFIS, by rejecting 53% of poor qualitylatents identified by the proposed LFIQ; (ii) rank-100 identification rate of 80%can be achieved, with minutiae marked by examiners, by rejecting 21% of poorquality latents identified by the proposed LFIQ.
4 Conclusions and Future Work
Towards the goal of designing a “lights-out” latent fingerprint matching system,we proposed a latent fingerprint quality measure. We first defined the valueof a latent based on its rank-100 identification rate to directly relate the latentquality to the matching performance. A set of features based on latent fingerprintridge clarity and minutiae properties was evaluated by posing the latent valuedetermination problem as a 2-class classification problem (i.e., VID versus not-VID). Based on the classification accuracy, the most salient features were selectedto define a latent quality measure as a product of the average ridge clarity inthe convex hull enclosing the minutiae and the number of minutiae in the latent.The proposed latent quality measure improves the rank-100 identification rateof an AFIS by effectively rejecting poor quality latents.
Based on the preliminary study of the proposed LFIQ, we identify the fol-lowing topics that are worthy of further consideration:• Defining a latent quality measure with a more discriminative feature setrepresenting the reliability of minutiae extracted by an AFIS to predict itsmatching performance.
• Developing a latent quality measure involving Level-3 features.
Acknowledgments. We would like to thank Austin Hicklin of Noblis for pro-viding us the value determination by examiners of latents in NIST SD27. Thisresearch was partially supported by a grant from the NSF Center of Identifica-tion Technology Research (CITeR).
References
1. Maltoni, D., Maio, D., Jain, A.K., Prabhakar, S.: Handbook of Fingerprint Recog-nition (Second Edition). Springer-Verlag (2009)
2. The Federal Bureau of Investigation (FBI). Integrated Automated Fin-gerprint Identification System (IAFIS) http://www.fbi.gov/about-us/cjis/
fingerprints_biometrics/iafis/iafis.3. Wilson, C., et al.: Fingerprint Vendor Technology Evaluation 2003: Summary of
Results and Analysis Report. NISTIR 7123 (2004)4. Ashbaugh, D.R.: Quantitative-Qualitative Friction Ridge Analysis: An Introduc-
tion to Basic and Advanced Ridgeology. CRC Press (1999)5. Science Working Group on Friction Ridge Analysis, Study and Technology (SWG-
FAST): Standards for Examining Friction Ridge Impressions and Resulting Con-clusions (Latent/Tenprint) (2011)

16 Soweon Yoon, Eryun Liu, and Anil K. Jain
6. Office of the Inspector General, Oversight and Review Division: A Review of theFBI’s Handling of the Brandon Mayfield Case (2006)
7. Office of the Inspector General, Oversight and Review Division: A Review of theFBI’s Progress in Responding to the Recommendations in the Office of the Inspec-tor General Report on the Fingerprint Misidentification in the Brandon MayfieldCase (2011)
8. National Research Council: Strengthening Forensic Science in the United States:A Path Forward (2009)
9. National Institute of Standards and Technology (NIST) and National Instituteof Justice (NIJ): Latent Print Examination and Human Factors: Improving thePractice through a Systems Approach (2012)
10. Hicklin, R.A., et al.: Latent Fingerprint Quality: A Survey of Examiners. Journalof Forensic Identification 61(4) (2011) 385–419
11. Ulery, B.T., Hicklin, R.A., Buscaglia, J., Roberts, M.A.: Accuracy and Reliabilityof Forensic Latent Fingerprint Decisions. Proceedings of the National Academy ofSciences 108(19) (2011) 7733–7738
12. Ulery, B.T., Hicklin, R.A., Buscaglia, J., Roberts, M.A.: Repeatability and Repro-ducibility of Decisions by Latent Fingerprint Examiners. PLoS ONE 7(3) (2012)
13. Indovina, M., Dvornychenko, V., Hicklin, R.A., Kiebuzinski, G.I.: Evaluation ofLatent Fingerprint Technologies: Extended Feature Sets [Evaluation #2]. NISTIR7859 (2012)
14. NIST Special Database 27: Fingerprint Minutiae from Latent and Matching Ten-print Images www.nist.gov/srd/nistsd27.htm.
15. West Virginia University Latent Fingerprint Database: http://www.csee.wvu.
edu/~ross/.16. Indovina, M., Dvornychenko, V., Tabassi, E., Quinn, G., Grother, P., Meagher,
S., Garris, M.: ELFT Phase II - An Evaluation of Automated Latent FingerprintIdentification Technologies. NISTIR 7577 (2009)
17. Jain, A.K., Feng, J.: Latent Fingerprint Matching. IEEE Trans. Pattern Analysisand Machine Intelligence 33(1) (2011) 88–100
18. Yoshida, A., Hara, M.: Fingerprint Image Quality Metrics That Guarantees Match-ing Accuracy. Biometric Quality Workshop (2006)
19. NIST: Latent Print AFIS Interoperability Working Group www.nist.gov/oles/
afis_interoperability.cfm.20. Fronthaler, H., Kollreider, K., Bigun, J.: Local Features for Enhancement and
Minutiae Extraction in Fingerprints. IEEE Trans. on Image Processing 17(3)(2008) 354–363
21. Jain, A.K., Feng, J.: Latent Palmprint Matching. IEEE Trans. Pattern Analysisand Machine Intelligence 31(6) (2009) 1032–1047
22. Paulino, A.A., Feng, J., Jain, A.K.: Latent Fingerprint Matching Using Descriptor-Based Hough Transform. IEEE Trans. on Information Forensics and Security(2012) (To appear).
23. Dvornychenko, V.N.: Evaluation of Fusion Methods for Latent Fingerprint Match-ers. In: Proc. 5th International Conference on Biometrics (ICB). (2012) 182–188
24. Breiman, L., Friedman, J., Olshen, R., Stone, C.: Classification and RegressionTrees. Chapman and Hall/CRC (1984)
25. NIST Special Database 14: NIST Mated Fingerprint Card Pairs 2 (MFCP2) http://www.nist.gov/srd/nistsd14.cfm.
26. Tabassi, E., Wilson, C., Watson, C.: Fingerprint Image Quality. NISTIR 7151(2004)