once you know what they’ve learned, what do you do next?
DESCRIPTION
Once you know what they’ve learned, what do you do next?. Designing curriculum and assessment for growth. Dylan Wiliam Institute of Education, University of London www.dylanwiliam.net Presentation to MDSE/MARCES conference; University of Maryland, College Park, MD; October 2006. Outline. - PowerPoint PPT PresentationTRANSCRIPT
Once you know what they’ve learned, what do you do next?
Designing curriculum and
assessment for growth
Dylan Wiliam
Institute of Education, University of London
www.dylanwiliam.net
Presentation to MDSE/MARCES conference;
University of Maryland, College Park, MD; October 2006
Outline
• Education reform in England and Wales
• Designing an assessment system to support learning
• Age-independent levels of achievement
• Distribution of achievement over time
• Applications to curriculum specification
A familiar story
• Education Reform Act (1988)– An early attempt to use markets to reform
education• Choice• Diversity• Standardization• Information
Key features of ERA
• Basic curriculum:– Religious education (!)– Core subjects (English, Math, Science)– Non-core subjects (7 in all)
• Four “key stages” (5-7, 7-11, 11-14, 14-16)• Core subjects assessed at end of each key stage• Other subjects assessed at some key stages
Task Group on Assessment and Testing (TGAT)
To advise the Secretary of State on the practical considerations which should govern all assessment including testing of attainment at age (approximately) 7, 11, 14 and 16, within a national curriculum; including
the marking scale or scales and kinds of assessment including testing to be used,the need to differentiate so that assessment can promote learning across a range of abilities,the relative roles of informative and of diagnostic assessment,the uses to which the results of assessment should be put,the moderation requirements needed to secure credibility for assessments, andthe publication and other services needed to support the system –
with a view to securing assessment and testing arrangements which are simple to administer, understandable by all in and outside the education service, cost-effective, and supportive of learning in schools.

Task Group on Assessment and Testing (TGAT)
• Basic choice– Age-dependent
• “benchmark” assessments at each age-point
– Age-independent• linked system of achievement levels across ages
• Crucial factors– Technical feasibility– Impact on students
Age-dependent levels
• Simple to understand
• Familiar
• Significant negative impact on student motivation
• Encourages a notion of ability as “fixed” rather than incremental
Age-independent levels
• In psychology– Piaget (Shayer et al., 1976; Shayer & Wylam, 1978)– Pascual-Leone– Case– SOLO (Biggs & Collis, 1982)– Van Hiele– CSMS (Hart, 1981)
• In Education (or math education at least!)– The “Dalton Plan” (Parkhurst, 1922)– Kent Mathematics Project (Banks, 1991)– Secondary Mathematics Individualised Learning Experiment– Graded Assessment in Mathematics (Brown, 1992)
Preliminary evidence
• 6099 + 1 = ? (Foxman et al., 1980)– Correctly answered by some 7-year-olds– Incorrectly answered by some 14-year-olds
• The “seven year gap” (Cockcroft, 1981)• Progression in measuring (Simon et al., 1995)• Spread of achievement in an age cohort
apparently much greater than generally assumed
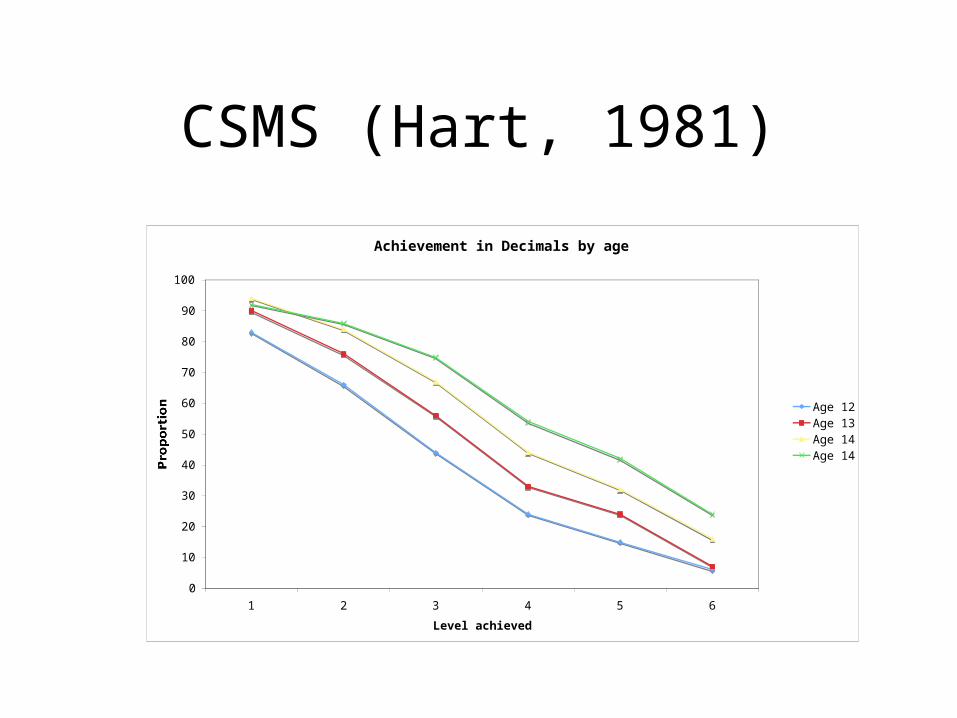
CSMS (Hart, 1981)
Achievement in Decimals by age
0
10
20
30
40
50
60
70
80
90
100
1 2 3 4 5 6
Level achieved
Proportion
Age 12Age 13Age 14Age 14
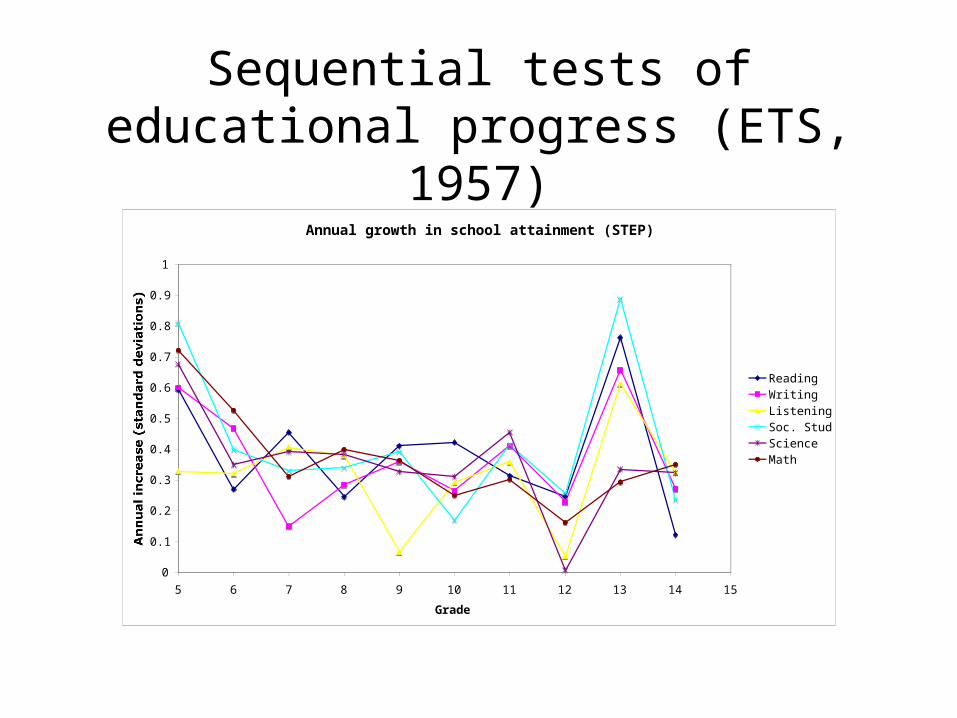
Sequential tests of educational progress (ETS, 1957)
Annual growth in school attainment (STEP)
0
0.1
0.2
0.3
0.4
0.5
0.6
0.7
0.8
0.9
1
5 6 7 8 9 10 11 12 13 14 15
Grade
Annual increase (standard deviations)
ReadingWritingListeningSoc. Stud.ScienceMath
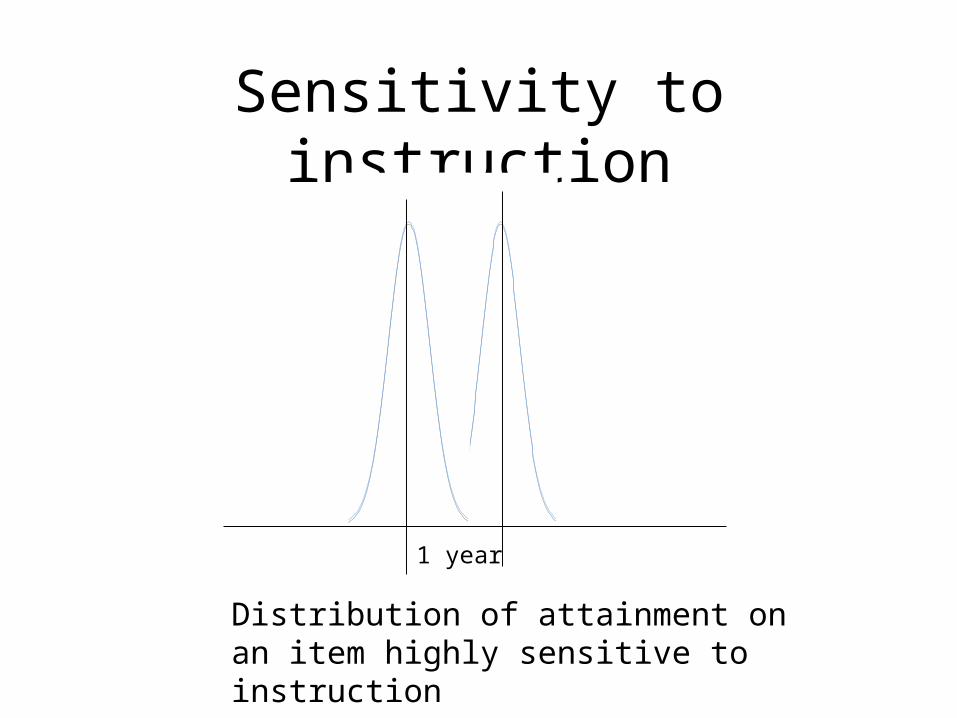
Sensitivity to instruction
1 year
Distribution of attainment on an item highly sensitive to instruction
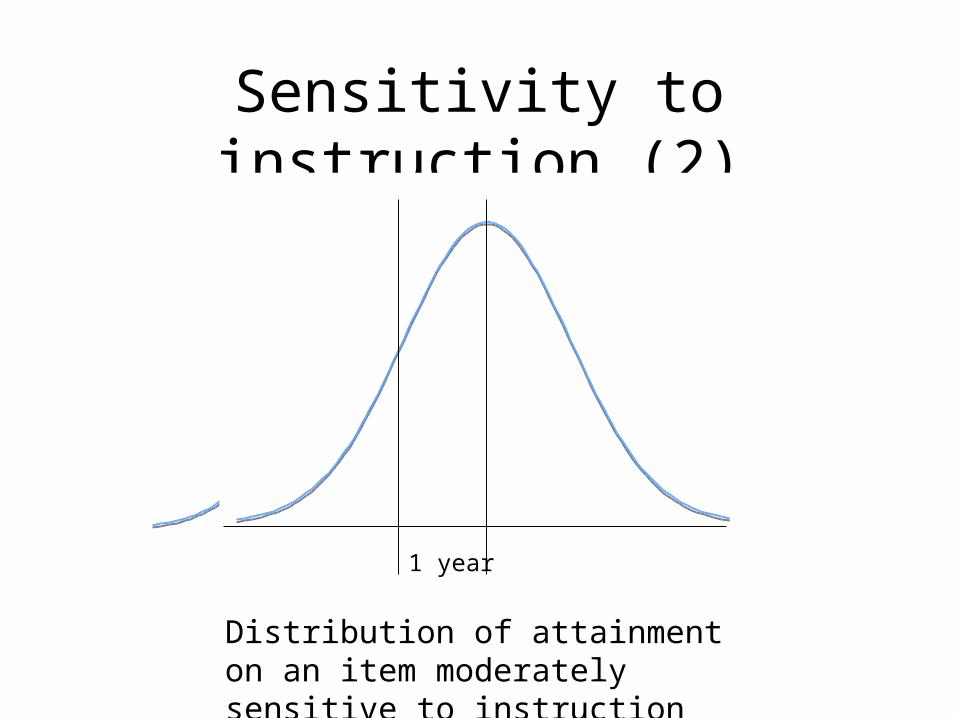
Sensitivity to instruction (2)
1 year
Distribution of attainment on an item moderately sensitive to instruction
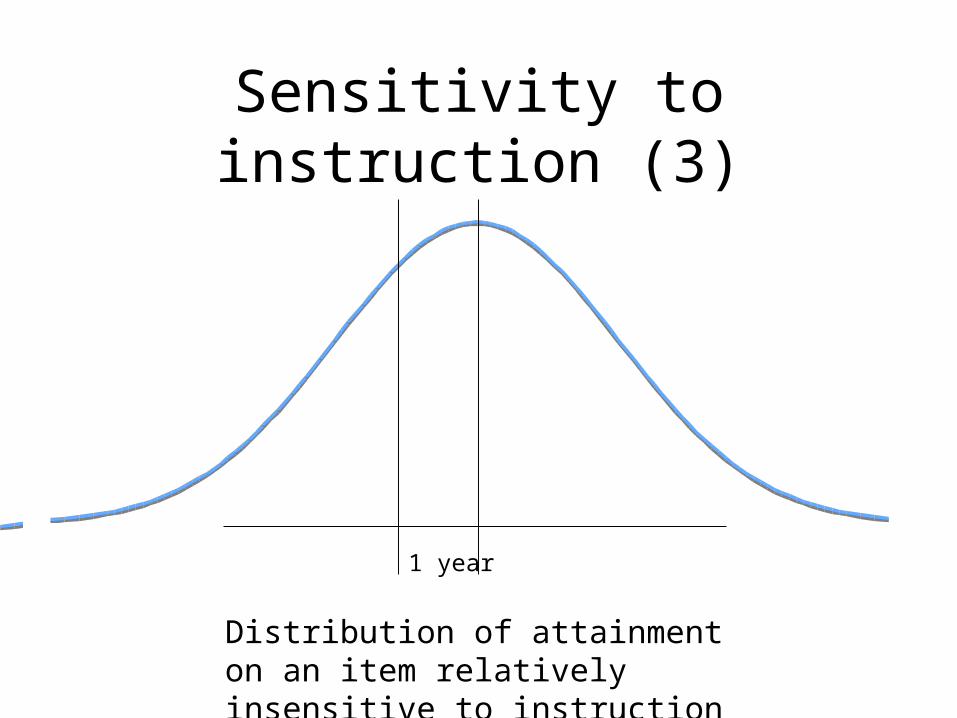
Sensitivity to instruction (3)
1 year
Distribution of attainment on an item relatively insensitive to instruction
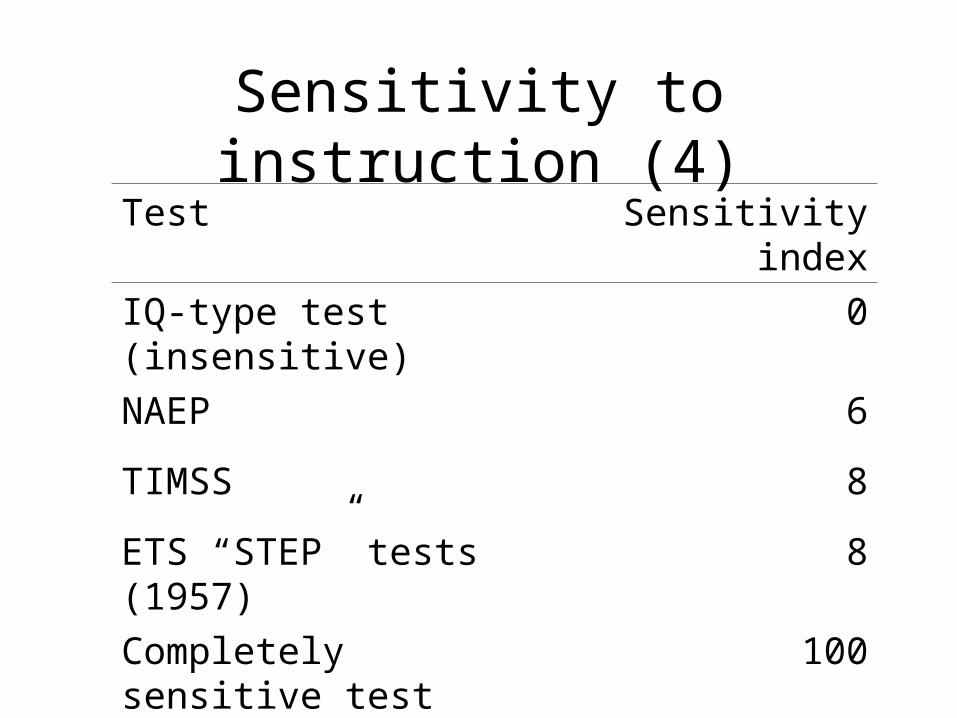
Sensitivity to instruction (4)Test Sensitivity index
IQ-type test (insensitive) 0
NAEP 6
TIMSS 8
ETS “STEP” tests (1957) 8
Completely sensitive test 100
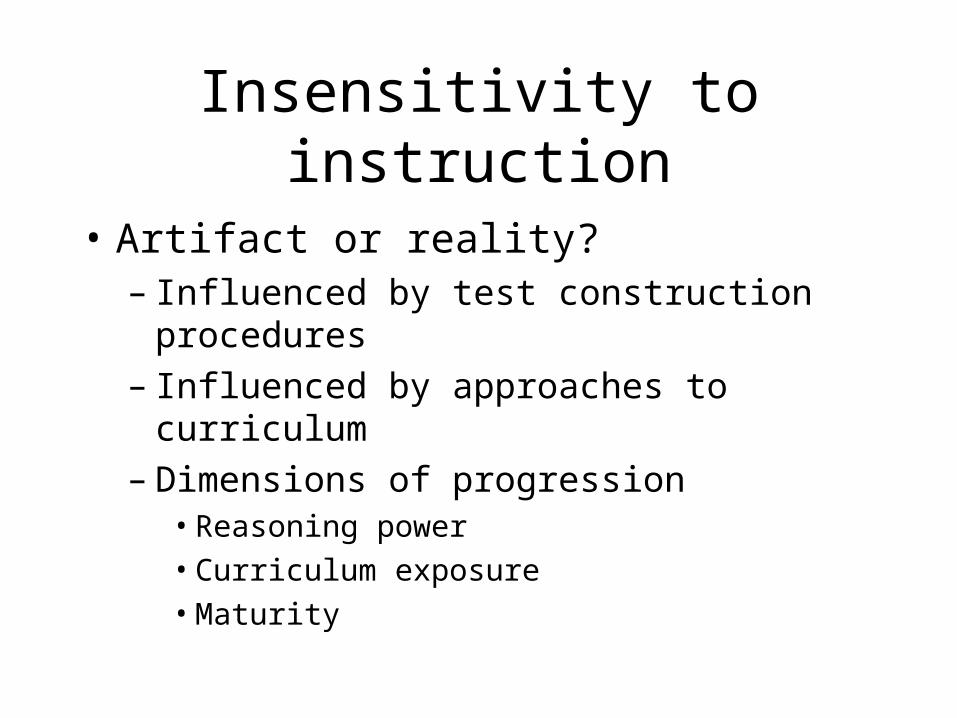
Insensitivity to instruction
• Artifact or reality?– Influenced by test construction procedures– Influenced by approaches to curriculum– Dimensions of progression
• Reasoning power• Curriculum exposure• Maturity
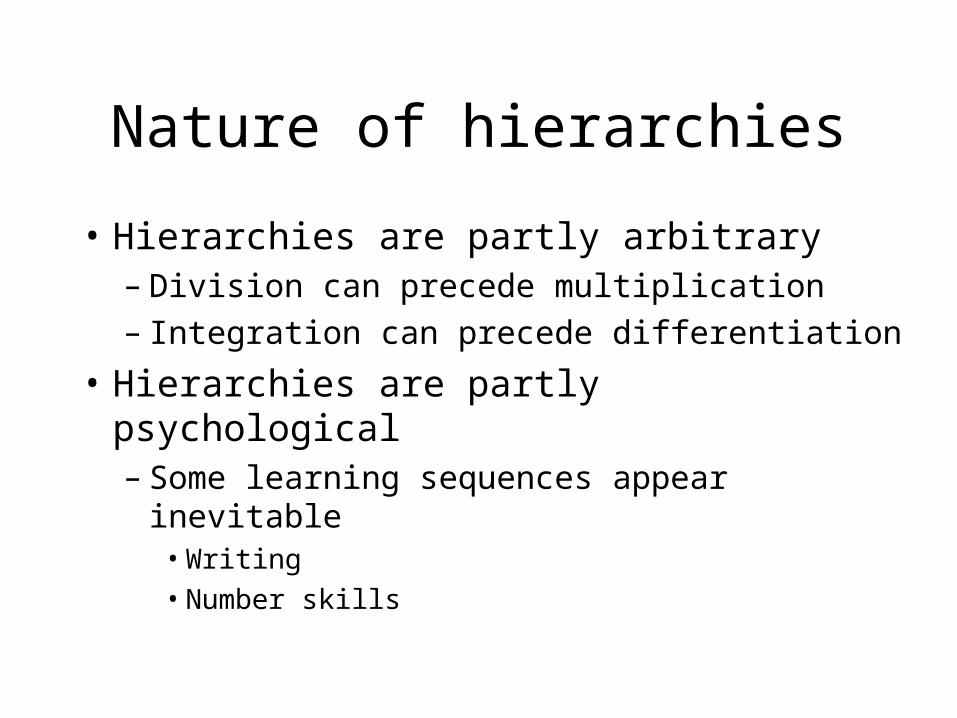
Nature of hierarchies
• Hierarchies are partly arbitrary– Division can precede multiplication– Integration can precede differentiation
• Hierarchies are partly psychological– Some learning sequences appear inevitable
• Writing• Number skills
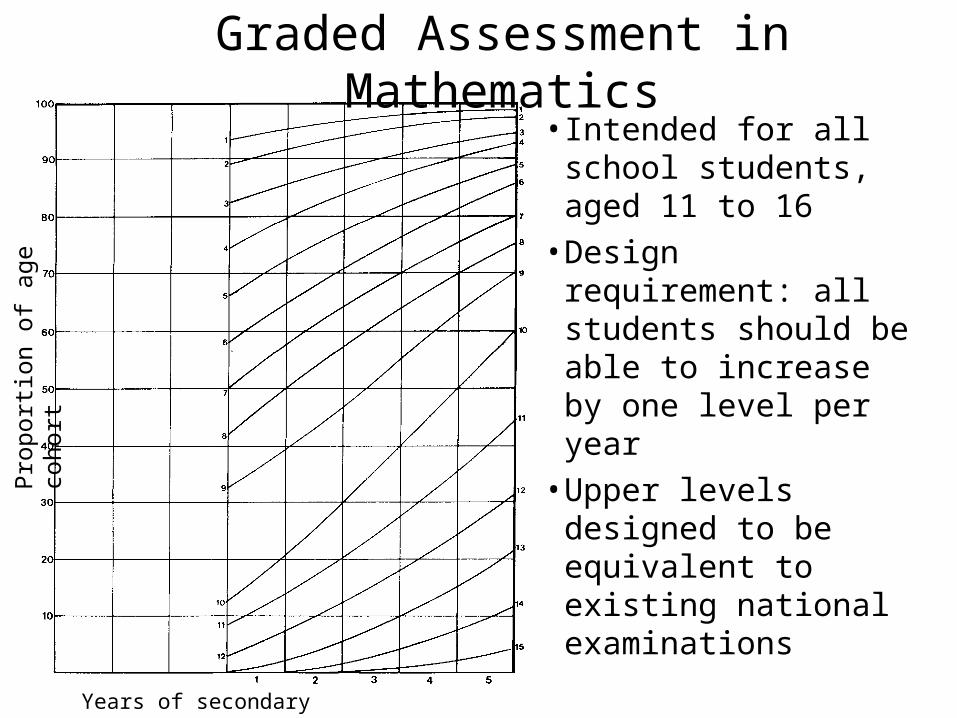
Years of secondary schooling
Pro
port
ion
of a
ge c
ohor
t
Graded Assessment in Mathematics• Intended for all school
students, aged 11 to 16• Design requirement: all
students should be able to increase by one level per year
• Upper levels designed to be equivalent to existing national examinations
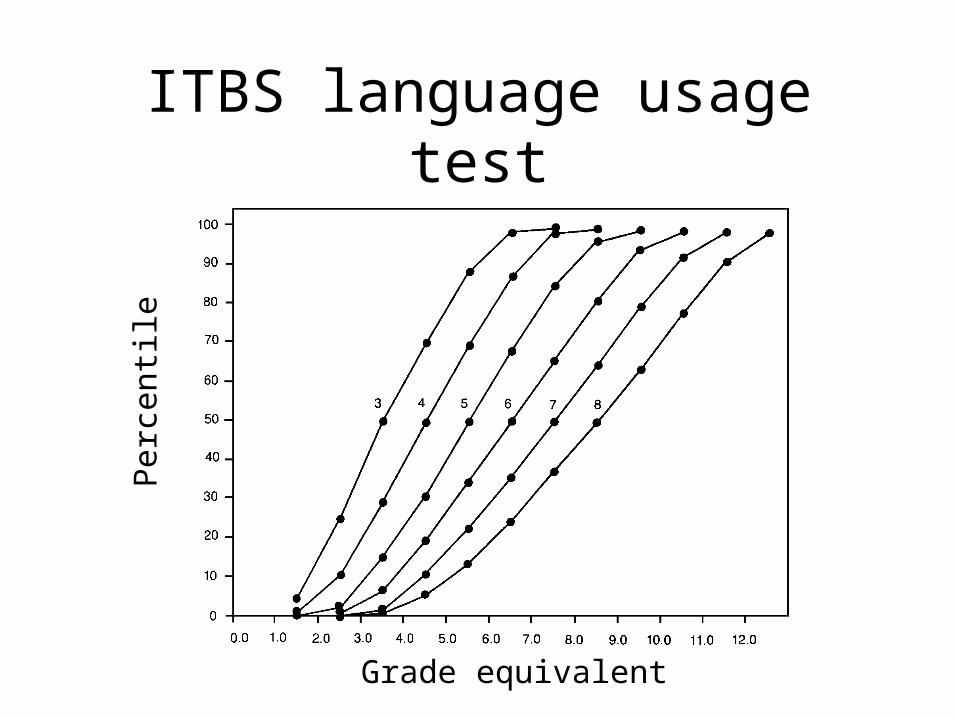
ITBS language usage test
Grade equivalent
Per
cent
ile
A very simple model
• Achievement age is normally distributed about chronological age, with a standard deviation proportional to the chronological age
• Constant of proportionality varies from around one-sixth to one-half, depending on the kind of curriculum and assessment
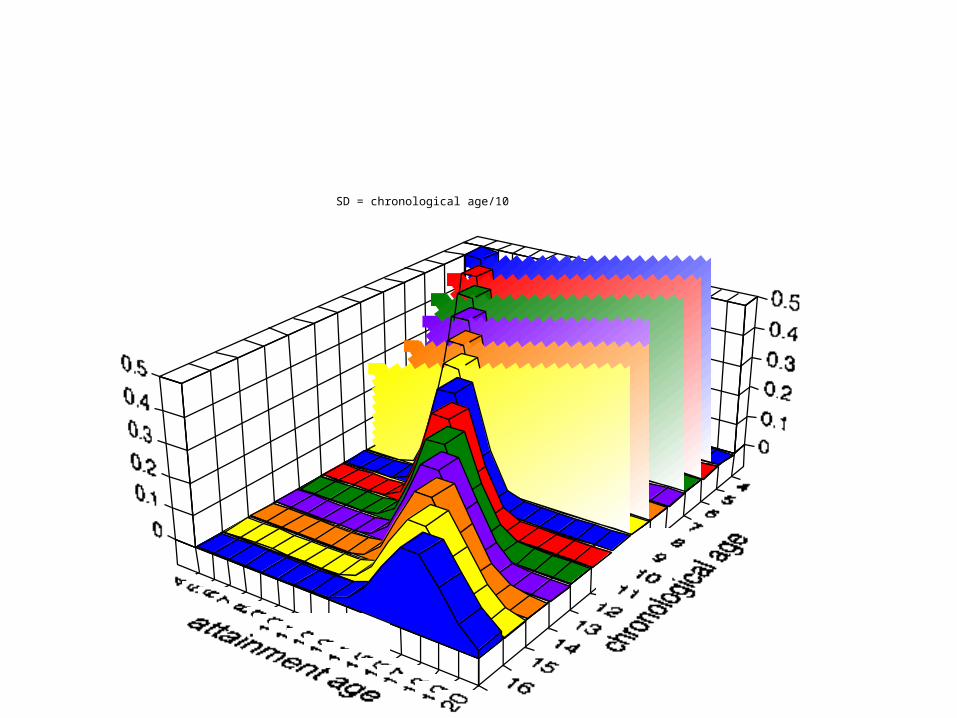
SD = chronological age/10

SD = chronological age/5
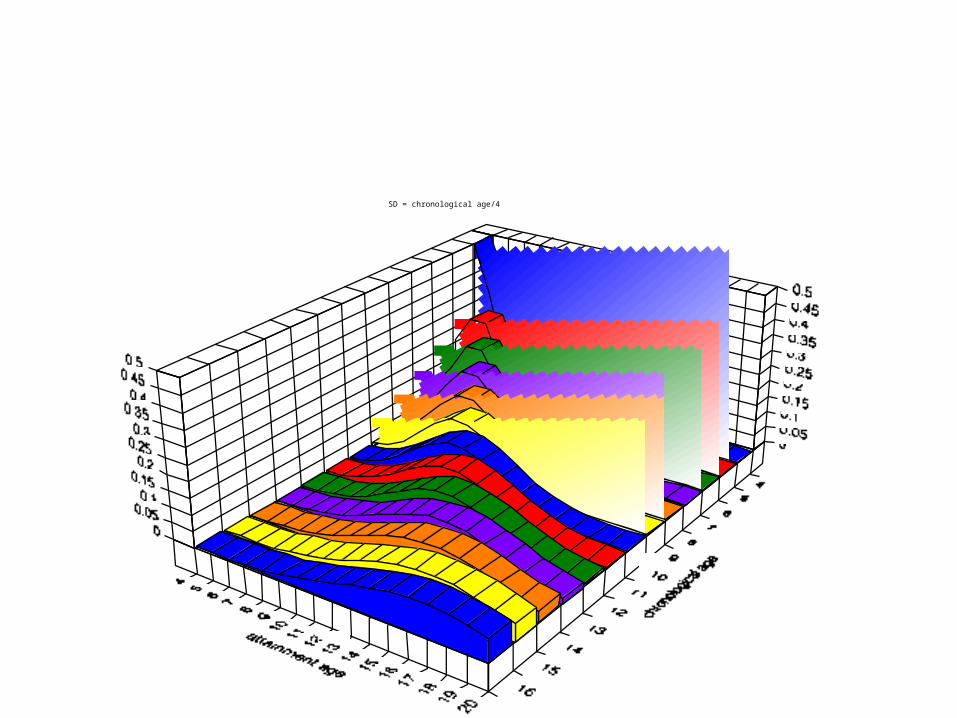
SD = chronological age/4
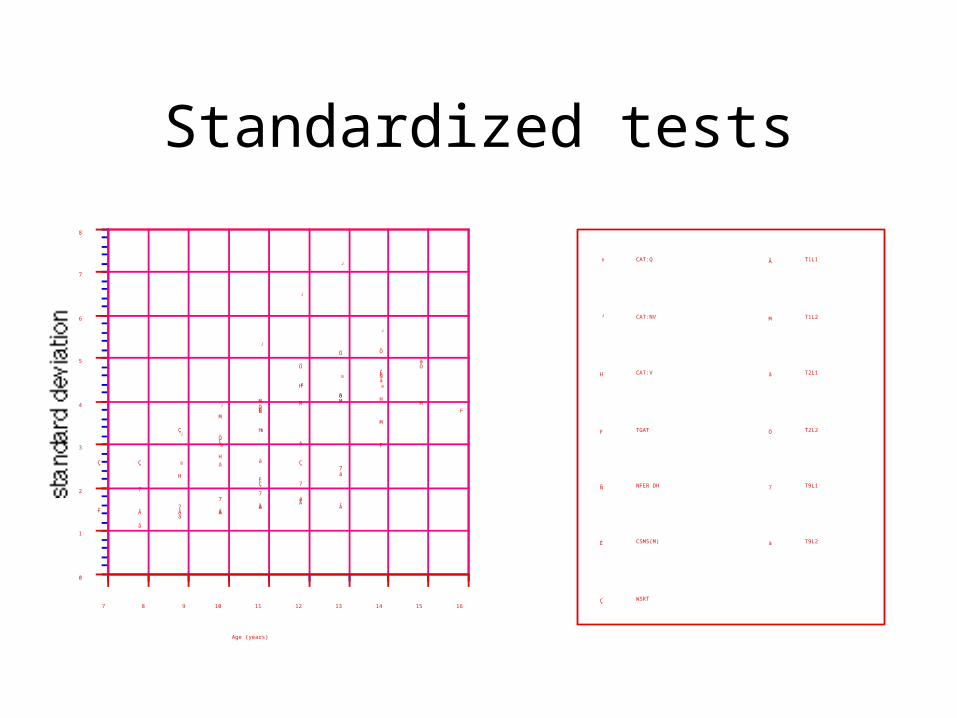
Standardized tests
B
B
B
B
B
B
J
J
J
J
J
J
H
H
H
H
HH
F
F
F
FÑ
Ñ
É
É
Ç Ç
Ç
Ç
Ç
Ç
Å Å ÅÅ
ÅÅ
M
M M M
M
M
â
ââ
ââ
â
Ö
Ö
Ö
Ö Ö
Ö
7
77
7
7
7à
à
à
à
à
à
0
1
2
3
4
5
6
7
8
7 8 9 10 11 12 13 14 15 16
standard deviation
Age (years)
B CAT:Q
J CAT:NV
H CAT:V
F TGAT
Ñ NFER DH
É CSMS(M)
Ç WSRT
Å T1L1
M T1L2
â T2L1
Ö T2L2
7 T9L1
à T9L2

The TGAT model
Stage Ages Levels
1 5-7 1-3
2 7-11 2-6
3 11-14 3-8
4 14-16 4-10
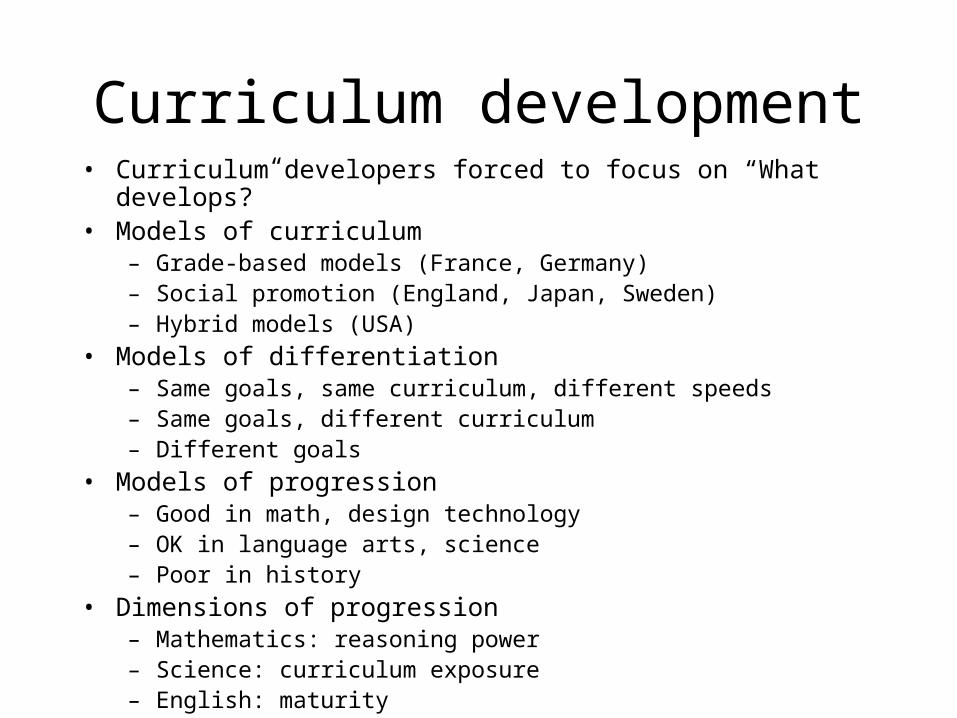
Curriculum development• Curriculum developers forced to focus on “What develops?”• Models of curriculum
– Grade-based models (France, Germany)– Social promotion (England, Japan, Sweden)– Hybrid models (USA)
• Models of differentiation– Same goals, same curriculum, different speeds– Same goals, different curriculum– Different goals
• Models of progression– Good in math, design technology– OK in language arts, science– Poor in history
• Dimensions of progression– Mathematics: reasoning power– Science: curriculum exposure– English: maturity
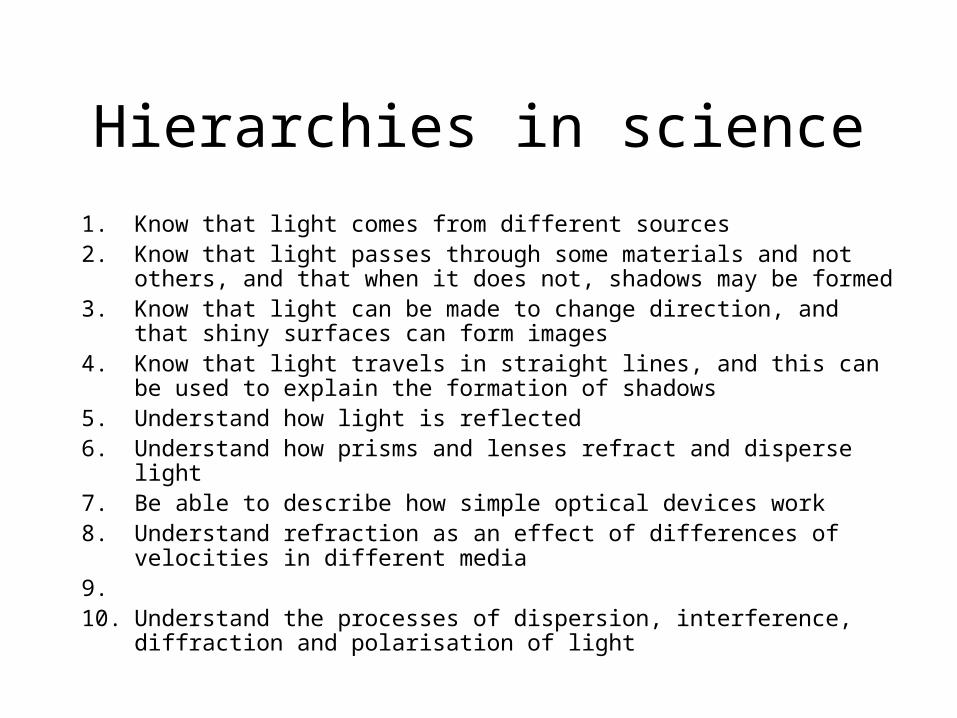
Hierarchies in science
1. Know that light comes from different sources2. Know that light passes through some materials and not others, and that when it
does not, shadows may be formed3. Know that light can be made to change direction, and that shiny surfaces can
form images4. Know that light travels in straight lines, and this can be used to explain the
formation of shadows5. Understand how light is reflected6. Understand how prisms and lenses refract and disperse light7. Be able to describe how simple optical devices work8. Understand refraction as an effect of differences of velocities in different
media9. 10. Understand the processes of dispersion, interference, diffraction and
polarisation of light
Strengths
• Forces a focus on progression in “big ideas” rather than coverage
• Supports incremental, rather than entity view of ability
• Supports strong value-added inferences
Weaknesses
• Some subjects fit the model better than others
• Some (accepted) models of curriculum become non-viable
• Requires careful articulation between curriculum, standards, and assessment
• May focus on aspects relatively insensitive to instruction