once in the elite, always in the elite? …piketty.pse.ens.fr/files/delbos2016.pdf · once in the...
TRANSCRIPT

ONCE IN THE ELITE, ALWAYS IN THE ELITE? CHANGING WEALTHIN A CHANGING CITY (PARIS, FRANCE, 1845-1859)Jean-Brieux Delbos
Dalloz | « Revue d'économie politique »
2016/5 Vol. 126 | pages 683 à 719 ISSN 0373-2630
Article disponible en ligne à l'adresse :--------------------------------------------------------------------------------------------------------------------http://www.cairn.info/revue-d-economie-politique-2016-5-page-683.htm--------------------------------------------------------------------------------------------------------------------
Pour citer cet article :--------------------------------------------------------------------------------------------------------------------Jean-Brieux Delbos, « Once in the Elite, Always in the Elite? Changing Wealth in aChanging City (Paris, France, 1845-1859) », Revue d'économie politique 2016/5(Vol. 126), p. 683-719.DOI 10.3917/redp.265.0683--------------------------------------------------------------------------------------------------------------------
Distribution électronique Cairn.info pour Dalloz.© Dalloz. Tous droits réservés pour tous pays.
La reproduction ou représentation de cet article, notamment par photocopie, n'est autorisée que dans leslimites des conditions générales d'utilisation du site ou, le cas échéant, des conditions générales de lalicence souscrite par votre établissement. Toute autre reproduction ou représentation, en tout ou partie,sous quelque forme et de quelque manière que ce soit, est interdite sauf accord préalable et écrit del'éditeur, en dehors des cas prévus par la législation en vigueur en France. Il est précisé que son stockagedans une base de données est également interdit.
Powered by TCPDF (www.tcpdf.org)
Doc
umen
t tél
écha
rgé
depu
is w
ww
.cai
rn.in
fo -
Eco
le N
orm
ale
Sup
érie
ure
- P
aris
-
- 12
9.19
9.20
7.13
0 -
03/0
4/20
17 1
2h35
. © D
allo
z D
ocument téléchargé depuis w
ww
.cairn.info - Ecole N
ormale S
upérieure - Paris - - 129.199.207.130 - 03/04/2017 12h35. ©
Dalloz

Once in the Elite, Always in the Elite?Changing Wealth in a Changing City
(Paris, France, 1845-1859)
Jean-Brieux Delbos*
Little is known about individual economic mobility in the 19th century. This articleexamines this question by studying the group of franchised Parisian voters of the1840s. Different sources are matched in order to follow longitudinally the trajectories ofthe individuals who belong to this particularly rich and politically important group overtime. Both short-term and long-term mobility are analyzed. Short-term mobility isobserved by matching individuals who appear in the electoral lists of the years 1845and 1846. These lists show the direct taxes that were paid by the voters. Long-termmobility is revealed by exploiting the Parisian Tables of successions and absences(TSA) of the years 1845 to 1859. These contain information about the wealth at death ofindividuals. Because the tax-based voting franchise and wealth do not have the samestructure, this article studies the comparability between these two variables andexplores the question of the political representation of wealth. Despite the difference indefinition between the tax-based voting franchise and wealth, the data set shows con-sistent correlations across time. Moreover, both in the short and long term, economicmobility proves to be substantial. 14 percent of individuals changed quintile between1845 and 1846, which is considerable over a one-year period. Concerning long-termmobility, 65 percent of individuals changed quintile between 1845 and their respectiveyears of death. All these results raise serious questions about the long-held idea of astable plutocratic elite group.
elites – franchised voters – top wealth – plutocracy – individual economic mobility –
matching quantitative sources – electoral lists – direct taxes – estate tax data –
19th century
L’élite : j’y suis, j’y reste ?Une richesse qui change dans une ville qui change
(Paris, France, 1845-1859)
La mobilité économique des individus au XIXème siècle reste peu connue. L’articleexamine cette question par une étude du groupe des électeurs censitaires parisiens des
* At the time of the writing of this article, Jean-Brieux Delbos was a research assistant atParis School of Economics (e-mail: [email protected]). I thank the Archives ofParis for allowing full access to the electoral lists and estate tax data. I am very grateful toJean-Laurent Rosenthal (Caltech) for suggesting the initial basis of this article. I thank semi-nar participants at Paris School of Economics for helpful comments. This article also bene-fited from precious comments from participants at the 64th Annual Meeting of the FrenchEconomic Association (AFSE, 22-24 June 2015, Rennes, France) and the 11th EuropeanSocial Science History Conference (ESSHC, 30 March-2 April 2016, Valencia, Spain). I wouldalso like to thank two anonymous referees for insightful comments.
•L
XIV
eC
ON
GR
ÈS
AN
NU
EL
DE
L’A
FSE
,20
15
REP 126 (5) septembre-octobre 2016
Doc
umen
t tél
écha
rgé
depu
is w
ww
.cai
rn.in
fo -
Eco
le N
orm
ale
Sup
érie
ure
- P
aris
-
- 12
9.19
9.20
7.13
0 -
03/0
4/20
17 1
2h35
. © D
allo
z D
ocument téléchargé depuis w
ww
.cairn.info - Ecole N
ormale S
upérieure - Paris - - 129.199.207.130 - 03/04/2017 12h35. ©
Dalloz

années 1840. Différentes sources sont appariées entre elles afin de suivre dans le tempsles trajectoires des membres de ce groupe particulièrement riche et politiquementimportant. L’analyse porte tant sur la mobilité à court terme que sur celle à long terme.La mobilité à court terme est observée grâce à un appariement des individus quiapparaissent dans les listes électorales des années 1845 et 1846. Ces listes contiennentles informations sur les impôts directs acquittés par les électeurs. La mobilité à longterme est révélée par une exploitation des Tables parisiennes des successions et absen-ces (TSA) des années 1845 à 1859. Ces tables contiennent des informations sur larichesse au décès des individus. Étant donné que la structure du cens électoral – lequelest fondé sur les impôts directs – diffère de celle de la richesse, l’article examine dansquelle mesure ces deux variables sont comparables entre elles puis explore la questionde la représentation politique de la richesse. Malgré la différence de définition entrecens électoral et richesse, les données permettent de mettre en évidence des corréla-tions cohérentes entre ces deux variables au cours du temps. De plus, tant à courtterme qu’à long terme, la mobilité économique s’avère élevée. 14 % des individuschangent de quintile entre 1845 et 1846, ce qui est considérable pour une période d’unan. S’agissant de la mobilité à long terme, 65 % des individus changent de quintileentre 1845 et l’année de leur décès. L’ensemble de ces résultats soulève de sérieusesquestions quant à l’idée, longtemps admise, d’une élite ploutocratique dont les mem-bres constitueraient un groupe stable.
élites – électeurs censitaires – grandes fortunes – ploutocratie – mobilité économique
individuelle – appariement de sources quantitatives – listes électorales – impôts directs
– données successorales – XIXème siècle
Classification JEL : D31, H20, N33
1. Introduction
Who are the members of the elite? According to the common definition,the elite consists of a small group of individuals who have a great amount ofwealth and exert a strong influence over political decisions in a given coun-try. This seemingly straightforward definition of the elite, however clear, istoo static to be entirely convincing. The wealth criterion raises some inter-esting questions about the consistency of the elite and its stability over time.
The recent economic literature on intragenerational wealth and incomemobility shows that there is considerable movement and that being rich is atransient state. Using Swedish tax data and tracking wealth at the householdlevel over the period 1968-2005, Hochguertel and Ohlsson [2012] observethe mobility of the top three percent of wealth distribution. It appears thatthe duration in this quantile is about six years, which is quite short. More-over, the wealth-age profile is consistent with the life-cycle hypothesis,people in their sixties being more frequently rich. Auten and Gee [2009]examine income mobility in the US economy over the periods 1987-1996and 1996-2005. They use panel data, follow taxpayers, adjust for householdsize and show that mobility is high, both upwards and downwards. For
684 — Once in the Elite, Always in the Elite? Changing Wealth in a Changing...
REP 126 (5) septembre-octobre 2016
Doc
umen
t tél
écha
rgé
depu
is w
ww
.cai
rn.in
fo -
Eco
le N
orm
ale
Sup
érie
ure
- P
aris
-
- 12
9.19
9.20
7.13
0 -
03/0
4/20
17 1
2h35
. © D
allo
z D
ocument téléchargé depuis w
ww
.cairn.info - Ecole N
ormale S
upérieure - Paris - - 129.199.207.130 - 03/04/2017 12h35. ©
Dalloz

instance, 55 percent of taxpayers changed quintile between 1996 and 2005.The median income of those in the lowest quintile grew more than themedian income of those in the highest one. Belonging to the top one percentis transient: about 40 percent of those in that percentile in 1996 were stillpresent in 2005. In a set of two complementary papers, Auten, Gee andTurner ([2013] AER and [2013] NTJ) look at, among other things, the ques-tion of yearly persistence at the top of the income distribution in the shortrun (i.e. one to five consecutive years). The authors ask the question ofwhether individuals in the top one percent are “old neighbors or newfriends”. The detailed analysis of persistence rates show that both types ofindividuals exist. 41 to 49 percent of individuals who were in the top onepercent in a base year ranging from 2000 to 2005 are also present five yearslater. 23 to 31 percent are continuously present over the five-year periods.The authors also underline the effect of macroeconomic conditions on thevariations of persistence rates between the different five-year periods theyobserve. For example, one-year persistence rates tend to be lower duringrecessions.
As yet, very little has been done concerning intragenerational wealth orincome mobility over earlier time periods. The dramatic long-term trend inrising wealth inequality has been well documented for the 19th century,especially for Paris and France from 1807 onwards. Piketty, Postel-Vinay andRosenthal ([2004], [2006] AER, [2006] working paper, [2014]) have madeextensive use of estate tax returns. However, the use of cross-sectional datacan hardly give an idea of the patterns of individual mobility at this time andcannot address the question of individual heterogeneity. Piketty, Postel-Vinay and Rosenthal underline the importance of these issues for assessingthe possibility of opportunities in an ever more unequal society experiencingeconomic development (industrialization, financial capitalism). According tothe authors, the decline in the share of aristocratic wealth from the 1850sonwards suggests that mobility “might have been quite high” during the19th century, aristocrats being replaced by industrialists and bankers in topfortunes. It is clear that these broad intuitions require closer scrutiny. Abetter knowledge of individual mobility during the 19th century is necessaryto assess both economic efficiency and social fairness at that time of pro-found changes. Was high inequality bad for growth? Was upward mobilitypossible for the talented, enterprising individuals despite all sorts of con-straints and barriers (credit, human capital)? To what extent did VilfredoPareto’s [1916] process of the circulation of elites occur in this highlyunequal society?
In this article my objective is not to answer the complex questions ofefficiency and fairness but to contribute to the knowledge of what individualmobility in the 19th century was. To do so, I have built an original datasetthat allows the study of wealth mobility of a specific group: the franchisedParisian voters of the year 1845. The threshold for enrolment on electorallists is very high. The franchise is limited to male citizens paying a cens of atleast 200 francs in direct taxes, i.e. a threshold corresponding approximatelyto the top three percent of the male Parisian population in 1845. Althoughconsiderably limited in terms of demographic size (16,048 voters out of aParisian population of one million inhabitants according to the 1846 cen-
Jean-Brieux Delbos —————————————————————————————————————————————————— 685
REP 126 (5) septembre-octobre 2016
Doc
umen
t tél
écha
rgé
depu
is w
ww
.cai
rn.in
fo -
Eco
le N
orm
ale
Sup
érie
ure
- P
aris
-
- 12
9.19
9.20
7.13
0 -
03/0
4/20
17 1
2h35
. © D
allo
z D
ocument téléchargé depuis w
ww
.cairn.info - Ecole N
ormale S
upérieure - Paris - - 129.199.207.130 - 03/04/2017 12h35. ©
Dalloz

sus1), the group of franchised Parisian voters is of high significance, bothpolitically and economically. This group – and more particularly its richestfraction – provides the interesting example of a mid-19th century urban elite.Different sources have been matched in order to follow the individual tra-jectories of the members of this group in terms of economic wealth. Thecomparison between the franchise Parisian lists of the years 1845 and 1846gives the possibility of studying short-term wealth mobility (the resultingdatabase is henceforth called the “short-term database”) in so far as fran-chise lists indicate the detail of the direct taxes paid by each of the fran-chised voters. Here, direct taxes will be used as a proxy for wealth. Ofcourse, the relevance of this proxy will be discussed throughout this article.Long-term wealth mobility will be studied too by matching the 1845 elec-toral list and the Parisian Tables of successions and absences (TSA) of theyears 1845 to 1859 (henceforth “long-term database”). These tables containinformation about the wealth at death of individuals.
The resulting dataset represents a unique opportunity to study economicmobility during the 19th century within a highly unequal urban society.Between the last years of the July Monarchy and the first years of theSecond Empire, Paris was indeed a capital city which experienced large-scale changes: political revolutions, industrial and financial development,demographic growth, urban renewal, real estate speculation. Thus, Parisappears to be an interesting observatory in order to measure economic andsocial mobility. Recent research (Delbos [2014]) based on the dataset I builthas revealed – among other striking results – the elites’ considerable mobil-ity in terms of movements into and out of the group of franchised Parisianvoters. Among individuals who appeared at least one time on the franchiseParisian lists of the years 1845, 1846 and 1847, only three quarters werepresent every year. This means an overall mobility rate of 25 percent, whichis considerable inasmuch as it is observed over a very short period of time(two full years). Thus, franchised Parisian voters appear to be an “instantclass”. They do not form a close elite group. However, this overall mobilityrate mixes the economic and geographic dimensions of mobility. Although itis difficult to disentangle these two dimensions with the database at mydisposal, there is consistent evidence that economic mobility is dominant(Delbos [2014]). Besides short-run mobility into and out of the group, fran-chised Parisian voters are also characterized by high mobility in the long runas measured by quintile change, wealth at death of individuals being com-pared to the amount of direct taxes paid in 1845. Persistence is low. At firstglance, long-run wealth mobility seems to be random, both upwards anddownwards.
These different elements raise important issues about measuring indi-vidual economic mobility both in the short and long run. In this article, Ishow that short-term mobility – based on the comparison between the directtaxes paid by voters in 1845 and 1846 – proves to be substantial. 14 percentof individuals changed quintile between 1845 and 1846, which is consider-able over a one-year period. Moreover, in the long run, 65 percent of indi-
1. At national level, there are 248,000 franchised voters out of a French population of36 million, i.e. a proportion of 1.4 percent if the male population is considered.
686 — Once in the Elite, Always in the Elite? Changing Wealth in a Changing...
REP 126 (5) septembre-octobre 2016
Doc
umen
t tél
écha
rgé
depu
is w
ww
.cai
rn.in
fo -
Eco
le N
orm
ale
Sup
érie
ure
- P
aris
-
- 12
9.19
9.20
7.13
0 -
03/0
4/20
17 1
2h35
. © D
allo
z D
ocument téléchargé depuis w
ww
.cairn.info - Ecole N
ormale S
upérieure - Paris - - 129.199.207.130 - 03/04/2017 12h35. ©
Dalloz

viduals changed quintile, as measured by comparing direct taxes paid in1845 and wealth at death. However, measuring long-term mobility is a muchmore complex exercise than measuring short-term mobility because thetax-based voting franchise and wealth do not have the same structure. Thisarticle studies the comparability between these two variables and analyzeswealth at death conditional on the amount of direct taxes paid at anotherpoint in the life-cycle of individuals. Despite the strong differences in defini-tion between these variables, the data set shows consistent correlationsacross time. All these results raise serious questions about the long-heldidea of a stable plutocratic elite group that can be found among historians inthe 1960s and the 1970s (see, for example, Bergeron and Chaussinand-Nogaret [1979] about the elites in the Napoleonic era, and Tudesq [1964]about the “notables” under the July Monarchy).
The rest of this article is organized as follows: section two is dedicated tothe presentation of the data sources, along with a thorough discussion ofthe comparability between the tax-based voting franchise and wealth. Sec-tion three describes the voters’ short-term economic mobility in terms ofdirect taxes between 1845 and 1846. Section four analyzes long-term mobil-ity by comparing the direct taxes paid by voters in 1845 and their wealth atdeath. In this section, the study is aimed at disentangling “true” economicmobility from the effects of the difference in definition between the tax-based voting franchise and wealth. Section five concludes.
2. Data
The franchise lists
In order to study economic mobility in the mid-19th century, I have twotypes of data sources at my disposal: franchise Parisian lists on one handand Parisian Tables of successions and absences (TSA) on the other hand.The electoral franchise lists of the July Monarchy are very precious docu-ments insofar as they allow social historians (such as French scholars Dau-mard [1963] and Tudesq [1964]) and economists (Delbos [2014]) to have aprecise knowledge of the upper parts of the bourgeoisie, nobility, notabilityand landownership of the time. The printed, official franchise lists of the1840s are generally well preserved (Kent [1971]) and easily readable. For agiven geographic level (department, electoral arrondissement, canton,town), they provide detailed information on male French citizens who arequalified to elect members of the Chamber of Deputies. To be qualified, maleFrench citizens must pay a cens of at least 200 francs in direct taxes2 3 andbe age 25 or older according to the Electoral Law of April 19, 1831.
2. Members and correspondents of the Institut de France and retired military officers,under specific conditions, are qualified as franchised voters if they pay at least 100 francs in
Jean-Brieux Delbos —————————————————————————————————————————————————— 687
REP 126 (5) septembre-octobre 2016
Doc
umen
t tél
écha
rgé
depu
is w
ww
.cai
rn.in
fo -
Eco
le N
orm
ale
Sup
érie
ure
- P
aris
-
- 12
9.19
9.20
7.13
0 -
03/0
4/20
17 1
2h35
. © D
allo
z D
ocument téléchargé depuis w
ww
.cairn.info - Ecole N
ormale S
upérieure - Paris - - 129.199.207.130 - 03/04/2017 12h35. ©
Dalloz

For a given canton (or arrondissement, as regards Parisian lists), fran-chised voters are sorted according to alphabetical order. For each voter, thelists contain the following elements4: full name, title of nobility (if any),occupation or function, honorary position, address, date of birth, the totalamount of direct taxes paid and their breakdown by tax district and tax type.Voting qualification derives from the summation of direct taxes. There arefour types of direct taxes, all created during the French Revolution: (i) a realproperty tax (contribution foncière), (ii) a two-component tax (contributionpersonnelle et mobilière) consisting of a poll tax and a tax proportional tothe rental value of dwelling, (iii) a tax on doors and windows (contributionsur les portes et fenêtres) and (iv) a tax on industrial and commercial activi-ties (contribution sur les patentes) consisting of a fixed charge whichdepends on the type of activity and the size of town population and a chargeproportional to the rental value of occupied premises. Note that this com-plex tax on industrial and commercial activities was revised by the patentelaw of April 25, 1844, that is to say just before the period I study (see Koepke[1980] for a presentation of the 1844 patente reform). It is also very impor-tant to point out that the contribution personnelle et mobilière is not a tax onmoveable assets, contrary to what the French term mobilière might mistak-enly suggest. This means that some rich individuals whose wealth consistsessentially of moveable assets are not qualified as franchised voters5. It isparticularly the case of rentiers, that is to say individuals living off capitalincome. Real property remains the basis of wealth in the mid-19th century,but rentiers make up a non-negligible part of the Parisian bourgeoisie of thetime (Tudesq [1958] and Daumard [1963])6.
The real property tax accounts for most of the direct taxes paid by fran-chised voters. For instance, in the industrializing but still largely rural depart-ment of Seine-Inferieure, the total direct taxes paid by franchised voters in1845 break down as follows: 68 percent for the real property tax, 10 percent
direct taxes. Since these voters constitute a negligible part of the electorate, they are exclu-ded from analysis.
3. In an electoral arrondissement, if there are less than 150 franchised voters, the largestdirect tax payers under the 200-franc cens complete the electoral list. This provision concernsprimarily poor, rural arrondissements.
4. For a more precise account of the organisation and content of franchise lists, seeTudesq [1958] and Kent [1971].
5. In doing so, it is as if such wealthy individuals voluntarily excluded themselves from theelectoral franchise whereas they could easily have acquired some real property somewherein France so as to meet voting qualifications. These individuals had maybe no interest inpurchasing real property or voting.
6. Estimating the proportion of “pure” rentiers in the Parisian bourgeoisie is a difficulttask. A “pure” rentier is an individual living off capital income, who has no (or little) realproperty and who has never worked in his life. If I consider male Parisian individuals whodied between 1845 and 1859 with 50,000 francs or more, I estimate that the proportion of“pure” rentiers is, in all likelihood, around 10 percent. Their economic mobility patterncannot be measured with the data at my disposal. Piketty, Postel-Vinay and Rosenthal([2014], see Appendix B, Table B18) find much higher proportions concerning the share ofrentiers in the Parisian society in 1872. Within the P90-P99 percentiles of wealth distribution,53 percent of individuals are rentiers and, within the top one percent of wealth distribution,they are 63 percent. First, this difference is due to the fact that the authors define rentiers asindividuals whose wealth at death is smaller than the capitalized value of their inheritedwealth. Second, this also suggests that, in the mid-19th century, Paris was far from being therentier society it would become at the end of the 19th century.
688 — Once in the Elite, Always in the Elite? Changing Wealth in a Changing...
REP 126 (5) septembre-octobre 2016
Doc
umen
t tél
écha
rgé
depu
is w
ww
.cai
rn.in
fo -
Eco
le N
orm
ale
Sup
érie
ure
- P
aris
-
- 12
9.19
9.20
7.13
0 -
03/0
4/20
17 1
2h35
. © D
allo
z D
ocument téléchargé depuis w
ww
.cairn.info - Ecole N
ormale S
upérieure - Paris - - 129.199.207.130 - 03/04/2017 12h35. ©
Dalloz

for the personal tax, 4 percent for the tax on doors and windows and 18 per-cent for the patente. In Paris, the average breakdown is the following: 65 per-cent for the real property tax, 7 percent for the personal tax, 1 percent for thetax on doors and windows and 27 percent for the patente, thus reflecting thesignificant weight of merchants, traders, small businessmen, craftsmen,industrialists and bankers in the Parisian electorate. Outside Paris (and mostprobably outside other big cities too), real property can be regarded by andlarge as a sine qua non to be qualified as voter. In rural areas, amounts paidfor the patente are generally small. In Paris, the picture is quite different andit is possible to be qualified without paying any real property tax. Thus, thepatente plays an important role in shaping the sociology of the franchisedParisian electorate.
There is a little-known aspect of the voting franchise: it is the familydimension of the calculation rules that enable male individuals to add, underthe conditions prescribed by the Electoral Law, the direct taxes paid bywomen and children, so as to meet voting qualifications (Verjus [1998]). Thedirect taxes paid by the wife, even in case of separation of property (but notin case of judicial separation), are added to those of the husband. The fatheradds to his own direct taxes those of his minor children, on condition that heis entitled to use their property. Besides these cases, the widow or theseparated or divorced woman has the right to delegate the direct taxes shepays to the son, grandson, son-in-law or grandson-in-law she designates.Unfortunately, franchise lists are silent on these calculations and delega-tions, so that it is practically impossible to identify the voters who benefitedfrom this system and were thus able to meet voting qualifications7.
Is it possible to assert that franchise lists are exhaustive in terms of head-count of male citizens paying at least 200 francs in direct taxes? By andlarge, I think it is the case. There are, however, three main reasons asregards non-enrolment (Tudesq [1958] and Kent [1971]). Firstly, enrolmentprocedures can be quite complex because of the multiplicity of requiredsupporting documents that have to be produced in a short period of time(for instance, for individuals who pay taxes in many different departments).If one document is missing, enrolment will not be possible. Secondly, politi-cal opinions may, in part, explain non-enrolment on franchise lists. Simplyby invalidating one document, a prefect can try to block the enrolment ofindividuals who are politically hostile to the regime. Of course, an appealagainst the prefect’s decision can be made but it is a long and complexprocedure. Conversely, some individuals exclude themselves from the listsby political indifference, negligence or (mainly legitimist) reluctance toswear allegiance to King Louis-Philippe (an act which was required beforevoting for the first time). Legitimist abstention was particularly high at thebeginning of the July Monarchy but then, in the 1840s, Legitimists tend toget more and more involved in the electoral field. Thirdly, it is important tounderline that members of the jury are randomly drawn from franchise lists.Insofar as jury duty is an expensive, time-consuming activity, some citizens
7. Information on the date of marriage of voters would be helpful to count the number ofvoters who met qualification just after marriage. Their access to the voting franchise isprobably due to marriage.
Jean-Brieux Delbos —————————————————————————————————————————————————— 689
REP 126 (5) septembre-octobre 2016
Doc
umen
t tél
écha
rgé
depu
is w
ww
.cai
rn.in
fo -
Eco
le N
orm
ale
Sup
érie
ure
- P
aris
-
- 12
9.19
9.20
7.13
0 -
03/0
4/20
17 1
2h35
. © D
allo
z D
ocument téléchargé depuis w
ww
.cairn.info - Ecole N
ormale S
upérieure - Paris - - 129.199.207.130 - 03/04/2017 12h35. ©
Dalloz

are tempted to avoid this legal obligation and the best way to do this is tostay out of the lists. This behavior was a matter of concern for prefects. Toconclude, it is very difficult to estimate the number of individuals whoexclude themselves or are excluded from franchise lists. Nevertheless, a fewclues suggest that the magnitude of non-enrolment remains limited. Thisensures that franchise lists are a reliable source concerning top taxpayers.
The Tables of successions and absences
The Parisian Tables of successions and absences (TSA) are the othersource of data I use (and that were previously used by Piketty, Postel-Vinayand Rosenthal [2004] and [2006]). The Tables of successions and absences –termed thus since 1825 – are maintained by a specific tax administration(Administration de l’Enregistrement) which was created in 1790 (and existeduntil 1969) in order to collect inheritance taxes. The TSA are intended tocontrol estate tax registration (the estate tax was created in 1791 and was aflat tax until 1902). For a given bureau of the Enregistrement administration,a TSA consists of a 200-sheet register in which each hand-written entrycorresponds to a decedent who died and/or had some wealth in the areacovered by the bureau. In principle, there is one bureau for each chief townof canton but there may have been changes over time. In Paris (the capitalcity is not subdivided into cantons) there were seven bureaux until 1859,each bureau covering generally two arrondissements. After the annexationof surrounding municipalities by Paris in 1860, there are nine bureaux (then14 in 1921 and finally 20 in 1955). The TSA are sorted both alphabeticallyand chronologically (which will be of great help in matching them withfranchise lists). More precisely, a register contains individuals with namesbeginning with the same initial letter. Once a register is full, the administra-tion opens a new one, which explains why TSA are arranged chronologicallyaccording to time periods of varying length (generally between two and sixyears for the Parisian TSA of the mid-19th century).
The TSA contain the following information: the decedent’s name, firstname, title of nobility (if any), occupation (or former occupation), address,age at death, date of death, marital status (sometimes left blank), date of thedeclaration of succession, information about heirs (generally limited to theindication of their kinship ties), amount of non-real estate, real estate income(the value of which is assessed by the tax administration on the day ofdeath)8, address of real estate. Note here that from the 1870s onwards (thatis to say after my period of interest), the TSA no longer contain numericinformation about wealth. If some possession is left at death, it thenbecomes necessary to refer to the declarations of succession (with the helpof the dates indicated in the TSA) contained in the registers of transfersfollowing death (registres de mutation par décès). This operation makespost-1870 data collection much more tedious.
8. Total wealth is usually defined as the sum of the amount of non-real estate plustwenty times the (assessed) value of real estate income.
690 — Once in the Elite, Always in the Elite? Changing Wealth in a Changing...
REP 126 (5) septembre-octobre 2016
Doc
umen
t tél
écha
rgé
depu
is w
ww
.cai
rn.in
fo -
Eco
le N
orm
ale
Sup
érie
ure
- P
aris
-
- 12
9.19
9.20
7.13
0 -
03/0
4/20
17 1
2h35
. © D
allo
z D
ocument téléchargé depuis w
ww
.cairn.info - Ecole N
ormale S
upérieure - Paris - - 129.199.207.130 - 03/04/2017 12h35. ©
Dalloz

The estate tax becomes progressive in 1902, which means that estate taxreturns have henceforth to be aggregated at individual level in order tocompute the amount of estate tax to be paid. Before this date, a decedentmay appear in the TSA registers of different bureaux, according to the loca-tion of estate9. Given the flat-rate taxation system, estate taxes were paid atthe bureau level. There was no need to centralize estate tax returns. Suchdispersion must be kept in mind for the data collection process.
Last but not least, I briefly consider the question of the reliability of estate taxdata. According to Piketty, Postel-Vinay and Rosenthal ([2006] AER), tax evasionwas, in all likelihood, very limited during the 19th century insofar as estate wastaxed at a very low rate (one percent for transfers to heirs in the direct line).The tax administration had the capacity to control changes in asset composi-tion or in account ownership and, if necessary, crack down on tax evaders.
Definition of the sample, matching processand issues
Because of the size of both the franchised Parisian electorate and theParisian population, it has proved necessary to restrict data collection andmatching to a well-defined sample. First of all, given the way in whichindividuals are sorted in the franchise lists and the TSA, it is easy to limit thesample to individuals with names beginning with the same initial letter. In1845 there are about 1,700 franchised Parisian voters whose names beginwith letter B (12 percent of Parisian voters). This substantial sample is thesecond largest group in terms of initial letter after letter D group (about1,900 individuals), but its representativeness is greater than that of letter Dgroup. Many nobles are classified in letter D group because they often havethe French particle de (or one of its variants) in their names. Of course, theparticle de is not necessarily synonymous with belonging to the nobility. Inletter D group, individuals bearing an explicit title of nobility are 5.3 percent.An additional 10.7 percent have names with the particle but no explicit titleof nobility. In the whole electorate, “explicit” nobles are 1.2 percent andadditional “potential” nobles are 3.1 percent. It is clear that nobles arestrongly overrepresented in letter D group, hence an overrepresentation oflarge landowners in that group – and hence a possible strong underestima-tion of true economic mobility, since real property is expected to be morestable than other forms of wealth, which will be confirmed by our analysis.Statistics on nobility for letter B group are close to those for the wholeelectorate: “explicit” nobles are 0.9 percent and “potential” nobles are2.0 percent. Thus, letter B group is a good candidate for estimating true
9. Note that non-real estate was, in principle, included in the estate tax returns of thebureau covering the area where the decedent had his place of residence. However, somedecedents whose residence (as indicated in the Parisian TSA) was outside Paris can be foundwith non-real estate located in Paris. This is particularly the case for very rich foreigners.
Jean-Brieux Delbos —————————————————————————————————————————————————— 691
REP 126 (5) septembre-octobre 2016
Doc
umen
t tél
écha
rgé
depu
is w
ww
.cai
rn.in
fo -
Eco
le N
orm
ale
Sup
érie
ure
- P
aris
-
- 12
9.19
9.20
7.13
0 -
03/0
4/20
17 1
2h35
. © D
allo
z D
ocument téléchargé depuis w
ww
.cairn.info - Ecole N
ormale S
upérieure - Paris - - 129.199.207.130 - 03/04/2017 12h35. ©
Dalloz

economic mobility10. Moreover, given that names including the particle arenot necessarily classified under letter D in the TSA registers and the fran-chise lists, this may cause specific difficulties when matching individualsfrom these two data sources. For all these reasons, it is preferable to chooseletter B group.
Insofar as franchised voters belong a priori to the richest part of thepopulation (they are, at least, the top-three-percent direct tax payers)11, it isquite natural to focus on the wealthiest decedents and to look whether theseindividuals appear on the franchise list of the year 1845. In other words, Iassume some wealth persistence over time. For each of the seven Parisianbureaux, I therefore decide to restrict to male decedents with real estate orat least 20,000 francs in non-real estate at death. Examining all decedentswith real estate maximizes the chances of finding, in the TSA, the franchisedParisian voters who paid taxes on Parisian real property in 1845. The20,000-franc threshold concerning non-real estate is not too restrictive, inmy opinion, because it is far lower than the 95th percentile of the Parisiandistribution of (real plus non-real) wealth at death, as calculated by Piketty,Postel-Vinay and Rosenthal ([2004], see the authors’ Table A2) for adultdecedents in 1847 (P95 is equal to 41,420 francs) and 1857 (59,030 francs)12.Besides, the 20,000-franc threshold is higher than the 90th percentile of theParisian distribution (7,662 francs in 1847 and 12,967 francs in 1857). Thus,the 20,000-franc threshold allows clearly for the observation of a relativelywide range of downward mobility trajectories.
A decedent’s estate being disaggregated by bureau (a disadvantage ofhaving a decentralized flat-rate taxation system for inheritance), collectingestate data from outside Paris would be an enormous task. In this article,observed wealth at death is limited to its Parisian part. In the case where thedecedent has a non-Parisian residence, non-real estate cannot be observed(see footnote 9). That is why I restrict my sample to individuals with aParisian residence at death. Moreover, since non-Parisian real estate is notobserved, one can think that a potentially sizeable part of wealth is left aside,especially for large landowners. Franchise Parisian lists may then be helpfulto have a rough idea of the proportion of non-Parisian estate because directtaxes are aggregated at national level for each franchised voter and electorallists indicate the breakdown by tax district13. On average, individuals in my
10. Even in the most unfavourable case where economic mobility for “explicit” nobles and“potential” nobles is zero, and on the assumption that economic mobility for non-nobles ishomogeneous across all letter groups, given the proportions of non-nobles in letter B group(97.1 percent) and in the whole electorate (95.7 percent), economic mobility as measured byletter B group would be only 1,46 percent higher (this result derives from the ratio of the twogiven proportions of non-nobles) than mobility as measured for the whole electorate.
11. I say a priori because moveable assets are not taken into account when calculatingdirect taxes.
12. The authors give, in Table A2, the top fractiles of wealth at death in Paris on a decadalbasis for the 19th century. The years 1847 and 1857 fall within my period of interest.
13. Here, it must be emphasized that the annual revision of electoral lists was a gigantictask for the administration. In each department, the prefect had the legal obligation to updatethe lists on the basis of the diverse rolls concerning the direct taxes paid nationwide byvoters. There were 100,000 such rolls for the franchised voters of the Seine departmentaccording to the prefect’s annual report (Rambuteau [1837]). The prefect also had to detectpotentially new voters and add them to the franchise lists.
692 — Once in the Elite, Always in the Elite? Changing Wealth in a Changing...
REP 126 (5) septembre-octobre 2016
Doc
umen
t tél
écha
rgé
depu
is w
ww
.cai
rn.in
fo -
Eco
le N
orm
ale
Sup
érie
ure
- P
aris
-
- 12
9.19
9.20
7.13
0 -
03/0
4/20
17 1
2h35
. © D
allo
z D
ocument téléchargé depuis w
ww
.cairn.info - Ecole N
ormale S
upérieure - Paris - - 129.199.207.130 - 03/04/2017 12h35. ©
Dalloz

long-term database14 paid, in 1845, 17 percent of their direct taxes in non-Parisian tax districts (concerning the tax on real property, the proportionrises to 21 percent). This non-negligible proportion will have to be taken intoconsideration when measuring economic mobility between 1845 and theyear of death of individuals.
There is another possible bias as regards collecting data on wealth atdeath. Given that the matching process between TSA and franchise lists iscarried out on the basis of each Parisian bureau taken separately15, wealth atdeath is biased downwards for decedents who have less than 20,000 francsin non-real estate in the Parisian bureau of their residence and no real estatein that bureau. However, the average decedent in my long-term databasehas 138,000 francs in non-real estate (out of a wealth at death of283,000 francs). The potential bias is therefore limited to only 7 percent ofthe average decedent’s observed wealth.
Data collection is limited to a well-defined time period too. Concerning myshort-term database (see footnote 14), I wanted to choose two consecutiveyears so as to measure economic mobility on an annual basis. In theArchives of Paris, I had at my disposal, for the July Monarchy, the franchiselists of the years 1842 and 1844 to 1847. I excluded the 1844 electoral listinsofar as the reform of the patente did have an immediate, strong impacton the composition of the franchised Parisian electorate, so that measuringeconomic mobility on the basis of the direct taxes paid by voters in 1844 and1845 would not be a good idea (necessity of an unchanged tax frameworkfor analysis). I excluded the 1847 electoral list too, inasmuch as the last yearsof the July Monarchy were marked by a severe economic (and political)crisis that led to the collapse of the regime in February 1848. The suffragewas then granted to all male citizens aged 21 or over. As a result of theseconsiderations, 1845-1846 is the only pair of consecutive years that provesto be satisfactory16.
Concerning the long-term database, I use TSA registers of the years 1845-1859. Thus, it must be kept in mind that the 1847-1848 crisis is possibly a factorof higher economic mobility. The period ends in 1859 because of the exten-sion of the limits of the City of Paris on January 1, 1860. Each of the nine newTSA bureaux covers two or three new Parisian arrondissements and thus gen-erally mixes parts of the former Parisian arrondissements with parts of the in-corporated suburbs. Given that for each decedent wealth at death is aggre-gated at bureau level (the only distinction is between real and non-real estate),TSA registers do not specify the value of real estate that is precisely located inthe former limits of Paris. This is problematic when it appears that for a given
14. Please keep in mind that the long-term database matches the 1845 franchise Parisianlist to the TSA Parisian registers of the years 1845 to 1859. The short-term database matchesthe franchise Parisian lists of the years 1845 and 1846.
15. TSA registers are not previously matched together before being matched to franchiselists. It would take a long time.
16. It could be nevertheless interesting to add the electoral list of the year 1847 to theanalysis so as to study short-term mobility in two different economic contexts. It would be ofparticular interest to see whether the crisis has an impact on mobility, as measured by directtaxes, and to what extent. However, concerning information on direct taxes, I restricted datacollection to the years 1845 and 1846. Detailed data collection for the year 1847 and thequestion of the impact of the 1847-1848 crisis are left for further research.
Jean-Brieux Delbos —————————————————————————————————————————————————— 693
REP 126 (5) septembre-octobre 2016
Doc
umen
t tél
écha
rgé
depu
is w
ww
.cai
rn.in
fo -
Eco
le N
orm
ale
Sup
érie
ure
- P
aris
-
- 12
9.19
9.20
7.13
0 -
03/0
4/20
17 1
2h35
. © D
allo
z D
ocument téléchargé depuis w
ww
.cairn.info - Ecole N
ormale S
upérieure - Paris - - 129.199.207.130 - 03/04/2017 12h35. ©
Dalloz

bureau a decedent has buildings or lands that are located on both sides of theformer limits of Paris. A quite tedious solution would be to open the declara-tions of succession of such post-1859 decedents.
Lastly, I would like to add here that matching individuals is far from beinga trivial operation (Delbos [2014]), especially when it comes to matchingfranchise lists and TSA. The process is complex and cannot be easily auto-mated since there are many elements of uncertainty, in particular as con-cerns the TSA registers. A decedent may have several first names but theTSA are generally not exhaustive, contrary to franchise lists. Father and sonmay have exactly the same first name. Brothers may have one of their firstnames in common. Besides, the spelling of surnames is not entirely fixedduring the 19th century. In addition to these issues, TSA registers maycontain some illegible words (information is hand-written), but numbers aregenerally easy to read. However, age at death, when indicated, may some-times be inaccurate. Finally, geographic (and, at the margin, occupational)mobility can also make the matching decision trickier.
Measuring economic mobility
My measures of both short- and long-term mobility do not fall within astandard framework. The measure of short-term mobility is based on amultidimensional proxy for wealth that adds four different types of tax.Moreover, direct taxes do not take into account either moveable assets orincome. As Tudesq [1958] put it, franchise lists provide indications on“acquired wealth” (i.e. lands, buildings, premises) rather than on “easy-to-mobilize wealth”. Thus, annual variations in the amount of direct taxes paidby an individual reveal downward and upward changes in structural terms:sale or purchase of real property, transfer or inheritance, entrance into activ-ity or retirement, patente-sharing between partners, expansion (or reduc-tion) of premises, change in the type of activity, changes concerning theresidence that impact on the contribution mobilière or the levy on doors andwindows, changes in marital status or family situation, etc17. There is clearlya tension between the very short time period of observation (one year) andthe nature of the underlying causes of observed changes. Here, moveableassets can be viewed as an unobserved buffer. Inasmuch as these moveableassets may act as buffer assets between observed structural changes, it ispossible that my measure of short-term mobility overestimates true eco-nomic mobility. This has to be kept in mind when interpreting the results.For all these reasons, it is preferable to rely on a relative rather than anabsolute measure of economic mobility. Because of the size of the short-term database (1,518 individuals), measuring movements in terms of quin-tile changes seems to be convenient.
17. Changes in the amount of direct taxes from one year to another may also be due to thecorrection of some erroneously printed or computed numbers or an exceptional delay inupdating a voter’s tax situation. In order to limit these problems, I use the tables of rectifi-cation that amended the electoral lists initially drawn up by the administration. There werefour semimonthly tables of rectification. For 1845, the last two are unfortunately missing.
694 — Once in the Elite, Always in the Elite? Changing Wealth in a Changing...
REP 126 (5) septembre-octobre 2016
Doc
umen
t tél
écha
rgé
depu
is w
ww
.cai
rn.in
fo -
Eco
le N
orm
ale
Sup
érie
ure
- P
aris
-
- 12
9.19
9.20
7.13
0 -
03/0
4/20
17 1
2h35
. © D
allo
z D
ocument téléchargé depuis w
ww
.cairn.info - Ecole N
ormale S
upérieure - Paris - - 129.199.207.130 - 03/04/2017 12h35. ©
Dalloz

As regards the measure of long-term mobility, I would like to highlight thedifferent dimensions of the discrepancy between the cens and wealth ob-served at death. Firstly, the direct taxes indicated in the franchise lists are ag-gregated at national level for each voter, whereas I observe wealth at death asonly indicated by the Parisian TSA. Nonetheless, Parisian wealth at deathmay, in part, derive from non-Parisian land revenues or business income or bedue to changes in the geographical composition of property (for instance, thesale of a voter’s country house one decade after 1845, so as to purchase a luxu-rious Haussmannian building in Paris). Secondly, a similar reasoning may ap-ply to the fact that moveable assets are not taken into account in the tax-basedvoting qualification. Non-real wealth at death may indeed derive from prop-erty revenues or business income, i.e. from a property or an activity that wassubject to direct taxation in the 1845 franchise lists. Thirdly, the 20,000-francthreshold in non-real estate introduces a downward bias in the measure ofwealth at death. On average, this bias is very limited but it might account for anon-negligible part of the fortune of the less wealthy individuals whom I col-lected in the TSA. Fourthly, because of the family dimension of the tax-basedfranchise, there is dissociation between the amount of direct taxes that aretaken into account in order to meet voting qualifications and an individual’sown wealth. The direct taxes that are indicated in the franchise lists do notnecessarily derive from a voter’s own property, but possibly from the del-egated direct taxes of other well-defined members of his family. Thus, forsome voters, the 1845 proxy for wealth – direct taxes as indicated in the fran-chise lists – tends to be biased upwards. This may impact on my measure ofindividual mobility. Unfortunately, franchise lists can be seen as a black boxwith respect to this issue. Despite these difficulties, it is necessary to explorethe data so as to decide whether the franchise lists provide a good proxy forindividual wealth or not.
3. Analyzing short-term mobility
Short-term mobility is measured by quintile change in the direct taxespaid by voters who are present in both the 1845 and 1846 franchise Parisianlists. Due to the 200-franc threshold that is inherent to the definition of thefranchise lists, changes in direct taxes cannot be observed for voters whomove into or out of the lists. Nevertheless, 90 percent of the individuals whoare in the 1845 Parisian lists are still present in 1846. Despite some sizeableeconomic and geographic yearly mobility, it is possible to observe changesin direct taxes for the vast majority of the 1845 Parisian voters. Short-termmobility shows some interesting features. Most voters (86 percent, see themain diagonal in Table 1a and the statistics of Table 1b) remain in the samequintile in 1845 and 1846 but, with a 14-percent rate change in quintiles, taxvolatility can be seen as high for a one-year period. There is both upwardand downward mobility. Three percent of individuals moved up or downtwo or more quintiles. Table 1a reveals a very regular mobility gradient: thebigger the change in quintile is, the less frequent it is. Table 1b shows thatthere is remarkable symmetry between upward and downward quintile
Jean-Brieux Delbos —————————————————————————————————————————————————— 695
REP 126 (5) septembre-octobre 2016
Doc
umen
t tél
écha
rgé
depu
is w
ww
.cai
rn.in
fo -
Eco
le N
orm
ale
Sup
érie
ure
- P
aris
-
- 12
9.19
9.20
7.13
0 -
03/0
4/20
17 1
2h35
. © D
allo
z D
ocument téléchargé depuis w
ww
.cairn.info - Ecole N
ormale S
upérieure - Paris - - 129.199.207.130 - 03/04/2017 12h35. ©
Dalloz

changes. These facts suggest the existence of random economic shocks thatshape the mobility trajectories of individuals.
It is important to underline here that the mobility I observe is not driven bysome problematical measurement error. For each individual, I have madesure that the total amount of direct taxes is correct and corrected it if nec-essary. Moreover, in order to work with correct direct tax amounts insofar aspossible, I have also used information from the two tables of rectificationthat are available for 1845 (see footnote 17). Lastly, quintile mobility is notdue to small changes around quintile limits. It can be observed that for 95percent of the individuals who change quintile between 1845 and 1846, theamount of direct taxes they pay increases or decreases by 10 francs or more(and respectively, for 75 percent of individuals, it changes by 50 francs ormore). Thus, threshold effects are very limited.
Table 1a. Short-term economic mobility of franchised Parisianvoters as measured by change in direct taxes between 1845
and 1846
Direct taxes 1846
Quintile limits 200-249 fr 250-344 fr 345-509 fr 510-838 fr 839-10,448 fr Total
Directtaxes1845
200-248 fr 265 30 9 2 0 306
249-343 fr 24 249 21 7 1 302
344-509 fr 6 21 247 23 6 303
510-839 fr 8 3 23 259 11 304
840-10,295 fr 1 2 2 13 285 303
Total 304 305 302 304 303 1,518
Table 1b. Mobility statistics related to Table 1a
Moved up 2 or more quintiles 1.6%
Moved up 7.2%
Same quintile 86.0%
Moved down 6.8%
Moved down 2 or more quintiles 1.4%
Mobility patterns may vary significantly across the group of franchisedvoters. The composition of the cens could have an impact on short-termmobility. In order to study this impact, and because of the heterogeneity ofthe economic composition of the franchised electorate, I divide this popula-tion into four subgroups according to the type of direct taxes that are paidby individuals. I take into consideration the two main components of thecens, namely the real property tax and the patente. Four subpopulations arethus defined by crossing two dummy variables: paying a real property tax
696 — Once in the Elite, Always in the Elite? Changing Wealth in a Changing...
REP 126 (5) septembre-octobre 2016
Doc
umen
t tél
écha
rgé
depu
is w
ww
.cai
rn.in
fo -
Eco
le N
orm
ale
Sup
érie
ure
- P
aris
-
- 12
9.19
9.20
7.13
0 -
03/0
4/20
17 1
2h35
. © D
allo
z D
ocument téléchargé depuis w
ww
.cairn.info - Ecole N
ormale S
upérieure - Paris - - 129.199.207.130 - 03/04/2017 12h35. ©
Dalloz

(or not) and paying a patente (or not). Voters who pay a real property tax areexpected to be more stable than voters who pay a patente insofar as thelatter is subject to the risks of economic competition, whereas the former isbased on land rent.
From a methodological point of view, I will compare mobility between sub-populations in terms of initial quintiles (i.e. the quintile limits defined in Table1a), but I will also have a look at within-mobility (with recomputed quintiles foreach group) since each subpopulation is not homogeneously distributedacross the quintiles of the year 1845, as shown in Table 2. The economic struc-ture of the 1845 electorate varies considerably across quintiles. The distribu-tion of voters who pay a real property tax but no patente exhibits a remarkablegradient. These voters account for only 23 percent of the individuals in the bot-tom quintile but for 70 percent in the top quintile. Concerning the voters whopay a patente but no real property tax, the gradient is reversed: they accountfor 61 percent of the individuals in the bottom quintile, but for 8 percent only inthe top quintile. Let me notice that qualified voters who pay neither a realproperty tax nor a patente are essentially present in the lower quintiles (theypay generally a quite huge contribution personnelle et mobiliere and some-times a considerable levy on doors and windows), but are very few (2 percentor so). All in all, the franchised Parisian electorate is very heterogeneous andthis must be kept in mind when it comes to studying its mobility. Using initialquintiles enables to observe the movements of a subpopulation in compari-son with the dynamic distribution of the whole population. Recalculatingquintiles for a given subpopulation enables to measure the within-mobility ofthat subpopulation. Both types of measure provide interesting and comple-mentary information about mobility.
Table 2. Structure of the 1845 Parisian electorate by quintile(statistics for voters present in both the 1845 and 1846 lists)
With initial quintiles
Real property tax in 1845 > 0 > 0 = 0 = 0
Patente in 1845 = 0 > 0 > 0 = 0
Quintilesof the
year 1845
200-248 fr (–––) 23.2% 13.7%(+++)
60.8%(++) 2.3%
249-343 fr (–––) 28.8% 18.2%(+++)
51.0%(+) 2.0%
(ref.) 344-509 fr 47.5% 15.5% 36.7% 0.3%
510-839 fr 50.3%(+++)
25.3%(–––)
24.4%0.0%
840-10,295 fr (+++) 70.0% (++) 22.4% (–––) 7.6% 0.0%
All quintiles 44.0% 19.0% 36.1% 0.9%
Subpopulation size 667 289 548 14
Comparisons with third quintile: *** statistically significant at the 1% risk level, ** sta-tistically significant at the 5% risk level, *statistically significant at the 10% risk level.The symbols + and – give the sign of comparison.
Jean-Brieux Delbos —————————————————————————————————————————————————— 697
REP 126 (5) septembre-octobre 2016
Doc
umen
t tél
écha
rgé
depu
is w
ww
.cai
rn.in
fo -
Eco
le N
orm
ale
Sup
érie
ure
- P
aris
-
- 12
9.19
9.20
7.13
0 -
03/0
4/20
17 1
2h35
. © D
allo
z D
ocument téléchargé depuis w
ww
.cairn.info - Ecole N
ormale S
upérieure - Paris - - 129.199.207.130 - 03/04/2017 12h35. ©
Dalloz

There are statistically significant differences in terms of mobility betweenthe four subpopulations that have been defined in Table 2. The results of Table3a suggest, as expected, that real property is linked to more stability, whereasthe patente tends to be associated with more downward and particularly up-ward mobility. 89 percent of the voters who pay a real property tax but no pat-ente in 1845 stay in the same quintile in 1846. About 83 percent of those pay-ing a patente remain stable (whether or not they pay a real property tax in1845). Voters who pay a patente but no real property tax move up more fre-quently (9 percent) than voters who pay a real property tax but no patente(about 6 percent). Given that voters who pay a patente but no real property taxtend to belong to the lowest quintiles in 1845 (see Table 2), they are more likelyto move up. Lastly, the few voters who do not pay either a real property tax ora patente belong to the lowest quintiles in 1845 and stay mostly (93 percent) inthe same quintile in 1846. Within-mobility calculations (Table 3b) suggest thatupward and downward movements for a given subpopulation are quite sym-metrical. Besides, a stability gradient becomes apparent (the proportion of in-dividuals who remain in the same quintile decreases significantly from thefirst- to the fourth-column subpopulation). However, although tempting, com-paring within-mobility would not be appropriate. For instance, the relativelyhigh within-mobility of voters who pay neither a real property nor a patentetax (only 79 percent stay in the same quintile) must not be overemphasizedinasmuch as absolute changes in the amount of their cens are generally verysmall and the granularity of the measure is, in the present case (quintiles for14 individuals), obviously too fine.
Table 3a. Short-term economic mobility for differentsubpopulations of the 1845 Parisian electorate
(with initial quintiles)
With initial quintiles
Real property tax in 1845 > 0 > 0 = 0 = 0
Patente in 1845 = 0 > 0 > 0 = 0
Subpopulation size 667 289 548 14
Moved up 2 or morequintiles
0.6% (++) 2.4% (+++) 2.6% 0.0%
Moved up 5.5% 7.6% (++) 9.1% 7.1%
Same quintile 89.0% (––) 83.4% (–––) 83.6% 92.9%
Moved down 5.5% (+) 9.0% 7.3% 0.0%
Moved down 2 or morequintiles
1.4% 1.4% 1.6% 0.0%
Comparisons with first-column subpopulation: *** statistically significant at the 1%risk level, ** statistically significant at the 5% risk level, *statistically significant at the10% risk level. The symbols + and – give the sign of comparison.
698 — Once in the Elite, Always in the Elite? Changing Wealth in a Changing...
REP 126 (5) septembre-octobre 2016
Doc
umen
t tél
écha
rgé
depu
is w
ww
.cai
rn.in
fo -
Eco
le N
orm
ale
Sup
érie
ure
- P
aris
-
- 12
9.19
9.20
7.13
0 -
03/0
4/20
17 1
2h35
. © D
allo
z D
ocument téléchargé depuis w
ww
.cairn.info - Ecole N
ormale S
upérieure - Paris - - 129.199.207.130 - 03/04/2017 12h35. ©
Dalloz

Table 3b. Short-term economic mobility for different
subpopulations of the 1845 Parisian electorate
(with recomputed quintiles)
With recomputed quintiles
Real property tax in 1845 > 0 > 0 = 0 = 0
Patente in 1845 = 0 > 0 > 0 = 0
Subpopulation size 667 289 548 14
Moved up 2 or morequintiles
0.8% 2.1% 3.1% 7.1%
Moved up 6.9% 8.0% 9.7% 7.1%
Same quintile 88.0% 83.4% 80.3% 78.6%
Moved down 5.1% 8.6% 10.0% 14.3%
Moved down 2 or morequintiles
2.1% 2.1% 2.6% 0.0%
Introducing an age variable into the analysis helps to understand theunderlying causes of mobility. In Figure 1, I observe quintile changesbetween 1845 and 1846 by age groups in 1845. Assuming that potentialgenerational effects do not alter the general aspect of the bar graphs, thefigure can be seen as an age profile for voters present in both the 1845 and1846 Parisian lists18. The mobility-age curve exhibits an inverted U-shapedpattern, with a maximum for the 35-44 age group. This result – which con-cerns voters present both in 1845 and 1846 – does not mean that mobility isnecessary low for individuals in the youngest age group or for individuals inolder age groups. There is, assuredly, high mobility for such age groups too,as is suggested by Delbos [2014], who shows that the mobility-age relation-ship in terms of movements into and out of the franchised Parisian elector-ate follows a U-shaped curve.
18. On the one hand, it must be kept in mind that this kind of age profile is neverthelessbiased inasmuch as the changes in the amount of direct taxes paid by the individuals whomoved out of the franchise Parisian lists in 1846 cannot, unfortunately, be known (and,conversely, for individuals who were not in the lists in 1845 but qualified as Parisian votersin 1846). On the other hand, it is also undoubtedly interesting to focus on analyzing themovements of the voters who manage to stay in the Parisian electorate.
Jean-Brieux Delbos —————————————————————————————————————————————————— 699
REP 126 (5) septembre-octobre 2016
Doc
umen
t tél
écha
rgé
depu
is w
ww
.cai
rn.in
fo -
Eco
le N
orm
ale
Sup
érie
ure
- P
aris
-
- 12
9.19
9.20
7.13
0 -
03/0
4/20
17 1
2h35
. © D
allo
z D
ocument téléchargé depuis w
ww
.cairn.info - Ecole N
ormale S
upérieure - Paris - - 129.199.207.130 - 03/04/2017 12h35. ©
Dalloz

Figure 1. Quintile changes over 1845-1846 by age groups in 1845
Figure 2a. Absolute changes in real property tax over 1845-1846
by age groups in 1845
700 — Once in the Elite, Always in the Elite? Changing Wealth in a Changing...
REP 126 (5) septembre-octobre 2016
Doc
umen
t tél
écha
rgé
depu
is w
ww
.cai
rn.in
fo -
Eco
le N
orm
ale
Sup
érie
ure
- P
aris
-
- 12
9.19
9.20
7.13
0 -
03/0
4/20
17 1
2h35
. © D
allo
z D
ocument téléchargé depuis w
ww
.cairn.info - Ecole N
ormale S
upérieure - Paris - - 129.199.207.130 - 03/04/2017 12h35. ©
Dalloz

The observation of absolute changes in the two main components of thecens (real property tax and patente)19 by age group sheds light on thedynamics at work. There is considerable difference between Figures 2a and2b. Concerning changes in patente (Figure 2b), movements are very smallfor the vast majority of individuals. For 82 percent of the voters (all agegroups taken together), the patente tax increased or decreased by less than10 francs (or remained at the same level) over the 1845-1846 period. Biggerchanges (10 francs or more) are more frequent at the beginning of thevoters’ life-cycle (around 22 percent for age groups 25-34 and 35-44), that isto say when voters are likely to start and run their business. For older agegroups, big changes in the amount of patente are less and less frequent,from 18 percent for the 45-54 age group to 2 percent for the 75-94 age group.Except for the oldest age group, for which big changes are only downwards(voters who were still in activity tend to retire from business), sizeablemovements are both upwards and downwards, with remarkable symme-try20, which suggests the hustle and bustle of economic life.
Figure 2a provides a very different picture. As opposed to what is observedfor patente movements, small changes (less than 10 francs) in the amount ofreal property tax between 1845 and 1846 become gradually less frequent asage groups get older, from 83 percent for the 25-34 age group to only 32 per-cent for the 75-94 age group. Moreover, there is no symmetry between up-ward and downward movements by 10 francs or more. Sizeable increases inthe amount of real property tax become gradually more frequent as agegroups get older, from 15 percent for the 25-34 age group to 64 percent for the
19. Changes in the amount of tax are given for the whole sample (1,518 individuals). Thismeans that calculated changes are not conditional on whether the voter pays a real propertytax or a patente.
20. The extent of downward changes is however underestimated since I observe onlyvoters who stay in the Parisian electorate in 1846.
Figure 2b. Absolute changes in patente over 1845-1846 by age
groups in 1845
Jean-Brieux Delbos —————————————————————————————————————————————————— 701
REP 126 (5) septembre-octobre 2016
Doc
umen
t tél
écha
rgé
depu
is w
ww
.cai
rn.in
fo -
Eco
le N
orm
ale
Sup
érie
ure
- P
aris
-
- 12
9.19
9.20
7.13
0 -
03/0
4/20
17 1
2h35
. © D
allo
z D
ocument téléchargé depuis w
ww
.cairn.info - Ecole N
ormale S
upérieure - Paris - - 129.199.207.130 - 03/04/2017 12h35. ©
Dalloz

75-94 age group. Although more and more frequent with age, increases in theamount of real property tax do not have a strong impact on quintile changes atolder ages (see Figure 1). Concerning big increases by 50 francs or more in theamount of real property tax, one can note two peaks, at age groups 45-54 and65-74. These peaks correspond presumably to early and normal retirementages, that is to say moments when the voters decide to convert their built-upcapital into real property so as to get prepared for their old age. Except for theoldest age group, sizable decreases in the amount of real property tax alsobecome gradually more frequent with age (from 3 percent for the 25-34 agegroup to 11 percent for the 65-74 age group, but only 5 percent for the 75-94age group). As compared with the frequency of sizeable increases in real prop-erty tax, this trend is relatively limited, all the more so as I observe only indi-viduals who stay in the Parisian electorate in 1846. While most individualsstrive hard to accumulate real property, or inherit, or benefit from the directtaxes paid by their spouse, some others sell a part of their real property formore liquid assets or maybe transfer it to family members.
Even though individuals are not followed year after year over their entirelife-cycle (do I observe one-shot changes or gradual changes in Figures 2aand 2b?), all these different elements suggest the portrait of a franchisedbourgeoisie whose ultimate horizon – for those who meet with economicsuccess or inherit – is accumulating real property, in accordance with thefamous injunction “Enrich yourselves!” expressed by Louis-Philippe’s min-ister François Guizot.
4. Analyzing long-term mobilityThis section is aimed at analyzing long-term mobility on the basis of the
voters found in the Parisian TSA between 1845 and 1859 with a Parisianaddress and a total wealth of 20,000 francs or more21. In order to measurelong-term mobility, I compare two different economic variables: the cens asindicated in the franchise lists of 1845 and wealth at death as collected in theParisian TSA. Because of the discrepancy between the cens and wealth, it isnot sure that I only measure “pure” economic mobility. This point will bediscussed in detail. Before proceeding to the analysis, it is necessary todescribe briefly the sample that results from matching the 1845 franchiseParisian lists with the Parisian TSA of the years 1845-185922.
The overall matching rate is almost 24 percent (see Table 4), i.e. 399 indi-viduals out of 1,681. This rate may seem low but, given data constraints,turns out to be satisfactory and makes it possible to perform a proper analy-sis of long-term mobility. The 24-percent matching rate is mainly explainedby the fact that post-1859 Parisian TSA are not included in the analysis
21. Wealth is measured in current French francs. There are two reasons for this. First,inflation was low during the 19th century and can be neglected (Bouvier [1997]). Second, itallows comparability over the period with works by other scholars (Piketty, Postel-Vinay andRosenthal [2004] and [2006] working paper).
22. Here, the objective is not to make an in-depth econometric analysis of the matchingrate (see Delbos [2014]) but to provide some descriptive statistics on the profile of the votersfound in the Parisian TSA.
702 — Once in the Elite, Always in the Elite? Changing Wealth in a Changing...
REP 126 (5) septembre-octobre 2016
Doc
umen
t tél
écha
rgé
depu
is w
ww
.cai
rn.in
fo -
Eco
le N
orm
ale
Sup
érie
ure
- P
aris
-
- 12
9.19
9.20
7.13
0 -
03/0
4/20
17 1
2h35
. © D
allo
z D
ocument téléchargé depuis w
ww
.cairn.info - Ecole N
ormale S
upérieure - Paris - - 129.199.207.130 - 03/04/2017 12h35. ©
Dalloz

insofar as the extension of Paris makes it tedious to calculate the value ofreal estate that is located precisely in former Parisian limits. The vast major-ity of voters from the oldest generation (78 percent of the 75-94 age class of1845) are found in the TSA, but only 5 percent of the youngest generation.Generational effects on the matching rate are very strong because the elites’life expectancy proves to be high: some franchised voters of the 1845 listscan be found at death in the TSA of the 1880s (and probably in the TSA oflater decades)23. The matching rate increases with the amount of real prop-erty tax that was paid in 1845, from 12 percent for voters who paid no realproperty tax to 40 percent for those who paid a tax of 800 francs or more.This result not only illustrates the strong link between real estate at deathand real property in 1845, but also the fact that older voters tend to havemore real property than younger generations.
Table 4. Statistics resulting from matching the franchise Parisianlists of the year 1845 with the Parisian TSA of the years 1845-1859
1845 variables found in TSA not foundin TSA matching rate
25-34 years old (–––) 2.5% 14.0% 5.3%
35-44 years old (–––) 12.1% 31.7% 10.6%
45-54 years old (–––) 24.3% 34.2% 18.1%
55-64 years old (+++) 29.8% 14.4% 39.3%
65-74 years old (+++) 20.8% 4.8% 57.6%
75-94 years old (+++) 10.5% 0.9% 77.8%
Real propertytax
0 fr (–––) 18.0% 42.9% 11.6%
1-199 fr 10.3% 12.1% 20.9%
200-399 fr 19.3% 17.0% 26.1%
400-799 fr (+++) 27.1% 15.9% 34.6%
800 fr and more (+++) 25.3% 12.1% 39.5%
Patente
0 fr (+++) 67.1% 38.5% 35.2%
1-149 fr 7.8% 9.8% 19.8%
150-199 fr (–––) 6.8% 12.3% 14.7%
200-299 fr (–––) 7.0% 19.0% 10.3%
300 fr and more (–––) 11.3% 20.4% 14.7%
Tax districtsonly Parisian 84.2% 82.1% 24.2%
not only Parisian 15.8% 17.9% 21.6%
Overall 23.7%
Size 399 1,282 1,681
Comparisons with second-column subpopulation: *** statistically significant at the 1%risk level, ** statistically significant at the 5% risk level, *statistically significant at the10% risk level. The symbols + and – give the sign of comparison.
23. According to Piketty, Postel-Vinay and Rosenthal ([2006] working paper, see theauthors’ Table 1), the average age at death for adult male individuals who belong to the topone percent of the distribution of Parisian wealth at death is 68 under the July Monarchy andthe Second Empire and then 71 over the 1870-1890 period.
Jean-Brieux Delbos —————————————————————————————————————————————————— 703
REP 126 (5) septembre-octobre 2016
Doc
umen
t tél
écha
rgé
depu
is w
ww
.cai
rn.in
fo -
Eco
le N
orm
ale
Sup
érie
ure
- P
aris
-
- 12
9.19
9.20
7.13
0 -
03/0
4/20
17 1
2h35
. © D
allo
z D
ocument téléchargé depuis w
ww
.cairn.info - Ecole N
ormale S
upérieure - Paris - - 129.199.207.130 - 03/04/2017 12h35. ©
Dalloz

Matching rates show an opposite pattern concerning the level of patentein 1845. 35 percent of voters who paid no patente are found in the TSA butonly 10 percent of those who paid a patente tax of 200-299 francs. Thematching rate goes back up to 15 percent for a patente tax of 300 francs ormore in 1845 but still remains at a significantly low level. The negativerelationship between the amount of patente and matching rates is due to thefact that younger voters are more likely to pay a patente than older ones.Moreover, this relationship also suggests that the patente is associated withvery diverse levels of wealth, not only because of the high volatility ofeconomic activities but also because the patente is silent on one’s businessfinancial health (the patente is not a tax on profits). Lastly, the matching rateof voters who pay direct taxes in districts that are located only in Paris is –as one would expect24 – higher than the matching rate of other voters, butthe difference (2.6 percentage points) is not statistically significant25.
Given that voters paying a patente tax (which is associated with moremobility) are underrepresented in the long-term database, whereas voterspaying a real property tax (which is associated with more stability) areoverrepresented, my measure of long-term mobility, all other things beingequal, may underestimate true economic mobility. However, there exist alsoopposite age effects due to data truncation. Because post-1859 TSA are notincluded in the analysis, the age distribution of the sample tends to bebiased toward two types of individuals: individuals who are particularly oldand individuals from younger generations who are likely to die earlier thanthe rest of their age cohorts. If such individuals tend to be in bad health, thecost of health care may lead to lower wealth accumulation compared tohealthy individuals and result in higher individual economic mobility. All inall, underestimation or overestimation of economic mobility could beexpected. However, given that young generations are only a very smallproportion of the sample and given that the elite’s high life expectancy maybe linked to favourable health conditions, it is likely that underestimationprevails over overestimation.
Thus, the results of Tables 5a and 5b most probably underestimate trueeconomic mobility. Long-term mobility, as described by quintile changes,shares some common features with short-term mobility, namely thedecreasing mobility gradient on both sides of the main diagonal and thesymmetry between upward and downward movements. Mobility over the1845-1859 period can be described by the matrix. Wealth at death condi-tional on the voting franchise seems difficult to predict. The main diagonal isnot very full: 35 percent of the 1845 voters are in the same quintile at death,32 percent moved up and 33 percent moved down. A quarter of votersmoved two or more quintiles. Because of the selection bias resulting fromdata collection and matching rules, quintile limits of the 1845 cens arehigher than those concerning the whole electorate. Given the discrepancy
24. One could think that voters who pay a part of their direct taxes outside Paris are morelikely to leave Paris and even get rid of their Parisian property. Here, it should be made clearagain that the long-term database contains only voters who have a Parisian address at death.
25. Nevertheless, running a standard probit regression of the effect of the variables inTable 4 on the matching probability shows that paying direct taxes in strictly Parisian districtshas a very significant positive effect.
704 — Once in the Elite, Always in the Elite? Changing Wealth in a Changing...
REP 126 (5) septembre-octobre 2016
Doc
umen
t tél
écha
rgé
depu
is w
ww
.cai
rn.in
fo -
Eco
le N
orm
ale
Sup
érie
ure
- P
aris
-
- 12
9.19
9.20
7.13
0 -
03/0
4/20
17 1
2h35
. © D
allo
z D
ocument téléchargé depuis w
ww
.cairn.info - Ecole N
ormale S
upérieure - Paris - - 129.199.207.130 - 03/04/2017 12h35. ©
Dalloz

between the cens and wealth, the rest of this article is aimed at disentan-gling “true” economic mobility from the effects of the difference in definitionbetween the tax-based voting franchise and wealth.
Table 5a. Long-term economic mobility of franchised Parisianvoters as measured by matching the electoral lists of the year 1845
with the Parisian TSA of the years 1845-1859
Parisian wealth at death
Quintile limits 20,220-67,399 fr
67,400-119,999 fr
120,000-207,540 fr
207,541-411,607 fr
411,608-3,697,350 fr Total
Directtaxes1845
201-296 fr 32 24 11 9 4 80
297-437 fr 20 25 16 10 9 80
438-622 fr 12 16 27 14 11 80
623-1,067 fr 7 12 21 21 19 80
1,068-10,295 fr 9 3 5 26 36 79
Total 80 80 80 80 79 399
Table 5b. Mobility statistics related to Table 5a
Moved up 2 or more quintiles 13.5%
Moved up 31.8%
Same quintile 35.4%
Moved down 32.8%
Moved down 2 or more quintiles 12.0%
Quintile limits of wealth at death show a very wide range of economicpositions. In 1845, the ratio between the richest and the poorest voter is 51in terms of direct taxes. At death – all dates of death between 1845 and 1859taken together –, the ratio is 183 in terms of Parisian wealth. The ratio of theratios results in a 3.6-fold increase. This increase is so high for a fifteen-yearperiod (and all the more so as the richest individual dies in 1848) that itmight reflect not only some long-run widening inequality among franchisedvoters but also – and maybe first and foremost – the difference in definitionbetween cens and wealth. For more robustness, instead of using extremevalues, I consider, in Table 6, the inter-decile ratio P90/P10 over the period.The inter-decile ratio is 6.5 for direct taxes paid in 1845 and 14.8 for wealthat death. The ratio of the ratios is 2.3. Because death does not occur in thesame year for all individuals, I calculate inter-decile ratios by three-yearperiods. Even in the first time period (1845-1847), there is a big differencebetween the inter-decile ratio for wealth at death (11.3) and the inter-decileratio for direct taxes in 1845 (4.8). The resulting 2.3-fold increase cannotpossibly be due to widening inequality over a very short time span of twoyears or less. What I observe here is the difference of measure between cens
Jean-Brieux Delbos —————————————————————————————————————————————————— 705
REP 126 (5) septembre-octobre 2016
Doc
umen
t tél
écha
rgé
depu
is w
ww
.cai
rn.in
fo -
Eco
le N
orm
ale
Sup
érie
ure
- P
aris
-
- 12
9.19
9.20
7.13
0 -
03/0
4/20
17 1
2h35
. © D
allo
z D
ocument téléchargé depuis w
ww
.cairn.info - Ecole N
ormale S
upérieure - Paris - - 129.199.207.130 - 03/04/2017 12h35. ©
Dalloz

and wealth. So as to eliminate, insofar as possible, the effects of the geo-graphic discrepancy between cens and wealth, Table 6 also shows inter-decile ratios restricted to the voters who paid in 1845 their direct taxes inParisian districts only. The difference of range between wealth (9.7) and cens(4.7) over the 1845-1847 period is very clear and may be mostly due to thefact that moveable assets are not directly taken into account in the votingfranchise, hence a supplementary factor of inequality. Subsequent periods inTable 6 show a steady increase in inter-decile ratios for wealth at death (from11.3 in 1845-1847, or 9.7 in the restricted case, to 20.8 in 1857-1859), whichwould suggest a dramatic rise in inequality over the period. However, indi-viduals only die once, so that wealth is not observed longitudinally over theperiod, which makes any further analysis difficult26.
Table 6. Inter-decile ratios P90/P10 for the cens in 1845
and wealth at death by time periods
Year of death by time period1845-1847
1848-1850
1851-1853
1854-1856
1857-1859
Allperiods
For all voters:
Inter-decile ratio for Parisianwealth at death
11.3 13.4 12.2 18.3 20.8 14.8
Inter-decile ratio for the censin 1845
4.8 8.3 5.6 6.0 7.1 6.5
Ratio of the ratios 2.3 1.6 2.2 3.1 2.9 2.3
Number of individuals 63 98 87 74 77 399
For voters who paid their direct taxes of the year 1845 in Parisian districtsonly:
Inter-decile ratio for Parisianwealth at death
9.7 12.2 13.7 15.8 20.8 14.8
Inter-decile ratio for the censin 1845
4.7 6.0 5.4 5.5 4.3 5.2
Ratio of the ratios 2.1 2.0 2.5 2.9 4.8 2.9
Number of individuals 53 76 77 64 66 336
26. The inter-decile ratio for the cens in 1845 could be seen as a correction factor whichtakes into account initial conditions. The evolution of the ratio of ratios between 1845 and1859 would then provide a very rough indication of the rise in inequality among Parisianvoters of the year 1845.
706 — Once in the Elite, Always in the Elite? Changing Wealth in a Changing...
REP 126 (5) septembre-octobre 2016
Doc
umen
t tél
écha
rgé
depu
is w
ww
.cai
rn.in
fo -
Eco
le N
orm
ale
Sup
érie
ure
- P
aris
-
- 12
9.19
9.20
7.13
0 -
03/0
4/20
17 1
2h35
. © D
allo
z D
ocument téléchargé depuis w
ww
.cairn.info - Ecole N
ormale S
upérieure - Paris - - 129.199.207.130 - 03/04/2017 12h35. ©
Dalloz

In terms of relative position at death, it must be underlined that the topquintile of my long-term database is equivalent to the top 0.5 percent(P99.5-100) of the whole distribution of Parisian wealth at death, as com-puted by Piketty, Postel-Vinay and Rosenthal ([2004], see the authors’ TableA2)27. The bottom quintile of my database corresponds to the percentilesaround P95.
The bottom quintile has a particular meaning because individuals whobelong to this quintile would have been very (or quite) unlikely to be quali-fied as voters in their year of death (had the restricted franchise survived theFrench Revolution of 1848), on the basis of their Parisian wealth as indicatedin the TSA. Let me focus on the real property tax and the (relatively) simpleexample of a real property owner. Here, my objective is to have an idea ofthe real property tax rate in order to calculate a rough equivalence scalebetween the Parisian amount of the 1845 real property tax and the assessedvalue of real estate income at death that is given by the Parisian TSA. Irestrict my long-term database to the years that are closest to the franchiselists (i.e. 1845-1847), so as to reduce – insofar as possible – economic mobil-ity and long-term fluctuations in the value of real property. I also take intoconsideration only individuals with non-zero real property tax in 1845 andnon-zero real estate at death, so as to rule out the most obvious cases ofeconomic mobility or added/delegated direct taxes from other family mem-bers. Then it is possible to obtain an estimate of the real property tax rate. Itis the coefficient from the zero-intercept linear regression of the Parisian realproperty tax on assessed real estate income (the regression is run on40 individuals). The estimated real property tax rate is 6.6 percent28. How-ever, this is an average, seeming rate. This is an average rate because thereal property tax depends on land classification. This is a seeming rate,because the family dimension of the voting franchise cannot be completelyeliminated: the 6.6-percent rate thus overestimates the “true” average realproperty tax rate. Nevertheless, the obtained equivalence scale suggeststhat a Parisian real property owner can qualify as a franchised voter – on thesole basis of his real property tax – if the value of all his real properties is60,000 francs or more29. This 60,000-franc threshold is an underestimate(since the 6.6-percent tax rate is an overestimate). Moreover, if the propertyowner has some moveable assets, he can easily cross the upper limit of thebottom quintile of wealth at death. All in all, from this point of view, belong-ing to the bottom quintile is clearly synonymous with moving out of thefranchised electorate.
However, the voting franchise is obviously far more than a real propertytax. The “piecemeal” nature of the franchise allows many non-landed indi-viduals to qualify as voters, which adds complexity to the analysis. So, thequestion is whether one-fifth (a substantial proportion) of the 1845 Parisian
27. I have compared the authors’ results for the years 1847 and 1857 with the quintilelimits I got for those years.
28. The 95-percent confidence interval for the coefficient is [5.6 percent, 7.6 percent]. TheR2 for the regression is high (0.83).
29. Calculation details: given that the estimated real property tax rate is 6.6 percent, a200-franc real property tax is equivalent to a 3,030-franc real estate income, that is to say areal property that is worth 60,606 francs (see footnote 8).
Jean-Brieux Delbos —————————————————————————————————————————————————— 707
REP 126 (5) septembre-octobre 2016
Doc
umen
t tél
écha
rgé
depu
is w
ww
.cai
rn.in
fo -
Eco
le N
orm
ale
Sup
érie
ure
- P
aris
-
- 12
9.19
9.20
7.13
0 -
03/0
4/20
17 1
2h35
. © D
allo
z D
ocument téléchargé depuis w
ww
.cairn.info - Ecole N
ormale S
upérieure - Paris - - 129.199.207.130 - 03/04/2017 12h35. ©
Dalloz

electorate has experienced real – or seeming – impoverishment, on the basisof my Parisian “observatory” of wealth at death. A close examination ofeach individual who finishes his life in the bottom quintile shows that theeconomic and geographic composition of the cens plays a great role. Theseindividuals can be classified into four broad categories.
Firstly, in more than 35 percent of cases, individuals paid a patente in 1845but no real property tax. For most of them, wealth at death consists only ofa small amount of moveable assets. Very few have acquired real propertysince 1845. These people were apparently not able to extract wealth fromtheir business. They owed their voting qualification to the patente, a tax thatis regardless of one’s business financial situation. Of course, it cannot beruled out that some of these individuals might have almost entirely spentthe hypothetical fortune they managed to amass over their post-1845 life-cycle. However, the relatively short time span between 1845 and deathreduces the significance of this kind of explanation.
Secondly, in 25 percent of cases, individuals do not leave any Parisianproperty at death, whereas they did pay a real property tax in Parisiandistricts in 1845. Such evolutions represent big shifts in the composition ofwealth. These voters might have sold all their Parisian properties but themoney from the sales seems to have vanished too. This would mean con-siderable impoverishment over a relatively short time period. Have some ofthese voters – who still reside in Paris at death – swapped their Parisian realproperties for buildings and lands in the suburbs or in the provinces? Thiscannot be ruled out completely. The total loss of Parisian real property couldalso result from inter vivos gifts. Last but not least, the family dimension ofthe Electoral Law could explain why some voters who paid a real propertytax in 1845 do not own any property at death. Their cens included the directtaxes of some members of their family. As a consequence, this fictitioussituation causes considerable seeming mobility.
Additionally, in another 15 percent of cases, voters seem to have lost asizeable part of their Parisian real property. Besides the above-mentionedtypes of explanations (sales, inter vivos gifts, added or delegated taxes), apartial loss in the amount of real property could also be due to a decline intheir market value. However, this type of explanation is very unlikely in thegeneral Parisian context of a steady increase in the market value of residen-tial property that was impaired only by the economic and political crisis ofthe years 1848-1850 (Daumard [1965]). It is not easy to gauge whether avoter has lost a part of his real properties, because I do not have any preciselist of the buildings and lands on the basis of which the real property tax isestablished in 1845. I have only at my disposal the list of the relevant taxdistricts without any further detail, since the real property tax is aggregatedat district level (a voter could own more than one building in a given dis-trict). So, one solution is to compare the Parisian amount of real property taxpaid in 1845 with the Parisian value of real estate left at death. More pre-cisely, if the ratio of real property tax to assessed real estate income isabnormally high in comparison with the previously estimated real propertytax rate (i.e. at least one and a third times higher than 6.6 percent), then Iconsider that there is a partial loss of property.
708 — Once in the Elite, Always in the Elite? Changing Wealth in a Changing...
REP 126 (5) septembre-octobre 2016
Doc
umen
t tél
écha
rgé
depu
is w
ww
.cai
rn.in
fo -
Eco
le N
orm
ale
Sup
érie
ure
- P
aris
-
- 12
9.19
9.20
7.13
0 -
03/0
4/20
17 1
2h35
. © D
allo
z D
ocument téléchargé depuis w
ww
.cairn.info - Ecole N
ormale S
upérieure - Paris - - 129.199.207.130 - 03/04/2017 12h35. ©
Dalloz
Thirdly, in 10 percent of cases, individuals paid their real property tax innon-Parisian districts only. In Parisian districts, the amount of the other taxesthey paid was generally small. Since the TSA do not aggregate a decedent’swealth at national level (contrary to the cens), this discrepancy results in theseeming impoverishment of landowners whose Parisian wealth at death isessentially reduced to a very low amount of moveable assets, whereas theirnationwide wealth might consist largely of unobserved provincial property.
Fourthly, in the remaining cases, situations are very diverse. The individu-als in question managed to qualify as voters in 1845 because their “piece-meal” franchise was made up of various direct taxes in small amounts. Forinstance, some of these members of the petty bourgeoisie both ran a medio-cre business and had some Parisian property. In such conditions, it wasdifficult for them to escape from the lowest quintiles. Their wealth at deathconsists generally of a mix of real estate and moveable assets in very mod-est amounts too.
Among voters who are in the top quintile of wealth at death, less than ahalf (46 percent) were in the top quintile in 1845. This suggests that accessto the top elite group was not restricted to a few privileged individuals or, atleast, that top fortunes were very volatile. But this high mobility could alsobe due in part to the difference in definition between cens and wealth. Inorder to disentangle these effects, I study the characteristics of individualswho were in the top quintile, according to whether they moved into, orremained in, or moved out of that quintile, and compare them to individualswho were in the bottom quintile. Despite the small number of observations,the figures shown in Table 7 lead to interesting conclusions when taken as awhole. The vast majority of individuals in the top quintile of wealth at deathhave Parisian real estate, be it in 1845 (81 percent on average) or at death (85percent), with almost no difference at death between individuals who werealready in the top quintile in 1845 and those who were not. From this pointof view, the top quintile of wealth at death is much more homogeneous thanthe bottom quintile, in which half of individuals paid a real property tax inParisian districts in 1845 and less than one-third (29 percent on average)have real estate at death. Concerning the acquisition and (total) loss ofParisian real property, there are clearly divergent paths between the twoextreme quintiles of wealth at death.
Jean-Brieux Delbos —————————————————————————————————————————————————— 709
REP 126 (5) septembre-octobre 2016
Doc
umen
t tél
écha
rgé
depu
is w
ww
.cai
rn.in
fo -
Eco
le N
orm
ale
Sup
érie
ure
- P
aris
-
- 12
9.19
9.20
7.13
0 -
03/0
4/20
17 1
2h35
. © D
allo
z D
ocument téléchargé depuis w
ww
.cairn.info - Ecole N
ormale S
upérieure - Paris - - 129.199.207.130 - 03/04/2017 12h35. ©
Dalloz

Ta
ble
7.
Mo
ve
me
nts
into
an
do
ut
of
ex
tre
me
qu
inti
les
be
twe
en
18
45
an
dd
ea
th
Bo
tto
mq
uin
tile
Top
qu
inti
le
Mo
vein
Rem
ain
inM
ove
ou
tM
ove
inR
emai
nin
Mo
veo
ut
Su
bp
op
ula
tio
nsi
ze48
3248
4336
43
Pay
aP
aris
ian
real
pro
per
tyta
xin
1845
48%
53%
56%
77%
86%
77%
Hav
eac
qu
ired
Par
isia
nre
alp
rop
erty
sin
ce18
454%
9%15
%12
%6%
7%
Hav
elo
stal
lPar
isia
nre
alp
rop
erti
essi
nce
1845
33%
19%
4%2%
8%23
%
Hav
eP
aris
ian
real
esta
teat
dea
th19
%44
%67
%86
%83
%60
%
Ave
rag
eam
ou
nt
of
no
n-r
eale
stat
eat
dea
th35
,869
22,3
2112
9,39
742
8,12
646
2,75
888
,689
Ave
rag
eam
ou
nt
of
(Par
isia
n)
real
esta
teat
dea
th6,
957
17,3
8576
,334
315,
161
502,
722
125,
952
Hav
em
ore
Par
isia
nre
alp
rop
erty
atd
eath
*4%
13%
42%
58%
36%
9%
Par
isia
nre
alp
rop
erty
isst
able
*0%
16%
21%
23%
25%
19%
Par
isia
nre
alp
rop
erty
isal
way
sze
ro48
%38
%29
%12
%8%
16%
Hav
ele
ssP
aris
ian
real
pro
per
tyat
dea
th*
48%
34%
8%7%
31%
56%
Pay
are
alp
rop
erty
tax
inn
on
-Par
isia
nd
istr
icts
in18
4519
%9%
6%7%
33%
40%
Avg
.sh
are
of
no
n-P
aris
ian
real
pro
per
tyta
xin
cen
s**
69%
65%
52%
35%
55%
67%
Pay
ap
aten
teta
xin
1845
52%
59%
44%
30%
19%
16%
Ave
rag
eag
ein
1845
55.9
51.1
54.9
58.1
59.7
63.6
Ave
rag
eag
eat
dea
th61
.858
.063
.367
.766
.769
.2
Ave
rag
elif
esp
anfr
om
1845
toth
eye
aro
fd
eath
5.9
6.9
8.4
9.6
7.0
5.6
Per
cen
tag
esm
ayn
ot
add
du
eto
rou
nd
ing
.*
Ino
rder
tod
eter
min
ew
het
her
anin
div
idu
alh
asm
ore
or
less
Par
isia
nre
alp
rop
erty
atd
eath
than
in18
45,t
he
rati
oo
fth
ere
alp
rop
erty
tax
pai
din
Par
isia
nd
istr
icts
in18
45to
asse
ssed
real
esta
tein
com
eat
dea
this
com
par
edw
ith
the
esti
mat
edre
alp
rop
erty
tax
rate
(6.6
per
cen
t).
Ifth
ere
isan
up
war
do
rd
ow
nw
ard
chan
ge
by
less
than
on
eth
ird
,th
enI
con
sid
erth
atth
ere
isst
abili
ty.
**S
har
esar
eca
lcu
late
do
nth
eb
asis
of
ind
ivid
ual
sw
ho
pay
are
alp
rop
erty
tax
inn
on
-Par
isia
nd
istr
icts
.
710 — Once in the Elite, Always in the Elite? Changing Wealth in a Changing...
REP 126 (5) septembre-octobre 2016
Doc
umen
t tél
écha
rgé
depu
is w
ww
.cai
rn.in
fo -
Eco
le N
orm
ale
Sup
érie
ure
- P
aris
-
- 12
9.19
9.20
7.13
0 -
03/0
4/20
17 1
2h35
. © D
allo
z D
ocument téléchargé depuis w
ww
.cairn.info - Ecole N
ormale S
upérieure - Paris - - 129.199.207.130 - 03/04/2017 12h35. ©
Dalloz

Strikingly enough, individuals who move out of the top quintile are muchless wealthy – in terms of both real and non-real estate – than individualsmoving into or staying in the top quintile at death. The difference is so largethat it must be explained, at least in part, by the discrepancy between directtaxes and wealth. This is suggested by several facts.
Firstly, the average level of non-real estate for individuals who moveout of the top quintile is particularly low (about 89,000 francs) comparedwith the corresponding level for those in the top quintile at death(444,000 francs). A hypothesis could be that these individuals really lost asubstantial part of their Parisian wealth or converted it to unobserved non-Parisian real estate. But it is also possible that these individuals already hadsmall amounts of moveable assets in 1845. Conversely, individuals whomove into the top quintile at death tend to catch up with individuals whowere already in the top quintile in 1845 (respectively 428,000 francs in non-real estate versus 463,000 francs). Actually, individuals from the three lowestquintiles in 1845 even have more non-real estate at death (571,000 francs onaverage) than individuals who were already in the top quintile in 1845. Thisis not the case for real estate. All these observations suggest that some ofthe individuals who move into the top quintile at death had presumablylarge amounts of moveable assets already in 1845 and did not belong tohigher quintiles at that date because the voting franchise does not takemoveable assets into account.
Secondly, concerning non-Parisian real property in 1845, a double effect isnoticeable. Not only did individuals moving out of the top quintile pay a realproperty tax in non-Parisian districts more frequently than individuals mov-ing into that quintile (40 percent versus 7 percent), but the share of thenon-Parisian real property tax in the total cens of individuals paying such atax was also higher (respectively 67 percent versus 35 percent). This patternis reversed for movements into and out of the bottom quintile. A sizeablepart of the wealth of individuals moving out of the top quintile or movinginto the bottom quintile is most probably located outside my Parisian“observatory” of wealth at death, thus resulting in seeming downwardmobility. More generally, Table 8 shows that there is considerable downwardmobility for individuals who paid all or part of their real property tax innon-Parisian districts in 1845. In particular, among individuals paying theirreal property tax in strictly non-Parisian districts, nearly half of them(48.6 percent) moved to a lower quintile and more than one quarter(28.6 percent) moved down two or more quintiles30. Here, it should also benoted that restricting the population to voters who paid their real propertytaxes in Parisian districts only leads to mobility results (61 percent) that areslightly lower than statistics in Table 5b (65 percent). However, even though
30. Given that non-Parisian real estate is unobserved at death, one might think that remo-ving the non-Parisian amount of the direct taxes paid in 1845 would correct for this discre-pancy. Actually, that is not a good idea. Recalculating the quintiles of the year 1845 on thebasis of the direct taxes paid in Parisian districts leads to massive upward mobility forindividuals who paid their real property tax in strictly non-Parisian districts in 1845 (69percent move up, 46 percent move up two or more quintiles). Seeming upward mobility isdue to the fact that the Parisian direct taxes paid in 1845 by these individuals are quite smallin comparison with the taxes paid by other individuals and that their non-real property,which is only taken into account at death, is not negligible.
Jean-Brieux Delbos —————————————————————————————————————————————————— 711
REP 126 (5) septembre-octobre 2016
Doc
umen
t tél
écha
rgé
depu
is w
ww
.cai
rn.in
fo -
Eco
le N
orm
ale
Sup
érie
ure
- P
aris
-
- 12
9.19
9.20
7.13
0 -
03/0
4/20
17 1
2h35
. © D
allo
z D
ocument téléchargé depuis w
ww
.cairn.info - Ecole N
ormale S
upérieure - Paris - - 129.199.207.130 - 03/04/2017 12h35. ©
Dalloz
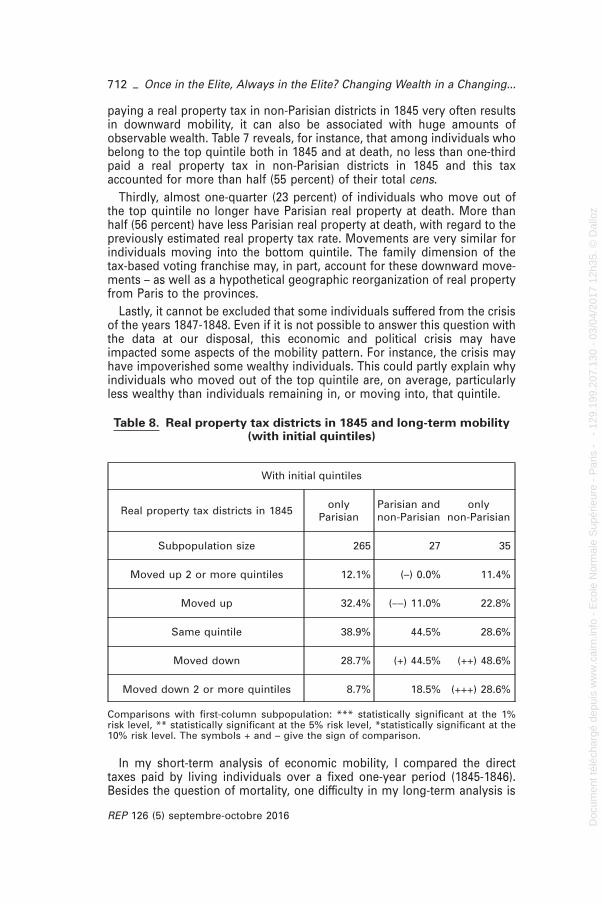
paying a real property tax in non-Parisian districts in 1845 very often resultsin downward mobility, it can also be associated with huge amounts ofobservable wealth. Table 7 reveals, for instance, that among individuals whobelong to the top quintile both in 1845 and at death, no less than one-thirdpaid a real property tax in non-Parisian districts in 1845 and this taxaccounted for more than half (55 percent) of their total cens.
Thirdly, almost one-quarter (23 percent) of individuals who move out ofthe top quintile no longer have Parisian real property at death. More thanhalf (56 percent) have less Parisian real property at death, with regard to thepreviously estimated real property tax rate. Movements are very similar forindividuals moving into the bottom quintile. The family dimension of thetax-based voting franchise may, in part, account for these downward move-ments – as well as a hypothetical geographic reorganization of real propertyfrom Paris to the provinces.
Lastly, it cannot be excluded that some individuals suffered from the crisisof the years 1847-1848. Even if it is not possible to answer this question withthe data at our disposal, this economic and political crisis may haveimpacted some aspects of the mobility pattern. For instance, the crisis mayhave impoverished some wealthy individuals. This could partly explain whyindividuals who moved out of the top quintile are, on average, particularlyless wealthy than individuals remaining in, or moving into, that quintile.
Table 8. Real property tax districts in 1845 and long-term mobility(with initial quintiles)
With initial quintiles
Real property tax districts in 1845only
ParisianParisian andnon-Parisian
onlynon-Parisian
Subpopulation size 265 27 35
Moved up 2 or more quintiles 12.1% (–) 0.0% 11.4%
Moved up 32.4% (––) 11.0% 22.8%
Same quintile 38.9% 44.5% 28.6%
Moved down 28.7% (+) 44.5% (++) 48.6%
Moved down 2 or more quintiles 8.7% 18.5% (+++) 28.6%
Comparisons with first-column subpopulation: *** statistically significant at the 1%risk level, ** statistically significant at the 5% risk level, *statistically significant at the10% risk level. The symbols + and – give the sign of comparison.
In my short-term analysis of economic mobility, I compared the directtaxes paid by living individuals over a fixed one-year period (1845-1846).Besides the question of mortality, one difficulty in my long-term analysis is
712 — Once in the Elite, Always in the Elite? Changing Wealth in a Changing...
REP 126 (5) septembre-octobre 2016
Doc
umen
t tél
écha
rgé
depu
is w
ww
.cai
rn.in
fo -
Eco
le N
orm
ale
Sup
érie
ure
- P
aris
-
- 12
9.19
9.20
7.13
0 -
03/0
4/20
17 1
2h35
. © D
allo
z D
ocument téléchargé depuis w
ww
.cairn.info - Ecole N
ormale S
upérieure - Paris - - 129.199.207.130 - 03/04/2017 12h35. ©
Dalloz

the fact that the year of death is not the same for each individual and thatthe position in the life-cycle in 1845 varies from an individual to the other.This variability is of great interest but, in my long-term database, there areonly a handful of individuals within each cell defined by crossing generationand year of death. In order to use standard econometric techniques (as inAuten and Gee [2009], or Hochguertel and Ohlsson [2012]), an ideal data setwould consist either of (a) many individuals whose years of death are iden-tical or (b) many individuals belonging to the same generation in 1845. In thecase (a), one would observe the economic mobility of individuals from allgenerations over a fixed time period. In the case (b), one would study themobility and mortality factors of a given generation over time, whatever theyears of death might be. The operations described in cases (a) and (b) couldthen be repeated for different years of death or generations in order to havesome comparability. Unfortunately, building such data sets would be par-ticularly time-consuming and is therefore left for potential further economet-ric research.
Table 7 shows that age and time interact with the measure of mobility.Individuals in the bottom quintile in 1845 tend to be younger than individu-als in the top quintile, which reflects different positions in the life-cycle. Theaverage age at death seems to depend on wealth: it is higher for individualswho were in the top quintile in 1845 and for newcomers to that quintile.Conversely, individuals who are always in the bottom quintile have thelowest average age at death. So, there seems to be a noticeable relationshipbetween economic mobility, living conditions and mortality. Lastly, a longerlife span between 1845 and death is clearly associated with individuals whomove into the top quintile or out of the bottom quintile. This upward mobil-ity is due in part to the fact that the average level of wealth at death ofindividuals is increasing over the time period of analysis, from about134,000 francs in 1845 to 464,000 francs in 1859. As a consequence of defin-ing quintiles of wealth at death over a time period and not a single year,individuals who belong to the top quintile at death are more and moreoverrepresented over time (see Table 9), hence increasing upward mobilityover time (Table 10).
Jean-Brieux Delbos —————————————————————————————————————————————————— 713
REP 126 (5) septembre-octobre 2016
Doc
umen
t tél
écha
rgé
depu
is w
ww
.cai
rn.in
fo -
Eco
le N
orm
ale
Sup
érie
ure
- P
aris
-
- 12
9.19
9.20
7.13
0 -
03/0
4/20
17 1
2h35
. © D
allo
z D
ocument téléchargé depuis w
ww
.cairn.info - Ecole N
ormale S
upérieure - Paris - - 129.199.207.130 - 03/04/2017 12h35. ©
Dalloz

Table 9. Structure of the wealth distributionat death by time periods
With initial quintiles
Year of death by time period1845-1849
1850-1854
1855-1859All
periods
Quintilesof wealthat death
20,220-67,399 fr 25.6% 20.8% (––) 13.1% 20.0%
67,400-119,999 fr 21.0% 21.5% 17.2% 20.0%
120,000-207,540 fr 21.8% 19.4% 18.9% 20.0%
207,541-411,607 fr 18.1% 20.2% 22.1% 20.0%
411,608-3,697,350 fr 13.5% 18.1% (+++) 28.7% 20.0%
Subpopulation size 133 144 122 399
Comparisons with first-column subpopulation: *** statistically significant at the 1%risk level, ** statistically significant at the 5% risk level, *statistically significant at the10% risk level. The symbols + and – give the sign of comparison.
Table 10. Long-term economic mobility subdivided by time periods(with initial quintiles)
With initial quintiles
Year of death by timeperiod
1845-1849 1850-1854 1855-1859
Subpopulation size 133 144 122
Moved up 2 or morequintiles
6.8% 10.4% (+++) 24.6%
Moved up 21.8% 27.1% (+++) 48.4%
Same quintile 35.3% 36.8% 33.6%
Moved down 42.9% 36.1% (–––) 18.0%
Moved down 2 or morequintiles
14.3% 15.3% (––) 5.7%
Comparisons with first-column subpopulation: *** statistically significant at the 1%risk level, ** statistically significant at the 5% risk level, * statistically significant at the10% risk level. The symbols + and – give the sign of comparison.
So as to analyze more precisely the effects of time on mobility and wealth,I conclude my exploration of economic mobility with a complementarystudy of how the structure of wealth is changing over time. Table 11 pre-sents linear correlations between the direct taxes paid in 1845 and Parisian
714 — Once in the Elite, Always in the Elite? Changing Wealth in a Changing...
REP 126 (5) septembre-octobre 2016
Doc
umen
t tél
écha
rgé
depu
is w
ww
.cai
rn.in
fo -
Eco
le N
orm
ale
Sup
érie
ure
- P
aris
-
- 12
9.19
9.20
7.13
0 -
03/0
4/20
17 1
2h35
. © D
allo
z D
ocument téléchargé depuis w
ww
.cairn.info - Ecole N
ormale S
upérieure - Paris - - 129.199.207.130 - 03/04/2017 12h35. ©
Dalloz
wealth at death for different five-year periods. I use linear correlationsbecause I expect a linear relationship between direct taxes and wealth, espe-cially for real property. Whereas economic mobility between 1845 and deathis observed longitudinally, this is not the case for the evolution of correla-tions over time, since individuals only die once. However, the results shownin Table 11 are very suggestive of what could be the strength of the linkbetween direct taxes and wealth for the same individual over time.
The correlation between the cens paid in 1845 and Parisian wealth atdeath is 0.43 in the first sub-period (1845-1849), which can be considered afair correlation. This correlation, calculated over a five-year period, is farlower than the yearly correlation of 0.92 between the direct taxes paid in1845 and 1846, which would tend to suggest the discrepancy between censand wealth. Moreover, this correlation does not change much over timewhereas I would have expected a decrease in correlation. In order to high-light increasing change in the structure of wealth over time, it is necessary tofocus on each of the components of the cens in 1845 and wealth at death.The correlation between the cens in 1845 and real estate at death tend todecrease over time, from 0.45 in 1845-1849 to 0.32 in 1855-1859. This trendis obviously driven by the main component of the cens, namely the realproperty tax. The correlation between this variable and real estate at deathdecreases from 0.54 to 0.31. Correlations involving non-real estate at deathshow that there is a positive link between this variable and the total cens(and the real property tax too). The correlation coefficients are significant butquite low. This result is consistent with the fact that non-real property is nottaken into account in the voting franchise. The cens reflects only partiallynon-real property. Concerning the patente tax, the correlation with non-realestate is good over the 1845-1849 period (0.41, or 0.54 when individuals whopaid no patente in 1845 are removed) but tend to vanish in subsequentperiods, which underlines the volatility of industrial and commercial activi-ties. Lastly, there is a significant negative correlation between the patentetax paid in 1845 and real estate at death over the two first time periods(1845-1849 and 1850-1854). This negative relationship between patente andreal estate shows that individuals who run a business do not have largeamounts of real property and may acquire more real property only later on(the correlation is almost zero in the last time period). When individuals whodid not pay any patente tax in 1845 are removed from correlation calcula-tions, there is no link between the level of patente in 1845 and the amount ofreal estate at death.
Jean-Brieux Delbos —————————————————————————————————————————————————— 715
REP 126 (5) septembre-octobre 2016
Doc
umen
t tél
écha
rgé
depu
is w
ww
.cai
rn.in
fo -
Eco
le N
orm
ale
Sup
érie
ure
- P
aris
-
- 12
9.19
9.20
7.13
0 -
03/0
4/20
17 1
2h35
. © D
allo
z D
ocument téléchargé depuis w
ww
.cairn.info - Ecole N
ormale S
upérieure - Paris - - 129.199.207.130 - 03/04/2017 12h35. ©
Dalloz

Ta
ble
11
.L
ine
ar
co
rre
lati
on
sb
etw
ee
nth
ece
ns
an
dP
ari
sia
nw
ea
lth
at
de
ath
by
tim
ep
eri
od
s
Wea
lth
No
n-r
lR
eal
Wea
lth
No
n-r
lR
eal
Wea
lth
No
n-r
lR
eal
Year
of
dea
thb
yti
me
per
iod
1845
-184
918
50-1
854
1855
-185
9
Co
rrel
atio
ns
calc
ula
ted
on
the
bas
iso
fal
lin
div
idu
als
wh
od
ied
inth
ein
dic
ated
tim
ep
erio
d
Cen
s18
45**
*0.4
3**
*0.2
8**
*0.4
5**
*0.4
6**
*0.3
0**
*0.3
7**
*0.3
8**
*0.2
9**
*0.3
2
Rea
lp
rop
erty
tax
1845
***0
.39
**0.
21**
*0.5
4**
*0.4
6**
*0.2
6**
*0.4
0**
*0.3
5**
*0.2
4**
*0.3
1
Pat
ente
1845
***0
.31
***0
.41
*–0.
15–
0.12
0.02
**–
0.18
0.03
0.03
0.01
Par
isia
nce
ns
1845
***0
.65
***0
.42
***0
.71
***0
.46
0.10
***0
.55
***0
.39
*0.1
6**
*0.4
5
Par
isia
nre
alp
rop
erty
tax
1845
***0
.53
***0
.26
***0
.77
***0
.45
0.06
***0
.57
***0
.34
0.12
***0
.42
Par
isia
np
aten
te18
45**
*0.3
1**
*0.4
1*–
0.15
–0.
130.
02**
–0.
200.
030.
030.
01
No
n-P
aris
ian
real
pro
per
tyta
x18
450.
050.
040.
04*0
.15
***0
.29
–0.
060.
09**
*0.2
6–
0.11
Co
rrel
atio
ns
con
dit
ion
alo
nin
div
idu
als
wh
op
aid
ast
rict
lyp
osi
tive
tax
in18
45
Rea
lp
rop
erty
tax
1845
***0
.37
**0.
21**
*0.4
8**
*0.4
7**
*0.3
9**
*0.3
3**
*0.3
6**
*0.3
2**
*0.2
6
Pat
ente
1845
***0
.56
***0
.54
0.13
–0.
08–
0.09
–0.
020.
21**
0.33
0.09
Par
isia
nre
alp
rop
erty
tax
1845
***0
.57
***0
.32
***0
.77
***0
.49
**0.
24**
*0.4
8**
*0.3
6**
0.21
***0
.37
Par
isia
np
aten
te18
45**
*0.5
6**
*0.5
40.
13–
0.10
–0.
09–
0.07
0.21
**0.
320.
09
No
n-P
aris
ian
real
pro
per
tyta
x18
450.
320.
280.
20**
0.52
***0
.64
–0.
030.
42**
0.68
–0.
29
No
n-r
l=
No
n-r
eal
esta
te,
Rea
l=
Rea
les
tate
Sig
nifi
can
ceo
fP
ears
on
corr
elat
ion
coef
ficie
nts
:**
*st
atis
tica
llysi
gn
ifica
nt
atth
e1%
risk
leve
l,**
stat
isti
cally
sig
nifi
can
tat
the
5%ri
skle
vel,
*st
atis
tica
llysi
gn
ifica
nt
atth
e10
%ri
skle
vel.
716 — Once in the Elite, Always in the Elite? Changing Wealth in a Changing...
REP 126 (5) septembre-octobre 2016
Doc
umen
t tél
écha
rgé
depu
is w
ww
.cai
rn.in
fo -
Eco
le N
orm
ale
Sup
érie
ure
- P
aris
-
- 12
9.19
9.20
7.13
0 -
03/0
4/20
17 1
2h35
. © D
allo
z D
ocument téléchargé depuis w
ww
.cairn.info - Ecole N
ormale S
upérieure - Paris - - 129.199.207.130 - 03/04/2017 12h35. ©
Dalloz

When the geography of the tax districts in which the voters paid theirdirect taxes in 1845 is taken into account, results are even clearer. Thecorrelation between the Parisian part of the cens and (Parisian) wealth atdeath is quite substantial in the first sub-period (0.65) and then decreasesover time (down to 0.39). The correlation between the Parisian real propertytax paid in 1845 and real estate at death follows a similar pattern, from aremarkably high correlation of 0.77 in the first sub-period (in spite of thefamily dimension of the voting franchise that interferes with my attempt tomeasure true economic mobility) down to 0.42 in the last sub-period. Con-cerning correlations with the Parisian part of the patente tax, there is almostno difference in comparison with previous results because the patente tax isessentially paid in Parisian districts (there is a close geographical connectionbetween residence and industrial or commercial activities). Correlationsbetween non-real estate at death and each of the Parisian components of thedirect taxes paid in 1845 shows that the link between non-real estate andthese variables is temporary and tends to diminish with time. Lastly, a lookat the non-Parisian part of the real property tax paid in 1845 reveals a quitesubstantial correlation with non-real estate at death (except for the firstsub-period – the reasons for this are unclear), which confirms that non-realestate at death derives, in part, from non-Parisian land revenues.
5. Conclusion
Cens and wealth do not have the same structure but the discrepancybetween these two variables should not be overemphasized. Under someconditions, the level of cens given in the electoral franchise lists – or, at least,its different components – can be regarded as an interesting proxy forwealth. Within the framework of a Parisian observatory of wealth, particularattention must be paid to the non-Parisian direct taxes because they suggestthat a substantial part of wealth at death is likely to be unobserved. If thetime period between the observation of the direct taxes and wealth at deathis short (i.e. no more than five years or so), non-real estate at death remainsrelatively well correlated with the different components of the tax-basedvoting franchise. However, defining an equivalence scale between directtaxes and non-real property would not be self-evident. Most importantly, thefranchise lists and the TSA are quite precious when it comes to studyingshifts, especially changes in the amount of (Parisian) real property over time.Despite the difference in definition between cens and wealth, the data setproves to be quite consistent, as is suggested not only by the study ofcorrelations over time and the description of the movements of voters intoand out of extreme quintiles, but also by the parallel that can be drawnbetween short-term and long-term mobility31. Nevertheless, the fact thatthere is consistency does not mean that the study of long-term mobility on
31. It should be noted here that studying long-term mobility on the basis of the franchiselists of several successive years could be fruitful.
Jean-Brieux Delbos —————————————————————————————————————————————————— 717
REP 126 (5) septembre-octobre 2016
Doc
umen
t tél
écha
rgé
depu
is w
ww
.cai
rn.in
fo -
Eco
le N
orm
ale
Sup
érie
ure
- P
aris
-
- 12
9.19
9.20
7.13
0 -
03/0
4/20
17 1
2h35
. © D
allo
z D
ocument téléchargé depuis w
ww
.cairn.info - Ecole N
ormale S
upérieure - Paris - - 129.199.207.130 - 03/04/2017 12h35. ©
Dalloz

the basis of a comparison between direct taxes and wealth is an easy task.There is strong evidence that, in addition to widening inequality, long-termmobility was substantial during the 19th century. Economic positions withinthe elite were changing over time. The structure of individual wealth wasalso changing over time. Relatively many individuals managed to be tem-porary members of the “happy few”. But the variables from the data setprovide a “blurred” vision of long-term mobility. One must be cautiouswhen focusing on the mobility of a single individual.
Our results show that the Parisian electorate was very heterogeneous,both in 1845 and at death. Heterogeneity was continuously renewedbetween these two dates, as is suggested by my attempt to define theeconomic life-cycle profile of voters. The process of wealth accumulationand deaccumulation needs further investigation but, beyond this importantquestion, our results can be interpreted in terms of political representationof wealth. The discrepancy between cens and wealth implies that the politi-cal elite and the economic elite do not coincide perfectly. Some very wealthyindividuals are excluded from the franchise (individuals whose wealth con-sists essentially of moveable assets). Others, although not very rich, areincluded because they meet voting requirements (for instance members ofthe petty bourgeoisie who pay a patente tax). As a consequence, the tax biasraises the question of the nature of the electoral franchise – a kind of imper-fect plutocracy.
References
AUTEN G. and GEE G. [2009], ″Income Mobility in the United States: New Evidencefrom Income Tax Data″, National Tax Journal, Vol. 62, No. 2, p. 301-328.
AUTEN G., GEE G. and TURNER N. [2013], ″Income Inequality, Mobility, and Turn-over at the Top in the US, 1987-2010.″, American Economic Review, Vol. 103,No. 3, p. 168-172.
AUTEN G., GEE G. and TURNER N. [2013], ″New Perspectives on Income Mobilityand Inequality″, National Tax Journal, Vol. 66, No. 4, p. 893-912.
BERGERON L. and CHAUSSINAND-NOGARET G. [1979], Les “masses de granit”.Cent mille notables du Premier Empire, Paris, Touzot, 122 p.
BOUVIER J. [1997], “L’évolution économique de la France du milieu du XIXe siècleà 1915”, in: Matériaux pour l’histoire de notre temps, No.47, Historiens d’hier etindustrialisation en Europe occidentale de 1880 à la fin des années 1960, p. 2-5.
DAUMARD A. [1963], La bourgeoisie parisienne de 1815 à 1848, École pratique deshautes études, Paris, France, xxxvii-661 p.
DAUMARD A. [1965], Maisons de Paris et propriétaires parisiens au XIXe siècle.1809-1880, Paris, Editions Cujas, 284 p.
DELBOS J.-B. [2014], The franchised Parisian voters of the 1840s and their future:wealth, inequality, economic and geographic mobility [orig. title: Les électeurscensitaires parisiens des années 1840 et leur devenir: richesse, inégalités, mobil-ités économique et géographique], unpublished doctoral dissertation, EHESS,Paris, France, 393 p.
718 — Once in the Elite, Always in the Elite? Changing Wealth in a Changing...
REP 126 (5) septembre-octobre 2016
Doc
umen
t tél
écha
rgé
depu
is w
ww
.cai
rn.in
fo -
Eco
le N
orm
ale
Sup
érie
ure
- P
aris
-
- 12
9.19
9.20
7.13
0 -
03/0
4/20
17 1
2h35
. © D
allo
z D
ocument téléchargé depuis w
ww
.cairn.info - Ecole N
ormale S
upérieure - Paris - - 129.199.207.130 - 03/04/2017 12h35. ©
Dalloz

HOCHGUERTEL S. and OHLSSON H. [2012:1], ″Who is at the top? Wealth mobilityover the life cycle″, Working Paper, Department of Economics, Uppsala Center forFiscal Studies.
KENT S. [1971], ″Electoral Lists of France’s July Monarchy, 1830-1848″, French His-torical Studies, Vol. 7, No. 1, p. 117-127.
KOEPKE R. L. [1980], ″The Loi des patentes of 1844″, French Historical Studies, Vol.11, No. 3, p. 398-430.
PARETO V. [1935], The Mind and Society: A Treatise on General Sociology, [Trattatodi Sociologia Generale, first edition in Italian, 1916], New York, Harcourt, Braceand Co.
PIKETTY T., POSTEL-VINAY G. and ROSENTHAL J.-L. [2004], ″Wealth Concentrationin a Developing Economy: Paris and France, 1807-1994″, Center for EconomicPolicy Research, CEPR Discussion Paper No. 4631.
PIKETTY T., POSTEL-VINAY G. and ROSENTHAL J.-L. [2006], ″Wealth Concentrationin a Developing Economy: Paris and France, 1807-1994″, American EconomicReview, Vol. 96, No. 1, p. 236-256.
PIKETTY T., POSTEL-VINAY G. and ROSENTHAL J.-L. [2006], ″The increased con-centration of wealth in Paris 1807-1912. Of Revolution and Demography″, work-ing paper.
PIKETTY T., POSTEL-VINAY G. and ROSENTHAL J.-L. [2014], ″Inherited vs. self-made wealth: Theory and evidence from a rentier society (Paris 1872-1927)″,Explorations in Economic History, Vol. 51, p. 21-40.
RAMBUTEAU C.-P. BARTHELOT (DE) [1837], Compte-Rendu de l’Administration duDépartement de la Seine et de la Ville de Paris, pendant l’année 1836, Vinchon,Paris.
TUDESQ A.-J. [1958], “Les listes électorales de la Monarchie censitaire”, Annales.Économies, Sociétés, Civilisations, Vol. 13, No. 2, p. 277-288.
TUDESQ A.-J. [1964], Les grands notables en France (1840-1849), Étude historiqued’une psychologie sociale, Presses Universitaires de France, Paris, France,1278 p.
VERJUS A. [1998], “Vote familialiste et vote familial. Contribution à l’étude duprocessus d’individualisation des femmes dans la première partie duXIXe siècle”, Genèses, No. 31, p. 29-47.
Jean-Brieux Delbos —————————————————————————————————————————————————— 719
REP 126 (5) septembre-octobre 2016
Doc
umen
t tél
écha
rgé
depu
is w
ww
.cai
rn.in
fo -
Eco
le N
orm
ale
Sup
érie
ure
- P
aris
-
- 12
9.19
9.20
7.13
0 -
03/0
4/20
17 1
2h35
. © D
allo
z D
ocument téléchargé depuis w
ww
.cairn.info - Ecole N
ormale S
upérieure - Paris - - 129.199.207.130 - 03/04/2017 12h35. ©
Dalloz