on the labor market effects of immigration and trade · 7 on the labor market effects of...
TRANSCRIPT
This PDF is a selection from an out-of-print volume from the National Bureauof Economic Research
Volume Title: Immigration and the Workforce: Economic Consequencesfor the United States and Source Areas
Volume Author/Editor: George J. Borjas and Richard B. Freeman, editors
Volume Publisher: University of Chicago Press
Volume ISBN: 0-226-06633-9
Volume URL: http://www.nber.org/books/borj92-1
Conference Date: January 14-17, 1990
Publication Date: January 1992
Chapter Title: On the Labor Market Effects of Immigration and Trade
Chapter Author: George J. Borjas, Richard B. Freeman, Lawrence F. Katz
Chapter URL: http://www.nber.org/chapters/c6910
Chapter pages in book: (p. 213 - 244)
7 On the Labor Market Effects of Immigration and Trade George J. Borjas, Richard B. Freeman, and Lawrence F. Katz
In the 1980s, the wages and employment-population rate of less-skilled Americans, particularly young men, fell relative to those of more-skilled workers. The real earnings of 25-34-year-old male high school graduates and dropouts declined, continuing a trend begun in 1973 that breaks with the his- toric pattern of rising real earnings for less-skilled American men.l
Two widely suggested causes of this change are the inflow of less-skilled immigrants, including illegal immigrants, and the trade deficit, notably the increase of imports in industries that hire low-skill workers. How much did trade and immigration alter the labor skill endowments of the United States in the 1980s? Hovi great a contribution did they make to the decline in the rela- tive earnings of the less skilled in the 1980s?
We present a conceptual and empirical analysis of these questions. Using demographic data from the 1980 Census and from the Current Population Sur- veys as well as detailed data on exports, imports, output, and employment for a large number of manufacturing industries, we first estimate the magnitude and educational composition of the labor supply embodied in trade flows and legal and illegal immigrations during the 1980s. We then calculate the per- centage growth in the ratio of highly educated to less-educated labor in the
George J. Borjas is professor of economics at the University of California, San Diego, and a research associate of the National Bureau of Economic Research. Richard B. Freeman is professor of economics at Harvard University and director of the Labor Studies Program at the National Bureau of Economic Research. Lawrence F. Katz is professor of economics at Harvard University and a research associate at the National Bureau of Economic Research.
The authors are grateful to Kevin M. Murphy for helpful discussions and for providing data from the March Current Population Surveys and to Zadia Feliciano for expert research assistance.
1. Studies documenting changes in the U.S. wage structure during the 1980s include Black- bum, Bloom, and Freeman (1990). Bound and Johnson (1989). Juhn, Murphy, and Pierce (1992), Katz and Murphy (1992), Katz and Revenga (1989). and Murphy and Welch (1992).
213

214 G . J. Borjas, R. B. Freeman, and L. F. Katz
United States that can be attributed to these flows. Finally, within the context of a standard model of labor market equilibrium, we assess the potential effect of changes in these skill endowments on earnings differentials by education.
We report the following findings. 1. The annual increase in implicit labor supply due to the mid- and late
1980s trade deficit in manufactures was on the order of 1.5 percent for the economy as a whole and 6 percent for the manufacturing sector. These labor supply shifts exceed the percentage increase in labor supply due to the annual flow of immigrants, which increased labor supply only by about 0.3 percent per year. However, unlike trade deficits that change the implicit labor supply only annually, immigration increases the nation’s work force permanently (as long as immigrants remain economically active). The 1980s immigrant flow raised the share of the U.S. work force that is foreign born from 6.9 percent in 1980 to 9.3 percent in 1988.
2. Both trade and immigration augmented the nation’s effective supply of less-skilled workers by more than they augmented the effective supply of more-skilled workers. The 1985 trade deficit raised the relative supply of high school dropouts to college graduates by 5-12 percent among men and by 10- 17 percent among women. Increasing numbers of immigrants with less than a high school degree and declining numbers of native high school dropouts meant that over 20 percent of the high school dropout work force was foreign born by 1988.
3. Because immigrants consist disproportionately of workers who lack a high school diploma, and because import industries tend to employ relatively low-skill workers (including many immigrants), the pattern of trade and im- migration observed in the United States during the 1980s fits the Heckscher- Ohlin trade model, in which trade and immigration are alternative ways of increasing the factor that is relatively scarce in the United States compared to the rest of the world-in this case, the declining number of less-skilled native workers.
By applying these supply shifts to the textbook model of labor market equi- librium, we estimate that from 15 to 25 percent of the 11 percentage point rise in the earnings of college graduates relative to high school graduates from 1980 to 1985 can be attributed to the massive increase in the trade deficit over the same period but that the effects of trade on the college/high school wage differential diminished with improvements in the trade balance during the late 1980s. In contrast, immigration had only a small effect on the supply of high school “equivalent” workers relative to college “equivalent” workers and con- sequently is likely to have had only a small effect on the college/high school wage differential.
Nevertheless, the large share of new immigrants with less than a high school education and the concentration of the trade deficit on industries that intensively employ high school dropouts mean that both trade and immigra- tion are likely to have contributed substantially to the declining earnings and employment opportunities of high school dropout workers. We estimate that
215 Labor Market Effects of Immigration and Trade
between 30 and 50 percent of the nine-log-point decline in the relative weekly wage of high school dropouts from 1980 to 1988 can be attributed to trade and immigration flows. The “explanatory power” of these factors is of similar magnitude to that of other variables that have been the focus of recent re- search, such as the declining unionization of the U.S. labor force.
Our findings regarding the effect of trade on the U.S. labor market are con- sistent with those of studies that document the influence of trade on earnings and employment at the industry level (Freeman and Katz 1991; Revenga 1989; MacPherson and Stewart 1990). In contrast, our findings with respect to the labor market effects of immigration differ drastically from those reported in the existing literature. These studies typically find modest and imprecisely estimated differences in earnings and employment rates of workers in cities with greatedlesser immigrant flows (Altonji and Card 1991; Butcher and Card 1991; Card 1990; LaLonde and Tope1 1991). Our results probably differ be- cause we focus on changes in economy-wide factor endowments while the existing literature focuses on differences in factor endowments across local labor markets. In the concluding section, we reflect on the causes and inter- pretation of the differences in the results obtained from differing modes of analysis.
7.1 lkade and Labor Supplies
In the 1970s and 198Os, the U.S. economy became more connected with the rest of the world. The ratio of the sum of exports and imports to GNP increased from 16 percent in 1970 to 25 percent in 1990. The balance of trade turned substantially negative in the mid-l980s, with a trade deficit of some 3 percent of GNP. At the same time, immigration flows increased as upwards of 700,000-800,000 legal and illegal immigrants entered the country annually. How have these changes altered the implicit supply of labor in the country in total and among skill groups?
To estimate the labor supply equivalents of trade, we transform trade flows into equivalent bodies on the basis of the labor inputs in the domestic manu- facturing industries that constitute the bulk of the traded-goods sector. We do this by estimating the direct labor supply embodied in trade, ignoring indirect input-output effects. Formally, let T,, be the trade flow in industry i in year t , LJO,, be the labor input per unit of output in industry i in year t , and L, be the number of personhours needed to produce total traded output-the labor sup- ply equivalent of the trade f l o ~ s . ~ Then, for any given year t , we have
2. It is irrelevant whether we treat trade as shifts in labor supply or as shifts in labor demand. This is obviously the case in terms of the likely effects of trade on wages since, in a market- clearing model, W’ = (D’ - S’)/ (e + h) , where W’ is the change in In wages, D’ and S’ are shifts in demand and supply, and e and h are the elasticities of supply and demand, respectively. Whether we treat imports as increasing labor supply (an increase in S’) or as reducing labor de- mand (a decrease in D’) is a matter of taste.
216 G. J. Borjas, R. B. Freeman, and L. F. Katz
When T,, refers to imports, L, will be positive, as imports are equivalent to an increase in labor supply. When T,, refers to exports, L, will be negative, as exports effectively reduce the labor supply for domestic production. When T,, refers to net imports (imports-exports), it can be positive or negative.
To allocate the implicit labor supply in trade among groups of workers with different levels of skill, we apply a modified version of equation (1) to differ- ent skill groups, using
where LJ, is the implicit labor supply embodied in trade of skill groupj in year t , and a,, is the average proportion of workers in industry i in thejth skill group for the period 1967-87.
In equation ( 2 ) , we assume that the effects of trade-induced changes in out- put on the employment of both production and nonproduction workers are identical to equivalent domestic-induced changes in output. It is also reason- able, however, to treat the labor market effects of the two flows differently. Whereas exports are likely to create employment for both kinds of workers, or possibly create greater employment for production workers than for non- production workers, imports have the potential for displacing production workers to a greater extent than nonproduction workers. This possibility is likely because the sales, finance, and related activities of nonproduction workers may be relatively complementary with production workers overseas. Given these considerations, we provide two estimates of the effects of trade on employment. In method I, we treat the labor market effects of exports and imports identically, as in equation ( 2 ) ; in method 11, we use equation ( 2 ) for exports but allocate the implicit labor supply contained in imports to produc- tion workers only. Empirically, the assumption that imports have a greater effect on production than on nonproduction labor implies that the percentage of production workers should drop in industries with increasing imports. This prediction is consistent with our data.
Finally, we transform implicit labor supplies due to trade into “efficiency units” that correct personhours for shifts among industries with different qual- ities of labor. When trade affects highly skilled labor, an efficiency-unit mea- sure translates this into a greater effect on aggregate labor supply than when trade affects less-skilled labor. To estimate efficiency units of labor by industry in a given year, we divide each industry’s labor force into sixty-four groups, based on sex (two groups), education (four groups), and experience (eight groups), and weight the proportion of persons in each group by the average
3. The net labor supply contained in imports for skill group j in year r using the production- workers-only allocation scheme is given by LP,, = X,p,jL,,(T,,/O,,), where p,, is the average propor- tion of production workers in industry i from the jth skill group for the period 1967-85. We classify as production workers those workers in the manufacturing sector in the following broad occupational categories: craft workers, handlers and laborers, operatives, transport operatives, and service workers.
217 Labor Market Effects of Immigration and Trade
weekly wage for full-time workers in the group from 1963 to 1987. We nor- malize the measure so that the total number of efficiency units in the economy in each year equals o n e 4 We then estimate implicit labor input in efficiency units from trade in year t for groupj (EL,) as
(3)
where E, is the total number of labor efficiency units employed in the U.S. labor market in t , e,, is the average proportion of group j in total labor effi- ciency units in industry i for the period 1967-87, and EL, is the total labor efficiency units used in industry i in year t . The implicit labor input in trade measured in efficiency units as a fraction of aggregate labor input in t is then given by
(4) EL, = XjELj, = ~i(E,,lE,)(T,,lOi,).
7.1.1 Trade Data
Estimates of implicit labor supplies using equations (1)-(4) require infor- mation on personhours, the skill mix of workers, and trade flows in the traded- goods sector. Our data on personhours, employment, and wages for sixty-four skill groups are derived from the Annual Demographic Supplements to the March Current Population Surveys (CPS) for 1964-88.5 The March CPS pro- vides information on earnings and weeks worked in the calendar year preced- ing the March survey that we use to compute total personhours and efficiency units by skill group by year from 1967 to 1985 for the aggregate labor force, the manufacturing sector, and for twenty-two detailed manufacturing indus- tries.
Our data on imports, exports, output (value of shipments), total employ- ment, and production worker employment are from the NBER Immigration, Trade, and Labor Markets Data Files.'j The data cover four-digit SIC manufac- turing industries for each year from 1967 to 1985. We aggregate these data into the twenty-one manufacturing industries for which we have estimates of personhours and efficiency units by labor skill group from the CPS. We also calculate the average share of personhours and efficiency units contributed by production workers for each skill group in each of the twenty-one industries.
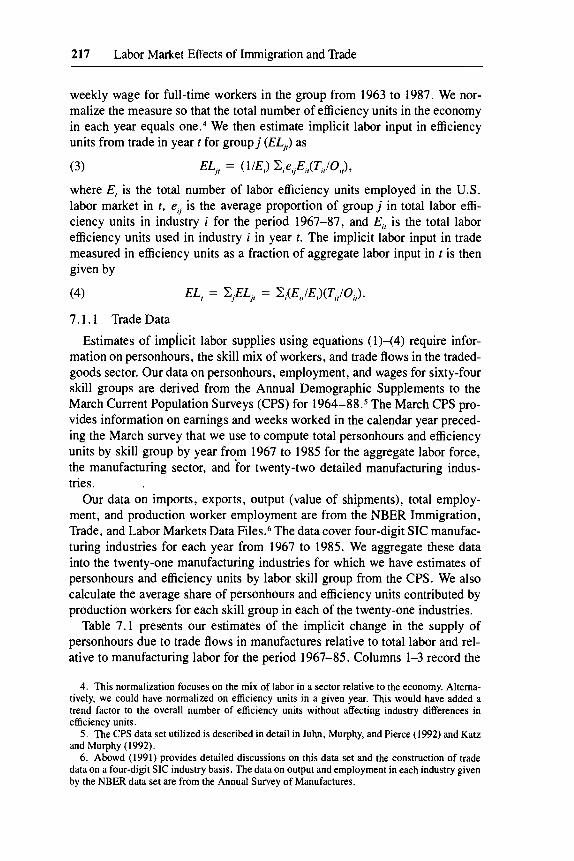
Table 7.1 presents our estimates of the implicit change in the supply of personhours due to trade flows in manufactures relative to total labor and rel- ative to manufacturing labor for the period 1967-85. Columns 1-3 record the
4. This normalization focuses on the mix of labor in a sector relative to the economy. Alterna- tively, we could have normalized on efficiency units in a given year. This would have added a trend factor to the overall number of efficiency units without affecting industry differences in efficiency units.
5 . The CPS data set utilized is described in detail in Juhn, Murphy, and Pierce (1992) and Katz and Murphy (1992).
6. Abowd (1991) provides detailed discussions on this data set and the construction of trade data on a four-digit SIC industry basis. The data on output and employment in each industry given by the NBER data set are from the Annual Survey of Manufactures.
218 G. J. Borjas, R. B. Freeman, and L. F. Katz
Table 7.1 Estimates of Itade-Induced “Change” in Aggregate Labor Supply, 1967-85
Implicit Labor Input in Manufactured-Goods Trade Flowsa
As a % of U.S.
Labor in Input in Personhours Input in Efficiency Units Mfg. in
Eff. Units,
As a % of Total U.S. Labor As a % of Total U.S. Labor
( 1 ) (2) (3) (4) ( 5 ) (6) (7) Year M X Net M X Net Net
1967-69 1970-72
I97678 1979-8 1 1982 1983 1984 1985
1973-75
1.32 1.50 1.67 1.62 1.86 2.11 2.11 2.18 2.37 2.66 2.57 2.49 2.70 2.18 3.36 2.06 3.69 2.06
- . I8 .05
- .25 - .07 - .30
.08
.52 I .30 1.63
1.31 1.57 - .26 - .87 1.64 1.69 - .05 -.18 1.82 2.17 - .35 - 1.39 2.06 2.26 -.20 - .80 2.31 2.75 - .44 - 1.86 2.46 2.58 - .12 . . . 2.58 2.26 .32 . . . 3.16 2.13 1.03 . . . 3.49 2.15 1.34 6.36
Sources: Data on trade flows are from the NBER Immigration, Trade, and Labor Markets Data Files. Data on labor input and wages are from the March CPS files. “Labor input is measured in either personhours or efficiency units on the basis of a sixty-four group decomposition of the U.S. labor force. The sixty-four groups arise from splitting the labor force into two sexes, four education groups, and eight experience classes. Efficiency units in year f for group j are the average wage for group j over the period 1963-87 times the total hours of labor input of group j in year t . M = imports, X = exports, and Net = M - X . Implicit labor input in imports in year t = 1, E,, (M,,/S,,), and implicit labor input in exports in year t = C, E,, (XJS, , ) , yhere i is industry, E,, is efficiency units (or personhours) used in industry i in year t , and S is the value of shipments of domestic producers.
labor supply equivalence in personhours of U.S. imports ( M ) , exports (X) , and the net of the two (imports minus exports) as a percentage of the total U.S. labor force. Columns 4-6 give the labor supply equivalence of trade in efficiency units as a percentage of total efficiency units for the entire U.S. labor force (calculated using the same wage weights as we used to determine the labor supply implicit in trade flows). Column 7 gives the labor supply equivalence in efficiency units of net imports in the major traded-goods sector, manufacturing.
Three things stand out in the table. First is the marked change in the implicit effects of trade on the labor market between the period of the 1960s and 1970s and the period since the early 1980s. In the 197Os, trade reduced slightly the net supply (increased slightly the net demand) of labor in the United States. In the mid-l980s, the trade deficit produced a much larger increase in the implicit supply of workers both in personhours and in efficiency units.’
7. The figures for 1984 and 1985 are likely to be fairly representative of the rest of the decade, as the trade deficit was at comparable levels on average in the periods 1986-89 and 1984-85.
219 Labor Market Effects of Immigration and Trade
Second is the difference between the implicit labor input in personhours and efficiency units between exports and imports. Because export industries are relatively skill intensive, the implicit labor input is roughly 4 percent higher in efficiency units than in personhours. Imports, by contrast, come increas- ingly from industries with less-skilled labor. In 1967-69 the implicit labor input in imports was 1 percent lower in efficiency units than in personhours, whereas in 1985 the implicit labor input in imports was 5.5 percent lower in efficiency units than in personhours. As a result of these patterns, the implicit labor supply due to net imports is 18 percent lower in terms of efficiency units than of personhours in 1985.
Third, the growth of the implicit labor input due to net trade flows in man- ufacturing shows a much more dramatic picture of the “first-stage” effect of trade on workers in that sector. In 1985, the trade imbalance was equivalent to a 6.4 percent increase in efficiency units of labor in manufacturing. This high- lights the fact that the direct effects of trade-induced changes in implicit labor inputs fall on only some workers. Others are affected when those displaced or not hired in manufacturing seek work in other sectors of the economy.
7.1.2 Effects of Trade on Labor Skills
The difference between the personhours and efficiency-units measures of implicit labor supply for imports and exports in table 7.1 indicates that import industries employ relatively less-skilled labor than export industries. Changes in the level of trade and, more important, in the trade balance are thus likely to have very different effects on labor of different skills. To assess the magni- tude of these differential effects, we used equation (3) to estimate the implicit labor supply in imports, exports, and the net trade balance for four education groups: high school dropouts, high school graduates, persons with some col- lege, and college graduates. We made estimates for all men and women and for those with the least potential labor market experience (up to ten years after school leaving).
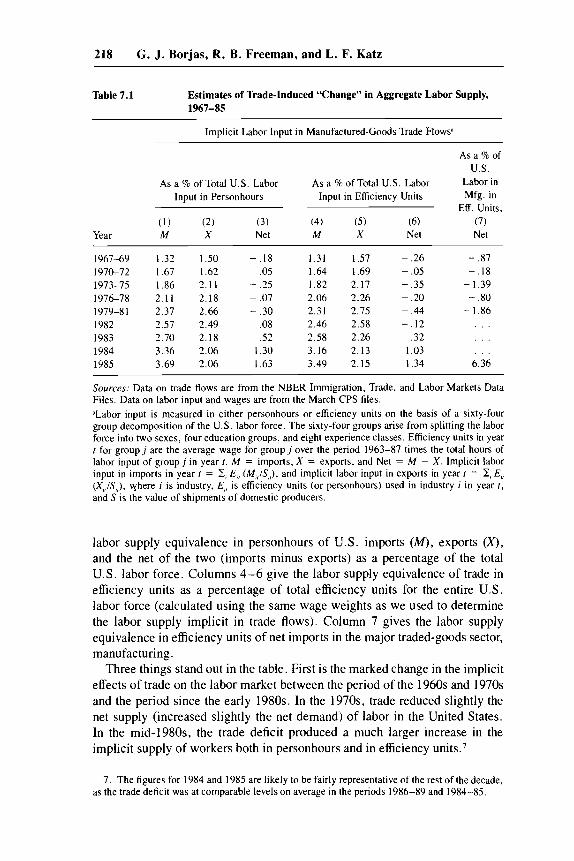
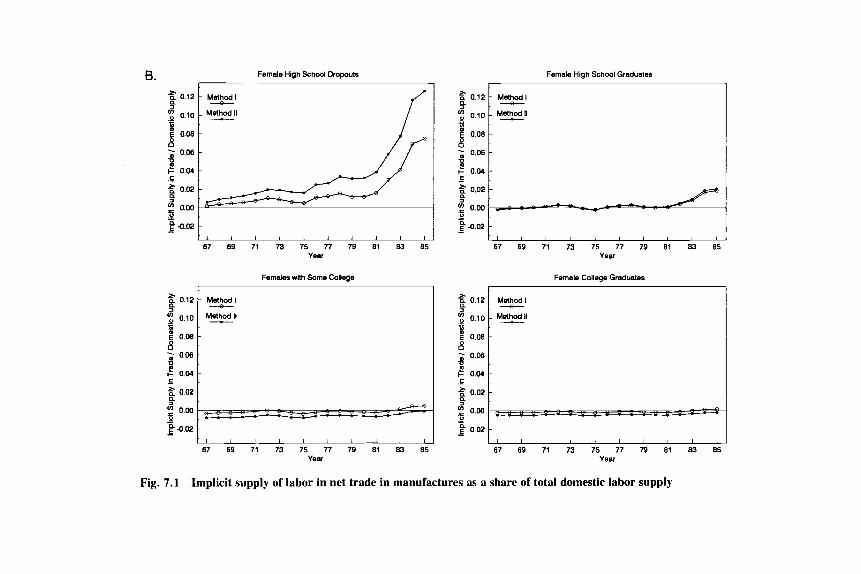
Figure 7.1 displays plots of the estimated implicit labor supply embodied in the net trade balance in manufactures relative to the entire domestic labor force in all industries for male workers by education (fig. 7. la) and for female workers by education (fig. 7. lb). The plots with the0 notation are made under assumption I, that imports and exports affect production and nonproduction workers in the same manner as an equivalent amount of domestic production. The plots with the notation are made with assumption 11, that imports affect only production workers while exports affect both groups in the same manner as domestic production.
The figure tells a clear story. Until the trade deficit developed, the implicit change in relative labor supply due to trade was modest-dwarfed by the on- going trend in supplies due to changes in the educational attainment of work- ers. Among males, for example, trade in 1980 increased the implicit supply of high school dropouts by - 0.1 percent (using our method I) to 1.5 percent (using method 11) while reducing the implicit supply of college graduates by
NZ
88
SE
:8
8
00
00
00
00
10 m
a r
m
m
fi B
,f h
P
r
h
m
h
P
a .- m
m
kz
f
r c r
h
m
2
B. Female High School Dropouts Female High School Graduates
67 m 71 73 75 7-1 79 81 83 a5 Y W
Females with Some College
M 2 l
M 4 I I
J i I I I I I I I I
37 69 71 73 75 77 79 81 83 85 Year
$ 0.12
g 0.08
9 0.06
a : 0.10 f
B c 0.04 g 0.02 4 I: 0.00 e 4.02
C
0 - -
5 0.12 : 0.10 n
- B
0
0.08
;; 0.06
2 0.04 2 0.02 f: 0.w
e -0.02
Q
- n
0 - -
Method I
M + I I -
67 69 71 73 75 77 79 81 83 85 Year
Female College Graduates
Method I
M 4 I I -
, I , , I l l , , ,
37 69 71 73 75 77 79 81 83 85 Year
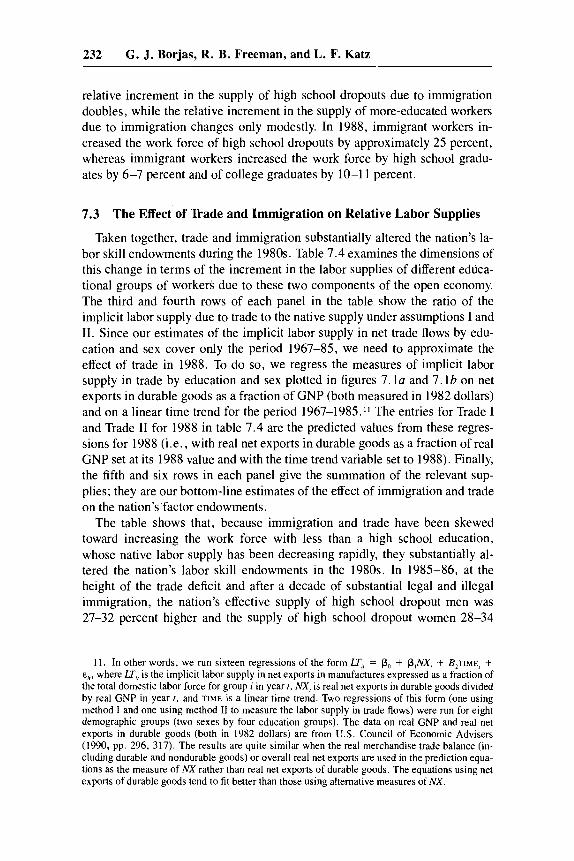
Fig. 7.1 Implicit supply of labor in net trade in manufactures as a share of total domestic labor supply
222 G . J. Borjas, R. B. Freeman, and L. F. Katz
0.8-2.1 percent.* As a result, trade in 1980 decreased the ratio of college to high school dropouts by 0.6 percent when imports are allocated to all workers and by 3.6 percent when imports are allocated to production workers only. Among females, trade increased the implicit supply of high school dropouts by 1.2-3.2 percent and reduced the ratio of college graduates to dropouts by 1.4-3.7 percent. These changes are quite modest in comparison to the in- crease in the ratio of the number of college graduates to high school dropouts in the nation’s nonimmigrant work force in the same period (e.g., an increase of 52 percent among men and 87 percent among women from 1975 to 1980). Balanced trade of the sort that predominated in the 1970s and early 1980s thus had only modest effects on the market for skills.
By contrast, the figure also shows that the trade deficit that began in the 1980s produced a large increase in the implicit labor supply of less-educated workers, particularly high school dropouts, but had only a slight effect on the implicit supply of college graduates. In 1985, the implicit supply of male high school dropouts via trade was 4-8 percent of the number of male dropouts in the U.S. labor force (fig. 7 . la) , while the implicit supply of female high school dropouts via trade was 8-13 percent of the number of female dropouts in the U.S. labor force (fig. 7. Ib). Extrapolating to the end of the 1980s, the continued, although declining, trade deficit (U.S. Council of Economic Advisors 1990, p. 297) implies that the United States kept “importing” large numbers of less-educated workers through trade for the remainder of the decade.
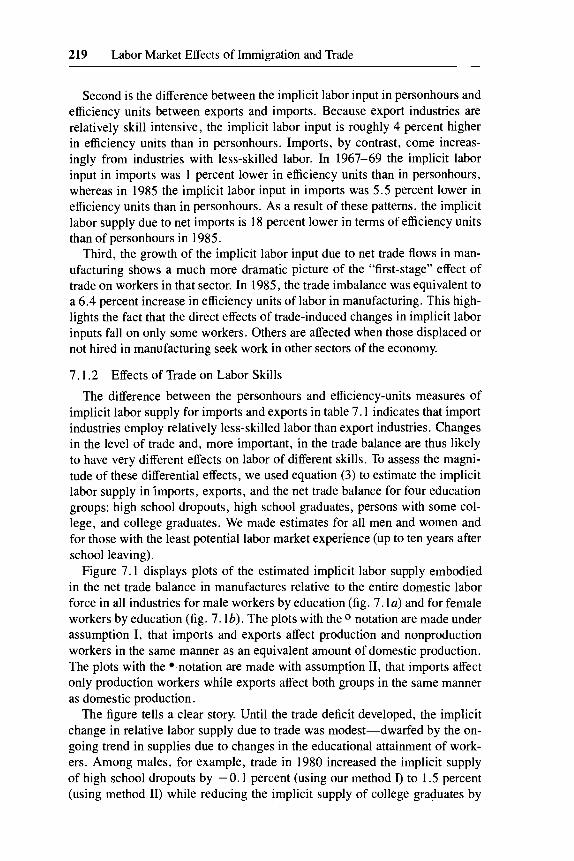
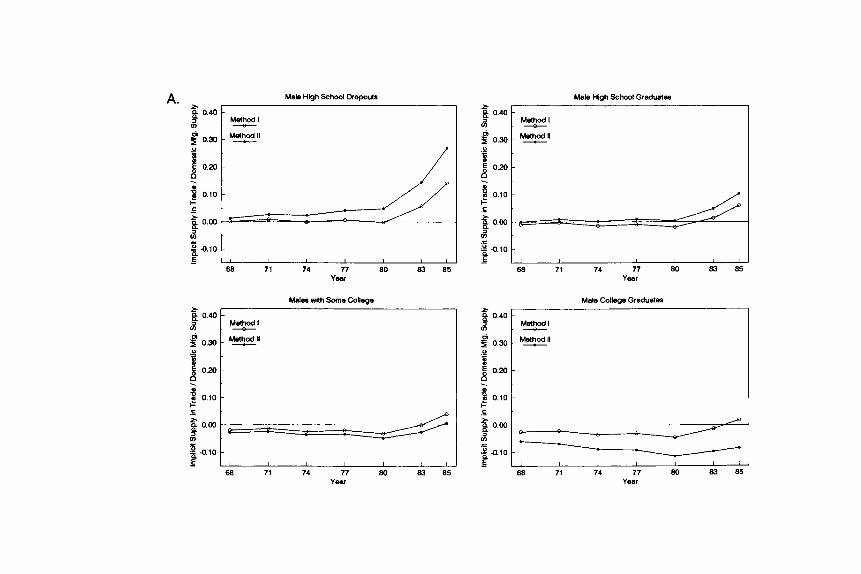
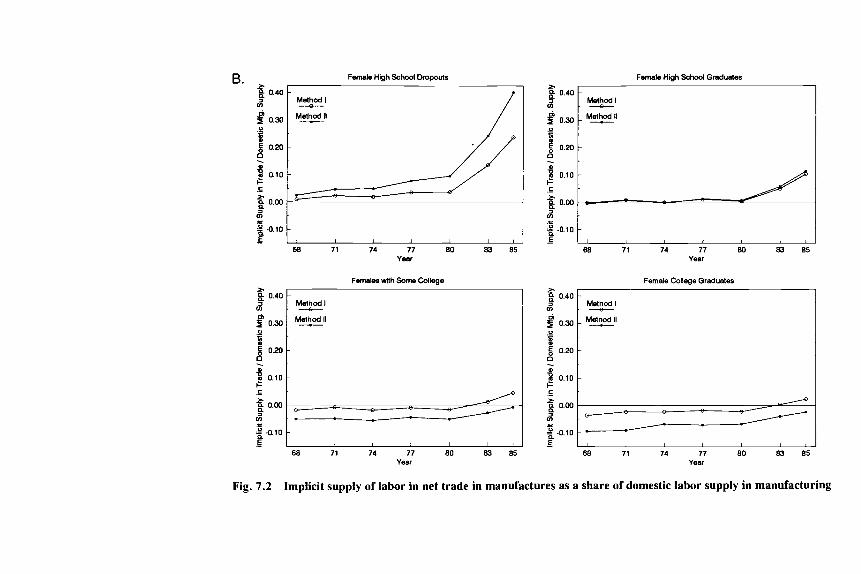
Figure 7.2 presents comparable plots for the implicit labor embodied in net trade relative to the domestic manufacturing labor force. Since the implicit labor embodied in net trade is the same as in figure 7.1 while the denominator is about one-fifth as large, the relative increases in supply due to trade are correspondingly larger: for high school dropouts, for instance, trade flows increased the implicit supply in manufacturing by 14-27 percent for males (fig. 7 . 2 ~ ) and by 24-40 percent for females (fig. 7.2b). These figures high- light the fact that the “first-order’’ effect of the trade deficit is for less-educated workers in manufacturing.
In addition to the implicit labor supply calculations in figures 7.1 and 7.2, we also estimated the effects of trade on the implicit supply of workers with less than ten years of experience. We obtained results similar to those in fig- ures 7. I and 7.2, reflecting the fact that less-experienced workers are distrib- uted in roughly similar proportions among sectors as more experienced work- ers. If trade-induced changes in implicit labor supply help account for the exceptionally large decline in the position of younger less-skilled workers, it is because these workers are on the “active market,” unprotected by seniority,
8. We report a range of estimates for the effect of trade on implicit labor supplies. In each case, the smaller number in absolute value is obtained by our method I , in which we treat production and nonproduction workers the same. The larger number in absolute value is obtained by our method 11, in which we assume that imports do not displace nonproduction workers.
223 Labor Market Effects of Immigration and Trade
internal labor markets, and firm-specific human capital, not because they are disproportionately concentrated in industries facing import competition com- pared to more experienced less-skilled workers.
7.1.3
Our first method of estimating the effects of trade on the implicit labor sup- ply of skills assumes that imports and exports affect production and nonprod- uction labor equally. Our second method assumes that imports have no effect on the employment of nonproduction labor. If imported goods reduce employ- ment of production labor more than nonproduction labor, industries with in- creasing imports ought to be associated with declines in the production worker share of employment. Accordingly, we regressed the In change in the produc- tion worker share of employment on the change in the ratio of imports to imports plus sales, the change in exports/sales, and the change in In sales. Our regression for the period 1960-85 shows that changes in import ratios contributed to the decline in the share of production workers in employment while changes in export ratios essentially had no effect:
Comparing Methods I and I1 for Estimating Trade Effects
d In(% production workers) = 0.040 - 0.159 d(import ratio) (0.049)
(0.071) (0.009) - 0.005 d(export ratio) - 0.049 d(ln sales),
N = 427, R2 = 0.07, where the numbers in parentheses are standard errors. Over half the within-sector change in the percentage of workers in produc-
tion labor occurred in the 1980s. For 1979-85, our regression yields
d In(% production workers) = -0.029 - 0.088 d(import ratio) (0.061)
0.007 d(ln sales), (0.071) (0.015)
- 0.007 d(export ratio) -
N = 427,R2 = 0.005. Because of the smaller size and significance of the coefficient on import
ratios in the period when there was “most action,” we hesitate to draw any strong inference from the data. Although the data. are consistent with the no- tion that increased imports alter the skill mix of industries away from less- educated production workers and that this process may be associated with the out-sourcing of production jobs to other countries, we conclude that the evi- dence favoring the out-sourcing hypothesis is far from overwhelming. It is for this reason that we present our implicit labor supply calculations assuming both that exports and imports affect production and nonproduction workers equally and that imports affect production workers only.
Lo
a 8
E: f
0
i;
3
Lo
a 0
ki
>
Q
I.
- I. I
1
+ -0.10 :i E MI 71 74 77 80 83 85
Year
Females wtth Some College 2
0.40
z
1
p 0.10
r" 0.30
B o.20
$ 0.00
g -0.10
0 .-
- m
!- c -
2 r
E -
M 4 l
M 4 I I
J , 1 I , I
58 71 74 77 80 83 85 Year
Female High School Graduates 2
4 ' M 4 I 040
ln
.e g-0.10 1 _E I 1
68 71 74 77 80 e3 85 Year
Female College Graduates
p 0.10 I- ;; 0.00
$ -0.10 E
83 85 -
68 71 74 77 80 Year
Fig. 7.2 Implicit supply of labor in net trade in manufactures as a share of domestic labor supply in manufacturing
226 G. J. Borjas, R. B. Freeman, and L. F. Katz
7.2 The Immigrant Contribution to Labor Supply
What about immigration-induced changes in labor supply? How has the flow of immigrants altered the nation’s endowment of more- and less-educated workers?
Because immigrants are largely permanent additions to the country’s labor force, comparisons of the number of immigrants who enter the work force annually with the implicit labor input in trade can give a misleading picture of how the two flows affect the labor market. Most traded goods displace domes- tic production in the same period, motivating our calculation of implicit labor supply equivalents based on individual year trade jlows. By contrast, an im- migrant arriving in the United States in any given year contributes to the econ- omy in every subsequent year in which he or she is economically active in the United States. Therefore, the effect of immigration on labor supplies is best described by the stock of the work force who are immigrants relative to U.S. domestic labor supply, rather than by the flow of immigrants to labor supply.
Calculating the stock of immigrants in the United States at any point in time is not easy. In 1980 and other Census years, the Decennial Census reports the number of foreign-born persons. In April 1983, June 1986, and June 1988, the Current Population Survey (CPS) contained questions on country of birth that can also be used to estimate the number of immigrants. Both the Census and the CPS numbers, however, miss many illegal alien immigrants, who are especially likely to be in the low-skill work force. For purposes of estimating labor supplies due to immigration, we need to know the number, labor force participation rate, and educational composition of uncounted immigrants as well as the same information for those counted in the Census and CPS sur- veys.
7.2.1 Estimating Uncounted Illegal Immigrants
Using the enumeration provided by the 1980 Census as a base, we adjusted the 1980 count upward to allow for uncounted illegal immigrants, by sex. First, we counted 6.47 million foreign-born persons aged 18-64 who are la- bor force participants using the l i l000 file of the 1980 Census. Warren and Passel (1987) indicate that this Census enumeration “found’ many more foreign-born persons than would be expected given the legal flows reported by the U.S. Immigration and Naturalization Service. They estimate that the 1980 Census enumerated two million illegal aliens, of whom approximately 60 percent were of working-force age (aged 18-64). On the basis of vital statistics by country of birth, Borjas, Freeman, and Lang (1991) estimate that there were approximately 50 percent more illegal aliens in the United States in 1980 than were counted in the Census. This suggests that the Census count fell short of the number of illegal immigrants in the economy by roughly one million persons. Assuming that 60 percent of these aliens were of working age and that their distribution by sex is similar to that for counted illegal aliens
227 Labor Market Effects of Immigration and Trade
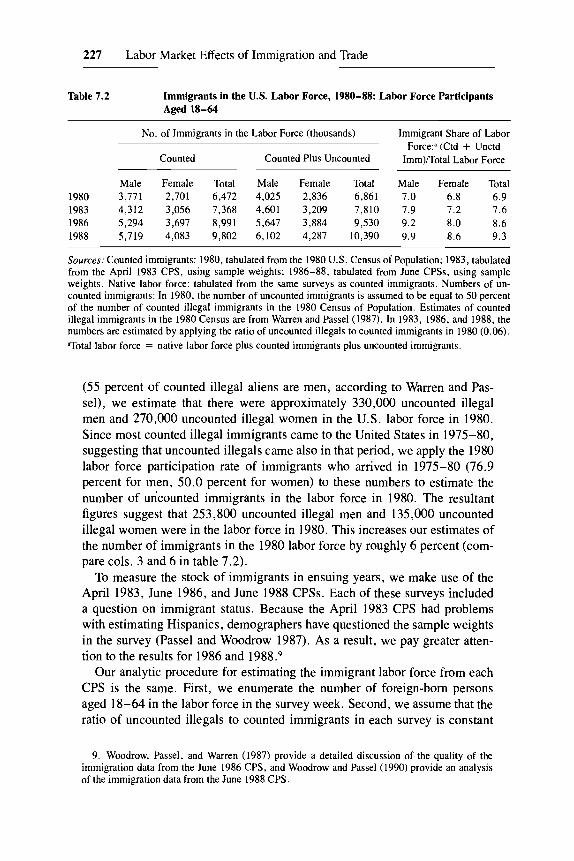
Table 7.2 Immigrants in the U.S. Labor Force, 1980-88: Labor Force Participants Aged 18-64
No. of Immigrants in the Labor Force (thousands)
Counted Counted Plus Uncounted
Male Female Total Male Female Total 1980 3,771 2,701 6,472 4,025 2,836 6,861 1983 4,312 3,056 7,368 4,601 3,209 7,810 1986 5,294 3,697 8,991 5,647 3,884 9,530 1988 5,719 4,083 9,802 6,102 4,287 10,390
Immigrant Share of Labor Force:' (Ctd + Unctd
Imm)/Total Labor Force
Male Female Total 7.0 6.8 6.9 1.9 7.2 1.6 9.2 8.0 8.6 9.9 8.6 9.3
Sources: Counted immigrants: 1980, tabulated from the 1980 U.S. Census of Population; 1983, tabulated from the April 1983 CPS, using sample weights; 1986-88, tabulated from June CPSs, using sample weights. Native labor force: tabulated from the same surveys as counted immigrants. Numbers of un- counted immigrants: In 1980, the number of uncounted immigrants is assumed to be equal to 50 percent of the number of counted illegal immigrants in the 1980 Census of Population. Estimates of counted illegal immigrants in the 1980 Census are from Warren and Passel (1987). In 1983, 1986, and 1988, the numbers are estimated by applying the ratio of uncounted illegals to counted immigrants in 1980 (0.06). 'Total labor force = native labor force plus counted immigrants plus uncounted immigrants.
(55 percent of counted illegal aliens are men, according to Warren and Pas- sel), we estimate that there were approximately 330,000 uncounted illegal men and 270,000 uncounted illegal women in the U.S. labor force in 1980. Since most counted illegal immigrants came to the United States in 1975-80, suggesting that uncounted illegals came also in that period, we apply the 1980 labor force participation rate of immigrants who arrived in 1975-80 (76.9 percent for men, 50.0 percent for women) to these numbers to estimate the number of uncounted immigrants in the labor force in 1980. The resultant figures suggest that 253,800 uncounted illegal men and 135,000 uncounted illegal women were in the labor force in 1980. This increases our estimates of the number of immigrants in the 1980 labor force by roughly 6 percent (com- pare cols. 3 and 6 in table 7.2).
To measure the stock of immigrants in ensuing years, we make use of the April 1983, June 1986, and June 1988 CPSs. Each of these surveys included a question on immigrant status. Because the April 1983 CPS had problems with estimating Hispanics, demographers have questioned the sample weights in the survey (Passel and Woodrow 1987). As a result, we pay greater atten- tion to the results for 1986 and 1988.9
Our analytic procedure for estimating the immigrant labor force from each CPS is the same. First, we enumerate the number of foreign-born persons aged 18-64 in the labor force in the survey week. Second, we assume that the ratio of uncounted illegals to counted immigrants in each survey is constant
9. Woodrow, Passel, and Warren (1987) provide a detailed discussion of the quality of the immigration data from the June 1986 CPS, and Woodrow and Passel (1990) provide an analysis of the immigration data from the June 1988 CPS.
228 G. J. Borjas, R. B. Freeman, and L. F. Katz
over time at the 6 percent estimated for the 1980 Census. This leads us to adjust upward the 1983 CPS count by 422,100 workers, the 1986 CPS count by 539,500, and the 1988 CPS by 588,100.
Table 7.2 shows the results of our calculations. It records the unadjusted and adjusted estimated number of immigrants in the U.S. labor force in total and by sex in 1980, 1983, 1986, and 1988 and gives the proportion of the total work force consisting of immigrants. Because immigrant stocks are the cumulation of annual net flows of immigrants in different years, the immigrant contribution to the nation’s labor supply exceeds the implicit contribution of trade to the nation’s labor supply by over fourfold even during the mid-1980s trade deficit period (compare the 8.6 percent in table 7.2 for 1986 with the 1.6 percent implicit labor supply in col. 3 of table 7.1 for 1985). In addition, the table shows a strong upward trend in the immigrant share of the work force among both sexes over the period. From 1980 to 1988, the immigrant share of the work force increased by approximately 35 percent! Growth in the num- ber of immigrant workers accounted for over 25 percent of the growth of the U.S. work force in the 1980s.
7.2.2 Immigrants by Education
To determine how the inflow of immigrants altered the educational compo- sition of the U.S. work force, we estimated the number of immigrants by education and sex in 1980, 1983, 1986, and 1988. For persons counted by the Census or the CPS, determining years of schooling is a direct matter because schooling is recorded for all respondents, including immigrants. As many im- migrants are educated overseas under different educational systems and in dif- ferent languages than prevail in the United States, however, their years of schooling may have a different value in the U.S. labor market than years of schooling in the United States. For simplicity, we ignore this problem and treat years of schooling of immigrants as equivalent to the schooling of na- tives.
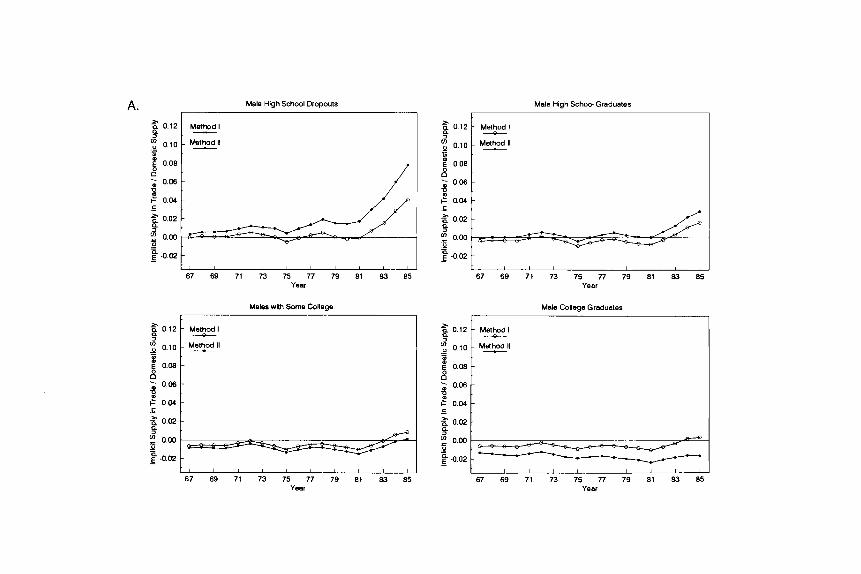
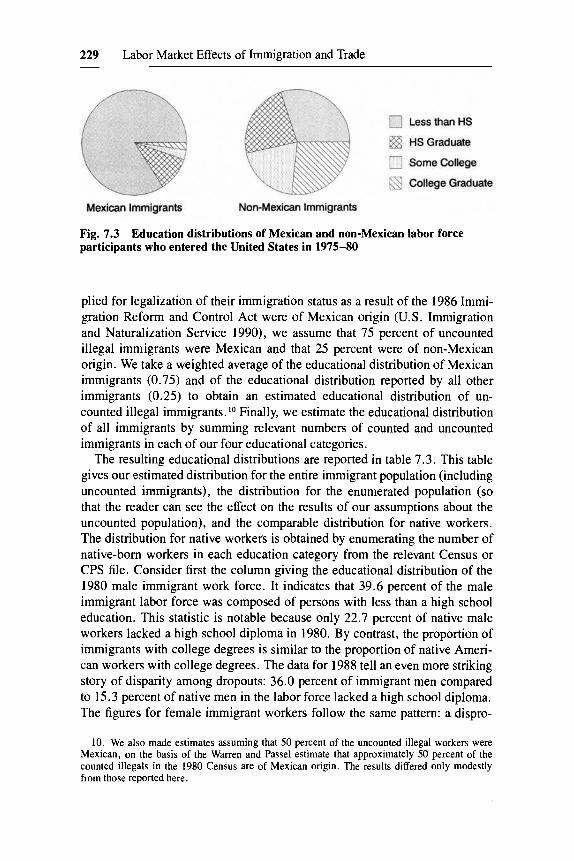
For illegal aliens who were not enumerated in the Census or the CPS, we estimate educational attainment from the educational distributions of 1975- 80 immigrants reported in the 1980 Census for two national origin groups: Mexican immigrants and all other immigrants. We distinguish between these groups for two reasons. First, the educational distribution of immigrants dif- fers markedly between Mexican and non-Mexican immigrants. As figure 7.3 shows, Mexican immigrants are disproportionately high school dropouts, whereas non-Mexican immigrants have a more even distribution among edu- cation categories. Hence, the proportion of uncounted immigrants who are Mexican will affect the estimated educational distribution of uncounted illegal workers. Second, a large proportion of counted illegals are in fact Mexicans (one-half, according to Warren and Passel [ 1987]), suggesting that many un- counted illegals are Mexican or are similar to illegal Mexican immigrants.
On the basis of evidence that about three-quarters of the persons who ap-
229 Labor Market Effects of Immigration and Trade
cf LessthanHS
HS Graduate
0 Some College
College Graduate
Mexican Immigrants Non-Mexican Immigrants
Fig. 7.3 Education distributions of Mexican and non-Mexican labor force participants who entered the United States in 1975-80
plied for legalization of their immigration status as a result of the 1986 Immi- gration Reform and Control Act were of Mexican origin (U.S. Immigration and Naturalization Service 1990), we assume that 75 percent of uncounted illegal immigrants were Mexican and that 25 percent were of non-Mexican origin. We take a weighted average of the educational distribution of Mexican immigrants (0.75) and of the educational distribution reported by all other immigrants (0.25) to obtain an estimated educational distribution of un- counted illegal immigrants. lo Finally, we estimate the educational distribution of all immigrants by summing relevant numbers of counted and uncounted immigrants in each of our four educational categories.
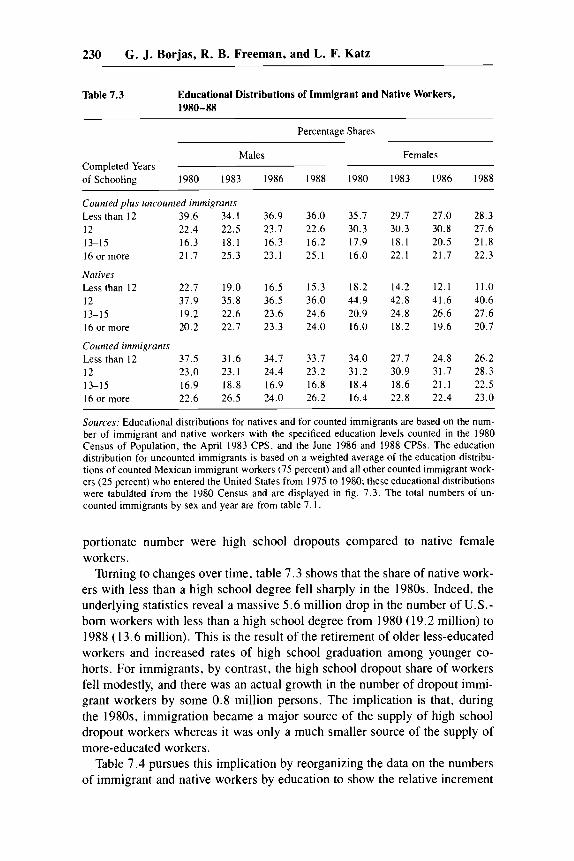
The resulting educational distributions are reported in table 7.3. This table gives our estimated distribution for the entire immigrant population (including uncounted immigrants), the distribution for the enumerated population (so that the reader can see the effect on the results of our assumptions about the uncounted population), and the comparable distribution for native workers. The distribution for native workers is obtained by enumerating the number of native-born workers in each education category from the relevant Census or CPS file. Consider first the column giving the educational distribution of the 1980 male immigrant work force. It indicates that 39.6 percent of the male immigrant labor force was composed of persons with less than a high school education. This statistic is notable because only 22.7 percent of native male workers lacked a high school diploma in 1980. By contrast, the proportion of immigrants with college degrees is similar to the proportion of native Ameri- can workers with college degrees. The data for 1988 tell an even more striking story of disparity among dropouts: 36.0 percent of immigrant men compared to 15.3 percent of native men in the labor force lacked a high school diploma. The figures for female immigrant workers follow the same pattern: a dispro-
10. We also made estimates assuming that 50 percent of the uncounted illegal workers were Mexican, on the basis of the Warren and Passel estimate that approximately 50 percent of the counted illegals in the 1980 Census are of Mexican origin. The results differed only modestly from those reported here.
230 G. J. Borjas, R. B. Freeman, and L. F. Katz
Table 7.3 Educational Distributions of Immigrant and Native Workers, i9no-nn
Percentage Shares ~
Males Females Completed Years of Schooling 1980 1983 1986 1988 1980 1983 1986 1988
Counted plus uncounted immigrants Less than 12 39.6 34.1 12 22.4 22.5 13-15 16.3 18.1 I6 or more 21.7 25.3
Natives Less than 12 22.7 19.0 12 37.9 35.8 13-15 19.2 22.6 16 or more 20.2 22.1
Counted immigrants Less than 12 37.5 31.6 12 23.0 23.1 13-15 16.9 18.8 16 or more 22.6 26.5
36.9 36.0 35.7 29.7 21.0 28.3 23.1 22.6 30.3 30.3 30.8 21.6 16.3 16.2 17.9 18.1 20.5 21.8 23.1 25.1 16.0 22.1 21.7 22.3
16.5 15.3 18.2 14.2 12.1 11.0 36.5 36.0 44.9 42.8 41.6 40.6 23.6 24.6 20.9 24.8 26.6 21.6 23.3 24.0 16.0 18.2 19.6 20.1
34.7 33.7 34.0 21.7 24.8 26.2 24.4 23.2 31.2 30.9 31.7 28.3 16.9 16.8 18.4 18.6 21.1 22.5 24.0 26.2 16.4 22.8 22.4 23.0
Sources: Educational distributions for natives and for counted immigrants are based on the num- ber of immigrant and native workers with the specificed education levels counted in the 1980 Census of Population, the April 1983 CPS, and the June 1986 and 1988 CPSs. The education distribution for uncounted immigrants is based on a weighted average of the education distribu- tions of counted Mexican immigrant workers (75 percent) and all other counted immigrant work- ers (25 percent) who entered the United States from 1975 to 1980; these educational distributions were tabulrlted from the 1980 Census and are displayed in fig. 7.3. The total numbers of un- counted immigrants by sex and year are from table 7.1.
portionate number were high school dropouts compared to native female workers.
Turning to changes over time, table 7 . 3 shows that the share of native work- ers with less than a high school degree fell sharply in the 1980s. Indeed, the underlying statistics reveal a massive 5.6 million drop in the number of U.S.- born workers with less than a high school degree from 1980 (19.2 million) to 1988 (13.6 million). This is the result of the retirement of older less-educated workers and increased rates of high school graduation among younger co- horts. For immigrants, by contrast, the high school dropout share of workers fell modestly, and there was an actual growth in the number of dropout immi- grant workers by some 0.8 million persons. The implication is that, during the 1980s, immigration became a major source of the supply of high school dropout workers whereas it was only a much smaller source of the supply of more-educated workers.
Table 7.4 pursues this implication by reorganizing the data on the numbers of immigrant and native workers by education to show the relative increment
231 Labor Market Effects of Immigration and Trade
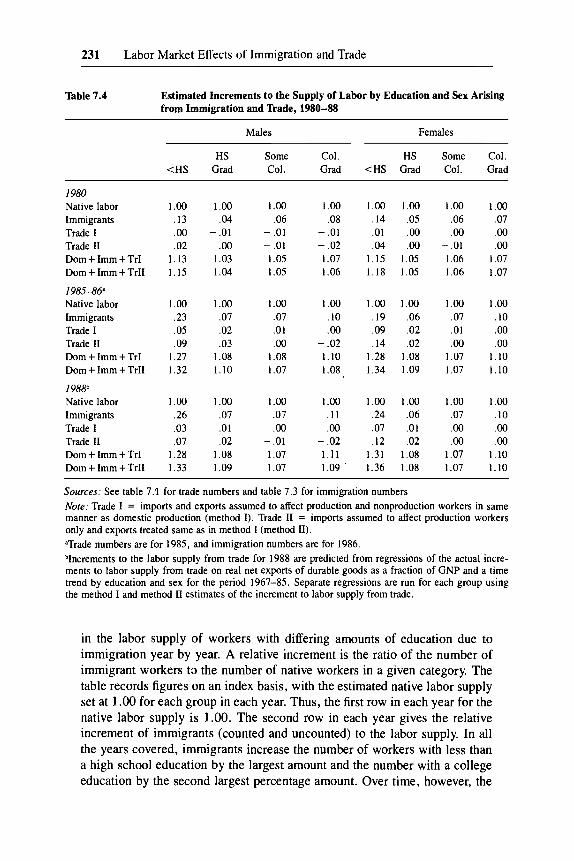
Table 7.4 Estimated Increments to the Supply of Labor by Education and Sex Arising from Immigration and 'lkade, 1980-88
Males Females
HS Some Col. HS Some Col. <HS Grad Col. Grad <HS Grad Col. Grad
1980 Native labor Immigrants Trade I Trade I1 Dom + Imm + TrI Dom + Imm + TrII
1985-86' Native labor Immigrants Trade I Trade I1 Dom + Imm + TrI Dom + Imm + TrII
198P Native labor Immigrants Trade I Trade I1 Dom + Imm + TrI Dom + Imm + TrII
1 .oo .13 .oo .02
1.13 1.15
1 .oo .23 .05 .09
1.27 1.32
1 .oo .26 .03 .07
1.28 1.33
1 .oo 1 .oo 1 .oo .04 .06 .08
- .01 - .01 - .01 .oo - .01 - .02
1.03 1.05 1.07 1.04 1.05 1.06
1 .oo 1 .oo 1 .oo .07 .07 .10 I02 .01 .oo .03 .oo -.02
1.08 1.08 1.10 1.10 1.07 1.08
1 .oo 1 .oo 1 .oo .07 .07 . I 1 .01 . 00 .oo .02 - .01 - .02
1.08 1.07 1 . 1 1 1.09 1.07 1.09
1.00 1.00 .14 .05 .01 .oo .04 .oo
1.15 1.05 1.18 1.05
1.00 1.00 .19 .06 .09 .02 .14 .02
1.28 1.08 1.34 1.09
1.00 1.00 .24 .06 .07 .01 .12 .02
1.31 1.08 1.36 1.08
1 .oo .06 .oo
- .01 1.06 1.06
1 .oo .07 .01 .oo
1.07 1.07
1 .oo .07 .oo .oo
1.07 1.07
1 .oo .07 .oo .oo
1.07 1.07
1 .oo .10 .oo .oo
1.10 1.10
1 .oo . I0 .oo .oo
1.10 1.10
Sources: See table 7.1 for trade numbers and table 7.3 for immigration numbers Nore: Trade I = imports and exports assumed to affect production and nonproduction workers in same manner as domestic production (method I). Trade I1 = imports assumed to affect production workers only and exports treated same as in method I (method 11). aTrade numbers are for 1985, and immigration numbers are for 1986 bIncrements to the labor supply from trade for 1988 are predicted from regressions of the actual incre- ments to labor supply from trade on real net exports of durable goods as a fraction of GNP and a time trend by education and sex for the period 1967-85. Separate regressions are run for each group using the method I and method I1 estimates of the increment to labor supply from trade.
in the labor supply of workers with differing amounts of education due to immigration year by year. A relative increment is the ratio of the number of immigrant workers to the number of native workers in a given category. The table records figures on an index basis, with the estimated native labor supply set at 1 .OO for each group in each year. Thus, the first row in each year for the native labor supply is 1.00. The second row in each year gives the relative increment of immigrants (counted and uncounted) to the labor supply. In all the years covered, immigrants increase the number of workers with less than a high school education by the largest amount and the number with a college education by the second largest percentage amount. Over time, however, the
232 G. J. Borjas, R. B. Freeman, and L. F. Katz
relative increment in the supply of high school dropouts due to immigration doubles, while the relative increment in the supply of more-educated workers due to immigration changes only modestly. In 1988, immigrant workers in- creased the work force of high school dropouts by approximately 25 percent, whereas immigrant workers increased the work force by high school gradu- ates by 6-7 percent and of college graduates by 10-1 1 percent.
7.3 The Effect of lkade and Immigration on Relative Labor Supplies
Taken together, trade and immigration substantially altered the nation's la- bor skill endowments during the 1980s. Table 7.4 examines the dimensions of this change in terms of the increment in the labor supplies of different educa- tional groups of workers due to these two components of the open economy. The third and fourth rows of each panel in the table show the ratio of the implicit labor supply due to trade to the native supply under assumptions I and 11. Since our estimates of the implicit labor supply in net trade flows by edu- cation and sex cover only the period 1967-85, we need to approximate the effect of trade in 1988. To do so, we regress the measures of implicit labor supply in trade by education and sex plotted in figures 7. l a and 7.16 on net exports in durable goods as a fraction of GNP (both measured in 1982 dollars) and on a linear time trend for the period 1967-1985." The entries for Trade I and Trade I1 for 1988 in table 7.4 are the predicted values from these regres- sions for 1988 (i.e., with real net exports in durable goods as a fraction of real GNP set at its 1988 value and with the time trend variable set to 1988). Finally, the fifth and six rows in each panel give the summation of the relevant sup- plies; they are our bottom-line estimates of the effect of immigration and trade on the nation's factor endowments.
The table shows that, because immigration and trade have been skewed toward increasing the work force with less than a high school education, whose native labor supply has been decreasing rapidly, they substantially al- tered the nation's labor skill endowments in the 1980s. In 1985-86, at the height of the trade deficit and after a decade of substantial legal and illegal immigration, the nation's effective supply of high school dropout men was 27-32 percent higher and the supply of high school dropout women 28-34
11. In other words, we run sixteen regressions of the form LX,, = Po + P,NX, + B>TIME, + E,,, where LX,, is the implicit labor supply in net exports in manufactures expressed as a fraction of the total domestic labor force for group i in year t , NX, is real net exports in durable goods divided by real GNP in year t , and TIME is a linear time trend. Two regressions of this form (one using method I and one using method I1 to measure the labor supply in trade flows) were run for eight demographic groups (two sexes by four education groups). The data on real GNP and real net exports in durable goods (both in 1982 dollars) are from U.S. Council of Economic Advisers (1990, pp. 296, 317). The results are quite similar when the real merchandise trade balance (in- cluding durable and nondurable goods) or overall real net exports are used in the prediction equa- tions as the measure of NX rather than real net exports of durable goods. The equations using net exports of durable goods tend to fit better than those using alternative measures of N X .
233 Labor Market Effects of Immigration and Trade
percent higher than it would otherwise have been. By contrast, the nation’s effective supply of college graduates was just 8-10 percent higher, exclusively because of immigration. Between 1980 and 1988, the contribution of trade and immigration to the effective supply of high school dropout workers rose from 13-15 percent to 28-33 percent of native labor supply for men and from 15-18 percent to 31-36 percent for women, while over the same period the contribution of trade and immigration to the effective supply of other groups increased much more modestly.
The finding that trade and immigration worked in the same direction to augment the relative supply of less-educated workers in the U.S. economy when that supply was falling rapidly in the 1980s is consistent with Heckscher-Ohlin models of trade and factor endowments (Mundell 1957; Samuelson 1948). The similar pattern of change in labor skills due to the two flows is inconsistent with the notion that immigrant flows alter factor supplies in an opposite manner than trade, as is possible when trade is generated by technology or scale factors (Markusen 1983).12 On the other hand, one must be cautious in using the skill content of actual immigration flows to infer the economic incentives for immigration of different skill groups because immi- gration flows are highly restricted by legal and institutional barriers. l 3 Simi- larly formal and informal trade barriers suggest that similar caveats apply to drawing strong conclusions about trade models from realized trade flows.
7.4 The Effect of Changes in Labor Skill Endowments on Relative Earnings
Were the trade- and immigration-induced changes in relative labor supplies large enough to have contributed to the huge increase in skill differentials in the U.S. labor market in the 1980s?
To answer this question in a simple and direct manner, we take two ap- proaches. First, we amalgamate our four education groups into two cate- gories-college-equivalent and high schookquivalent workers-and calcu- late the effect of immigration- and trade-induced changes in implicit labor supply on the earnings of these two groups using a single economy-wide esti- mated elasticity of substitution for them. Second, we perform a similar anal- ysis breaking the labor force into high school dropouts and all other workers. By amalgamating labor skill groups into two groups in both of these ap- proaches, we are able to avoid analyzing substitution among many groups of workers that would put great strains on our data. Treating the effects of
12. In these models, if export industries use skilled labor and technologyiscale economies generate exports, expansion of those industries will increase demand for skilled workers, inducing immigration of skilled labor. Thus, it is possible that a country will import “less-skilled’ labor through trade and skilled labor through immigration.
13. For a detailed analysis of the determinants of the skill content of U.S. immigration and of the institutions governing immigration flows, see Borjas (1990).
234 G. J. Borjas, R. B. Freeman, and L. F. Katz
changes in implicit labor supplies in the economy as a whole sidesteps the potentially complex relation between immigration and trade flows and the rel- ative prices and outputs of different industries. I4
7.4.1 The Effects of Trade and Immigration on the College/High School Wage Differential
We follow the procedure of Katz and Murphy (1992) in amalgamating education-gender categories into (1) less-skilled high school-equivalent workers and (2) more-skilled college-equivalent workers. We treat high school graduates (workers with exactly twelve years of schooling) as pure high school equivalents and college graduates (workers with sixteen or more years of schooling) as pure college equivalents. We allocate high school drop- outs (those with less than twelve years of schooling) and workers with some college (those with thirteen to fifteen years of schooling) to these two cate- gories on the basis of regressions of their wages on the wages of high school graduates and college graduates for the period 1963-87. This implicitly as- sumes that there are two skill groups in the economy and that workers in each education group represent a linear combination of the two groups.
Specifically, we sorted our individual-level March CPS data for each year into 320 gender-education-experience cells based on two gender, four educa- tion, and forty experience splits. We then computed average weekly wages for full-time workers in each of these 320 cells and used the cell averages to com- pute fixed-weight average weekly wages for our four education groups.'5 We used these fixed-weight average wages by education group to convert high school dropouts and workers with some college into high school and college equivalehts on the basis of the following annual time-series regressions for the period 1963-87:
w<,* = 0.932 wI2 - 0.048 w I 6 + , (0.072) (0.045)
w,,-,, = 0.686 wl2 + 0.293 w16+, (0.069) (0.043)
N = 25 for both, where w, is the fixed-weight average weekly wage of work- ers withj years of schooling, and standard errors are in parentheses.
The regression coefficients indicate that high school dropouts are compa- rable to high school graduates, with a discount factor of 0.932, and that those
14. As Bhagwati (1991) has pointed out, the changes in relative wages implied by this proce- dure have implications for import and export prices (lower wages for the less skilled should reduce the price of import substitutes and of low-skill service-sector activities) and thus for the sectoral composition of output.
15. The fixed weights used for computing the average wage for each education group were the average share of the gender-education-experience cell in employment for the education group over the entire period 1963-87.
235 Labor Market Effects of Immigration and Trade
with some college are also closer to high school graduates than to college graduates. On the basis of these regressions, we define the number of high school equivalents ( N H J and college equivalents (N,.) in the labor force as
NHs = 0.932 n<,2 + n,* + 0.686 n,,-,,,
N,, = -0.048 n<12 + 0.293 n,,-,, + n16+ ,
where n, is the fixed-weight total supply to the U.S. labor market of workers with j years of schooling. These equations indicate that this aggregation scheme essentially breaks the labor force into college graduates (college equivalents) and all other workers (high school equivalents). l 6
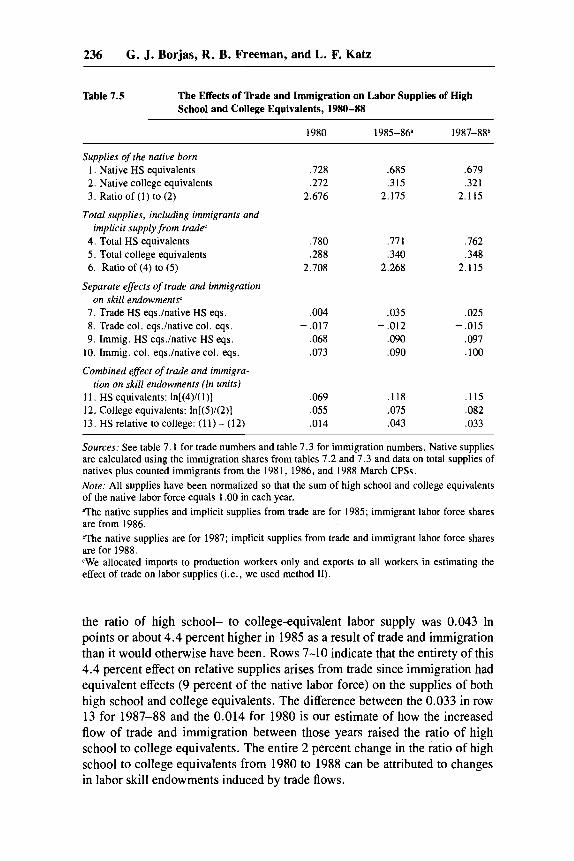
Using the equivalence formulas given above, we translated our estimates of the implicit labor supply by education due to trade and immigration into high school and college equivalents and compared them to the number of high school and college equivalents absent trade or immigration. Table 7.5 gives the results of these calculations. Rows 1 and 2 record the number of high school- or college-equivalent workers in the native work force-the work force we would have observed had there been no immigration-relative to the total native labor input in equivalent efficiency units (this is a normalization for ease of presentation). Row 3 gives the ratio of these units. Rows 4-6 treat the total supply of high school and college equivalents in the work force inclu- sive of the implicit supply embodied in trade and of immigrants. Rows 7-10 document the separate proportional contributions of trade and immigration to the supplies of high school and college equivalents. Trade has clearly shifted the nation’s skill endowments toward high schookquivalent workers. In con- trast, immigration had only quite minor effects on the relative supplies of high school and college equivalents during the 1980s. The reason for this small effect of immigration on relative labor supplies when the labor force is aggre- gated into college equivalents (essentially college graduates) and high school equivalents (essentially all others) is that, while immigration is most impor- tant for high school groups, it was much less important for those with twelve to fifteen years of schooling than it was for college graduates.
Rows 11-13 summarize the combined effects of trade and immigration on the supplies of high school and college equivalents. Row 11 records the In difference between the relative supply of high school-equivalent workers in- clusive of trade and immigration and the relative native supply, while row 12 records the analogous In difference for college-equivalent workers. These are our estimates of the proportional increases in the supply of high school and college equivalents in the United States that can be attributed to trade and immigration. Finally, row 13 shows the effect of trade and immigration on the ratio of the supply of high school to college equivalents. Row 13 indicates that
16. Our results are not very sensitive to the exact choice of weights used in forming college and high school equivalents as long as variations in the supply of college equivalents largely reflect variations in the supply of actual college graduates.
236 G. J. Borjas, R. B. Freeman, and L. F. Katz
Table 7.5 The Effects of Trade and Immigration on Labor Supplies of High School and College Equivalents, 1980-88
1980 1985-86" 1987-8gb
Supplies of the native born 1. Native HS equivalents 2. Native college equivalents 3. Ratio of (1) to (2)
.728 .685 .679 ,272 ,315 ,321
2.676 2.175 2.115
Total supplies, including immigrants and implicit supply from tradec
4. Total HS equivalents ,780 ,771 ,762 5 . Total college equivalents ,288 ,340 ,348 6. Ratio of (4) to ( 5 ) 2.708 2.268 2.115
Separate effects of trade and immigration on skill endowment9
7. Trade HS eqshative HS eqs. ,004 ,035 ,025 8. Trade col. eqshative col. eqs. - ,017 - ,012 - ,015 9. Immig. HS eqshative HS eqs. .068 .090 .097
10. Immig. col. eqshative col. eqs. ,073 ,090 ,100
Combined effect of rrade and immigra- tion on skill endowments (In units)
11. HS equivalents: ln[(4)/( I ) ] ,069 ,118 ,115 12. College equivalents: ln[(5)/(2)] ,055 .075 .082 13. HS relative to college: (1 1) - ( 12) ,014 .043 ,033
Sources: See table 7.1 for trade numbers and table 7.3 for immigration numbers. Native supplies are calculated using the immigration shares from tables 7.2 and 7.3 and data on total supplies of natives plus counted immigrants from the 1981, 1986, and 1988 March CPSs. Note: All supplies have been normalized so that the sum of high school and college equivalents of the native labor force equals 1 .OO in each year. 'The native supplies and implicit supplies from trade are for 1985; immigrant labor force shares are from 1986. T h e native supplies are for 1987; implicit supplies from trade and immigrant labor force shares are for 1988. 'We allocated imports to production workers only and exports to all workers in estimating the effect of trade on labor supplies (i.e., we used method 11).
the ratio of high school- to college-equivalent labor supply was 0.043 In points or about 4.4 percent higher in 1985 as a result of trade and immigration than it would otherwise have been. Rows 7-10 indicate that the entirety of this 4.4 percent effect on relative supplies arises from trade since immigration had equivalent effects (9 percent of the native labor force) on the supplies of both high school and college equivalents. The difference between the 0.033 in row 13 for 1987-88 and the 0.014 for 1980 is our estimate of how the increased flow of trade and immigration between those years raised the ratio of high school to college equivalents. The entire 2 percent change in the ratio of high school to college equivalents from 1980 to 1988 can be attributed to changes in labor skill endowments induced by trade flows.

237 Labor Market Effects of Immigration and Trade
Table 7.6 Estimated Contribution of 'Ikade and Immigration to the Change in the College/High School Log Wage Differential, 1980-88
Levels Changes
1980 1985-86 1987-88 1980-85 1980-88
Actual collegeihigh school log wage differential' ,391 ,498 ,515 ,107 ,124 Predicted change in differen- tial from change in relative skill endowments induced by trade and immigration:b a ) Elasticity = 0.709 ,010 ,030 ,023 ,020 ,013 b) Elasticity = 1.0 ,014 ,043 ,033 ,029 ,019
% contribution of change in relative skill endowments in- duced by trade and immigra- tion to the actual change in the earnings differential:'
c) Elasticity = 0.5 ,007 ,022 ,017 ,015 ,010
a ) Elasticity = 0.709 . . . . . . . . . 19 10 b) Elasticity = 1 .O . . . . . . . . . 27 15 c) Elasticity = 0.5 . . . . . . . . . 14 8
"he actual differential is from Katz and Murphy (1992) and is the fixed-weight average college/ high school log weekly wage differential for full-time workers in sixteen sex-potential experience groups computed from the March CPSs. The fixed weights are the average shares of each of the sixteen sex-experience groups in total employment for the entire period 1963-87. The differen- tials in the levels columns are for 1980, 1985, and 1987. bEIasriciry refers to the absolute value of the elasticity of the collegeihigh school relative wage with respect to the relative supply of college and high school equivalents. The entries in row 2 are the combined trade- and immigration-induced changes in skill endowments from row 13 of table 7.5 times the assumed elasticities. < I 0 0 X [(row 2)/(row I)].
Table 7.6 turns from relative supplies to relative earnings. Row 1 records estimates from Katz and Murphy (1992) of the In ratio of the earnings of college- to high school-equivalent workers from 1980 to 1988 and gives changes in this measure of the In college/high school wage differential. These figures show that the college wage premium rose sharply in the
17. The relative earnings measure is a fixed-weight average of the In collegeihigh school weekly wage differential for full-time workers in sixteen sex-experience groups (both sexes by eight five-year potential experience brackets). The fixed weights are the average shares of each of the sixteen sex-experience groups in total employment for the entire period 1963-87. These esti- mates are based on all full-time workers with one to forty years of potential experience who participated in the labor force for at least thirty-nine weeks in the calendar year prior to each March CPS survey, including immigrants. While we would have preferred to record earnings differentials for native workers only, to get a better fix on the effect of trade and immigration on the labor market for natives, the March CPSs do not provide information that allows us to distin- guish between native and foreign-born workers.
238 G. J. Borjas, R. B. Freeman, and L. F. Katz
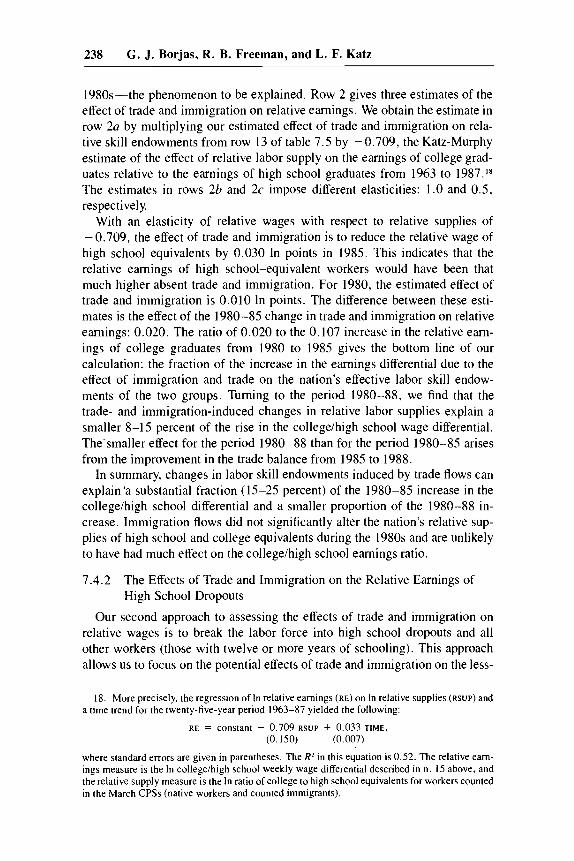
1980s-the phenomenon to be explained. Row 2 gives three estimates of the effect of trade and immigration on relative earnings. We obtain the estimate in row 2a by multiplying our estimated effect of trade and immigration on rela- tive skill endowments from row 13 of table 7.5 by -0.709, the Katz-Murphy estimate of the effect of relative labor supply on the earnings of college grad- uates relative to the earnings of high school graduates from 1963 to 1987.18 The estimates in rows 2b and 2c impose different elasticities: 1.0 and 0.5, respectively.
With an elasticity of relative wages with respect to relative supplies of -0.709, the effect of trade and immigration is to reduce the relative wage of high school equivalents by 0.030 In points in 1985. This indicates that the relative earnings of high school-equivalent workers would have been that much higher absent trade and immigration. For 1980, the estimated effect of trade and immigration is 0.010 In points. The difference between these esti- mates is the effect of the 1980-85 change in trade and immigration on relative earnings: 0.020. The ratio of 0.020 to the 0.107 increase in the relative earn- ings of college graduates from 1980 to 1985 gives the bottom line of our calculation: the fraction of the increase in the earnings differential due to the effect of immigration and trade on the nation's effective labor skill endow- ments of the two groups. Turning to the period 1980-88, we find that the trade- and immigration-induced changes in relative labor supplies explain a smaller 8-15 percent of the rise in the collegeihigh school wage differential. The'smaller effect for the period 1980-88 than for the period 1980-85 arises from the improvement in the trade balance from 1985 to 1988.
In summary, changes in labor skill endowments induced by trade flows can explain 'a substantial fraction (15-25 percent) of the 1980-85 increase in the collegeihigh school differential and a smaller proportion of the 1980-88 in- crease. Immigration flows did not significantly alter the nation's relative sup- plies of high school and college equivalents during the 1980s and are unlikely to have had much effect on the collegeihigh school earnings ratio.
7.4.2 The Effects of Trade and Immigration on the Relative Earnings of High School Dropouts
Our second approach to assessing the effects of trade and immigration on relative wages is to break the labor force into high school dropouts and all other workers (those with twelve or more years of schooling). This approach allows us to focus on the potential effects of trade and immigration on the less-
18. More precisely, the regression of In relative earnings (RE) on In relative supplies (RSUP) and a time trend for the twenty-five-year period 1963-87 yielded the following:
RE = constant - 0.709 RSUP + 0.033 TIME,
where standard errors are given in parentheses. The R* in this equation is 0.52. The relative eam- ings measure is the In college/high school weekly wage differential described in n. 15 above, and the relative supply measure is the In ratio of college to high school equivalents for workers counted in the March CPSs (native workers and counted immigrants).
(0.150) (0.007)
239 Labor Market Effects of Immigration and Trade
Table 7.7 The Effects of n a d e and Immigration on Labor Supplies of High School Dropouts and All Other Workers, 1980-88
1980 1985-86a 1987-8gb
Supplies of the native born I . Native HS dropouts (dropouts) 2. Natives with 12 or more years of
schooling (HS or more)
Total supplies, including immigrants and implicit supply @om tradec
3. Total dropouts 4. Total HS or more
Separate effects of trade and immi- gration on skill endowment9
5 . Trade dropoutshative dropouts 6. Trade HS or morehative HS or
7. Immig. dropoutshative dropouts 8. Immig. HS or morehative HS or
more
more
Combined effect of trade and immi- gration on skill endowments (In units)
9. Dropouts: ln[(3)/( l ) ] 10. HS or more: ln[(4)/(2)] 11. Dropouts relative to HS or more:
(9) - (10)
,123
,877
,142 .924
,021
- ,009 .I33
.061
,144 .051
,092
,087
,913
,115 ,990
.I07
- ,006 .217
,079
.281 ,081
,200
.082
,918
.I09 ,997
,085
.ooo ,253
,085
.292 ,082
.210
Sources: See table 7.. 1 for trade numbers and table 7.3 for immigration numbers. Native supplies are calculated using the immigration shares from tables 7.2 and 7.3 and data on total supplies of natives plus counted immigrants from the 1981, 1986, and 1988 March CPSs. Note: All labor supplies are measured in efficiency units. All supplies have been normalized so that the sum of supplies of native high school dropouts and all other native workers in the labor force equals 1 .OO in each year. aThe native supplies and implicit supplies from trade are for 1985; immigrant labor force shares are from 1986. bThe native supplies are for 1987; implicit supplies from trade and immigrant labor force shares are for 1988. 'We allocated imports to production workers only and exports to all workers in estimating the effect of trade on labor supplies (i.e., we used method 11).
skilled workers who appear most likely to be significantly affected by trade and immigration flows.
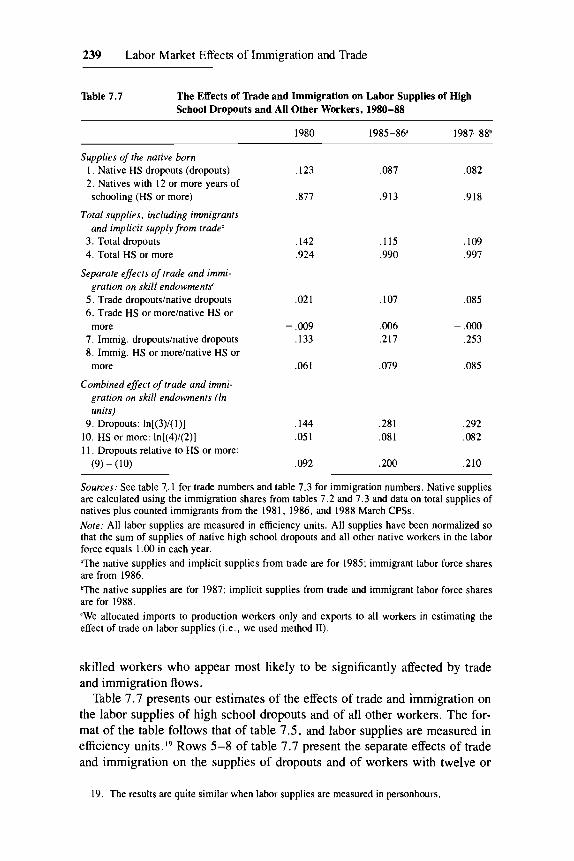
Table 7.7 presents our estimates of the effects of trade and immigration on the labor supplies of high school dropouts and of all other workers. The for- mat of the table follows that of table 7.5, and labor supplies are measured in efficiency units.I9 Rows 5-8 of table 7.7 present the separate effects of trade and immigration on the supplies of dropouts and of workers with twelve or
19. The results are quite similar when labor supplies are measured in personhours.
240 G. J. Borjas, R. B. Freeman, and L. F. Katz
more years of schooling. Table 7.7 reinforces the message of table 7.4 and indicates that both trade and immigration have greatly expanded the supply of dropouts relative to the aggregate of all other workers. Rows 9-1 1 summarize the combined effects of trade and immigration on the relative supply of drop- outs. Row 9 indicates that the contribution of trade and immigration to the supply of dropouts increased from approximately 15 percent in 1980 (0.144 In points) to over 30 percent (0.292 In points) in 1988. The effect of trade and immigration on the relative supply of dropouts increased from 10 percent (0.094 In points) in 1980 to 23 percent (0.21 In points) in 1988.
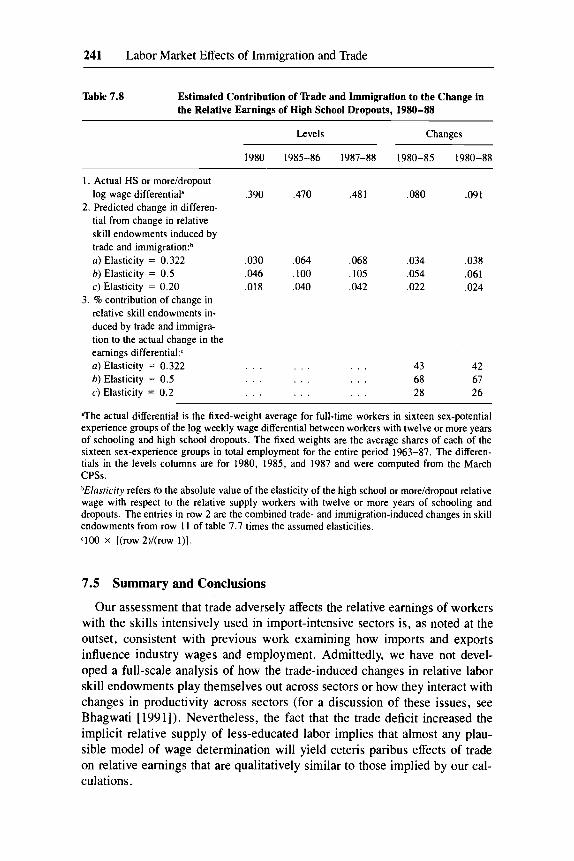
Table 7.8 translates the changes in relative supplies into changes in the rel- ative earnings of dropouts. Row 1 presents a fixed-weight average for sixteen sex-experience groups of the In ratio of the earnings of workers with twelve or more years of schooling to those of high school dropouts. The relative earnings of dropouts declined by 0.091 In points from 1980 to 1988. Row 2 presents the predicted change in the differential from the changes in relative supply induced by trade and immigration. Predicted changes are presented for three different assumptions about the elasticity of the relative wage of drop- outs with respect to the relative supply of dropouts. The estimated elasticity in row 2a of 0.322 comes from a time-series regression over the 1963-87 period of the In relative wage measure presented in row 1 on the In relative supply of dropouts measured in efficiency units and on a linear time trend.20 This estimate of the elasticity implies that trade- and immigration-induced changes in relative skill endowments can explain over 40 percent of the 9 In point decline in the relative earnings of high school dropouts during the 1980s. These are substantial effects compared to the effects of changes in la- bor rents arising from industrial shifts or the decline in unionization stressed by Blackburn, Bloom, and Freeman (1990), Bound and Johnson (1989), and Katz and Revenga (1989) in their attempts to account for the deterioration in the relative earnings of less-educated men. Both trade and immigration played large roles in affecting the relative supply of dropouts, and thus both contrib- ute substantially to the predicted change in relative earnings from changes in skill endowments. The alternative elasticity assumptions also imply large ef- fects.
In summary, the basic fact uncovered in our calculations-that trade and immigration have greatly increased the effective labor supply of high school dropouts-implies that trade and immigration flows may have contributed substantially to the poor labor market performance of the least educated American workers during the 1980s.
20. More precisely, the regression of In relative earnings (RE) on In relative supplies (RSUP) and a time trend for the twenty-five-year period 1963-87 yielded the following:
RE = constant - 0.322 RSUP + 0.023 TIME (0.138) (0 .o 10)
where standard errors are given in parentheses. The R2 in this equation is 0.48.
241 Labor Market Effects of Immigration and Trade
Table 7.8 Estimated Contribution of 'kade and Immigration to the Change in the Relative Earnings of High School Dropouts, 1980-88
Levels Changes
1980 1985-86 1987-88 1980-85 1980-88
1. Actual HS or more/dropout
2. Predicted change in differen- log wage differential" ,390 ,470 .48 1 ,080 ,091
3
- tial from change in relative skill endowments induced by trade and immigration:b a) Elasticity = 0.322 ,030 ,064 ,068 ,034 ,038 6 ) Elasticity = 0.5 .046 ,100 ,105 ,054 .06 I c) Elasticity = 0.20 .018 ,040 ,042 .022 .024 % contribution of change in relative skill endowments in- duced by trade and immigra- tion to the actual change in the earnings differential? a) Elasticity = 0.322 . . . . . . . . . 43 42 6) Elasticity = 0.5 . . . . . . . . . 68 67 c) Elasticity = 0.2 . . . . . . . . . 28 26
'The actual differential is the fixed-weight average for full-time workers in sixteen sex-potential experience groups of the log weekly wage differential between workers with twelve or more years of schooling and high school dropouts. The fixed weights are the average shares of each of the sixteen sex-experience groups in total employment for the entire period 1963-87. The differen- tials in the levels columns are for 1980, 1985, and 1987 and were computed from the March CPSS. bElasticity refers t'o the absolute value of the elasticity of the high school or more/dropout relative wage with respect to the relative supply workers with twelve or more years of schooling and dropouts. The entries in row 2 are the combined trade- and immigration-induced changes in skill endowments from row 1 I of table 7.7 times the assumed elasticities. c lOO x [(row 2)/(row I)].
7.5 Summary and Conclusions
Our assessment that trade adversely affects the relative earnings of workers with the skills intensively used in import-intensive sectors is, as noted at the outset, consistent with previous work examining how imports and exports influence industry wages and employment. Admittedly, we have not devel- oped a full-scale analysis of how the trade-induced changes in relative labor skill endowments play themselves out across sectors or how they interact with changes in productivity across sectors (for a discussion of these issues, see Bhagwati [1991]). Nevertheless, the fact that the trade deficit increased the implicit relative supply of less-educated labor implies that almost any plau- sible model of wage determination will yield ceteris paribus effects of trade on relative earnings that are qualitatively similar to those implied by our cal- culations.
242 G. J. Borjas, R. B. Freeman, and L. F. Katz
Our assessment that immigration also adversely affected the relative earn- ings of American high school dropouts, however, diverges from the results of the empirical literature that attempts to determine the effect of immigration on economic conditions in local labor markets. These studies find modest and imprecisely estimated differences in the earnings and employment opportuni- ties of native workers residing in cities with sizable immigrant flows and those residing in cities with limited numbers of immigrants.
There are several potential ways of reconciling the two sets of findings. Perhaps the factors that drive labor markets toward equilibrium operate with sufficient speed so that the effects of immigration on a given region are quickly diffused throughout the country. If so, there would be little reason to expect any correlation between the presence of immigrants in a particular locality and economic conditions in that locality. For instance, it may be that native workers adjust their migration behavior to take account of (competing) immi- grant flows so that immigration ultimately has only modest effects on area labor supplies. Card (1990) finds that Miami’s actual population after the Mar- iel Boatlift was similar to the population projections made prior to the (unex- pected) migration of 125,000 Cubans in 1980. Alternatively, the gateway cit- ies that attracted immigrants may have just happened to be those that were experiencing reduced net native migration as Filer’s [in this volume] analysis of the 1980 Census indicates. This explanation, however, is not consistent with the more recent evidence reported by Butcher and Card (1991), who show that, during the 1980s, natives and immigrants tended to move to the same cities. Finally, perhaps an influx of immigrants raises the demand for goods and services in an area by enough to offset the potential adverse effects of the irlcreased labor supply on earnings and employment opportunities.
Under any of these conditions, our economy-wide analysis would correctly answer the question, How has the increase in immigration affected relative labor supplies and ultimately relative earnings? In contrast, the local labor market analyses would correctly answer the question, How does an increase in immigration in a particular area affect relative earnings in that locality? We believe that the “macro” implications of immigration provided by our study are as relevant to the debate over immigration policy as the “micro” insights provided by the existing literature.
It is also possible, however, that the difference in results from the two dif- ferent analytic approaches reflects the inadequacy of existing economic theory and empirical models. In other words, the labor market effects of immigration and trade work through channels that are not easily incorporated into our con- ceptual framework or that are imperfectly measured by the available data. Nevertheless, whatever the ultimate explanation for the different results ob- tained from the two modes of analysis, our empirical evidence suggests that both the immigration flows and the trade deficits of the 1980s adversely af- fected the economic position of less skilled Americans. At a minimum, our analysis reveals that immigration and trade significantly altered the nation’s
243 Labor Market Effects of Immigration and Trade
labor skill endowments by enough to have contributed substantially to the decline in the relative earnings of less-skilled workers during the 1980s.
References
Abowd, John M. 1991. Appendix: The NBER Immigration, Trade, and Labor Markets Data Files. In Abowd and Freeman (1991).
Abowd, John M., and Richard B. Freeman, eds. 1991. Immigration, Trade, and the Labor Market. Chicago: University of Chicago Press.
Altonji, Joseph G., and David Card. 1991. The Effects of Immigration on the Labor Market Outcomes of Less-skilled Natives. In Abowd and Freeman (1991).
Bhagwati, Jagdish. 1991. Free Traders and Free Immigrationists: Strangers or Friends? New York: Russell Sage Foundation, April. Typescript.
Blackburn, McKinley, David Bloom, and Richard Freeman. 1990. The Declining Eco- nomic Position of Less-skilled American Males. In A Future of Lousy Jobs? ed. G. Burtless. Washington, D.C.: Brookings.
Borjas, George J. 1990. Friends or Strangers: The Impact of Immigrants on the US. Economy. New York: Basic.
Borjas, George J., Richard B. Freeman, and Kevin Lang. 1991. Undocumented Mexican-born Workers in the United States: How Many, How Permanent? In Abowd and Freeman (1991).
Bound, John, and George Johnson. 1989. Changes in the Structure of Wages during the 1980s: An Evaluation of Alternative Explanations. NBER Working Paper no. 2983, May.
Butcher, Kristen F., and David Card. 1991. Immigration and Wages: Evidence from the 1980s. American Economic Review 81(May):292-96.
Card, David. 1990. The Impact of the Mariel Boatlift on the Miami Labor Market. Industrial and Labor Relations Review 43(January):245-57.
Freeman, Richard B., and Lawrence F. Katz. 1991. Industrial Wage and Employment Determination in an Open Economy. In Abowd and Freeman (1991).
Juhn, Chinhui, Kevin M. Murphy, and Brooks Pierce. 1992. Wage Inequality and the Rise in the Return to Skill. Journal of Political Economy (forthcoming).
Katz, Lawrence F., and Kevin M. Murphy. 1992. Changes in Relative Wages in the United States, 1963-87: Supply and Demand Factors. Quarterly Journal of Eco- nomics 107(February):35-78.
Katz, Lawrence F., and Ana L. Revenga. 1989. Changes in the Structure of Wages: The United States vs. Japan. Journal of the Japanese and International Economies 3(December):522-53.
LaLonde, Robert J., and Robert H. Topel. 1991. Labor Market Adjustments to In- creased Immigration. In Abowd and Freeman (1991).
MacPherson, D., and J. Stewart. 1990. The Effect of International Competition on Union and Nonunion Wages. Industrial and Labor Relations Review 43(April):434- 46.
Markusen, J. R. 1983. Factor Movements and Commodity Trade as Complements. Journal of International Economics 14:341-56.
Mundell, Robert. 1957. International Trade and Factor Mobility. American Economic Review 47:321-35.
Murphy, Kevin M., and Finis Welch. 1992. The Structure of Wages. Quarterly Jour- nal of Economics 107(February).
244 G. J. Borjas, R. B. Freeman, and L. F. Katz
Passel, Jeffrey S . , and Karen A. Woodrow. 1987. Change in Undocumented Alien Population in the United States, 1979-83. International Migration Review
Revenga, Ana L. 1989. Wage Adjustment in an Open Economy: International Trade and U.S. Manufacturing Wages. Harvard University, December. Typescript.
Samuelson. Paul. 1948. International Trade and the Equalization of Factor Prices. Economic Journal %(June): 163-84.
U.S. Bureau of the Census. 1980. Census of Population, vol. PC80-2-8B. Washing- ton, D.C.: U.S. Government Printing Office.
U.S. Council of Economic Advisers. 1990. Economic Report ofrhe President. Wash- ington, D.C.: U.S. Government Printing Office, February.
U.S. Immigration and Naturalization Service. 1990. Provisional Legalization Appli- cation Statistics. Washington, D.C.: Statistical Analysis Branch, 16 May.
Warren, Robert, and Jeffrey S. Passel. 1987. A Count of the Uncountable: Estimates of Undocumented Aliens Counted in the 1980 Census. Demography 24(August): 375-93.
Woodrow, Karen A., and Jeffrey S. Passel. 1990. Post-IRCA Undocumented Immigra- tion to the United States: An Assessment Based on the June 1988 CPS. Washington, D.C.: U.S. Bureau of the Census. May. Typescript.
Woodrow, Karen A , , Jeffrey S. Passel, and Robert Warren. 1987. Preliminary Esti- mates of Undocumented Immigration to the United States, 1980-1986: Analysis of the June 1986 Current Population Survey. In Proceedings of the Social Statistics Section of the American Statistical Association. 1987. Washington, D.C.: American Statistical Association.
21: 1304-34.