on temperature reduction and energy saving...
TRANSCRIPT

저 시-비 리- 경 지 2.0 한민
는 아래 조건 르는 경 에 한하여 게
l 저 물 복제, 포, 전송, 전시, 공연 송할 수 습니다.
다 과 같 조건 라야 합니다:
l 하는, 저 물 나 포 경 , 저 물에 적 된 허락조건 명확하게 나타내어야 합니다.
l 저 터 허가를 면 러한 조건들 적 되지 않습니다.
저 에 른 리는 내 에 하여 향 지 않습니다.
것 허락규약(Legal Code) 해하 쉽게 약한 것 니다.
Disclaimer
저 시. 하는 원저 를 시하여야 합니다.
비 리. 하는 저 물 리 목적 할 수 없습니다.
경 지. 하는 저 물 개 , 형 또는 가공할 수 없습니다.
공학석사학위논문
Evaluation of Urban Green Rooftops
on Temperature Reduction and
Energy Saving Potential: Case Study of Seoul National University Civil and
Environmental Engineering Building Rooftop
도심형 옥상녹화에 의한 온도 저감과 에너지 절약
포텐셜에 관한 고찰: 서울대학교 건설환경공학부
옥상녹화 사례 연구
2018년 8월
서울대학교 대학원
건설환경공학부
THERESIA GITA HAPSARI WARSOKUSUMO
Evaluation of Urban Green Rooftops on
Temperature Reduction and Energy Saving
Potential: Case Study of Seoul National University Civil and
Environmental Engineering Building Rooftop
도심형 옥상녹화에 의한 온도 저감과 에너지 절약
포텐셜에 관한 고찰: 서울대학교 건설환경공학부
옥상녹화 사례 연구
지도교수 한무영
이 논문을 공학석사 학위논문으로 제출함
2018년 8월
서울대학교 대학원
건설환경공학부
THERESIA GITA HAPSARI WARSOKUSUMO
THERESIA GITA HAPSARI WARSOKUSUMO의
석사 학위논문을 인준함
2018년 8월
위 원 장 최 용 주 (인)
부 위 원 장 한 무 영 (인)
위 원 최 정 권 (인)
Evaluation of Urban Green Rooftops on
Temperature Reduction and Energy Saving
Potential: Case Study of Seoul National University Civil and
Environmental Engineering Building Rooftop
도심형 옥상녹화에 의한 온도 저감과 에너지 절약
포텐셜에 관한 고찰: 서울대학교 건설환경공학부
옥상녹화 사례 연구
By
Theresia Gita Hapsari Warsokusumo
Advisor: Professor Mooyoung Han
A dissertation submitted in partial fulfilment of the
requirements for the degree of Master in Civil and
Environmental Engineering
August, 2018
Department of Civil and Environmental Engineering
College of Engineering
Seoul National University

i
Abstract
Evaluation of Urban Green Rooftops
on Temperature Reduction and
Energy Saving Potential:
Case Study of Seoul National University Civil and
Environmental Engineering Building Rooftop
Theresia Gita Hapsari Warsokusumo
Dept. of Civil and Environmental Engineering
College of Engineering
Seoul National University
Urban green infrastructure (UGI), such as green roofs, are forms of
innovative approach to land development that have been widely implemented
as they are expected to reduce building’s energy consumption, as well as to
minimize the impact of urban heat island through roof surface temperature
reduction. In this study, an investigation was conducted to evaluate the
temperature dynamics and energy saving potential based on the result of
ii
monitoring four different rooftop types, including concrete,
conventional/convex green roofing, innovative design of concave green
roofing, and pond of the Seoul National University (SNU) Civil and
Environmental Engineering Department building for one year, from January
2017 to December 2017. The innovative design of concave green roof was
developed in 2012. It has a 320 mm retention wall surrounding the vegetation,
and a 65 mm retention board underneath the soil. Most convex green roofs do
not have a retention wall and their drainage boards typically have a maximum
depth of 25 mm. Furthermore, pond, a foundation that is able to withhold an
ample amount of rainwater, which is also a promising UGI, is often neglected
as a method to reduce the roof surface temperature in the summer and stabilize
it in the winter.
In the summer, the concave green roof reduced the temperature to a
greater extent than the concrete surface, with a significant difference of 17.5
℃, followed by pond with 17 ℃. In the winter, the concave green roof had a
higher temperature than the concrete surface due to its lower albedo, with a
maximum difference of 5.6 ℃. These temperature results revealed that the
indoor space under the concave green roof had the lowest average of heat gain
and heat loss with 2.63 kWh/day and 3.9 kWh/day, respectively, compared to
the concrete rooftop with 11.1 kWh/day and 8.9 kWh/day, respectively. In
conjunction with those results, to reach the standard comfortable indoor
temperature, the concave green roof had the lowest cooling and heating hours
of approximately 266 hours and 2,533 hours, respectively, which greatly

iii
reduced the consumption of cooling and heating energy. Likewise, the
concave green roof excelled in many aspects, including technical, economical,
and social, compared to the conventional solution for energy saving, the solar
panel. Through this research, it is evident that the concave green roof is the
most suitable approach to overcome the limitations of a normal rooftop
surface or the convex green roof, which is the staple of UGI and often used
to stabilize building rooftop’s temperature fluctuation. Securing the roof
surface temperature in order to maintain a comfortable condition for the
indoor space is proven to be compulsory, as it also leads to the improvement
of long-term energy saving performance of a building.
Keyword: Energy; Green roof; Pond; Temperature reduction; Urban green
infrastructure; Urban heat island mitigation
Student number: 2016-22102

iv
<Table of Contents>
Abstract .......................................................................................................... i
<Table of Contents> .................................................................................... iv
<List of Figures> .......................................................................................... vi
<List of Tables> ......................................................................................... viii
Chapter 1. INTRODUCTION ..................................................1
1.1. Background............................................................................................ 1
1.2. Objectives .............................................................................................. 6
1.3. Dissertation scheme ............................................................................... 7
Chapter 2. LITERATURE REVIEW ......................................................... 8
2.1. Research trend ....................................................................................... 8
2.2. Green roof .............................................................................................. 9
2.2.1. Green roof thermal performance ................................................. 11
2.3. Pond ..................................................................................................... 14
2.4. Analysis on building’s energy performance ........................................ 15
Chapter 3. EVALUATION METHOD OF THE THERMAL
PERFORMANCE ON DIFFERENT TYPE OF ROOFTOP
SURFACES ................................................................................................. 18
3.1. Climatic condition (Seoul, South Korea) ............................................ 18
3.2. Building description ............................................................................ 20
3.2.1. Green roof ................................................................................... 21

v
3.2.2. Pond ............................................................................................ 24
3.3. Monitoring equipment ......................................................................... 26
3.4. Energy estimation analysis .................................................................. 29
Chapter 4. THERMAL PERFORMANCE AND ENERGY SAVING
ESTIMATION ANALYSIS ....................................................................... 37
4.1. Monitoring result ................................................................................. 37
4.2. Energy estimation result ...................................................................... 47
4.2.1. Degree days estimation result ..................................................... 47
4.2.2. Energy capacity estimation result ............................................... 49
4.3. Strategy for building’s temperature and energy reduction .................. 54
4.3.1. Technical analysis ....................................................................... 55
4.3.2. Economic analysis....................................................................... 58
4.3.3. Social analysis ............................................................................. 60
Chapter 5. CONCLUSION ........................................................................ 61
References.................................................................................................... 64
Appendix...................................................................................................... 75
국문 초록..................................................................................................... 80
vi
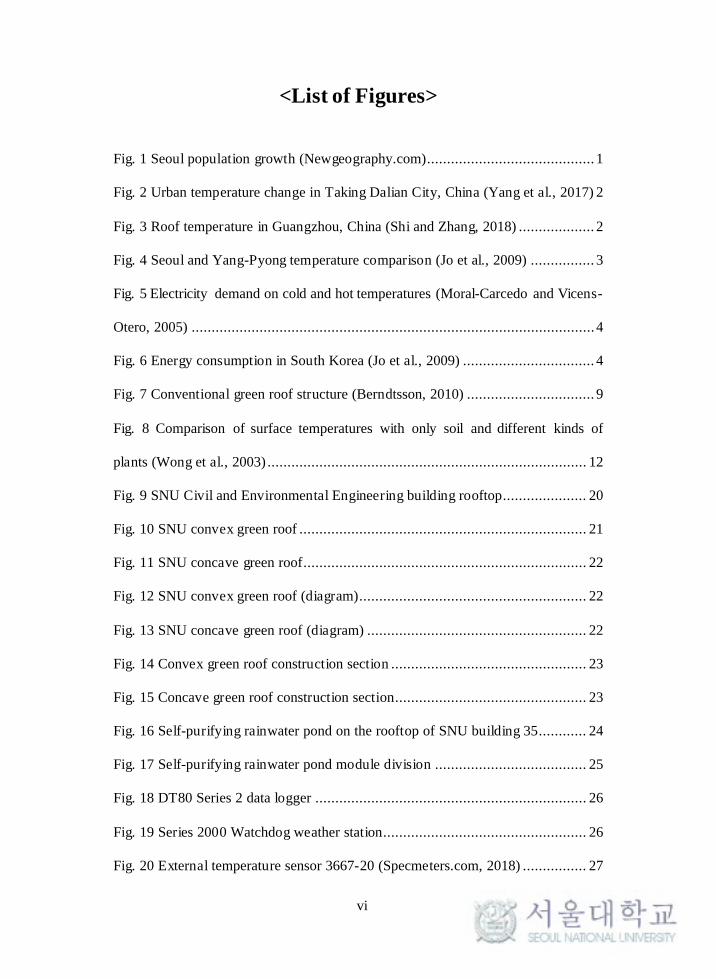
<List of Figures>
Fig. 1 Seoul population growth (Newgeography.com).......................................... 1
Fig. 2 Urban temperature change in Taking Dalian City, China (Yang et al., 2017) 2
Fig. 3 Roof temperature in Guangzhou, China (Shi and Zhang, 2018) ................... 2
Fig. 4 Seoul and Yang-Pyong temperature comparison (Jo et al., 2009) ................ 3
Fig. 5 Electricity demand on cold and hot temperatures (Moral-Carcedo and Vicens-
Otero, 2005) ..................................................................................................... 4
Fig. 6 Energy consumption in South Korea (Jo et al., 2009) ................................. 4
Fig. 7 Conventional green roof structure (Berndtsson, 2010) ................................ 9
Fig. 8 Comparison of surface temperatures with only soil and different kinds of
plants (Wong et al., 2003) ................................................................................ 12
Fig. 9 SNU Civil and Environmental Engineering building rooftop..................... 20
Fig. 10 SNU convex green roof ........................................................................ 21
Fig. 11 SNU concave green roof....................................................................... 22
Fig. 12 SNU convex green roof (diagram)......................................................... 22
Fig. 13 SNU concave green roof (diagram) ....................................................... 22
Fig. 14 Convex green roof construction section ................................................. 23
Fig. 15 Concave green roof construction section................................................ 23
Fig. 16 Self-purifying rainwater pond on the rooftop of SNU building 35............ 24
Fig. 17 Self-purifying rainwater pond module division ...................................... 25
Fig. 18 DT80 Series 2 data logger .................................................................... 26
Fig. 19 Series 2000 Watchdog weather station................................................... 26
Fig. 20 External temperature sensor 3667-20 (Specmeters.com, 2018) ................ 27

vii
Fig. 21 Moisture sensor ECH2O EC-5 (Metergroup.com, 2018).......................... 28
Fig. 22 Monitoring layout ................................................................................ 28
Fig. 23 Cooling energy saving estimation.......................................................... 35
Fig. 24 Heating energy saving estimation .......................................................... 35
Fig. 25 One-year surface temperature 2017 ....................................................... 37
Fig. 26 Highest rooftop surface temperature 2017.............................................. 38
Fig. 27 Temperature reduction 2017 ................................................................. 39
Fig. 28 Soil moisture vs. Rainfall ..................................................................... 39
Fig. 29 Temperature vs. Soil moisture............................................................... 41
Fig. 30 Highest rooftop surface temperature 2016.............................................. 42
Fig. 31 Lowest rooftop surface temperature 2017 .............................................. 43
Fig. 32 Temperature increase 2017 ................................................................... 44
Fig. 33 Highest temperature difference between night and day ........................... 45
Fig. 34 Temperature reduction at highest temperature difference ........................ 46
Fig. 35 Heat capacity in average monthly range................................................. 49
Fig. 36 Heat gain at maximum temperature ....................................................... 51
Fig. 37 Heat loss at minimum temperature ........................................................ 52

viii
<List of Tables>
Table 1. Differences of extensive and intensive green roofs (Oberndorfer et al., 2007;
Berndtsson, 2010). .......................................................................................... 10
Table 2. Soil temperature variations at different depth and season (Jim and Tsang,
2011).............................................................................................................. 13
Table 3. Climate data for Seoul (1981 – 2010) (Korea Meteorological Administrat ion)
...................................................................................................................... 19
Table 4. Thermal conductivity coefficient (Niachou et al., 2001; Castleton et al.,
2010).............................................................................................................. 34
Table 5. Soil moisture and precipitation event ................................................... 40
Table 6. Cooling degree days ........................................................................... 47
Table 7. Heating degree days ........................................................................... 48
Table 8. Average value of energy from monthly range ....................................... 49
Table 9. Average heat gain estimation result ..................................................... 51
Table 10. Average heat loss estimation result .................................................... 53
Table 11. Comparison of leachate from two types of roof (Seters et al., 2009) ..... 56
Table 12. Installation cost comparison of different rooftop media ....................... 58
1
Chapter 1. INTRODUCTION
1.1. Background
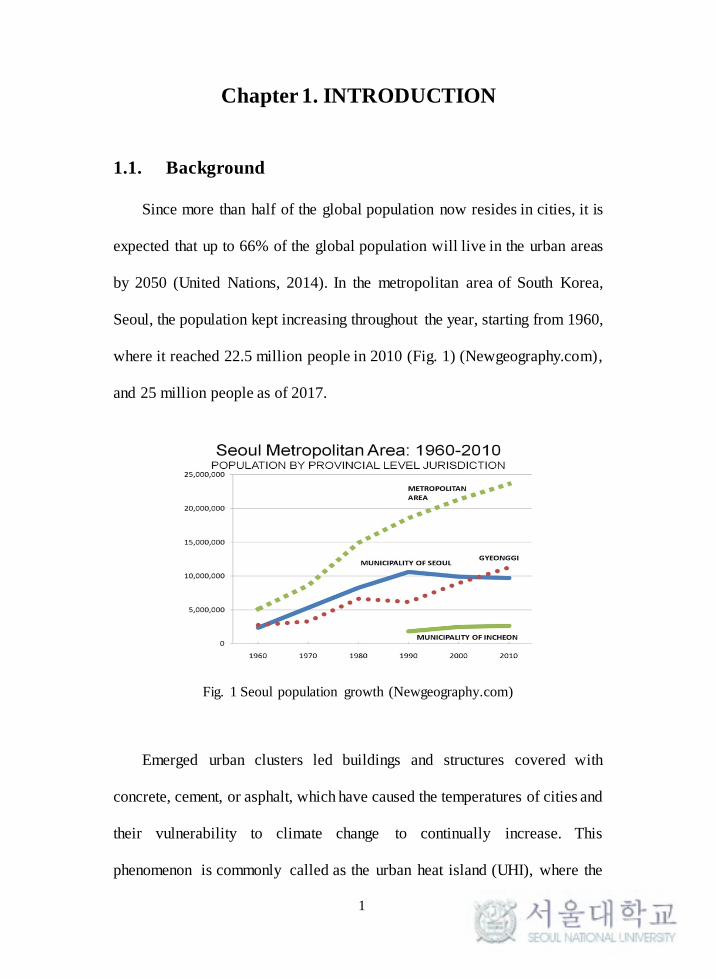
Since more than half of the global population now resides in cities, it is
expected that up to 66% of the global population will live in the urban areas
by 2050 (United Nations, 2014). In the metropolitan area of South Korea,
Seoul, the population kept increasing throughout the year, starting from 1960,
where it reached 22.5 million people in 2010 (Fig. 1) (Newgeography.com),
and 25 million people as of 2017.
Emerged urban clusters led buildings and structures covered with
concrete, cement, or asphalt, which have caused the temperatures of cities and
their vulnerability to climate change to continually increase. This
phenomenon is commonly called as the urban heat island (UHI), where the
Fig. 1 Seoul population growth (Newgeography.com)

2
urban temperatures are higher than the suburban or rural temperatures (Zhao
et al., 2017). One of the evidence of urban surface temperature increase due
to urbanization is shown in figure 2. The observed area is Taking Dalian City,
China, from 1999 – 2013, where it showed the result of the urban green area
and surface temperature distribution level (Yang et al., 2017). They classified
the temperature into five temperature range, and as the year went by, the green
area disappeared, and it was shown that the high temperature range which
was 313. 369 °K to 318.683 °K or 40 °C to 46 °C dominated the urban area.
Another observation in Guangzhou, China, also showed that the higher
temperature was mostly found in the rooftop covered concrete areas where
they got direct expose from the solar radiation (Fig. 3). It was reported that
the rooftop temperature reached an average of 40.7 °C (Shi and Zhang, 2018).
Fig. 2 Urban temperature change in
Taking Dalian City, China (Yang et al.,
2017)
Fig. 3 Roof temperature in
Guangzhou, China (Shi and Zhang,
2018)
3
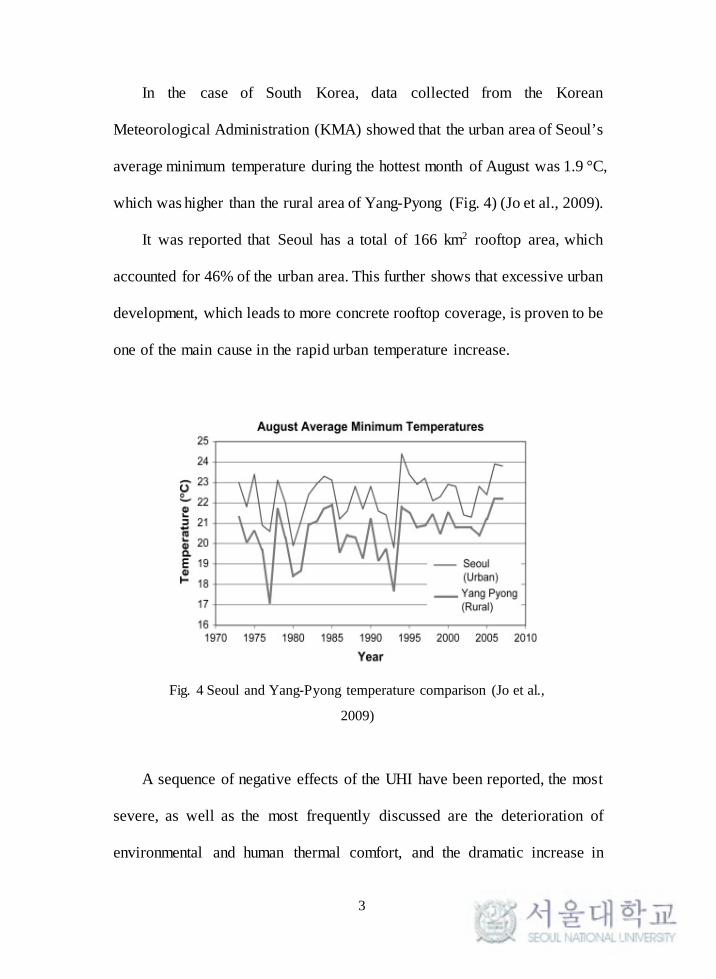
In the case of South Korea, data collected from the Korean
Meteorological Administration (KMA) showed that the urban area of Seoul’s
average minimum temperature during the hottest month of August was 1.9 °C,
which was higher than the rural area of Yang-Pyong (Fig. 4) (Jo et al., 2009).
It was reported that Seoul has a total of 166 km2 rooftop area, which
accounted for 46% of the urban area. This further shows that excessive urban
development, which leads to more concrete rooftop coverage, is proven to be
one of the main cause in the rapid urban temperature increase.
A sequence of negative effects of the UHI have been reported, the most
severe, as well as the most frequently discussed are the deterioration of
environmental and human thermal comfort, and the dramatic increase in
Fig. 4 Seoul and Yang-Pyong temperature comparison (Jo et al.,
2009)
4
energy consumption for cooling during summer due to the excessive rise in
temperature (Konopacki and Akbari, 2002; He, 2018). Wherefore, achieving
Sustainable Development Goals (SDG) 7, which is affordable and clean
energy by 2030 may not be possible.
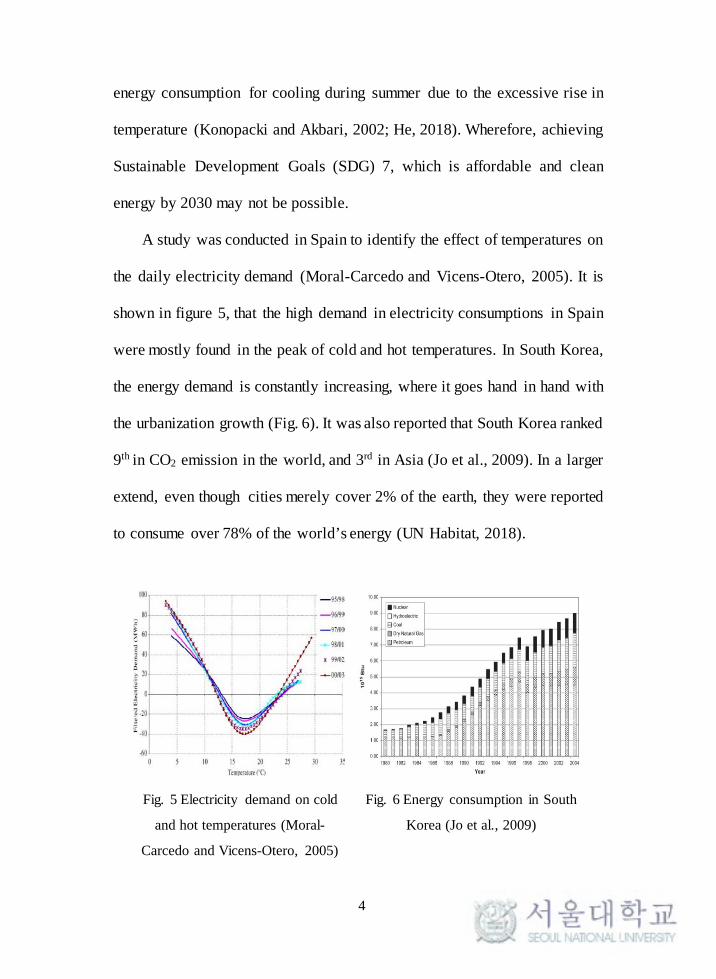
A study was conducted in Spain to identify the effect of temperatures on
the daily electricity demand (Moral-Carcedo and Vicens-Otero, 2005). It is
shown in figure 5, that the high demand in electricity consumptions in Spain
were mostly found in the peak of cold and hot temperatures. In South Korea,
the energy demand is constantly increasing, where it goes hand in hand with
the urbanization growth (Fig. 6). It was also reported that South Korea ranked
9th in CO2 emission in the world, and 3rd in Asia (Jo et al., 2009). In a larger
extend, even though cities merely cover 2% of the earth, they were reported
to consume over 78% of the world’s energy (UN Habitat, 2018).
Fig. 5 Electricity demand on cold
and hot temperatures (Moral-
Carcedo and Vicens-Otero, 2005)
Fig. 6 Energy consumption in South
Korea (Jo et al., 2009)
5
In order to reach a sustainable condition in terms of energy consumption,
urban areas require green space to restore the balance of urban temperature
and the damaged water cycle (Takebayashi and Moriyama, 2007). However,
creating additional green space is not easy, especially as urban planning,
including residential apartments, department stores, and office buildings have
dominated the urban development industry. Urban green infrastructure (UGI)
has gained popularity as a solution to this issue, where it utilizes small and
remaining spaces of a building. UGI is considered to be the current effective
strategy to cool the urban temperature and maintaining the balance of
building’s temperature mostly through evapotranspiration and insulation
(Saaroni et al., 2018). Likewise, green roofs play an important role in
regulating buildings’ heat flux, as well as mitigating the urban heat island
effect by increasing soil and vegetation covers (Alcazar et al., 2016). Most
studies on green roof that assess buildings’ energy efficiency, based their
research on the conventional characteristics of the green roof, which are
intensive green roofs with growing media depth of 100 – 300 mm, or typically
more than 200 mm, and extensive green roofs with thinner implementation
between 20 – 200 mm of soil depth that can only withstand small plants
(Sailor, 2008). This ignored the fact that stated that the energy benefits of a
green roof are mainly dependent on the local climate, building characteristics,
and most importantly, the green roof design (Santamouris, 2014). Another
alternative of UGI or innovative land development approach that still received
6
little acknowledgment is the implementation of ponds. Pond is able to
withhold a plenteous amount of rainwater, hence, a strong media for
evaporation process. Building’s heat and energy performance are still mainly
focused on white and reflective roofs, which are generally known as cool
roofs, as well as green roofs (Gaffin et al, 2006; Santamouris et al., 2007;
Castleton et al., 2010; Zinzi and Agnoli, 2012; Santamouris, 2014; Li et al.,
2014; Li and Norford, 2016).
1.2. Objectives
This research clarifies the performance of four different type of rooftop
surfaces in terms of their efficiency in surface temperature stabilization,
which will then lead to energy efficiency evaluation. This research is expected
to prove that the existence and continuous development of UGI is needed to
restore the roof surface temperature and improve energy performance of a
building. Specific objectives are as follows:
(1) Temperature behavior monitoring
a. To investigate and evaluate the temperature variation from
different rooftop media, including: concrete roofing,
conventional/convex green roofing, innovative design of concave
green roofing, and pond for one year in Seoul National University
(SNU) Civil and Environmental Engineering building.
7
(2) Energy saving potential evaluation
a. To calculate the duration of cooling and heating required for an
indoor room to reach the standard comfortable indoor
temperature under the influence of rooftop temperatures.
b. To estimate the potential of energy reduction from each rooftop
media in maintaining the indoor room at standard comfortable
indoor temperature.
(3) Mitigation strategy recommendation
a. To find the most suitable rooftop option from temperature
behavior and energy saving potential investigation.
b. To compare the green roof, as a representative of UGI with the
conventional option for energy saving, the solar panel.
1.3. Dissertation scheme
This study is composed of 5 chapters. Chapter 1 contains the introduction,
objectives, and dissertation scheme. Chapter 2 describes the literature review.
Chapter 3 describes the evaluation method of the thermal performance on
different type of rooftop surfaces, including: climatic condition, site
description, monitoring equipment, and the energy saving potential
estimation methodology. Chapter 4 includes the thermal performance and
energy saving potential estimation analysis. Chapter 5 is conclusion.
8
Chapter 2. LITERATURE REVIEW
2.1. Research trend
Numerous researches have been conducted in finding a solution to reduce
and stabilize the rooftop surface temperature and improve the performance of
building’s heat transfer and energy. Formerly, starting from 2002, insulation
was added to building walls and roofs to make the indoor space more cool
and comfortable (Kossecka and Kosny, 2002; Bolatturk, 2008; Aste et al.,
2009; Daouas, 2011). Solutions with multi-purposes function that are able to
mitigate the urban heat island, as well as green and ecological restoration in
the urban area were not verily considered. From 2009, rooftop coverage is
starting to get popular. Porous materials, such as, silica sand, volcanic ash,
pebbles, and siliceous shale were placed and compared on the rooftop to
investigate their ability to trap rainwater which then led to roof surface
temperature reduction performance and cooling the urban area through
evaporation process (Wanphen and Nagano, 2009). From 2010, the
implementation of cool roofs, which are light roofs, high reflectivity roofs,
and green roofs are starting to get implemented more (Castleton et al., 2010;
Jaffal et al., 2012; Sailor et al., 2012; Kolokotsa et al., 2013). In terms of
ponds, several studies have been conducted to investigate the water quality
improvement of self-purifying ponds (Metaxa et al., 2005; Tixier et al., 2011),
however, their ability to manage the urban temperature is still rarely discussed

9
(Rizwan et al., 2008; Kleerekoper et al., 2012).
2.2. Green roof
Green roof is one of a method of land development, as well as an act of
urban green environment and ecosystem reclamation. Green roof has the
ability to go conjointly with the present-day condition, essentially, better the
performance of air quality, noise reduction, urban heat island mitigation, and
most importantly, as a media to improve buildings’ energy performance.
Green roofs are mostly consisted of root barrier, drainage, filter fabric,
growing medium, and vegetation layer (Fig. 7) (Bianchini and Hewage,
2012).
Fig. 7 Conventional green roof structure (Berndtsson, 2010)

10
There are two types of green roof, extensive and intensive green roof (Table 1).
Table 1. Differences of extensive and intensive green roofs (Oberndorfer et al., 2007; Berndtsson, 2010).
Characteristic Extensive green roof Intensive green roof
Purpose Functional: thermal insulation, storm-water management, and
fireproofing
Functional and aesthetical, increased living and recreational
space, and ecosystem restoration
Structural requirements Standard roof weight-bearing parameters; additional 70-170
kg/m2 (Dunnett and Kingsbury, 2014)
Planning required in design phase or necessary structural
improvements; additional 290-970 kg/m2
Substrate type Lightweight, high porosity, and low organic matter Lightweight to heavy, high porosity, and low organic matter
Average substrate depth 2-20 cm >20 cm
Plant communities Low growing communities of plants No restrictions other than those imposed by substrate depth,
climate, building height, exposure, and irrigation facilities
Irrigation Little or no irrigation Often irrigation required
Maintenance Little or no maintenance required; weeding or mowing necessary Same maintenance requirements and similar garden at ground
Cost (Above waterproofing
membrane) $10-$30/ft2 ($100-$300/m2) $20 or more per ft2 ($200/m2)
Accessibility Generally functional rather than accessible and basic accessibility
for maintenance Accessible
11
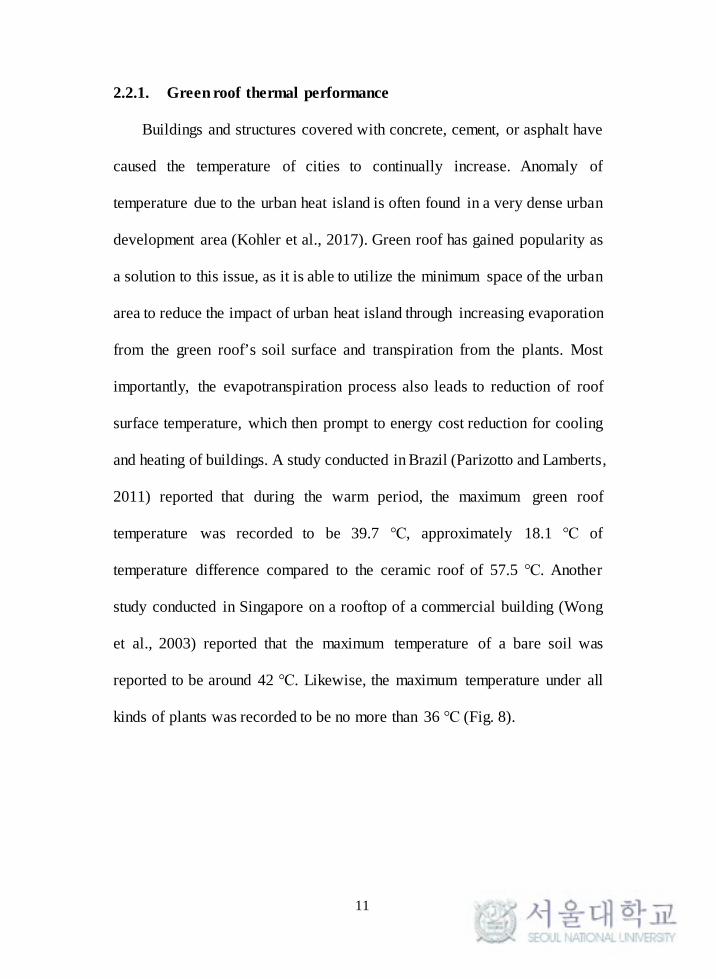
2.2.1. Green roof thermal performance
Buildings and structures covered with concrete, cement, or asphalt have
caused the temperature of cities to continually increase. Anomaly of
temperature due to the urban heat island is often found in a very dense urban
development area (Kohler et al., 2017). Green roof has gained popularity as
a solution to this issue, as it is able to utilize the minimum space of the urban
area to reduce the impact of urban heat island through increasing evaporation
from the green roof’s soil surface and transpiration from the plants. Most
importantly, the evapotranspiration process also leads to reduction of roof
surface temperature, which then prompt to energy cost reduction for cooling
and heating of buildings. A study conducted in Brazil (Parizotto and Lamberts,
2011) reported that during the warm period, the maximum green roof
temperature was recorded to be 39.7 ℃, approximately 18.1 ℃ of
temperature difference compared to the ceramic roof of 57.5 ℃. Another
study conducted in Singapore on a rooftop of a commercial building (Wong
et al., 2003) reported that the maximum temperature of a bare soil was
reported to be around 42 ℃. Likewise, the maximum temperature under all
kinds of plants was recorded to be no more than 36 ℃ (Fig. 8).

12
A study regarding the variation of green roof soil temperature at different
depts (surface, 10 cm depth, 50 cm depth, and 90 cm depth) was also
conducted (Table 2) (Jim and Tsang, 2011). For summer sunny days, the soil
surface temperature was in the range of 28 ℃ – 40 ℃, while below the surface,
it remained stable at 30 ℃. It was also reported that due to the diurnal
temperature difference, the average soil temperature was higher in the sunny
day than in the rainy day. Au contraire, the northeast monsoon delivers clear
sky which accelerated more heat loss from the green roof, resulting in lower
soil surface temperature in the winter sunny than the rainy day.
Fig. 8 Comparison of surface temperatures with only soil and
different kinds of plants (Wong et al., 2003)

13
Table 2. Soil temperature variations at different depth and season (Jim and
Tsang, 2011)
Soil Temp. Spring Summer
ST00 ST10 ST50 ST90 ST00 ST10 ST50 ST90
Max 40.57 28.27 28.02 28.12 58.80 31.71 31.54 31.77
Min 12.26 19.89 19.48 19.37 21.87 28.74 28.49 28.30
Average 22.91 23.57 23.31 23.34 31.01 30.57 30.32 30.34
Range 28.31 8.38 8.54 8.75 36.93 2.97 3.04 3.47
Soil Temp. Autumn Winter
ST00 ST10 ST50 ST90 ST00 ST10 ST50 ST90
Max 34.45 30.42 30.02 29.97 32.64 22.85 22.73 22.94
Min 7.95 19.03 18.34 18.18 5.81 15.03 14.27 14.03
Average 22.57 24.71 24.09 23.96 18.57 19.21 18.80 18.87
Range 26.49 11.39 11.67 11.79 26.83 7.82 8.46 8.92
14
2.3. Pond
Approaches have been projected in order to find the most corresponding
method to reduce the urban surface temperature, including the
implementation of trees and pond to balance the important heat parameters,
such as latent, sensible, and radiation (Mirzaei and Haghighat, 2010).
Research from Mirzaei was one of the few researches that embraced pond as
a method to mitigate the urban heat island, henceforward buildings’
temperature stabilization and energy consumption reduction. Mirzaei
concluded that by taking an approach on increasing the albedo’s materials by
expanding vegetations and ponds within the city, anthropogenic heat inside
building will be reduced. From Mirzaei’s research, it was proven that the
water ponds acted as a thermal mass where they absorbed and stored the
energy, then later released it through latent heat flux. This condition led to the
stabilization of building’s energy budget.
A research conducted by Robitu showed that the existence of vegetation
and ponds adjusted the energy balance, including the amount of solar
radiation that has direct contact with any land surface (Robitu et al., 2005).
Robitu’s result showed that ponds should be acknowledged as a method to
boost the improvement of urban thermal environment, as well as through
replacing the saturated air by drier air in the water and vegetation surfaces.

15
2.4. Analysis on building’s energy performance
Various researches investigating the impact of green roofs on the
efficiency of the roof surface temperature stabilization and how it affected the
indoor space’s cooling and heating performance are frequently discussed.
Jaffal conducted a research to see the impact of green roofs on building
energy performance of a single-family house located in France by presenting
a model that divided the green roof heat balance into two parts: the balance at
the foliage and at the soil surface (Jaffal et al., 2012). Accordingly, an energy
building simulation software, TRNSYS was used to conduct a heat transfer
calculation, starting from the roof slab until the inside of the building. It was
found that the indoor air temperature was decreased up to 2 ℃, and the annual
energy demand was reduced by 6%.
Del Barrio established a thermal model based on the influence of green
roof on building energy performance, where the green roof system was
divided into three main parts: canopy, soil, and roof slab (Del barrio, 1998).
A heat balance calculation was achieved for each part with consideration of
the boundary conditions at the canopy, soil, roof slab, and roof slab-indoor
air interfaces. Frankenstein and Koenig developed a Fast All – Season Soil
Strength (FASST) model where two heat balances were appraised at the roof
soil surface and at the foliage’s surface (Frankenstein and Koenig, 2004). The
heat and mass transfers in the canopy were studied in view of the leaf as a
platform in which the air circulates. Sailor developed an energy balance

16
model for the green roofs where the model was based on the energy balance
equations of FASST (Sailor, 2008). The model was then adjusted into the
Energy Plus program. Kumar and Kaushik developed a mathematical model
based on the work of Del Barrio to evaluate the thermal impact of green roofs,
as well as solar shading. It was validated for a green roof in Yamuna Nagar
(India), where the results suggested that a high value of the leaf area index
(LAI) parameter stabilized the air temperature fluctuation and reduced the
flux through the roof (Kumar and Kaushik, 2005).
Most researches have yet still focused on developing the best model to
predict the thermal behaviour or surface temperature of the green roof based
on how the heat flux travels through the green roof, therefore estimating the
consumption of cooling or heating of the indoor space below the green
rooftop. Nevertheless, even though green roofs are proven to have reduced
the roof’s surface temperature, as well as the building’s energy consumption,
there is still insignificant amount of research that discuss how the green roofs
or any other type of rooftop surfaces are affecting the actual duration needed
for the building’s actual cooling and heating performance. The method that is
commonly used is by directly comparing the indoor space’s air condition or
temperature below the normal rooftop as the control point and the green
rooftop. Thence, determining the amount of heat gain and heat loss, which
then concluded in the cooling and heating energy demand records annually.

17
In order to understand better the concept and benefits of heat and energy
after the implementation of green roofs and other UGI, unit conversions are
necessary to be done. Understanding the concept of heat and energy through
temperature is more coherent and straightforward, however, to reach this
concept, numerous factors are compulsory, e.g., thermal model factors of the
green roof established from Del Barrio, and Frankenstein and Koenig (Del
Barrio, 1998; Frankenstein and Koenig, 2004).
A method that is expected to be more approachable is by conversion to
time, hence degree days estimation. Degree days is an indicator and a simple
technique to get an understanding of one’s building energy consumption and
performance (Mourshed, 2012; De Rosa et al., 2014). It brings out the
significance of duration, as well as the intensity of the differences between
outdoor and indoor temperature. Correspondingly, De Rosa established a
building dynamic model based on degree days estimation concept (De Rosa
et al., 2014). It was shown that the model was able to predict the cooling and
heating energy demand – with the validation from common commercial
software, e.g., TRNSYS and Energy Plus. The model is also expected to be
able to be modified for the analysis of more complex and specific problems.
18
Chapter 3. EVALUATION METHOD OF THE
THERMAL PERFORMANCE ON DIFFERENT
TYPE OF ROOFTOP SURFACES
3.1. Climatic condition (Seoul, South Korea)
According to the Köppen climate classification (the most widely used
climate classification system), Seoul geographies as a humid
continental/subtropical climate with dry winter, called “Dwa”, which is a hot
summer continental climate. Seoul has for distinct season, winter, spring,
summer, and fall. In addition, the temperature difference between the hottest
period of summer and the coldest period of winter are extremely severe. It
was reported that the upper level jet stream of East Asia and the Western
Pacific is the strongest jet stream in the world, which is the cause of winter in
South Korea (Ding, 1994). Moreover, South Korea has shown an increase rate
of the mean annual temperature of 0.23 ℃ for the past five decades, from
1950 – 2000 (Jung et al., 2002). Jung also reported that the frequency of
extreme precipitation events has increased by 53% in the 1990s.
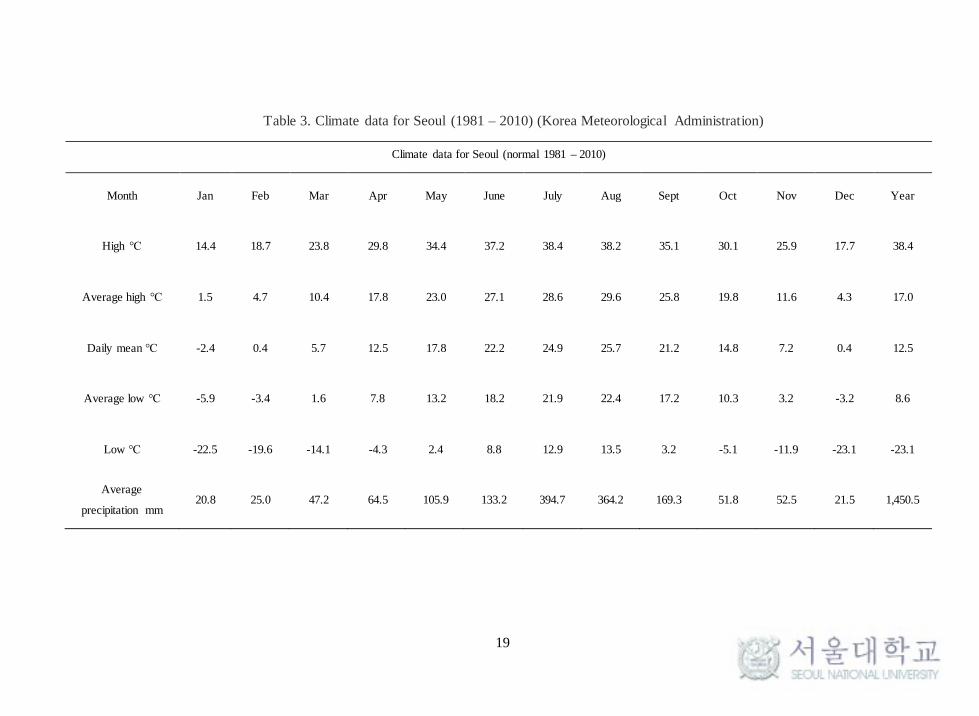
The summary of climate data of Seoul can be seen in table 3.
19
Table 3. Climate data for Seoul (1981 – 2010) (Korea Meteorological Administration)
Climate data for Seoul (normal 1981 – 2010)
Month Jan Feb Mar Apr May June July Aug Sept Oct Nov Dec Year
High ℃ 14.4 18.7 23.8 29.8 34.4 37.2 38.4 38.2 35.1 30.1 25.9 17.7 38.4
Average high ℃ 1.5 4.7 10.4 17.8 23.0 27.1 28.6 29.6 25.8 19.8 11.6 4.3 17.0
Daily mean ℃ -2.4 0.4 5.7 12.5 17.8 22.2 24.9 25.7 21.2 14.8 7.2 0.4 12.5
Average low ℃ -5.9 -3.4 1.6 7.8 13.2 18.2 21.9 22.4 17.2 10.3 3.2 -3.2 8.6
Low ℃ -22.5 -19.6 -14.1 -4.3 2.4 8.8 12.9 13.5 3.2 -5.1 -11.9 -23.1 -23.1
Average
precipitation mm 20.8 25.0 47.2 64.5 105.9 133.2 394.7 364.2 169.3 51.8 52.5 21.5 1,450.5

20
3.2. Building description
The site was located at the rooftop of a five-story Civil and
Environmental Engineering Department building no. 35, Seoul National
University (SNU), Gwanak campus, South Korea. The site was intensely
observed for 22 months, from March 2016 to December 2017, however, the
general research result was focused based on the monitoring result from
January 2017 to December 2017. The total rooftop area is 2,016 m2. However,
four areas were observed: area A, with 84 m2 of normal or concrete surface,
where it has a dense 2,000 kg/m3 of typical roof standard, area B, with 55 m2
of convex green roof, area C, with 140 m2 of concave green roof, and area D,
with 60 m2 of pond (Fig. 9).
Fig. 9 SNU Civil and Environmental Engineering building rooftop
21
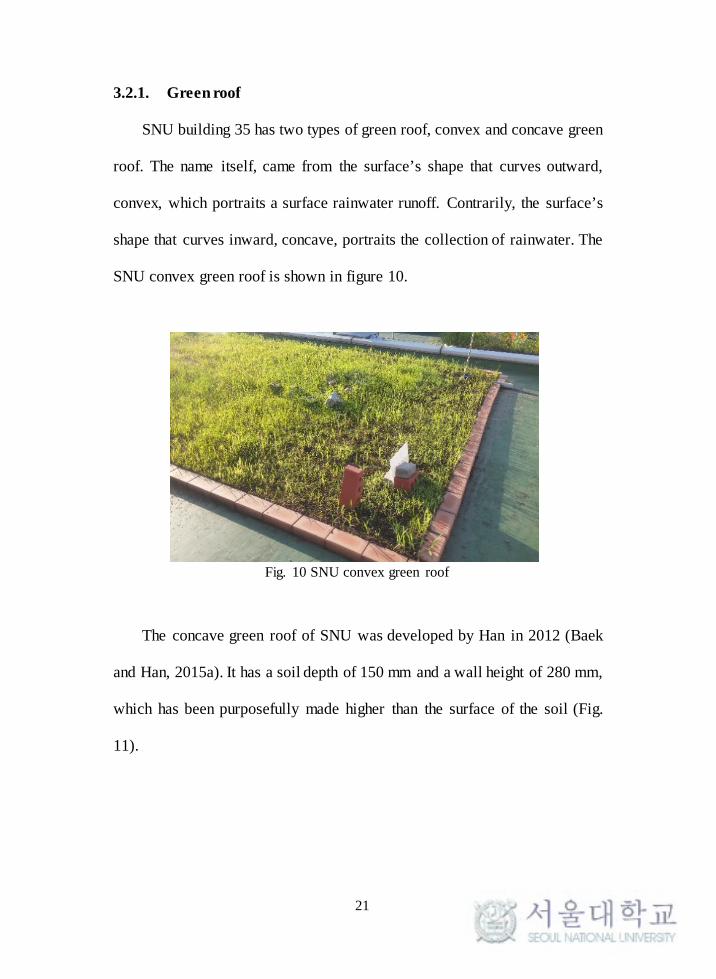
3.2.1. Green roof
SNU building 35 has two types of green roof, convex and concave green
roof. The name itself, came from the surface’s shape that curves outward,
convex, which portraits a surface rainwater runoff. Contrarily, the surface’s
shape that curves inward, concave, portraits the collection of rainwater. The
SNU convex green roof is shown in figure 10.
The concave green roof of SNU was developed by Han in 2012 (Baek
and Han, 2015a). It has a soil depth of 150 mm and a wall height of 280 mm,
which has been purposefully made higher than the surface of the soil (Fig.
11).
Fig. 10 SNU convex green roof

22
The main difference between convex (Fig. 12) and concave green roof
(Fig. 13) is the 65 mm retention board at the bottom of the concave green roof
system.
Fig. 11 SNU concave green roof
Fig. 12 SNU convex green roof (diagram)
Fig. 13 SNU concave green roof (diagram)

23
SNU convex green roofs do not have a retention wall. The soil depth is
50 mm and the maximum depth of drainage board is only 25 mm. The 65 mm
retention board can store up to 38.9 L/m2 of water (Baek and Han, 2015b).
This water storage is expected to enhance evaporation process, reduces
surface temperature in the summer, which lead to maximum performance of
energy saving beyond that of a convex green roof. The retention wall and
board design enhancements of the green roof were first implemented as a
form of rainwater harvesting, which resulted in a self-sustained flower growth
due to the rainwater stored in the retention board, therefore, the plants only
needed to be watered twice per year. Until now, studies have only focused on
the temperature behaviour of convex green roofs prior to the development of
concave green roof. Therefore, design enhancements of the retention wall and
board of the SNU concave green roof are expected to improve the temperature
reduction and stabilization, as well as energy saving to the building. The
construction sections of convex and concave green roofs are shown in figure
14 and 15.
Fig. 14 Convex green roof
construction section
Fig. 15 Concave green roof
construction section

24
3.2.2. Pond
The self-purifying pond system (Fig. 16) was constructed in 2014 after
the success of the ‘National Energy Globe 2014' award-winning concave
green roof system (Han, 2014) for urban runoff reduction, heat mitigation,
and promoting the water-food-energy nexus to the surrounding community
and area.
Fig. 16 Self-purifying rainwater pond on the rooftop of SNU building 35
Several studies have been conducted to investigate several methods to
regulate the water quality of ponds, its ability in storm water management
(Tixier et al., 2011), as well as rainwater harvesting media (Ramesh and
Kaplana, 2015). However, their ability to normalize the urban temperature or
stabilize the roof’s surface temperature is rarely discussed and generally being
mentioned only in review papers with no further research or evident to
support the feasibility of this approach (Rizwan et al., 2008; Kleerekoper et
al., 2012).

25
The pond on SNU building 35 rooftop was divided into three parts:
vegetation, composite media, and functional pump room (Fig. 17). The pumps
circulate constantly, and the composite media contained stones, loam,
ceramic, charcoal, lightweight soil, and mixed manure. This condition
mimicked the nutrient – controlling mechanism of a natural reservoir to
prevent eutrophication. The water level of the pond was maintained at
approximately 180 – 210 mm to ensure that the conditions were suitable for
the goldfishes.
Fig. 17 Self-purifying rainwater pond module division

26
3.3. Monitoring equipment
A DT80 Series 2 data logger (Fig. 18) was placed near the concave green
roof and concrete surface to monitor the air temperature (℃), concrete surface
temperature (℃), and the surface soil temperature (℃), as well as moisture
content of the concave green roof (%).
Similarly, a Series 2000 Watchdog weather station (Fig. 19) was placed
near the self-purifying pond to monitor the water temperature of the pond
(℃), the soil surface temperature (℃), and the soil moisture content (%) of
the convex green roof.
Fig. 18 DT80 Series 2 data logger
Fig. 19 Series 2000 Watchdog weather station
27
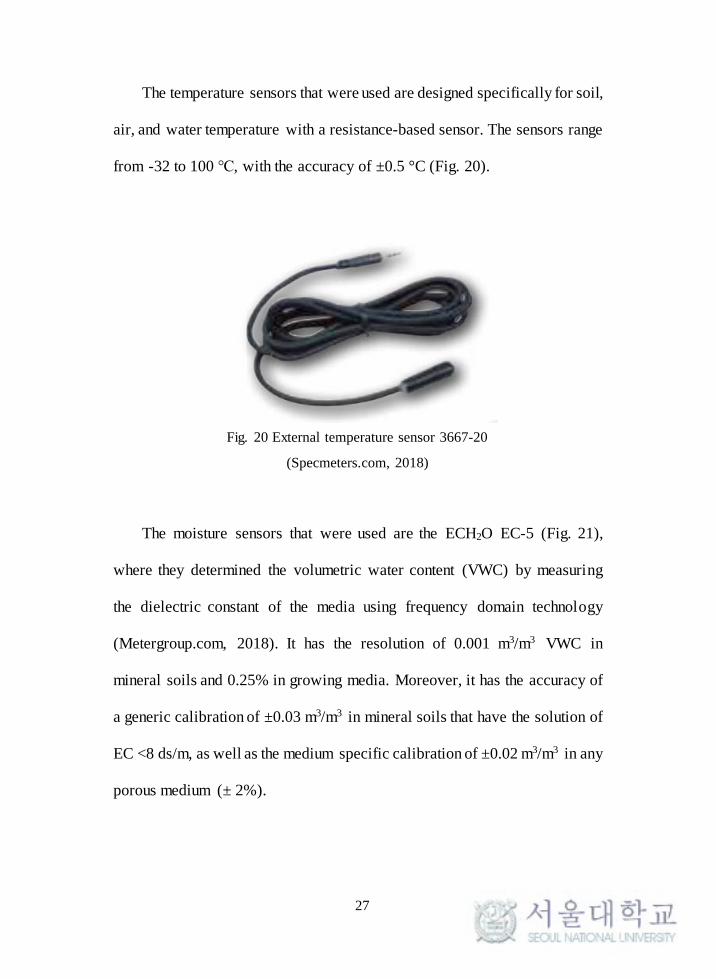
The temperature sensors that were used are designed specifically for soil,
air, and water temperature with a resistance-based sensor. The sensors range
from -32 to 100 ℃, with the accuracy of ±0.5 °C (Fig. 20).
The moisture sensors that were used are the ECH2O EC-5 (Fig. 21),
where they determined the volumetric water content (VWC) by measuring
the dielectric constant of the media using frequency domain technology
(Metergroup.com, 2018). It has the resolution of 0.001 m3/m3 VWC in
mineral soils and 0.25% in growing media. Moreover, it has the accuracy of
a generic calibration of ±0.03 m3/m3 in mineral soils that have the solution of
EC <8 ds/m, as well as the medium specific calibration of ±0.02 m3/m3 in any
porous medium (± 2%).
Fig. 20 External temperature sensor 3667-20
(Specmeters.com, 2018)

28
Meteorological parameters, including solar radiation (W/m2) and air
temperature (℃), were obtained from January 2017 to December 2017 from
the Korea Meteorological Administration (KMA) and the DT80 Series 2 data
logger to confirm the weather conditions in the Gwanak-gu area and
specifically at the rooftop of SNU building no. 35. Furthermore, all data in
the observation were obtained in one-hour interval data.
The monitoring equipment layout is shown in figure 22.
Fig. 21 Moisture sensor ECH2O EC-5 (Metergroup.com, 2018)
Fig. 22 Monitoring layout

29
3.4. Energy estimation analysis
In this research, the energy estimation was based on the energy capacity
of each different rooftop media to reach a standard comfortable indoor
temperature, according to the ASHRAE Handbook of Heating, Ventilating,
and Air-Conditioning Applications (HVAC) 2015 (ASHRAE, 2015).
ASHRAE separated indoor thermal comfort into two seasonal conditions:
summer and winter. In the summer, the recommended conditions are at a
temperature range of 23.3 ℃ to 26.7 ℃ and a relative humidity of 50 to 60%.
In the winter, the typical indoor temperatures and humidities in office
buildings range from 20.3 ℃ to 24.2 ℃ and 20 to 30%, respectively. The
temperatures are lower in the winter as occupants wear thick clothes due to
the harsh outdoor temperatures. These conditions are also suggested for
occupied spaces to reduce the probability of microbial growth. In this study,
the standard comfortable indoor temperatures for summer and winter were 24
℃ and 21 ℃, respectively.
To demonstrate the suitability of all the monitored UGIs in terms of
energy consumption, two energy saving-potential analyses were conducted to
determine the energy required for each rooftop site to maintain a suitable
indoor temperature. The first estimation is denoted as the “degree days”.
Degree days calculation has been widely used in South Korea to predict and
analyse energy consumption according to the difference between reference
temperature, which is the standard comfortable indoor temperature, and the
30
outdoor temperature (Lee et al., 2014). In this study, the roof surface
temperature was used as the outdoor temperature, therefore, the impact of
roof surface temperature in maintaining the indoor space at a comfortable
level can be identified. During the summer, the estimation was to determine
the total roof surface temperature degree (℃) above the standard comfortable
indoor temperature. For cooling purposes, hence “cooling degree days”
(CDD), heat was only considered to be removed from the room if the rooftop
surface temperature was above the standard comfortable indoor temperature.
In the winter, for heating purposes or “heating degree days” (HDD), heat was
only considered to be added to the room when the rooftop surface temperature
was below the standard indoor temperature. This was conducted to further
determine the duration (hours) for cooling and heating. This estimation is
expected to prevent excessive energy consumption for cooling and heating
throughout the year. In this study, the estimated degree days were used as the
first step in calculating the required energy consumption for buildings. The
duration of cooling and heating were calculated with specific heat capacity
(sensible heat) equation (Eqs. 1 and 2).
𝐻𝐻 = 𝑉𝑉 𝑥𝑥 𝐶𝐶𝑝𝑝 𝑥𝑥 𝜌𝜌 𝑥𝑥 𝑇𝑇𝑇𝑇𝑇𝑇𝑇𝑇𝑇𝑇 𝐶𝐶𝐶𝐶𝐶𝐶 𝑇𝑇𝑜𝑜 𝐻𝐻𝐶𝐶𝐶𝐶 𝑥𝑥 0.1162 𝑒𝑒𝑒𝑒. 1
𝑇𝑇 = 𝐻𝐻𝐴𝐴𝐴𝐴𝐶𝐶
𝑒𝑒𝑒𝑒. 2
H: Heat flow (kWh); V: Room volume (m3); CP: Heat air capacity (kcal ℃/kg); ρ: Air density (kg/m3);
Total CDD or HDD (℃); t: time (hours); ACC: Air conditioner capacity (kW)
31
To further confirmed the estimation of duration or “degree hours”, the
sensible heat equation was coupled with a method from Mourshed
(Mourshed, 2012) (Eqs. 3, 4). The sensible heat equation included the
condition of the room itself, therefore by confirming the result of the “degree
days” duration with Mourshed method, we were able to grasp the idea on
where Mourshed based its method condition from.
𝐶𝐶𝐶𝐶𝐶𝐶ℎ = (𝑇𝑇𝑆𝑆−𝑇𝑇𝑅𝑅)+24
𝑒𝑒𝑒𝑒. 3
𝐻𝐻𝐶𝐶𝐶𝐶ℎ = (𝑇𝑇𝑅𝑅−𝑇𝑇𝑆𝑆)+24
𝑒𝑒𝑒𝑒. 4
CDDh: Cooling degree days to hours conversion (℃); HDDh: Heating degree days to hours conversion
(℃); TS: Roof surface temperature (℃); TR: Room temperature (℃); the plus (+) sign indicates that
only positive values are being considered.
The next step in the energy saving potential analysis involved calculating
the energy capacity for maintaining the standard comfortable indoor
temperature from the effect of rooftop surface temperature, based on
ASHRAE (Kavanaugh, 2006). AHSRAE uses a method called the cooling
load temperature difference (CLTD). CLTD is valued as an accurate
estimation of the total heat gain or heat loss through a building lane, which in
this case, the rooftop. It was first introduced in the ASHRAE’s cooling and
heating load manual (ASHRAE, 1980). Additionally, CLTD method also
offered an additional procedure called the CLTD correction (CLTDcorr) (Eq.

32
5), which provided an equation that allow us to correct the observed
temperature so they match more to the area characteristics’ according to the
latitude and longitude. Likewise, CLTDcorr settled its variable on insulation
levels, time of day, direction, and temperature swings (Kavanaugh, 2006).
𝐶𝐶𝐶𝐶𝑇𝑇𝐶𝐶𝑐𝑐𝑐𝑐𝑐𝑐𝑐𝑐 = 𝐶𝐶𝐶𝐶𝑇𝑇𝐶𝐶𝑡𝑡𝑡𝑡𝑡𝑡𝑡𝑡𝑡𝑡 + 78− 𝑇𝑇𝑅𝑅 + 𝑇𝑇𝑆𝑆 − 85 𝑒𝑒𝑒𝑒. 5
CLTDcorr: Cooling load temperature difference (correction) (ºF); CLTDtable: Cooling load temperature
difference (variable based on ASHRAE standard) (ºF); TS: Roof surface temperature (ºF); TR: Room
temperature (ºF); conversion of temperatures from Fahrenheit to Celsius are needed.
For the energy capacity estimation in this research, only the heat
transmission from the rooftop was considered, for the reason that, after a
simulation using a program called the “Carrier” (Carrier, 2018), an hour
analysis program showed a result that the heat gain transmission from the
rooftop accounted for more than half (55%) of all the heat loads in the
building, approximately in one hour, a maximum of 32,494 Wh. The
simulation result of the other main envelopes of the building’s heat gain were
infiltration (outside air), wall, and glass or window (solar loads) with 18,558
Wh, 2,703 Wh, and 5,983 Wh, respectively.
In like manner, here, we assumed that as excessive heat enters the room
through the rooftop in the summer, the energy capacity determines the energy
or heat that should be removed from the indoor room, and hence determines
the cooling capacity. As excessive heat leaves the building during the winter,
33
the energy capacity indicates the energy that should be added to the room,
and hence indicates the heating capacity. Both cooling and heating were
required to maintain the standard comfortable indoor temperature. For this
calculation, heat transfer that affected the indoor temperature from the rooftop
was calculated with the equation below (Eq. 6).
𝑒𝑒 = 𝑘𝑘 𝑥𝑥 𝐴𝐴 𝑥𝑥 𝐶𝐶𝐶𝐶𝑇𝑇𝐶𝐶𝑐𝑐𝑐𝑐𝑐𝑐𝑐𝑐 𝑜𝑜𝑇𝑇𝑇𝑇𝑟𝑟 𝑒𝑒𝑒𝑒. 6
q: Power (W); k: Thermal conductivity coefficient (W/m2 K); A: Area (m2); CLTDCorr roof: Cooling
load temperature difference correction (℃).
The result of power (W) was multiplied by duration or hour (h) in order
to determine the energy capacity (Wh). The thermal conductivity coefficient
was obtained from literature reviews, based on a simulation called the
Transient System Simulation (TRNSYS) program (Niachou et al., 2001;
Castleton et al., 2010). The program matched the condition of the green roof
with several scenarios, including soil depth. The following coefficient is the
best match for the convex and concave green roof (Table 4).
34
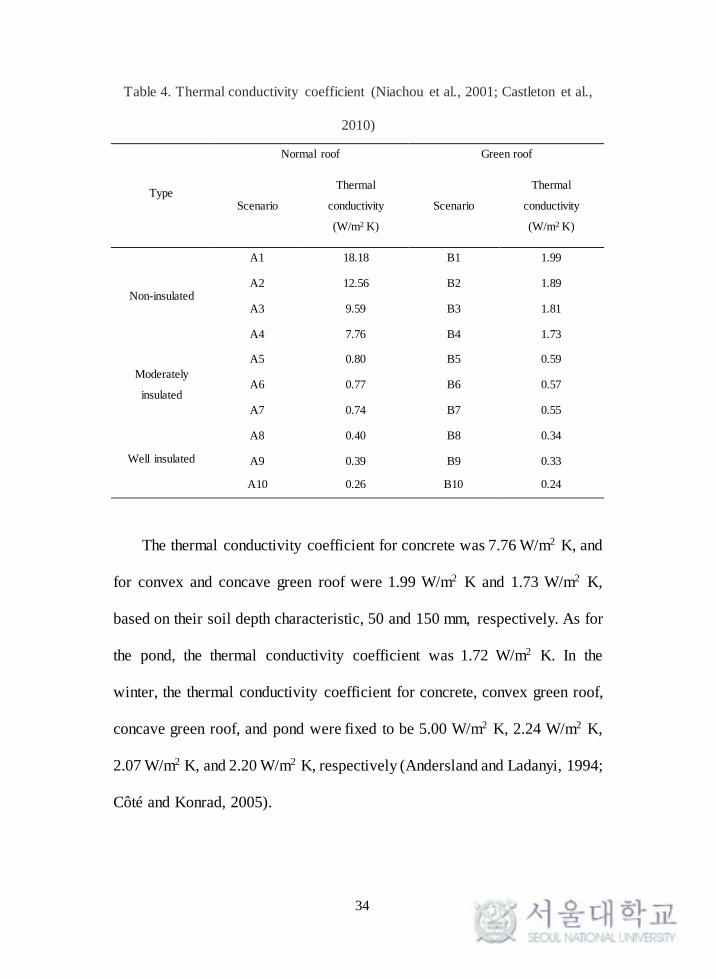
Table 4. Thermal conductivity coefficient (Niachou et al., 2001; Castleton et al.,
2010)
The thermal conductivity coefficient for concrete was 7.76 W/m2 K, and
for convex and concave green roof were 1.99 W/m2 K and 1.73 W/m2 K,
based on their soil depth characteristic, 50 and 150 mm, respectively. As for
the pond, the thermal conductivity coefficient was 1.72 W/m2 K. In the
winter, the thermal conductivity coefficient for concrete, convex green roof,
concave green roof, and pond were fixed to be 5.00 W/m2 K, 2.24 W/m2 K,
2.07 W/m2 K, and 2.20 W/m2 K, respectively (Andersland and Ladanyi, 1994;
Côté and Konrad, 2005).
Type
Normal roof Green roof
Scenario
Thermal
conductivity
(W/m2 K)
Scenario
Thermal
conductivity
(W/m2 K)
Non-insulated
A1 18.18 B1 1.99
A2 12.56 B2 1.89
A3 9.59 B3 1.81
A4 7.76 B4 1.73
Moderately
insulated
A5 0.80 B5 0.59
A6 0.77 B6 0.57
A7 0.74 B7 0.55
Well insulated
A8 0.40 B8 0.34
A9 0.39 B9 0.33
A10 0.26 B10 0.24

35
Furthermore, as the area of each rooftop site differs, the calculation was
conducted with a total rooftop area of 100 m2 (Fig. 23, 24). Concrete was
taken as the reference roof type, and the other three roof sites were compared
based on their capacity to maintain the standard comfortable indoor
temperature.
As for developing the strategies for roof surface temperature stabilization
and energy saving potential, an analysis was made based on the result of
objective 1 and 2. Likewise, the analysis was based on the comparison result
between the energy saving from different rooftop media with the energy
production from solar panel. Solar panel is a well – known media that absorbs
the heat from solar radiation to generate electricity. Similar with the green
roof and pond, where they absorb the heat energy to do evaporation process,
hence giving the cooling effect. Due to their similar characteristic and
mechanism, the comparison was made. This comparison is expected to give
clearer idea on the efficiency of the energy saving from each different type of
Fig. 23 Cooling energy saving
estimation
Fig. 24 Heating energy saving
estimation
36
rooftop media. A technical, economic, and social analysis was conducted to
proof all the aspect benefits of conventionally used media for temperature
stabilization and energy saving.

37
Chapter 4. THERMAL PERFORMANCE AND
ENERGY SAVING ESTIMATION ANALYSIS
4.1. Monitoring result
Temperature monitoring was done for 1 year, in comparison of
concrete/normal roofing, convex green roofing, innovative design of concave
green roofing, and pond from January 2017 to December 2017 (Fig. 25)
The highest temperature reached on the concrete section of the rooftop
of SNU building 35 was 47 ℃ at 14:00 (KST) on August 5, 2017, when the
highest of one-hour solar radiation was 1.99 MJ/m2 (553 Wh/m2), and the total
Fig. 25 One-year surface temperature 2017

38
solar radiation on that day was 16.84 MJ/m2 (4,678 Wh/m2). All UGI sites
had more stable and lower temperatures than the concrete surface. The highest
temperatures of the convex green roof, pond, and concave green roof were
34.4 ℃, 31.4 ℃, and 30.1 ℃, respectively (Fig. 26).
Fig. 26 Highest rooftop surface temperature 2017
During the hottest hour, the temperature difference between the concrete
and concave green roof was 16.8 ℃. The concave green roof could remove
heat by both evaporation and transpiration from the soil surface and
vegetation. Therefore, it held the lowest amount of heat of all rooftop
surfaces. Figure 27 shows that the concave green roof had the greatest
temperature reduction effect, with a maximum difference of 17.5 °C from the
concrete surface, approximately 35.8% of reduction ratio. The pond had a
temperature difference of 17 °C from the concrete surface, while the convex
green roof reduced the temperature of the concrete surface by 12.4 ℃.

39
To further support the temperature reduction result, the difference of soil
moisture content between the two green roofs, convex and concave is
presented in figure 28. The soil moisture was recorded at the surface (1 cm)
and at the bottom (14 cm).
Fig. 27 Temperature reduction 2017
Fig. 28 Soil moisture vs. Rainfall

40
The figure shows the soil moisture in respect with the precipitation event
(Table 5). After several rainfall events, on August 2, the moisture content at
the concave green roof was recorded to be 51.5% at the surface and 54.8% at
the bottom, which was higher than the convex green roof of 39.0% and 44.7%
at the surface and the bottom, respectively.
Table 5. Soil moisture and precipitation event
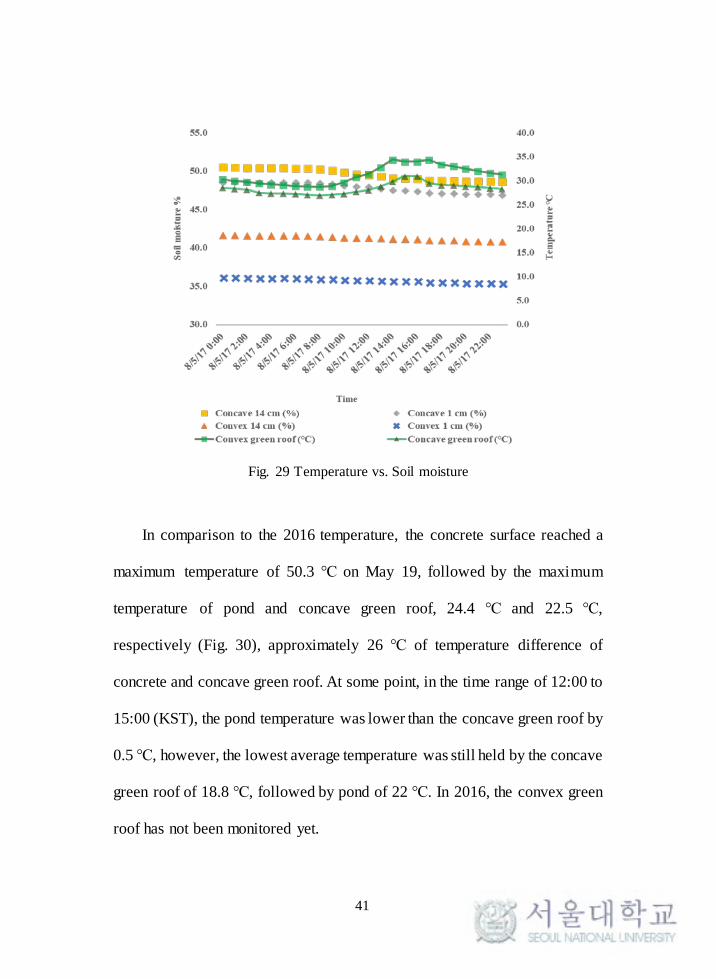
Temperature records on August 5 in respect with the soil moisture is
shown in figure 29. The soil moisture content in the concave green roof was
much higher than in the convex green roof. The average soil moisture content
of the convex green roof was 35.8% and 41.3% at the surface and at the
bottom of the soil, respectively. While, it was recorded to be 47.5% and
49.1% at the surface and at the bottom of the concave green roof, respectively.
The results further proof that the improvement of designs brought more
rainwater stored in the retention board, which led to more surface temperature
reduction.
Date Total rainfall (mm)
Average soil moisture (%)
Convex
(1 cm)
Convex
(14 cm)
Concave
(1 cm)
Concave
(14 cm)
7/23 133.5 39.9 45.1 51.3 54.0
7/24 3 41.0 46.8 53.3 56.7
7/27 0.5 35.9 41.9 48.0 49.9
7/28 11.5 41.1 45.9 52.9 54.8
7/31 3.5 39.1 44.3 51.4 54.0
8/2 2 39.0 44.7 51.5 54.8
41
Fig. 29 Temperature vs. Soil moisture
In comparison to the 2016 temperature, the concrete surface reached a
maximum temperature of 50.3 ℃ on May 19, followed by the maximum
temperature of pond and concave green roof, 24.4 ℃ and 22.5 ℃,
respectively (Fig. 30), approximately 26 ℃ of temperature difference of
concrete and concave green roof. At some point, in the time range of 12:00 to
15:00 (KST), the pond temperature was lower than the concave green roof by
0.5 ℃, however, the lowest average temperature was still held by the concave
green roof of 18.8 ℃, followed by pond of 22 ℃. In 2016, the convex green
roof has not been monitored yet.

42
The lowest rooftop surface temperature during 2017 was recorded on
January 15, when the temperature of the concrete surface reached -11.3 ℃
(Fig. 31), followed by the pond (-10 ℃), convex green roof (-9.7 ℃), and
concave green roof (-7.9 ℃). The maximum one-hour solar radiation on this
day was 1.74 MJ/m2 (483.3 Wh/m2) and the total radiation reached 10.76
MJ/m2 (2,989 Wh/m2). For most of the winter, the water in the pond, as well
as the soil of the convex and concave green roof were frozen, which resulted
in no evaporation process from both of the UGI sites. This research showed
that albedo is important during winter for absorbing and reflecting heat from
solar radiation. The frozen green roof sites had darker surfaces than the
concrete roof surface and pond. Therefore, both green roof sites could absorb
more heat, and exhibited the highest roof surface temperatures. It has been
Fig. 30 Highest rooftop surface temperature 2016
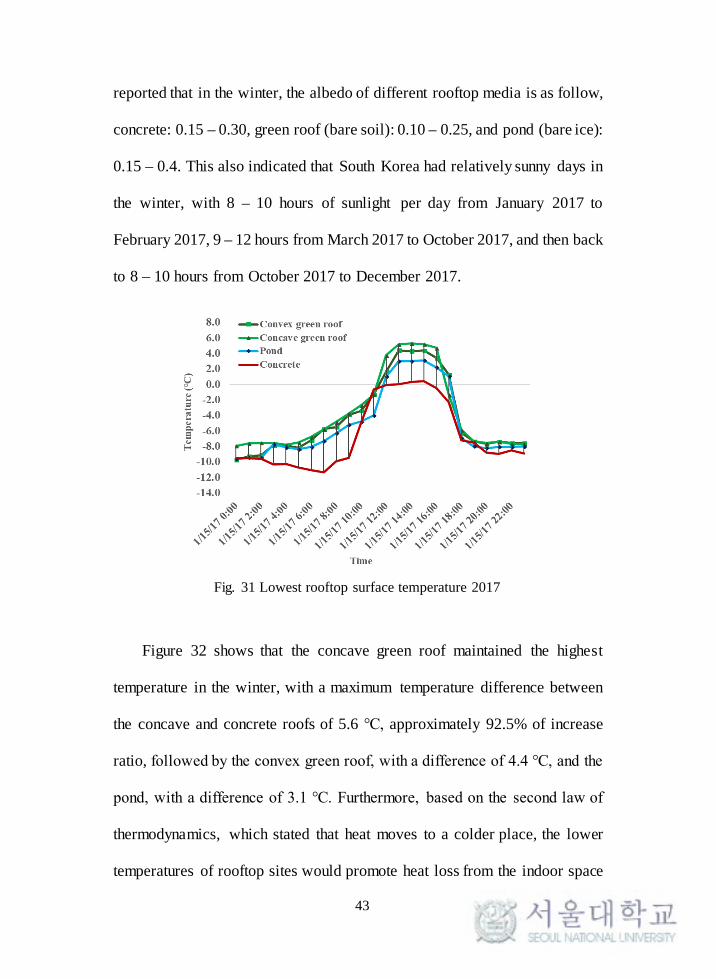
43
reported that in the winter, the albedo of different rooftop media is as follow,
concrete: 0.15 – 0.30, green roof (bare soil): 0.10 – 0.25, and pond (bare ice):
0.15 – 0.4. This also indicated that South Korea had relatively sunny days in
the winter, with 8 – 10 hours of sunlight per day from January 2017 to
February 2017, 9 – 12 hours from March 2017 to October 2017, and then back
to 8 – 10 hours from October 2017 to December 2017.
Figure 32 shows that the concave green roof maintained the highest
temperature in the winter, with a maximum temperature difference between
the concave and concrete roofs of 5.6 ℃, approximately 92.5% of increase
ratio, followed by the convex green roof, with a difference of 4.4 ℃, and the
pond, with a difference of 3.1 ℃. Furthermore, based on the second law of
thermodynamics, which stated that heat moves to a colder place, the lower
temperatures of rooftop sites would promote heat loss from the indoor space
Fig. 31 Lowest rooftop surface temperature 2017

44
to the outside environment. Hence, it would be more difficult for the indoor
space to reach a standard comfortable temperature, thereby increasing energy
consumption for heating. Additionally, the concave green roof had excellent
insulation properties, as it formed an air pocket in the retention board that
added one more barricade layer to prevent heat loss from the building.
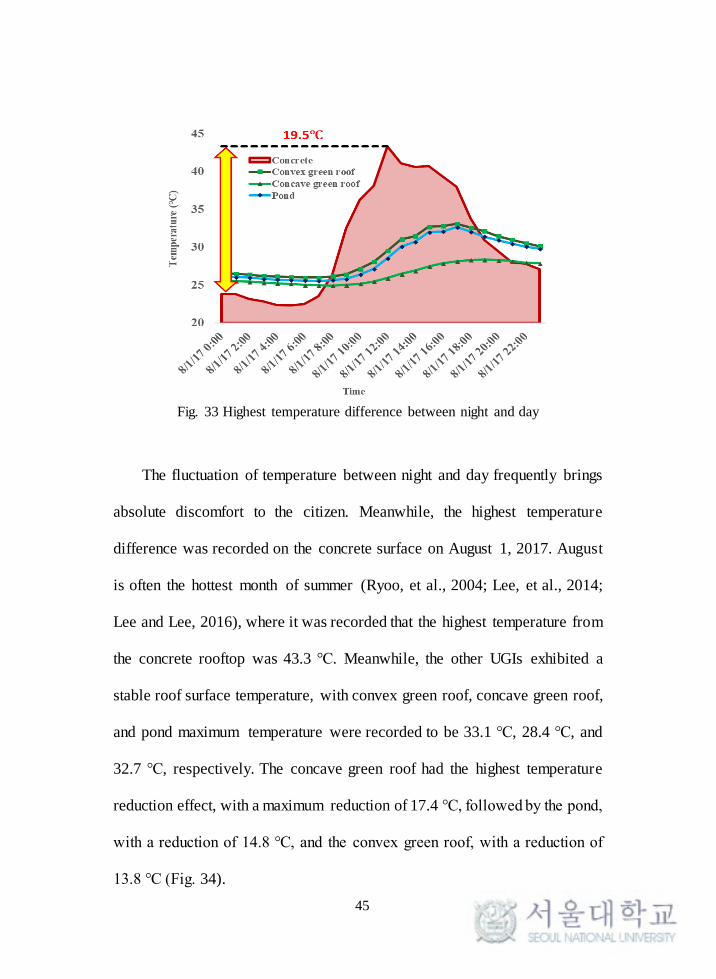
The final significant recorded temperature is the largest temperature
difference between night and day (Fig. 33). From Fig. 33, we can see that
there was a large difference of 19.5 ℃ between the temperatures at night and
day for the concrete roof.
Fig. 32 Temperature increase 2017
45
Fig. 33 Highest temperature difference between night and day
The fluctuation of temperature between night and day frequently brings
absolute discomfort to the citizen. Meanwhile, the highest temperature
difference was recorded on the concrete surface on August 1, 2017. August
is often the hottest month of summer (Ryoo, et al., 2004; Lee, et al., 2014;
Lee and Lee, 2016), where it was recorded that the highest temperature from
the concrete rooftop was 43.3 ℃. Meanwhile, the other UGIs exhibited a
stable roof surface temperature, with convex green roof, concave green roof,
and pond maximum temperature were recorded to be 33.1 ℃, 28.4 ℃, and
32.7 ℃, respectively. The concave green roof had the highest temperature
reduction effect, with a maximum reduction of 17.4 ℃, followed by the pond,
with a reduction of 14.8 ℃, and the convex green roof, with a reduction of
13.8 ℃ (Fig. 34).

46
Fig. 34 Temperature reduction at highest temperature difference

47
4.2. Energy estimation result
4.2.1. Degree days estimation result
The results of the degree days estimation for cooling and heating degree
days are shown in tables 6 and 7, respectively.
Table 6. Cooling degree days
Months Cooling degree days
Concrete Convex green roof Concave green roof Pond
Apr 261.2 35.1 12.1 0
May 1,447.8 1,045.9 758.7 262.6
Jun 2,321.9 2,062.7 1,905.4 1,251.2
Jul 3,019.7 3,810.2 2,431.5 3,317.4
Aug 2,903.3 2,653.4 1,260.2 2,304.2
Sept 1,499.5 443.1 58.9 859.2
Total ℃ to be
removed 11,453.4 10,050.4 6,426.8 7,994.5
Total cooling
hours 459.4 415.7 265.8 330.7
48
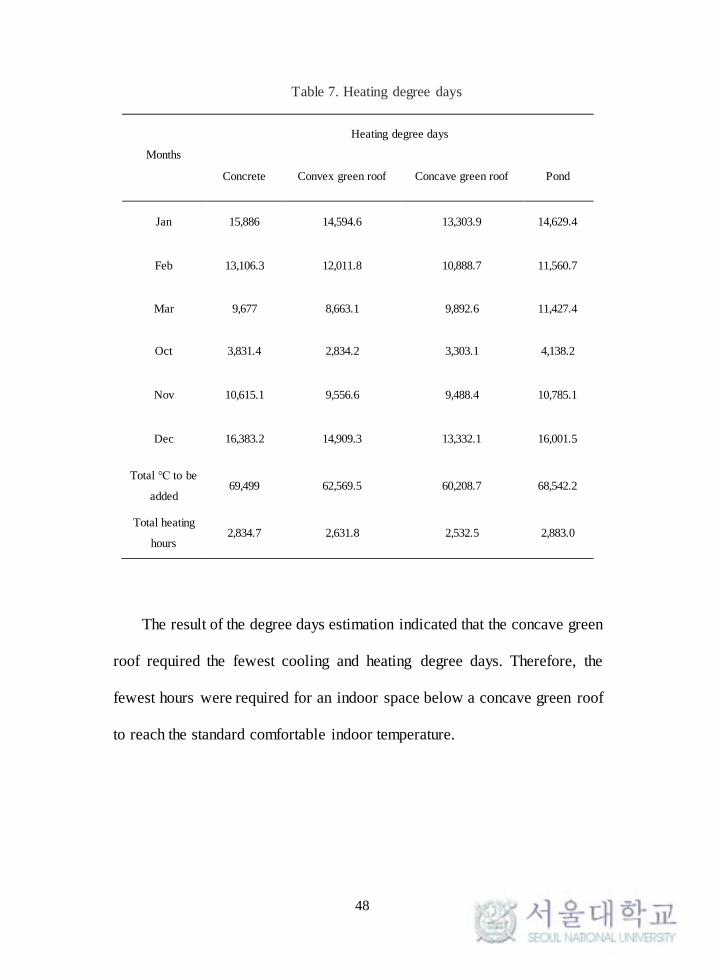
Table 7. Heating degree days
The result of the degree days estimation indicated that the concave green
roof required the fewest cooling and heating degree days. Therefore, the
fewest hours were required for an indoor space below a concave green roof
to reach the standard comfortable indoor temperature.
Months
Heating degree days
Concrete Convex green roof Concave green roof Pond
Jan 15,886 14,594.6 13,303.9 14,629.4
Feb 13,106.3 12,011.8 10,888.7 11,560.7
Mar 9,677 8,663.1 9,892.6 11,427.4
Oct 3,831.4 2,834.2 3,303.1 4,138.2
Nov 10,615.1 9,556.6 9,488.4 10,785.1
Dec 16,383.2 14,909.3 13,332.1 16,001.5
Total ℃ to be
added 69,499 62,569.5 60,208.7 68,542.2
Total heating
hours 2,834.7 2,631.8 2,532.5 2,883.0
49
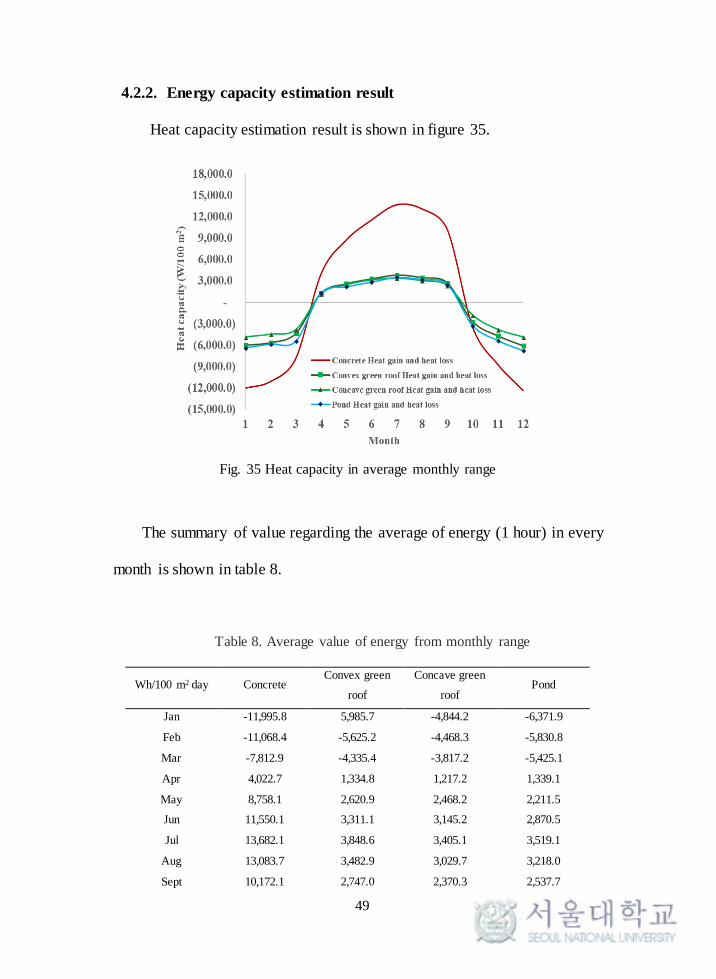
4.2.2. Energy capacity estimation result
Heat capacity estimation result is shown in figure 35.
The summary of value regarding the average of energy (1 hour) in every
month is shown in table 8.
Table 8. Average value of energy from monthly range
Fig. 35 Heat capacity in average monthly range
Wh/100 m2 day Concrete Convex green
roof
Concave green
roof Pond
Jan -11,995.8 5,985.7 -4,844.2 -6,371.9
Feb -11,068.4 -5,625.2 -4,468.3 -5,830.8
Mar -7,812.9 -4,335.4 -3,817.2 -5,425.1
Apr 4,022.7 1,334.8 1,217.2 1,339.1
May 8,758.1 2,620.9 2,468.2 2,211.5
Jun 11,550.1 3,311.1 3,145.2 2,870.5
Jul 13,682.1 3,848.6 3,405.1 3,519.1
Aug 13,083.7 3,482.9 3,029.7 3,218.0
Sept 10,172.1 2,747.0 2,370.3 2,537.7

50
The highest and lowest temperatures of the concrete roof surface from
the results of monitoring were analysed and used to estimate the energy
capacity, thereby predicting the worst-case scenario for one year of heat gain
and loss from the rooftop for the indoor space. As the highest roof surface
temperature was recorded during the summer, in an hour, the indoor space
under the concrete roof had the highest heat gain with a maximum of 33.4
kWh/day (Fig. 36). The indoor space under the concave green roof and pond
gained the lowest amount of heat among all rooftop sites, with heat gains of
4.2 kWh/day and 4.3 kWh/day. Furthermore, the indoor space under the
convex green roof had the highest of maximum total heat gain of 5.9 kWh/day
among all the UGIs. From this result, it is proven that the higher moisture
content in the concave green roof compared to the convex green roof
enhanced more evaporation process, hence greater surface temperature
reduction. Likewise, since the soil depth highly affected the thermal
conductivity coefficient, the heat transmission from the rooftop to the indoor
space below is reduced. Therefore, concave green roof managed to have the
lowest heat gain among all rooftop media. Based on Korea Electric Power
Corporation (KEPCO) data from 2013, with an electricity rate of 160.4
won/kWh ($0.15/kWh), the indoor space below the concrete
Oct -3,470.6 -2,676.1 -1,788.3 -3,241.0
Nov -8,686.6 -4,672.6 -3,790.7 -5,341.4
Dec -12,326.9 -6,073.2 -4,852.7 -6,777.6
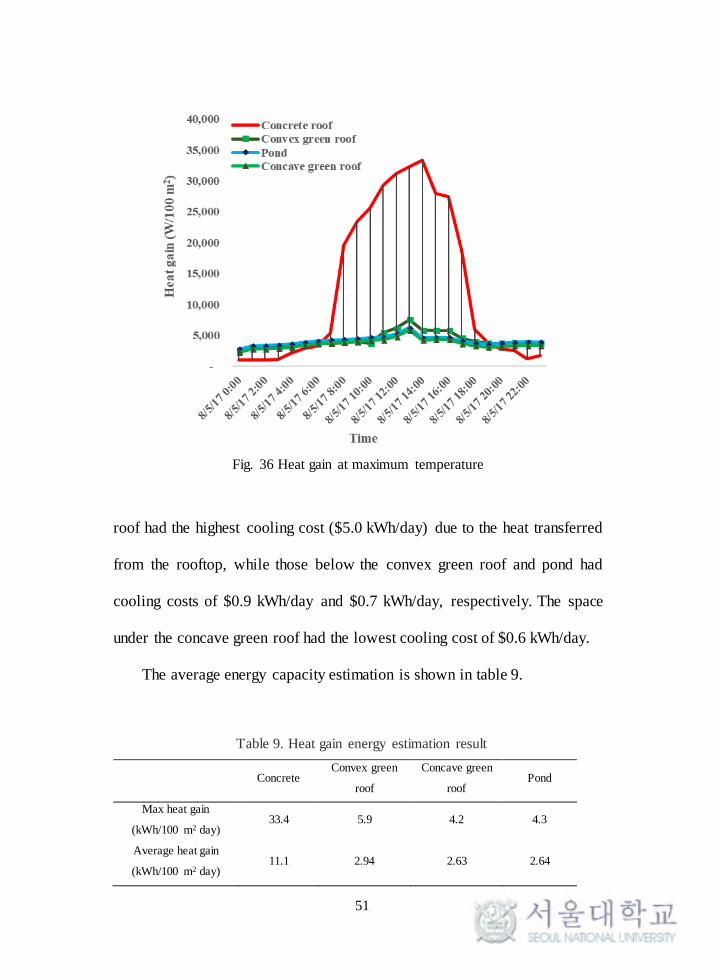
51
roof had the highest cooling cost ($5.0 kWh/day) due to the heat transferred
from the rooftop, while those below the convex green roof and pond had
cooling costs of $0.9 kWh/day and $0.7 kWh/day, respectively. The space
under the concave green roof had the lowest cooling cost of $0.6 kWh/day.
The average energy capacity estimation is shown in table 9.
Table 9. Heat gain energy estimation result
Fig. 36 Heat gain at maximum temperature
Concrete Convex green
roof
Concave green
roof Pond
Max heat gain
(kWh/100 m2 day) 33.4 5.9 4.2 4.3
Average heat gain
(kWh/100 m2 day) 11.1 2.94 2.63 2.64

52
The calculation of the estimated heat loss from the rooftop showed that
in an hour, the indoor space under the concrete surface had the highest heat
loss with maximum of 17.5 kWh/day, while that under the concave green roof
had the lowest heat loss of 6.8 kWh/day (Fig. 37). The indoor space under the
convex green roof experienced heat loss of 7.5 kWh/day and that under the
pond had the highest heat loss (8.4 kWh/day) among all the UGIs. After
applying KEPCO heating rate 2013, which is 131.70 won/kWh ($0.12/kWh),
the installation of concave green roof reduced the heating cost of the indoor
space to $0.8 kWh/day, which is lower than that of the of the indoor space
($2.1 kWh/day) under the concrete roof. The indoor spaces beneath the
convex green roof and pond had heating costs of $0.9 kWh/day and $1
kWh/day, respectively.
Fig. 37 Heat loss at minimum temperature

53
The average energy capacity estimation of heat loss is shown in table 10.
Table 10. Heat loss energy estimation result
Concrete Convex green
roof
Concave green
roof Pond
Max heat loss
(kWh/100 m2 day) 17.5 7.5 6.8 8.4
Average heat loss
(kWh/100 m2 day) 8.9 4.8 3.9 5.5
54
4.3. Strategy for building’s temperature and energy
reduction
At high temperature, the quality and efficiency of solar panel or solar cell
get lower. The theoretical limit for the efficiency of commercial silicon solar
panel is reported to be 29%, which is considered to be feasible in both
laboratory and commercial environment (Blakers et al. 2012). Moreover, a
recent conducted study in 2018 reported that a 30% efficiency of silicon
tandem solar panel has been confirmed, hence a promising candidate for a
high efficiency and low cost solar cells (Yamaguchi et al., 2018).
Since temperature highly affected solar panel’s efficiency, irradiance
value is an important factor to be considered. In this research, considering the
temperature and maximum solar efficiency of 30%, only the irradiance value
within the range of 500 – 1000 W/m2 (2 – 3.41 MJ/m2) was considered.
Hence, in the year 2017, an average of 8.9-hour/day, as well as a total of 92
days, was found to complement the related irradiance value range. Solar panel
working hours was from March 2017 – November 2017, since in January,
February, and December, the solar panel is assumed to be covered with snow.
Furthermore, according to the developer’s guide by the International Finance
Corporation (IFC) relating to the solar photovoltaic (PV) power plants (IFC,
2015), standard electricity generated by a solar PV is 2 acres/MW or 1 m2/
0.124 kW.
The analysis was conducted based on the comparison of a theoretical

55
solar panel and green roof as a representation of a UGI.
4.3.1. Technical analysis
Solar panel and green roof have gained popularity as the two
technologies that offer augmentation as a sustainable building development
and most importantly, energy saving media.
As we mentioned before, solar panel is highly affected by the
temperature or heat that it receives from solar radiation. It was reported that
in high temperature, the solar panel efficiency can be decreased for up to 25%,
as well as a decline of 0.45% for every degree of Celsius (Hui and Chan,
2011). Therefore, at the initial installation, appropriate angle settlement of the
solar panel is more than necessary. Not only for the heat management, but it
could also avoid the radiation reflected from the front glass due to a non-
perpendicular or tilted angle (IFC, 2015).
Another factor to influence the efficiency of the solar panel is soiling,
including dust, snow, as well as bird droppings. Especially in South Korea,
where it receives Asian dust storm (ADS) from the arid area of Gobi Desert
or the Loess plateau, which is reportedly the main cause of high level of
crustal components in atmospheric aerosol in the Korean peninsula (Kang et
al., 2012). This situation can be avoided by a higher tilted angle panels, as it
will have the benefit of natural cleaning from the rainwater.
As for the green roof, conventional design of existing green roof, or as in

56
this research convex green roof, required a large amount of water for the
growth of the living plants. Nevertheless, the implementation of retention
board, as we seen in the innovative design of concave green roof, is expected
to reduce a great amount of water needed, owing to the rainwater stored.
Problems might have occurred when the green roof serves as an urban
farming space, where it needs an additional nutrient to sustain the growth of
vegetables and other corps. This could lead to runoff (leachate) contamination
from the green roof. Though, since green roof generated less runoff, most of
the amount of the runoff itself is less than the normal rooftop (table 11).
Table 11. Comparison of leachate from two types of roof (Seters et al., 2009)
*E. coli unit area loads are expressed as colony forming units (CFU) per m2
Variable Unit area load (mg/m2)*
Normal roof Green roof
Nitrogen; nitrate 450.1 40.8
Nitrogen; nitrite 31.4 7.5
Nitrogen; ammonia + ammonium 245.7 6.1
Phosphorus; phosphate 26.1 207.2
Calcium 5,300.2 9,510.4
Cadmium 0.364 0.175
Iron 38.5 14.3
Manganese 9.09 0.59
Lead 3.45 1.62

57
According to a research conducted by Moon (Moon, 2011), runoff
quality from the green roof can be handled by long sedimentation time and
dissolved air flotation (DAF) coupled with super speed impeller flotation
(SIF) for energy efficiency (Kim, 2010). With the pressure of 3 atm and 10%
of recycle ratio, the colour result of the treatment met the colour quality of
the drinking water standard.
Green roof is reported to weight typically around 100 – 300 kg/m2, more
than the solar panel with 10 – 20 kg/m2. Since green roof weighs more, an
additional construction of structural support is necessary. Yet, green roof was
reported to be able to protect the roofing material from the fluctuation of
meteorological influence (sun, rain, wind), where it doubled the life span of
the rooftop for 45 years and up (Muga et al., 2008).
The technical maintenance for the solar panel is noticeably to be more
complex than the green roof, as it constantly needs expert’s inspection and
numerous input data to maintain the efficiency for the solar panel, such as,
meteorological parameters for irradiance value and light intensity to monitor
the generated electricity, as well as wind for possible cooling to maintain the
panel’s heat and temperature, which can lead to possible re-settling of the
angle of the solar panel for better electricity production.

58
4.3.2. Economic analysis
The installation cost for green and solar panel is shown in table 12.
Table 12. Installation cost comparison of different rooftop media
(Concrete: 20 m3; Geotextile: 5 rolls; Flower: 10 packs; Lightweight soil: 38 packs; Barricade wall: 11.2 m2;
Labour cost for concrete: 3 days 5 people; Labour cost for green roof: 5 days, 5 people)
Concrete Solar panel Green roof
Item Price
($/m2) Item
Price
($/kW) Item
Price
($/m2)
1. Concrete 57 1. PV modules 720 1. Concrete 57
2. Water
proofing
membrane
32 2. Mounting
structure 306
2. Water
proofing
membrane
32
3. Crane 806
3. Power
conditioning
units/inverters
220 3. Retention
board 6
4. Ladder car 179 4. Grid
connection 255
4. Geotextile
(1 roll: 6 m x 5
m)
54
5. Labour cost
(8 hour) 58
5. Preliminary
and operating
expenses
11 5. Flower for
gardening 6
6. Civil and
general work 120
6. Lightweight
soil (1 pack=40
L)
51
7. Developer fee 100 7. Barricade
wall 80
8. O&M cost 7 8. Crane
(one day rental) 806
9. Ladder car
(one day rental) 179
10. Labour cost
(8 hour) 58
Total ($/100 m2) 6,195 Total ($12.4/kW) 21,539 Total ($/100 m2) 10,539
59
The energy saving cost from the solar panel annually was $1,518.1,
considering that it was able to produce 12.4 kW of electricity from a 100 m2
of panel area. Moreover, if we considered that the average heat gain of the
indoor space under the concrete rooftop was 11.1 kWh, with the cooling hours
of 459.4, the cooling consumption would be $764.7 kWh/year. As for the
green roof, considering that the average heat gain was 2.63 kWh and the
cooling hours was 265.8, the cooling consumption would be $105 kWh/year.
Hence, the energy saving cost of having a green roof as a UGI would be
$659.7 kWh/year.
With these records, a payback period analysis was conducted. The
installation cost would be paid back through the electricity consumption
saving annually. Considering that South Korea’s inflation rate is at an average
of 1.6% in 2017, it is expected that the solar panel would have its full profit
back after 14 years. In terms of the green roof, the installation cost would
have to be deducted by the concrete installation cost, therefore the amount
that needed to be paid back, which is the additional value that is required for
a 100 m2 area of green roof construction, is $4,344. This addition of
construction cost is expected to be regained after merely 7 years. Since solar
panel is found to have the most installation cost, the payback period is twice
the longer than the green roof, despite the higher energy saving cost annually.
60
4.3.3. Social analysis
Both of the green roof and solar panel has their own positive influence
for the society. For the solar panel, it acts as media to inform the citizen about
the importance of renewable energy, as well as raising the awareness of
saving energy and to continuously finding solution for clean energy. In the
case of a UGI, the green roof has been able to be a representation of green
area preservation case that has the benefit of reducing building’s energy
consumption. Furthermore, it provides agricultural space in the urban area,
hence reducing the carbon footprint of food transfer mileage. Last but not
least, it offers a recreational space for the local community in the urban area.
61
Chapter 5. CONCLUSION
This study has demonstrated that installing a UGI on the rooftop of a
building would stabilize the roof surface temperature, therefore, an excellent
strategy for building’s energy saving. As concrete roof held the highest
surface temperature in the summer, more heat was transferred to the indoor
spaces below, thereby increasing the total cooling usage. As concrete is thin,
the indoor space beneath this surface experienced the highest heat loss among
the indoor spaces beneath all observed rooftop surfaces, increasing heating
usage in the winter. The concave green roof maintained the most stable and
preferable surface temperatures in the summer and winter. In the summer, it
had the highest temperature reduction effect due to the retention board under
the soil that stored more rainwater, proven by the higher moisture content
than the convex green roof, which improved evaporation from the soil surface
and transpiration from the plants. Likewise, concave green roof has larger soil
depth, which reduced the thermal conductivity coefficient. Similarly, in the
winter, the concave green roof also maintained the most stable and preferable
temperature between the day and night due to the dark bare soil in the winter,
which reduced the albedo, and in return absorbed more heat. In terms of
energy saving potential, the energy capacity and electricity consumption
savings differ based on the temperature of the rooftop. The concave green
roof had the lowest cooling and heating hours throughout the year, of
62
approximately 266 and 2,533 hours, respectively, which greatly reduced the
consumption of cooling and heating energy.
The comparison of solar panel and concave green roof showed that the
concave green roof had better benefits in technical and economic aspects,
where it required less expert’s inspection and easy-to-solve routine checks, as
well as, it had less installation cost, therefore less payback period, regardless
of the lower energy saving cost annually compared to the solar panel. In terms
of the social benefits, both solar panel and the concave green roof had their
own parts to give back and educate the community.
Based on this research, the concave green roof is the most suitable
approach for roof surface temperature stabilization, indoor thermal comfort,
and minimizing the energy consumption of buildings. In the future, urban
developers may implement concave green roof in addition to a normal roof,
since this study demonstrated that concave green roofs are beneficial for long-
term energy saving and assisted in overcoming the limitations of a regular
concrete roof. Furthermore, the installation of a UGI to reduce heat gain in
the summer and prevent heat loss in the winter is a good strategy that should
be considered based on the country or area. For most tropical countries that
do not require insulation to prevent heat loss from buildings, aside from the
concave green roof, the pond is also recommended for roof surface
temperature reduction, as for the initial construction, it is expected to be less
complex and more cost-effective. For countries with four seasons, the
63
concave green roof is the most suitable as it can reduce the heat in the summer
and minimize heat loss in the winter.
Several limitation of this research were, monitoring was only done for
one year. A 5 years temperature monitoring is expected to give more valuable
data which will bring more accurate analysis. The energy saving estimation
calculation was done only based on the heat gain and heat loss from the
rooftop. Even though the rooftop accounted for 55% of all heat gain and heat
loss among all building’s envelope, a calculation including the rest of the
pathways is expected to bring more detailed result.
Based on this research, policy suggestions can be proposed, such as for
the governments to enforce a law on the application of a UGI on the rooftop
of a commercial building and to give incentives to building or community
that apply a UGI. Last but not least, for the government to give transparent
report on energy consumption of commercial buildings as an act of social
awareness.
Further studies should conduct an accurate sensitivity analysis, which
investigates vital factors that affect the temperature stabilization by different
rooftop media. This could be an essential product that would influence any
future enhancement strategy for a building’s rooftop design. Such studies
would complement this research, ultimately facilitating the development of
effective enhancement of the energy saving performance of buildings.
64
References
Alcazar, S.S., Olivieri, F., Neila, J. 2016. Green roofs: Experimental and
analytical study of its potential for urban microclimate regulation in
Mediterranean-continental climates. Urban Climate, 17: 304 –317.
Andersland, O.B., Ladanyi, B. 1994. Introduction to Frozen Ground
Engineering. Chapman & Hall Inc.
ASHRAE. 1980. Cooling and heating load calculation manual. U.S.
Department of Housing and Urban Development: Office of Policy
Development and Research.
ASHRAE. 2015. Heating, Ventilating, and Air-Conditioning Applications: SI
Edition. American Society of Heating, Refrigerating, and Air-
Conditioning Engineers. Inc. Atlanta, Georgia.
Aste, N., Angelotti, A., Buzzetti, M. 2009. The influence of the external walls
thermal inertia on the energy performance of well insulated buildings.
Energy and Buildings, 41(11): 1181 – 1187.
Baek, S., Han., M. 2015a. Water-Energy-Food-Nexus of Concave Green-
Roof in SNU. In proceedings of the 8th Conf. Int. Forum Urban, E014:
880 – 885.
Baek, S., Han, M. 2015b. Water conservation effect of concave green roof
system and its influential factors. Journal of Korean Society of Water
and Wastewater, 29(2): 165 – 169.

65
Berndtsson, J.C. 2010. Green roof performance towards management of
runoff water quantity and quality: A review. Ecological Engineering,
36(4): 351 – 360.
Bianchini, F., Hewage, K. 2012. How “green” are the green roofs? Lifecycle
analysis of green roof materials. Building and Environment, 48(2012):
57 – 65.
Blakers, A., Zin, N., McIntosh, K.R., Fong, K. 2012. High Efficiency Silicon
Solar Cells. PV Asia Conference 2012, 33(2013): 1 – 10.
Bolatturk, A. 2008. Optimum insulation thickness for building walls with
respect to cooling and heating degree hours in the warmest zone of
Turkey. Building and Environment, 43(6): 1055 – 1064.
Carrier, 2018. [Online] Available at:
https://www.carrier.com/commercial/en/us/software/hvac-system-
design/hourly-analysis-program/. [Accessed 16 July 2018].
Castleton, H.F., Stovin, V., Beck, S.B.M., Davidson, J.B. 2010. Green roofs;
building energy savings and the potential for retrofit. Energy and
Buildings, 42(10): 1582 – 1591.
Côté J., Konrad, J.M. 2005. A generalized thermal conductivity model for
soils and construction materials. Canadian Geotechnical Journal,
42(2): 443 – 458.
Daouas, N. 2011. A study on optimum insulation thickness in walls and
energy savings in Tunisian buildings based on analytical calculation

66
of cooling and heating transmission loads. Applied Energy, 88(1): 156
– 164.
Del Barrio, E. P. 1998. Analysis of the green roofs cooling potential in
buildings. Energy and Buildings, 27(2): 179 – 193.
De Rosa, M., Bianco, V., Scarpa, F., Tagliafico, L.A. 2014. Heating and
cooling building energy demand evaluation; a simplified model and a
modified degree days approach. Applied Energy, 128(2014): 217 –
229.
Ding, Y. 1994. Monsoons over China. Kluwer Academic Publishers:
Netherlands.
Frankenstein, S., Koenig, G.G. 2004. Fast All – season Soil Strength
(FASST). US Army Corps of Engineers, Engineer Research and
Development Center: Cold Regions Research and Engineering
Laboratory.
Gaffin, S., Parshall, L., O’Keeffe, G., Braman, D., Beattie, D., Berghage, R.
2006. Energy balance modelling applied to a comparison of white and
green roof cooling efficiency. Green Roofs in the New York
Metropolitan Region: Research Report. Columbia University Center
for Climate Systems Research and NASA Goddard Institute for Space
Studies, pp: 7 – 14.
Han, M., 2014. Concave green roofs as water-food-energy nexus. [Online]
Available at:

67
http://www.energyglobe.info/awards/details/awdid/100636./
[Accessed 12 March 2018].
He, B.J. 2018. Potentials of meteorological characteristics and synoptic
conditions to mitigate urban heat island effects. Urban Climate, 24:
26 – 33.
Hui, S.C.M., Chan, S.C. 2011. Integration of green roof and solar
photovoltaic system. In proceedings of Joint Symposium 2011:
Integrated Building Design in the New Era of Sustainability, pp: 1.1 -
1.10.
International Finance Corporation (IFC). 2015. Utility-scale solar
photovoltaic power plants: A project developer’s guide. IFC: World
bank group.
Jaffal, I., Ouldboukhitine, S., Belarbi, R. 2012. A comprehensive study of the
impact of green roofs on building energy performance. Renewable
Energy, 43(2012): 157 – 164.
Jim, C.Y., Tsang, S.W. 2011. Biophysical properties and thermal
performance of an intensive green roof. Building and Environment,
46(6): 1263 – 1274.
Jo, J.H., Golden, J.S., Shin, S.W. 2009. Incorporating built environment
factors into climate change mitigation strategies for Seoul, South
Korea: A sustainable urban system framework. Habitat International,
33(3): 267 – 275.

68
Jung, H., Choi Y., Oh, J., Lim, G. 2002. Recent trends in temperature and
precipitation over South Korea. International Journal of Climatology,
22: 1327 – 1337.
Kang, C., Kang, B., Lee, H. 2012. Source Identification and Trends in
Concentrations of Gaseous and Fine Particulate Principal Species in
Seoul, South Korea. Journal of Air & Waste Management
Association, 56, 2006(7): 911 – 921.
Kavanaugh, S.P. 2006. HVAC Simplified. American Society of Heating,
Refrigerating, and Air-Conditioning Engineers, Inc.
Kim, T. 2010. Analysis of bubble potential energy and its application to
disinfection and oil washing. Doctorate, Seoul National University.
Kleerekoper, L., Escha, M., Salcedo, T.B. 2012. How to make a city climate-
proof, addressing the urban heat island effect. Resources,
Conservation, and Recycling, 64: 30 – 38.
Kohler, M., Tannier, C., Blond, N., Aguejdad, R., Clappier, A. 2017. Impacts
of several urban-sprawl countermeasures on building (space heating)
energy demands and urban heat island intensities. A case study. Urban
Climate, 19: 92 – 121.
Kolokotsa, D., Santamouris, M., Zerefos, S.C. 2013. Green and cool roofs’
urban heat island mitigation potential in European climates for office
buildings under free floating conditions. Solar Energy, 95(2013): 118
– 130.

69
Konopacki, S., Akbari, H. 2002. Energy savings of heat-island reduction
strategies in Chicago and Houston (Including updates for Baton
Rouge, Sacramento, and Salt Lake City). Environmental Energy
Technologies Division, Lawrence Berkeley National Laboratory.
University of California.
Kossecka, E., Kosny, J. 2002. Influence of insulation configuration on heating
and cooling loads in a continuously used buildings. Energy and
buildings, 34(4): 321 – 331.
Kumar, R., Kaushik, S.C. 2005. Performance evaluation of green roof and
shading for thermal protection of buildings. Building and
Environment, 40(11): 1505 – 1511.
Lee, K.M., Baek, H.J., Cho, C.H. 2014. The estimation of base temperature
for heating and cooling degree days for South Korea. Journal of
Applied Meteorology and Climatology, 53: 300 – 309.
Lee, W.S., Lee, M.I. 2016. Interannual variability of heat waves in South
Korea and their connection with large-scale atmospheric circulation
patterns. International Journal of Climatology, 36: 4815 – 4830.
Li, D., Bou-Zeid, E., Oppenheimer, M. 2014. The effectiveness of cool and
green roofs as urban heat island mitigation strategies. Environmental
Research Letters, 9(5).
Li, X.X., Norford, L.K. 2016. Evaluation of cool roof and vegetations in
mitigating urban heat island in a tropical city, Singapore. Urban
70
Climate, 16: 59 – 74.
Metaxa, E., Deviller, G., Pagand, P., Alliaume, C., Casellas, C., Blancheton,
J.P. 2005. High rate algal pond treatment for water reuse in a marine
fish recirculation system: Water purification and fish health.
Aquaculture, 252(1): 92 – 101.
Metergroup. 2018. Meter Environment. [Online] Available at:
https://www.metergroup.com/environment/products/ec-5-soil-
moisture-sensor/. [Accessed 6 June 2018].
Mirzaei, P.A., Haghighat, F. 2010. Approaches to study Urban Heat Island –
Abilities and limitations. Building and Environment, 45(10): 2192 –
2201.
Moon, H. 2011. Quantitative and qualitative analysis of green roof –
rainwater utilization system. Master, Seoul National University.
Moral-Carcedo, J., and Vicens-Otero, J. 2005. Modelling the non-linear
response of Spanish electricity demand to temperature variations.
Energy Economics, 27(3): 477 – 494.
Mourshed, M. 2012. Relationship between annual mean temperature and
degree-days. Energy and Buildings, 54(2012): 418 – 425.
Muga, H., Mukherjee, A., Mihelcic, J. 2008. An integrated assessment of the
sustainability of green and built-up roofs. Journal of Green Building,
2(2008): 106 – 127.
Newgeography. 2018. [Online] Available at:
71
http://www.newgeography.com/content/002060-the-evolving-urban-
form-seoul. [Accessed 11 July 2018].
Niachou, A., Papakonstantinou, K., Santamouris, M., Tsangrassoulis, A.,
Mihalakakou, G. 2001. Analysis of the green roof thermal properties
and investigation of its energy performance. Energy and Buildings,
33(7): 719 – 729.
Oberndorfer, E., Lundholm, J., Bass, B., Coffman, R.R., Doshi, H., Dunnett,
N., Gaffin, S., Kohler, M., Liu, K., Rowe, B. 2007. Green roofs as
urban ecosystem: Ecological structures, functions, and services. Bio
Science, Oxford Journals, 57(1): 823 – 833.
Parizotto, S., Lamberts, R. 2011. Investigation of green roof thermal
performance in temperature climate: A case study of an experimental
building in Florianopolis city, Southern Brazil. Energy and Buildings,
43(2011): 1712 – 1722.
Ramesh, S., Kaplana, K. 2015. Ecological integrity and environmental
protection for Vijayawada region-Scattered Eastern Ghats,
International Journal of Sustainable Built Environment, 4(1): 109 –
116.
Rizwan, A.M., Dennis, Y.C.L., Liu, C. 2008. A review on the generation,
determination and mitigation of Urban Heat Island. Journal of
Environmental Sciences, 20(1): 120 – 128.
Robitu, M., Musy, M., Inard, C., Groleau, D. 2005. Modeling the influence

72
of vegetation and water pond on urban microclimate. Solar Energy,
80(2006): 435 – 447.
Ryoo, S.B., Kwon, W.T., Jhun, J.G. 2004. Characteristic of wintertime daily
and extreme minimum temperature over South Korea. International
Journal of Climatology, 24: 145 – 160.
Saaroni H., Amorim, J.H., Hiemstra, J.A., Pearlmutter, D. 2018. Urban green
infrastructure as a tool for urban heat mitigation: Survey of research
methodologies and findings across different climatic regions. Urban
Climate, 24: 94 – 110.
Sailor, D.J. 2008. A green roof model for building energy simulation
programs. Energy and Buildings, 40(8): 1466 – 1478.
Sailor, D.J., Elley, T.B., Gibson, M. 2012. Exploring the building energy
impacts of green roof design decisions – a modeling study of buildings
in four distinct climates. Journal of Building Physics, 35(4): 372 –
391.
Santamouris, M., Pavlou, C., Doukas, P., Mihalakakou, G., Synnefa, A.,
Hatzibiros, A., Patargias, P. 2007. Investigating and analyzing the
energy and environmental performance of an experimental green roof
system installed in a nursery school building in Athens, Greece.
Energy, 32(9): 1781 – 1788.
Santamouris, M. 2014. Cooling the cities – A review of reflective and green
roof mitigation technologies to fight heat island and improve comfort

73
in urban environments. Solar Energy, 103: 682 – 703.
Seters, T.V., Rocha, L., Smith, D., MacMillan, G. 2009. Evaluation of green
roofs for runoff retention, runoff quality, and leachability. Water
Quality Research Journal, 44(1): 33 – 47.
Shi, Y., Zhang, Y. 2018. Remote sensing retrieval of urban land surface
temperature in hot-humid region. Urban Climate, 24: 299 – 310.
Specmeters. 2018. [Online] Available at: https://www.specmeters.com/.
[Accessed 10 July 2018].
Takebayashi, H., Moriyama M. 2007. Surface heat budget on green roof and
high reflection roof for mitigation of urban heat island. Building and
Environment, 42(8): 2971 – 2979.
Tixier, G., Lafont, M., Grapentinea, L., Rochfort, Q., Marsaleka, J., 2011.
Ecological risk assessment of urban stormwater ponds: Literature
review and proposal of a new conceptual approach providing
ecological quality goals and the associated bioassessment tools.
Ecological Indicators, 11(6): 1497 – 1506.
United Nations. 2014. World Urbanization Prospects: The 2014 Revision.
Department of Economic and Social Affairs, Population Division,
United Nations.
United Nations Habitat. 2018. Climate Change. [Online] Available at:
https://unhabitat.org/urban-themes/climate-change/. [Accessed 15
July 2018].
74
Wanphen, S., Nagano, K. 2009. Experimental study of the performance of
porous materials to moderate the roof surface temperature by its
evaporative cooling effect. Building and Environment, 44(2): 338 –
351.
Wong, N.H., Chen, Y., Ong, C.L., Sia, A. 2003. Investigation of thermal
benefits of rooftop garden in the tropical environment. Building and
Environment, 38(2): 261 – 270.
Yamaguchi, M., Lee, K.H., Araki, K., Kojima, N. 2018. A review of recent
progress in heterogeneous silicon tandem solar cells. Journal of
Physics D: Applied Physics, 51(2018): 1 – 13.
Yang, J., Sun, J., Ge, Q., Li, X. 2017. Assessing the impacts of urbanization-
associated green space on urban land surface temperature: A case
study of Dalian, China. Urban Forestry & Urban Greening. 22(2017):
1 – 10.
Zhao, Z.Q., He, B.J., Li, L.G., Wang, H.B., Darko, A. 2017. Profile and
concentric zonal analysis of relationships between land use/land cover
and land surface temperature: Case study of Shenyang, China. Energy
and Buildings, 155: 282 – 295.
Zinzi, M., Agnoli, S. 2012. Cool and green roofs. An energy and comfort
comparison between passive cooling and mitigation urban heat island
techniques for residential buildings in the Mediterranean region.
Energy and Buildings, 55: 66 – 76.

75
Appendix (Supplement data)
Fig S1. One-year temperature Concrete vs. Convex green roof
Fig S2. One-year temperature Concrete vs. Concave green roof
Fig S3. One-year temperature Concrete vs. Pond

76
Summer - A credibility analysis was conducted with all the total sensors of the
monitored site. A total of 2 sensors for concrete and convex green roof and a total of
3 sensors for concave green roof and pond. The standard deviation of concrete varied
from 0.13 – 0.78; convex green roof with 0.06 – 0.15; concave green roof with 0.02
– 0.12; pond with 0.02 – 0.12.
Fig S4. Summer concrete credibility
analysis
Fig S5. Summer convex green roof
credibility analysis
Fig S6. Summer concave green roof
credibility analysis
Fig S7. Summer pond credibility analysis

77
Winter - A credibility analysis was conducted with all the total sensors of the
monitored site. A total of 2 sensors for concrete and convex green roof and a total of
3 sensors for concave green roof and pond. The standard deviation of concrete varied
from 0.22 – 0.68; convex green roof with 0.11 – 0.65; concave green roof with 0.10
– 0.74; pond with 0.14 – 0.71.
Fig S8. Winter concrete credibility
analysis
Fig S9. Winter convex green roof
credibility analysis
Fig S10. Winter concave green roof
credibility analysis
Fig S11. Winter pond credibility analysis

78
Table S1. Cooling degree hours estimation by Mourshed
Table S2. Heating degree hours estimation by Mourshed
The sensible heat equation conditions are: heat air capacity=0.241 kcal kg-1℃-
1, air density @21℃=1.204 kg m-3; @24=1.184 kg m-3; AC capacity: 3.2 – 3.5 kW.
Both method had similar result, hence it can be identified that the calculation by
Mourshed is based on the similar condition as the specific heat (sensible heat)
equation condition.
Months Cooling degree hours (TS 24 ℃)
Concrete Convex green roof Concave green roof Pond
Apr 10.9 1.5 0.5 0
May 60.3 43.6 31.6 10.9
June 96.8 86 79.4 52.1
July 125.8 158.8 101.3 138.2
Aug 121 110.6 52.5 96.0
Sept 62.5 18.5 2.5 35.8
Total cooling hours
(Mourshed) 478 419 268 333.1
Total cooling hours
(specific heat /
sensible heat)
460 416 266 331
Months
Heating degree hours (TS 21 ℃)
Concrete Convex green
roof
Concave green
roof Pond
Jan 662.1 608.1 554.3 609.6
Feb 546.1 500.5 453.7 481.7
Mar 403.2 361 412.2 476.1
Oct 159.6 118.1 137.6 172.4
Nov 442.3 398.2 395.3 449.4
Dec 682.6 621.2 555.5 666.7
Total heating hours
(Mourshed) 2,896 2,608 2,508.7 2,856
Total heating hours
(specific heat /
sensible)
2,835 2,632 2,533 2,884

79
Table S3. CLTD variables; 36 Degrees North Latitude (ASHRAE, 1980)
*South Korea: 35. 9078°N (latitude), 127.7669°E (longitude)
Roof
no. Description
Weight Solar time, hr
1 2 3 4 5 6 7 8 9 10 11 12 13 14 15 16 17 18 19 20 21 22 23 24
Without suspended ceiling
1 Steel sheet with 1-in
(or 2-in.) insulation 7 0 2 4 5 6 6 0 12 28 45 61 75 84 90 90 84 74 60 42 26 15 9 5 2
2 1-in. wood with 1-in
insulation 8 2 0 -2 -4 -5 -6 -4 4 16 32 48 63 76 84 88 87 81 70 55 39 25 15 9 5
3 4-in. l.w. concrete 18 12 8 5 2 0 -2 -1 4 13 24 35 47 58 67 73 75 74 68 59 48 38 30 23 17
4
2-in. h.w concrete with
1-in. (or 2-in.)
insulation
29 17 11 7 3 1 -1 -3 -3 0 7 17 29 42 55 66 74 78 79 75 67 56 45 34 24
5 1-in. wood with 2-in.
insulation 19 21 16 12 8 5 3 1 2 5 12 21 31 42 52 61 67 70 70 66 59 51 42 34 27
8 8-in. l.w. concrete 31 29 25 21 17 14 12 10 9 11 15 21 28 35 42 49 54 57 58 56 53 48 43 38 33
9
4-in. h.w. concrete
with 1-in. (or 2-in.)
insulation
52 32 26 21 16 13 9 6 4 4 7 12 19 27 37 46 54 60 64 65 63 59 52 45 38
10 2.5-in. wood with 2-in.
insulation 13 37 32 27 23 19 15 12 10 9 9 12 17 23 30 38 45 51 56 58 58 56 52 47 42
13 4-in. wood with 1-in.
(or 2-in.) insulation 17 34 31 28 25 23 20 18 16 16 17 20 24 28 33 38 43 47 49 50 49 47 44 41 37
80
국문 초록
도심형 옥상녹화에 의한 온도 저감과 에너지 절약
포텐셜에 관한 고찰: 서울대학교 건설환경공학부
옥상녹화 사례 연구
테레시아 기타 합사리 와르소쿠수모
건설환경공학부
서울대학교
옥상녹화와 같은 도시 녹화 시설 (UGI)은 건물의 에너지 소비
절약과 지붕 표면 온도 감소를 통한 도심의 열섬 현상 저감
효과를 위해 광범위하게 시행되어 온 혁신적인 토지 개발 접근
방법 중 하나이다. 본 연구는 온도 역학과 에너지 절약 가능성을
평가하기 위해 서울대학교 건설환경공학부 건물에서 일반
콘크리트, 제래식/일반 옥상녹화, 새로 개발한 오목형 옥상녹화,
그리고 연못을 포함한 4개의 옥상 유형을 2017년 1월부터
2017년 12월까지 1년간 모니터링한 결과를 토대로 진행한 조사의
결과물이다. 오목형 옥상녹화의 혁신적인 디자인은 2012년
개발되었다. 320 mm 두께의 옹벽이 토양 재배 식물을 둘러싸고
있는 구조이며 토양 하단에는 65 mm의 저류판을 설치하였다.
대부분의 일반 옥상녹화는 옹벽이 없으며 저류판의 두께는
일반적으로 최대 25 mm이다. 많은 양의 빗물을 저류할 수 있는
연못 또한 실용 가능성이 높은 UGI중 하나이지만, 지붕 표면

81
온도를 유지하는 방법으로는 자주 간과 되어지고 있다.
연구 결과 한 여름철의 오목형 옥상녹화에서 측정한 온도는
콘크리트 표면에 비해 17.5 ℃ 정도 현저히 낮은 값을 보였고
연못이 17 ℃ 차이로 그 뒤를 이었다. 겨울철 오목형
옥상녹화에서 측정한 온도는 콘크리트 표면보다 높은 온도로
보였으며 최대 온도 차이는 5.6 ℃였다. 각 온도 결과에 따르면
오목형 옥상녹화 아래의 실내 공간은 각각 2.63 kWh/일 및 3.9
kWh/일로 열 손실과 증가율이 가장 적었던 것에 반해 콘트리트
지붕은 각각 11.1 kWh/일 및 8.9 kWh/일로 가장 높은 값을
보여주었다. 또한, 적정 실내 온도에 도달하기 위해 소요된 오목형
옥상녹화가 설치된 곳의 냉방 및 난방 시간은 각각 약
266시간에서 2,533시간으로 가장 낮았으며 이는 냉각 및 가열
에너지 소비량이 크게 줄어드는 것을 입증하는 수치이다.
마찬가지로, 오목형 옥상녹화는 에너지 절약을 위한 일반적인
해결책인 태양 전지판에 비해 기술적, 경제적, 사회적 방면 등
많은 방면에서 뛰어났다. 아울러 해당 구조는 기술자의 세부 검사
또는 간단한 일상 점검이 덜 필요할 뿐만 아니라 설치 비용도
적게 들기 때문에 기존 구조에 비해 에너지 절약률이 낮더라도
투자 회수 기간이 더욱 짧다는 점 역시 장점으로 사료된다.
여름철의 열 증가를 줄이고 겨울의 열 손실을 방지하기 위해
UGI 장비 및 장치를 설치하는 것은 국가나 지역 차원에서
고려할만 한 좋은 전략이다. 건물의 열 손실을 방지하기 위한
단열 장치 설치가 필요하지 않은 대부분의 열대 국가의 경우,
오목형 옥상녹화 외에 연못의 설치 역시 지붕 표면 온도 감소를
위해 권장 할만하다. 본 구조는 초기 건물 건설시 덜 복잡하고
비용면에서 더 효율적이다. 사계절을 지닌 국가들의 경우, 여름에
82
열을 줄이고 겨울에 열 손실을 최소화할 수 있기 때문에 오목형
옥상녹화가 가장 적합하다.
이 연구에 따르면, 오목형 옥상녹화는 일반적인 옥상 표면이나
가장 주요한 UGI이자 건물 옥상의 온도 변동을 안정시키는데
사용되는 일반 옥상녹화의 한계를 극복하기에 가장 적합한 것으로
확인되었다. 실내 공간의 쾌적함을 유지하기 위해 지붕 표면
온도를 유지하는 것이 필수적인 것으로 입증되었으며 각 건물의
장기적인 에너지 절약 성능의 개선으로 이어질 수 있음이
확인되었다.
키워드 : 에너지; 옥상녹화; 연못; 온도 저감; 도시 녹화 시설; 도시
열섬 현상 저감
학번 : 2016 - 22102