on production during preliminary tests on the...
TRANSCRIPT

Report on heat production during preliminary tests on the
Rossi “NiH” reactor.
Dr. Giuseppe Levi
In this first and preliminary document are reported the heat production measures done during two short tests done on December 16 2010 [Test 1] and January 14 2011 [Test 2].
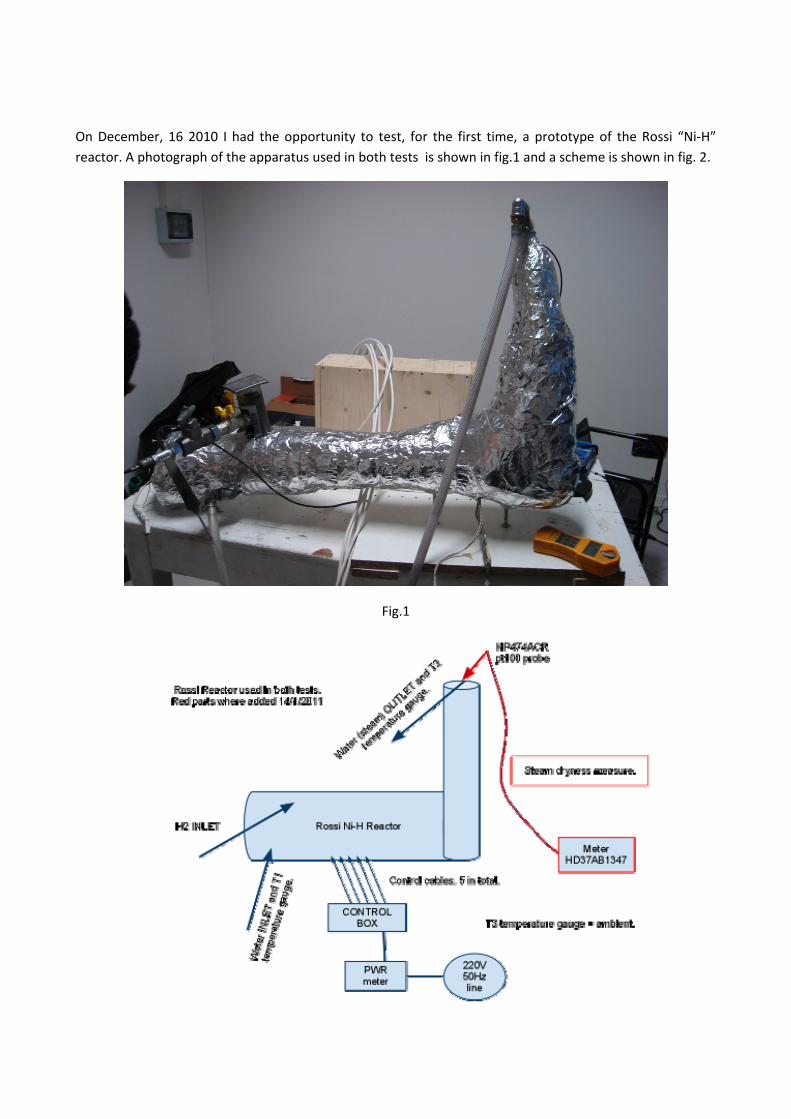
On December, 16 2010 I had the opportunity to test, for the first time, a prototype of the Rossi “Ni‐H” reactor. A photograph of the apparatus used in both tests is shown in fig.1 and a scheme is shown in fig. 2.
Fig.1
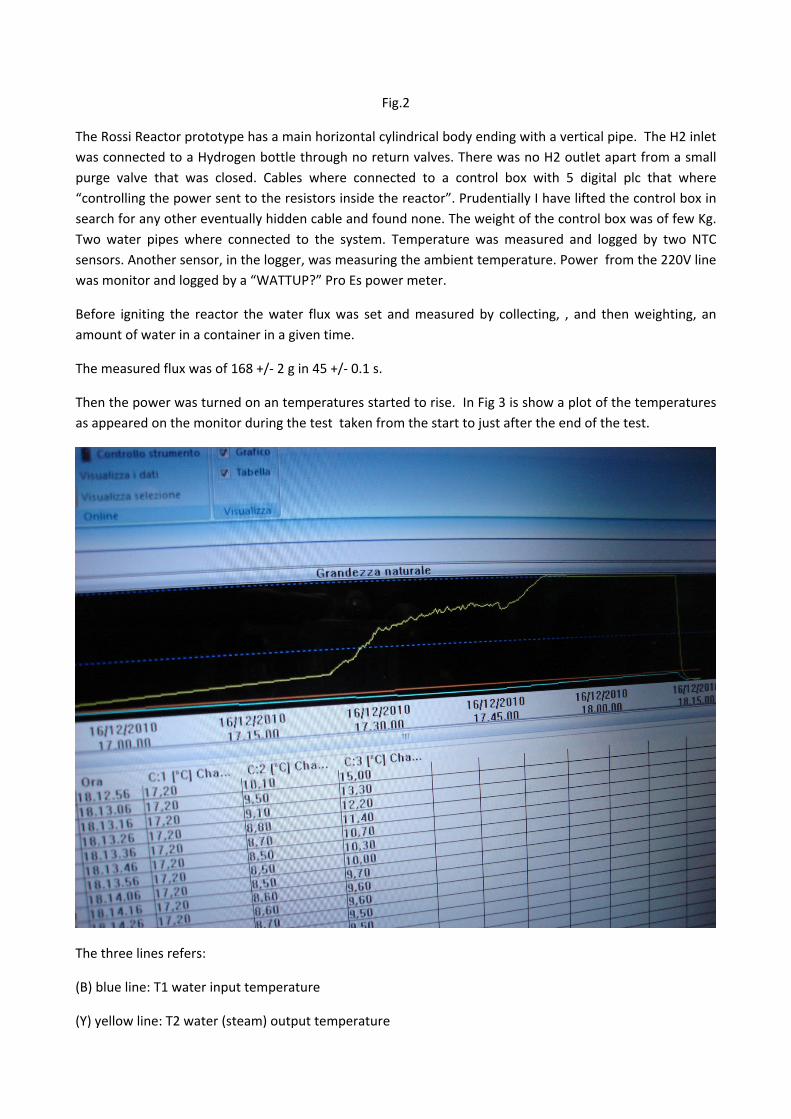
Fig.2
The Rossi Reactor prototype has a main horizontal cylindrical body ending with a vertical pipe. The H2 inlet was connected to a Hydrogen bottle through no return valves. There was no H2 outlet apart from a small purge valve that was closed. Cables where connected to a control box with 5 digital plc that where “controlling the power sent to the resistors inside the reactor”. Prudentially I have lifted the control box in search for any other eventually hidden cable and found none. The weight of the control box was of few Kg. Two water pipes where connected to the system. Temperature was measured and logged by two NTC sensors. Another sensor, in the logger, was measuring the ambient temperature. Power from the 220V line was monitor and logged by a “WATTUP?” Pro Es power meter.
Before igniting the reactor the water flux was set and measured by collecting, , and then weighting, an amount of water in a container in a given time.
The measured flux was of 168 +/‐ 2 g in 45 +/‐ 0.1 s.
Then the power was turned on an temperatures started to rise. In Fig 3 is show a plot of the temperatures as appeared on the monitor during the test taken from the start to just after the end of the test.
The three lines refers:
(B) blue line: T1 water input temperature
(Y) yellow line: T2 water (steam) output temperature
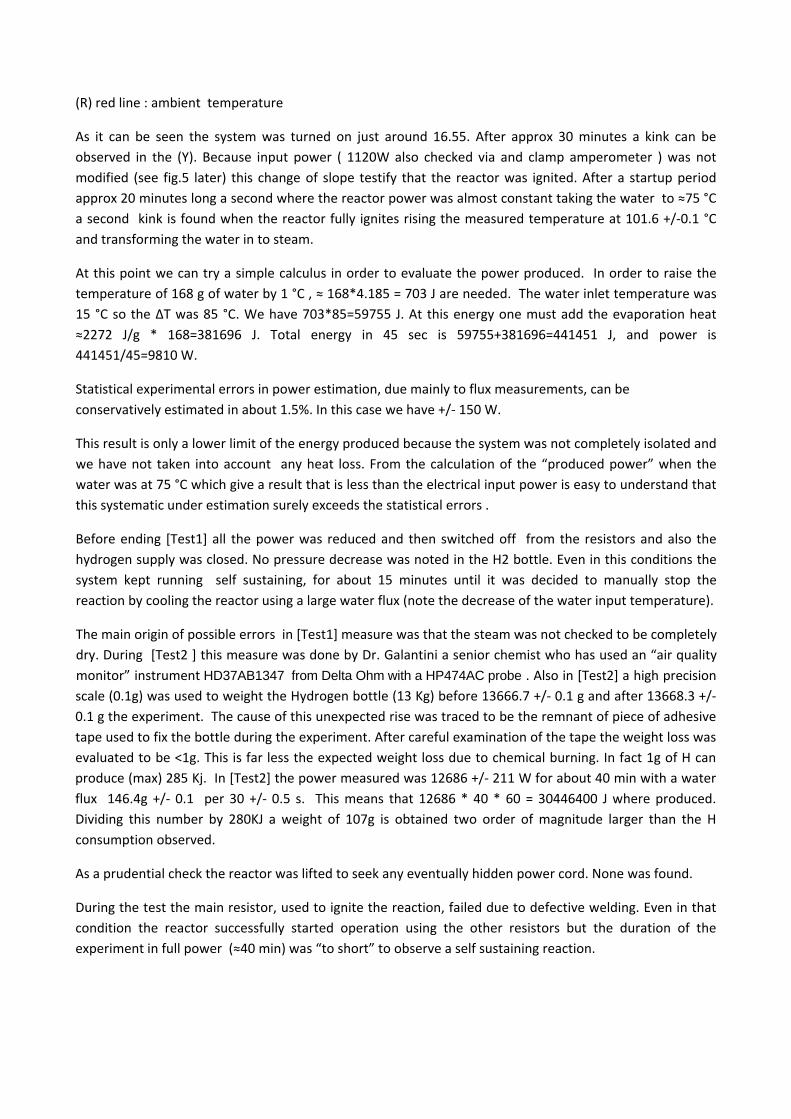
(R) red line : ambient temperature
As it can be seen the system was turned on just around 16.55. After approx 30 minutes a kink can be observed in the (Y). Because input power ( 1120W also checked via and clamp amperometer ) was not modified (see fig.5 later) this change of slope testify that the reactor was ignited. After a startup period approx 20 minutes long a second where the reactor power was almost constant taking the water to ≈75 °C a second kink is found when the reactor fully ignites rising the measured temperature at 101.6 +/‐0.1 °C and transforming the water in to steam.
At this point we can try a simple calculus in order to evaluate the power produced. In order to raise the temperature of 168 g of water by 1 °C , ≈ 168*4.185 = 703 J are needed. The water inlet temperature was 15 °C so the ΔT was 85 °C. We have 703*85=59755 J. At this energy one must add the evaporation heat ≈2272 J/g * 168=381696 J. Total energy in 45 sec is 59755+381696=441451 J, and power is 441451/45=9810 W.
Statistical experimental errors in power estimation, due mainly to flux measurements, can be conservatively estimated in about 1.5%. In this case we have +/‐ 150 W.
This result is only a lower limit of the energy produced because the system was not completely isolated and we have not taken into account any heat loss. From the calculation of the “produced power” when the water was at 75 °C which give a result that is less than the electrical input power is easy to understand that this systematic under estimation surely exceeds the statistical errors .
Before ending [Test1] all the power was reduced and then switched off from the resistors and also the hydrogen supply was closed. No pressure decrease was noted in the H2 bottle. Even in this conditions the system kept running self sustaining, for about 15 minutes until it was decided to manually stop the reaction by cooling the reactor using a large water flux (note the decrease of the water input temperature).
The main origin of possible errors in [Test1] measure was that the steam was not checked to be completely dry. During [Test2 ] this measure was done by Dr. Galantini a senior chemist who has used an “air quality monitor” instrument HD37AB1347 from Delta Ohm with a HP474AC probe . Also in [Test2] a high precision scale (0.1g) was used to weight the Hydrogen bottle (13 Kg) before 13666.7 +/‐ 0.1 g and after 13668.3 +/‐ 0.1 g the experiment. The cause of this unexpected rise was traced to be the remnant of piece of adhesive tape used to fix the bottle during the experiment. After careful examination of the tape the weight loss was evaluated to be <1g. This is far less the expected weight loss due to chemical burning. In fact 1g of H can produce (max) 285 Kj. In [Test2] the power measured was 12686 +/‐ 211 W for about 40 min with a water flux 146.4g +/‐ 0.1 per 30 +/‐ 0.5 s. This means that 12686 * 40 * 60 = 30446400 J where produced. Dividing this number by 280KJ a weight of 107g is obtained two order of magnitude larger than the H consumption observed.
As a prudential check the reactor was lifted to seek any eventually hidden power cord. None was found.
During the test the main resistor, used to ignite the reaction, failed due to defective welding. Even in that condition the reactor successfully started operation using the other resistors but the duration of the experiment in full power (≈40 min) was “to short” to observe a self sustaining reaction.
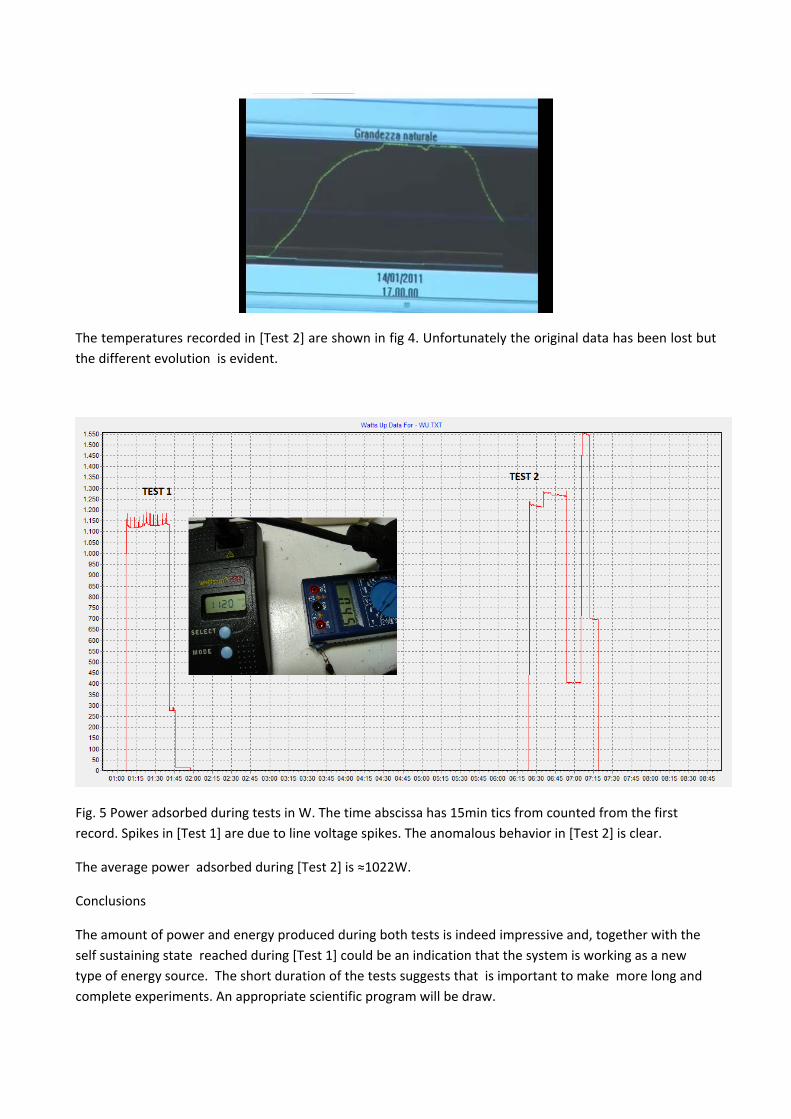
The temperatures recorded in [Test 2] are shown in fig 4. Unfortunately the original data has been lost but the different evolution is evident.
Fig. 5 Power adsorbed during tests in W. The time abscissa has 15min tics from counted from the first record. Spikes in [Test 1] are due to line voltage spikes. The anomalous behavior in [Test 2] is clear.
The average power adsorbed during [Test 2] is ≈1022W.
Conclusions
The amount of power and energy produced during both tests is indeed impressive and, together with the self sustaining state reached during [Test 1] could be an indication that the system is working as a new type of energy source. The short duration of the tests suggests that is important to make more long and complete experiments. An appropriate scientific program will be draw.