on counting and counting errors
TRANSCRIPT
Commentary
On Counting and Counting Errors
R.W. GUILLERY*
Department of Anatomy, University of Wisconsin School of Medicine, Madison, WI 53706
ABSTRACTCounting objects in histological sections is often a necessary, sometimes an unexpected
part of a research project. The recent literature shows that the subject of counting is ofparticular interest to readers of the Journal of Comparative Neurology but that it is alsocontentious and difficult. Even a brief review of past issues of the Journal shows that thereare many misconceptions about counting and that there remain issues that have receivedlittle or no attention. Counts are subject to many errors. Some reports include readilyrecognizable errors, others fail to include all of the information that is needed for anevaluation of their accuracy. This review is above all a plea for adequate information aboutthe methods used for counts in all publications. It serves to help those who are new toquantitative methods in histology; it considers some of the basic issues arising for anyoneundertaking counts, or reviewing manuscripts that include counts. In particular, it considersrecently introduced or re-introduced counting methods that depend on accurate measuresalong the axis perpendicular to the plane of the sections, and looks at the difficulties inherentin these measures. J. Comp. Neurol. 447:1–7, 2002. © 2002 Wiley-Liss, Inc.
Indexing terms: quantitative histology; optical disector; cell counts; sampling
Yet another article on counting needs justification, andthat is where this one must start. There have been severalarticles about counting methods in the Journal of Com-parative Neurology (Coggeshall and Lekan, 1996; Saper,1996, 1997; Guillery and Herrup, 1997; Geuna, 2000) andalso, quite recently, in several other publications (West,1999, 2001; Benes and Lange, 2001a1; Guillery and Au-gust, 2002; Williams et al., 2001); these represent diverseand sometimes strongly opposing views. There are manypapers published in this Journal that include counts ofone sort or another, and there are good reasons for expect-ing the number to increase. One strong reason for raisingthe subject again is that a significant proportion of thesepublished papers contain either methodological errors or,more commonly, insufficient information for a clear as-sessment of the significance of the results. A second, andpossibly more important reason is that simpler ap-proaches to counting are being introduced; these, whilenaturally appealing, raise new problems that are notwidely recognized and that merit careful evaluation. Inparticular, two of these methods (the optical disector, andthe comparison of counts obtained from two sections of
different but known thicknesses) rely on accurate mea-sures in the “z axis” (i.e., the axis perpendicular to theplane of the section); measurements that are often difficultto make and whose accuracy commonly cannot be evalu-ated from the information provided. A third reason is thatthe need for counts appears to be on the increase, andmany find that they must produce some quantitative re-sults, but have had little or no training in a subject that
Grant sponsor: National Institutes of Health; Grant numbers: EY 11494and 12936.
*Correspondence to: Dr. R.W. Guillery, Department of Anatomy, Uni-versity of Wisconsin School of Medicine, 1300 University Avenue, MadisonWI 53706. E-mail: [email protected]
Received 5 December 2001; Revised 25 January 2002; Accepted 25 Jan-uary 2002
DOI 10.1002/cne.10221Published online the week of April 1, 2002 in Wiley InterScience (www.
interscience.wiley.com).1The subsequent correspondence in Trends in Neuroscience 2001, 24,
374–380, illustrates the extent to which there is significant disagreementon some of the issues.
THE JOURNAL OF COMPARATIVE NEUROLOGY 447:1–7 (2002)
© 2002 WILEY-LISS, INC.
appears simple at first encounter but proves to have hid-den and often quite unexpected complexities when thedetailed consideration of results is brought into clearfocus.
The following review is intended to stress two crucialpoints. One is that there is no one “best” method of count-ing. The most suitable method for any particular problemdepends on the level of accuracy required, on the nature ofthe material that is being studied, and on the type ofobject being counted. The method used should also beallowed to depend on the inclinations of the author, pro-vided that the method is clearly described and producesthe level of accuracy needed. This is the second point, thatthe author is responsible for providing a complete accountof the methods used, one that can serve to inform thereader about exactly what measures were taken, and howthe authors evaluated the relative accuracy of these mea-sures. References to general accounts of a method aregenerally not sufficient.2 Details are essential. There isnow a significant reservoir of numerical results that acritical reader has to assign to a pool labeled: “perhaps so,but not sufficient documentation”.
The problems that arise in light microscopical studiesare considered. Electron microscopy raises some distinctproblems but these will not be discussed here (see Guilleryand August, 2001 for some of the special issues raised byelectron microscopy).
Why is there a problem?
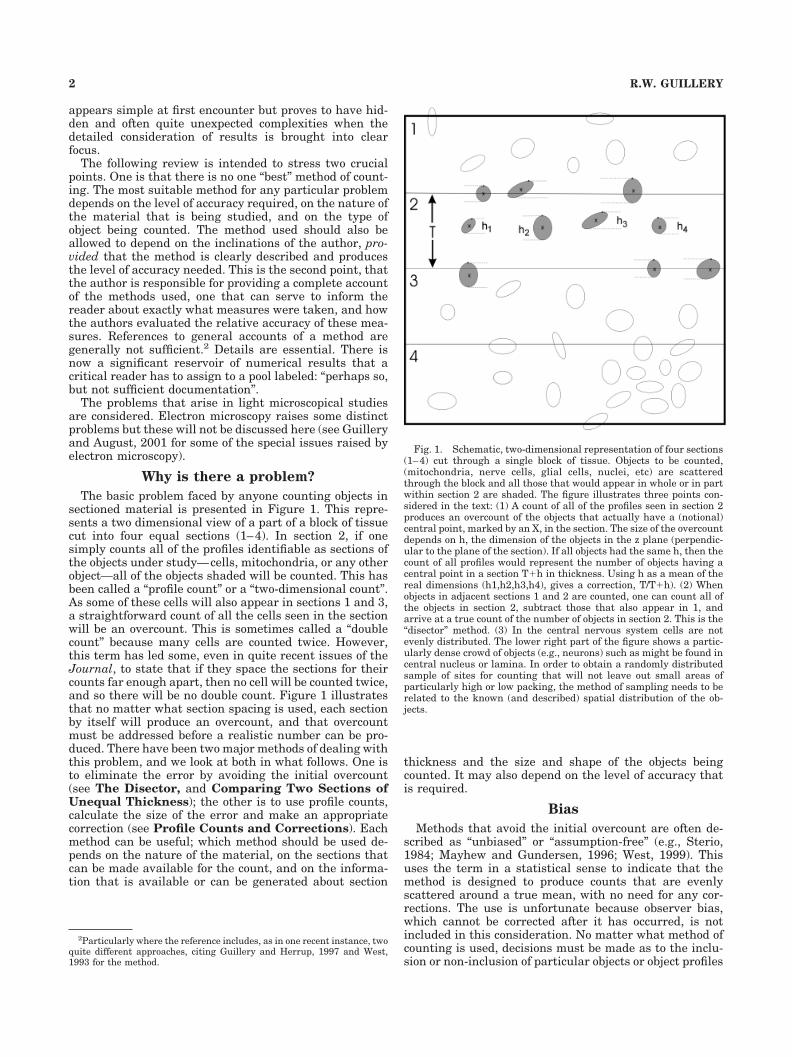
The basic problem faced by anyone counting objects insectioned material is presented in Figure 1. This repre-sents a two dimensional view of a part of a block of tissuecut into four equal sections (1–4). In section 2, if onesimply counts all of the profiles identifiable as sections ofthe objects under study—cells, mitochondria, or any otherobject—all of the objects shaded will be counted. This hasbeen called a “profile count” or a “two-dimensional count”.As some of these cells will also appear in sections 1 and 3,a straightforward count of all the cells seen in the sectionwill be an overcount. This is sometimes called a “doublecount” because many cells are counted twice. However,this term has led some, even in quite recent issues of theJournal, to state that if they space the sections for theircounts far enough apart, then no cell will be counted twice,and so there will be no double count. Figure 1 illustratesthat no matter what section spacing is used, each sectionby itself will produce an overcount, and that overcountmust be addressed before a realistic number can be pro-duced. There have been two major methods of dealing withthis problem, and we look at both in what follows. One isto eliminate the error by avoiding the initial overcount(see The Disector, and Comparing Two Sections ofUnequal Thickness); the other is to use profile counts,calculate the size of the error and make an appropriatecorrection (see Profile Counts and Corrections). Eachmethod can be useful; which method should be used de-pends on the nature of the material, on the sections thatcan be made available for the count, and on the informa-tion that is available or can be generated about section
thickness and the size and shape of the objects beingcounted. It may also depend on the level of accuracy thatis required.
Bias
Methods that avoid the initial overcount are often de-scribed as “unbiased” or “assumption-free” (e.g., Sterio,1984; Mayhew and Gundersen, 1996; West, 1999). Thisuses the term in a statistical sense to indicate that themethod is designed to produce counts that are evenlyscattered around a true mean, with no need for any cor-rections. The use is unfortunate because observer bias,which cannot be corrected after it has occurred, is notincluded in this consideration. No matter what method ofcounting is used, decisions must be made as to the inclu-sion or non-inclusion of particular objects or object profiles
2Particularly where the reference includes, as in one recent instance, twoquite different approaches, citing Guillery and Herrup, 1997 and West,1993 for the method.
Fig. 1. Schematic, two-dimensional representation of four sections(1–4) cut through a single block of tissue. Objects to be counted,(mitochondria, nerve cells, glial cells, nuclei, etc) are scatteredthrough the block and all those that would appear in whole or in partwithin section 2 are shaded. The figure illustrates three points con-sidered in the text: (1) A count of all of the profiles seen in section 2produces an overcount of the objects that actually have a (notional)central point, marked by an X, in the section. The size of the overcountdepends on h, the dimension of the objects in the z plane (perpendic-ular to the plane of the section). If all objects had the same h, then thecount of all profiles would represent the number of objects having acentral point in a section T�h in thickness. Using h as a mean of thereal dimensions (h1,h2,h3,h4), gives a correction, T/T�h). (2) Whenobjects in adjacent sections 1 and 2 are counted, one can count all ofthe objects in section 2, subtract those that also appear in 1, andarrive at a true count of the number of objects in section 2. This is the“disector” method. (3) In the central nervous system cells are notevenly distributed. The lower right part of the figure shows a partic-ularly dense crowd of objects (e.g., neurons) such as might be found incentral nucleus or lamina. In order to obtain a randomly distributedsample of sites for counting that will not leave out small areas ofparticularly high or low packing, the method of sampling needs to berelated to the known (and described) spatial distribution of the ob-jects.
2 R.W. GUILLERY
in a count. Where a study aims to produce a single total,observer bias cannot be addressed, although it is likely tobe present. But where comparisons are made, the readeris entitled to assume that observer bias played a role inthe final differences reported unless there is a specificstatement that the observer was blind to the conditionsbeing compared. Adding the adjective “unbiased” to a par-ticular method of counting is rather like wearing a badge;it is generally more decorative than informative. It shouldbe discouraged because when the method is fully de-scribed sources of bias (or their absence) should be readilyidentifiable. Bias can be introduced into counts in manydifferent ways, only some of which are addressed by meth-ods labeled “unbiased” or “assumption-free”. Some of theseare considered here (see also Guillery and Herrup, 1997;Guillery and August 2001).
The Disector
The earliest known method of making a count thatneeded no corrections for overcounting was published in1895 in a study of kidney glomeruli, which are large rel-ative to section thickness. Miller and Carlton (1895) usedthe basic principle of what was later called the “disector”method (Sterio, 1984), and this method has been widelypublicized and discussed more recently (Gundersen et al.,1988; Mayhew and Gundersen, 1996; Coggeshall and Le-kan, 1996; West, 1999). It is particularly useful where theobjects to be counted are large relative to section thick-ness.
In order to arrive at an accurate estimate of the numberof objects in section 2 of Figure 1, one can, in theory,identify each object by a single, dimensionless point. Thefigure shows Xs that mark an arbitrarily defined “center”for each object, and shows small dots, which define the topof each object. Either will serve the present theoreticaldiscussion although we will see that the tops are far moreuseful in practice. If one counts all of the objects for whichthe chosen point is included within the section (includingpoints that lie on one surface of the section and excludingpoints that lie on the opposite surface), one arrives at anestimate that needs no corrections. However, identifying asingle point that identifies the “center” of the objects is notusually possible, and it was not until quite recently thatthe top of an object was recognized as a useful practicalmarker, giving each object a single identifier. The use ofthe disector addresses this same issue by using two adja-cent sections (e.g., sections 1 and 2 of Figure 1). All of theobjects visible in section 2 are counted first, and then onthe serially corresponding part of section 1 those objectsthat also appear in section 2 are identified and counted.This count is then subtracted from the total of objectscounted on section 2. If the sections are not adjacent, thenthe distance between them must be less than the height ofthe smallest object being counted. In this way, each objectis only counted for one appearance in a section and theovercounting that characterizes profile counts is avoided.This, the “physical disector,” is a powerful method and isone that is to be highly recommended. However, it is notalways possible to use it in archival material or in studieswhere more than one method has to be applied to sections,that is, where closely spaced sections may not be avail-able. Further, the process of matching the sections can bedifficult and labor-intensive. For these reasons the “opti-cal disector” or some variant of this has been introducedand has great appeal (Williams and Rakic, 1988; Bjugn
and Gundersen, 1993; West, 1999). It is technically verymuch simpler to carry out because instead of using twophysically separate sections one can use two optical sec-tions passing through a single physical section, so that theproblem of matching sections is removed. One can use theoptical disector in exactly the same way as the physicaldisector, or one can simplify the process even further andcount the tops of objects as they come into focus as this ismoved from one optical section plane to the next. Thesemethods have been fully described in the cited references,which should be consulted for more details. They can bothbe used to produce reliable counts, but especially for theoptical disector the reliability of the counts will generallydepend on measurements in the z axis (see Measure-ments Along the z Axis).
Comparing Two Sections of UnequalThickness
Abercrombie (1946) suggested that one could obtain pro-file counts that needed no correction by cutting alternatethin and thick sections, counting the profiles in each andthen subtracting the lower counts from the higher countsto obtain a count of the number of profiles in a (notional)section whose thickness equals the difference of the twosection thicknesses. In principle this is very like the dis-ector, but it deals with means of counts and needs nophysical matching of adjacent sections. Williams et al.(2001) have recently written in more detail about thismethod. However, the accuracy of the method dependscritically on reliable information about the thickness ofthe sections used for the counts and the use of frozensections recommended by Williams et al., may lead todifficulties. Measuring the thickness of the frozen sectionsactually used for the counts is not to be recommended,since the thickness is significantly reduced when the sec-tions are dehydrated and cleared, and because measure-ments in the z axis are likely to have an error too large foran accurate comparison (see Measurements Along the zAxis). One needs a series of sections that is regular interms of section thickness. This is more reliably obtainedfrom sections embedded in celloidin or plastic than forfrozen sections, where pauses in cutting can lead to tem-perature changes that affect thickness. Provided that onecan be confident that the sections are of regular thickness(and stained sections readily reflect irregularities in termsof staining intensity), then the best way of assessing sec-tion thickness (and the one suggested by Abercrombie) isto cut alternate thick and thin sections, collect them astwo separate series, and take a few sections (1 in 5 or 1 in10) and re-embed them, and then cut them perpendicularto the original section plane.3 Then the measurements ofsection thickness can be made directly with a micrometerscale in the microscope.4 These measurements (which
3This process can be made relatively straight forward if several sectionsare embedded flat in the original embedding medium parallel to each otherand then resectioned (see Marengo, 1994). However, it is important toensure that measurements be made on parts of the sections that areperpendicular to the second cut, and that the second cut is relatively thin.
4Note that this involves the assumption that the second embedding andcutting produces no further shrinkage in the sections, which would seem tobe a reasonable assumption provided that the sections are not exposed toany new solutions or treatments, and provided that the block is oriented sothat for the second cut, which may produce some compression, the blockmoves perpendicular to dimension that is to be measured.
3COUNTING AND COUNTING ERRORS
should be reported as means and standard errors) willprovide crucial information about the regularity of thesection thicknesses and, provided that the thicknesses arereasonably regular, will give an accurate estimate of thethickness of the sections used for the counts. Williams etal., (2002) suggest an alternative method of measuringregularity of the section thicknesses. This is to cut severaldifferent thicknesses and ensure that the computed num-bers are the same per unit of thickness no matter whichtwo section thicknesses are compared. Note that there aretwo important, unrelated variables that need to be mea-sured and reported. One that the advance of the knife isaccurately calibrated, for example, that it advances ex-actly 5mm when the cutting thickness is set at 50 �m andadvanced 100 times, and the other is the consistency of thecut, where the regular appearance of serial sections of thesame thickness can provide an important clue, but somequantitative information on this point should be provided,as indicated above.
Profile Counts and Corrections.
As we have seen, counts of profiles in sections inevitablyproduce an overcount. Profile counts are sometimes pre-sented as intrinsically unreliable (Coggeshall and Lekan,1996; West, 1999) and this unreliability is then demon-strated by showing that when large objects are counted inthin sections gross errors occur. It should be clear from firstprinciples and from Figure 1 that the greater the objects arerelative to section thickness, the greater the error. Profilecounts of small objects in thick sections can be relativelyaccurate and lend themselves to corrections that compensatefor overcount. The correction is readily computed, and isgiven by Abercrombie (1946), and in a slightly different formby Konigsmark (1970). This correction factor is reportedinaccurately by Coggeshall and Lekan (1996) and by West(1999). Abercrombie’s formula for the ratio of the “real” num-ber to the observed number is T/T�h, where T � sectionthickness and h � mean diameter of the objects along theaxis perpendicular to the plane of the section, the z axis (seeFigure 1 for T and h and for an explanation of the derivationof this fraction). This is close to 1.0 when the objects are verysmall (e.g., nucleoli, mitochondria) in relation to sectionthickness, and becomes smaller as h increases relative to T,so that for circa 15 �m cells in a 20 �m section it is about0.57. That is, the observed number of profiles overestimatesthe real number by about 75% (100/57�1.75). Where it canbe shown that cells are characterized by just one nucleoluseach, it is obviously advantageous to count nucleoli, treatingthese as the arbitrarily defined point in each cell, and it isusually better to count nuclei than cells. When using thiscorrection factor it is quite useful to estimate the size of theerror that is likely to be introduced by errors in the measure-ment of h or T. For example, if nucleoli are being counted insections that are 20 �m thick, and the nucleoli have a meanh of 4 �m, then a raw count of 100 cells will represent a realcount of 83. If the measurement of h is in error and isrecorded as 5 �m, then a raw count of 100 will be recorded asa “real” count of 80, and if the recorded h is 3 �m then a rawcount of 100 will be recorded as a count of 87. This not onlyhelps to estimate the likely size of errors, it also focuses onthe nature of the Abercrombie correction and on the degreeof accuracy that a particular study requires.
Profile counts are particularly useful for small objects inthick sections. Where the shape or the size of objects ishighly variable, or where the dimensions along the z axis
cannot be accurately measured, profile counts are notrecommended. Where several distinct populations of ob-jects, each having a different size, are to be counted, it isnecessary to record the mean height for each population,and to distinguish the counts and the corrections.
The correction depends on accurate measures of sectionthickness and cell diameter along the appropriate axis.Neither is straightforward. They can be measured alongthe optical, z axis, and such measurements are consideredbelow (see Measurements Along the z Axis). It shouldbe stressed that for T/h ratios that are high, relativelysmall errors in these measurements are likely to be trivialand can often be ignored. As this ratio decreases, so theimportance of having accurate measures increases. A cor-rection factor of 0.75 (e.g. 10 �m objects in 30 �m sections)may be worrying if one is seeking a high level of accuracy.Then justifying the use of this method will depend on thedegree to which the accuracy of measures of section thick-ness and object size can be documented. It should bepossible to provide a reasonable estimate of the accuracyof the count and also of the correction applied.
Sampling
It is important to distinguish methods of sampling frommethods of counting. The former is the method used toidentify the volumes of tissue that are to be used forcounting and the latter is the actual technique of record-ing the number of objects in each of those volumes. Meth-ods of sampling have been considered by Gundersen et al.(1999), West (1999), and Benes and Lange (2000a and b).The method of choosing the samples should be clearlydescribed and there should be some statement that relatesthe distribution of the population being counted to the sizeand the distribution of the samples. This is often not done.There are three important issues: (1) Some methods ofcounting, particularly the use of the optical disector,5 pro-duce very small sample volumes; (2) Whatever the size ofthe samples, the distribution of the sites for countingshould be randomly assigned; and (3) The degree to whichthe objects counted can be treated as having a relativelyhomogeneous distribution must be determined. The issuesare difficult. In a population of objects that is homoge-neously distributed, small, randomly distributed samplescan provide good population estimates. However, as Benesand Lange (2000a) have argued,6 neural tissue, in con-trast to many other tissues, often shows a strongly hetere-genous distribution. In Figure 1, a particularly dense pop-
5Sample sizes are small because the method is most powerful when an oilimmersion lens is used, and because movements of the stage along the xand y axes must be avoided while the focal plane is shifted to record objectsat particular optical planes.
6Benes and Lange (2001b) have stated: “Various neural systems aredifferent from one another in terms of the size and clustering. . . . of cellsetc. This fact is obvious when one examines several different regions, suchas cortex, amygdala and hippocampus, through the microscope. It is inap-propriate to assume a priori that each of these regions can be analyzedusing packaged ‘off-the-shelf’ software without applying forethought andcritical judgment, as contrasted with machine calculations. We are encour-aging neuroscientists to think critically about what they are doing and tomake whatever necessary adjustments in their counting methodology arerequired to deliver the most representative, reproducible and generalizablesamples and scientific findings as possible.” It is necessary to add that notonly should there be critical thinking on these issues, but the results ofthese critical thoughts should be clearly communicated when the methodsare described.
4 R.W. GUILLERY

ulation of objects is shown (lower right); a comparabledistribution is not uncommon in the central nervous sys-tem. It can be seen that if no preliminary survey of thetissue were undertaken, it would be easy to produce asample that entirely missed this dense population. Wher-ever a population is markedly heterogeneous there is adanger that the sampling procedure used for selectingvolumes of tissue to be counted will miss either the dens-est or the least dense part of the population. This is aparticular danger if the samples are small (see Benes andLange, 2000a). There is no way to demonstrate, using onlythe numbers generated, whether the population as awhole is fairly represented by the sample. The investiga-tor needs to have a clear knowledge of how the populationis distributed and needs to be convinced (and be able toconvince the reader) that the sample does indeed repre-sent the population as a whole. That is, some recognitionof the morphological realities of the situation is essentialbefore a particular sampling procedure can be chosen orjustified for the reader.
Measurements Along the z Axis
These measures can often be avoided where the volumeof the structure under study is clearly defined and thecounts at any one counting site are obtained from a knownproportion of the total volume (the “fractionator” methoddescribed by Gundersen et al., 1988, and West, 1999).However, one often needs to know the thickness of thesections or the height of the objects along the z axis (as forthe Abercrombie correction). The method of recutting sec-tions recommended by Abercrombie (see ComparingTwo Sections of Unequal Thickness) avoids directmeasurement along the optical z axis and can providemeasurements for section thickness and for the height ofobjects in the sections used for counting. Often, if it can beshown in sections cut in more than one plane that theobjects are roughly spherical or show no preferred axis oforientation, then measurements can be made directly inthe plane of the x and y axes with a micrometer scale inthe sections actually used for the counts. However, nomatter where the cells are sampled, the cells to be mea-sured should be entirely or almost entirely included in thesection in order to avoid measuring small parts of cellsthat would give spurious low measures. That is, avoidmeasuring cells that lie near either surface of the sections,and don’t measure large cells in thin sections. If this isunavoidable, then it is necessary to make some furthercorrections in order to arrive at an estimate of cell dimen-sions that takes into account the smaller profiles seen insections far from the cell diameter (see Coupland, 1968).
For actually making measures along the z axis itself,there are several important issues that have receivedscant attention in recent publications. One vital issue ischanges in refractive index along the optical axis. Thisincludes the refractive index of the medium in which thesection is mounted, the refractive index of the tissue sec-tion itself (as this may not be the same as the mountingmedium; see Guillery and August, 2001), and the refrac-tive index of air between the objective lens and the coverslip when a dry lens is used. Any change in refractiveindex between the objective lens and the object beingmeasured will produce an error of measurement. This iswell known to microscopists and sometimes referred to as“Snell’s law” (Glaser, 1982). The error can be very large,amounting to more than 60% when a dry lens is used
without correction (West and Slomianka, 1998). It can alsobe significant if the mounting medium has a refractiveindex that differs from that of glass. The refractive indexof mounting media varies significantly,7 especially, butnot exclusively, for sections mounted in aqueous solutions.
A second issue concerns mechanical factors that deter-mine the accuracy with which movements along the z axisof the microscope objective relative to the stage can berecorded. Microscopes vary greatly in the accuracy withwhich the fine divisions on the focus knob represent dis-tance moved. A device for recording the stage movement(often called a “microcator”) has been described (Gun-dersen et al., 1988), and this is generally a better way torecord the movements. However, a microcator cannot beguaranteed to provide accurate measures since the man-ner of its attachment to the microscope and the care withwhich it has been handled are relevant to its performance.The use of a stepping motor to control up and down stagemovements can also give a good read-out of movements inthe z axis, although the nature of the mechanism and thecare with which it has been treated is relevant, so that nomatter what method for recording movements in the z axisis used, calibration of the device should be routinely pro-vided but almost never is. Possibly the most direct way ofcalibrating a microcator or a stepping motor is to measuremicrospheres. If these can be seen to have a sphericaloutline in terms of their x and y dimensions, and if theirrefractive index is known, then it should be possible toprovide means and standard errors of measurements ob-tained along the x and y axes and to compare them withmeasures along the z axis. The inclusion of such calibra-tions in accounts that depend on measures along the z axiswould provide useful documentation, and should perhapsbe required as a routine.
A third issue concerns the optical realities that deter-mine the accuracy with which measures along the z axiscan be made with even the best optics and most accuratelycalibrated microcator. Geuna (2000) has argued that forthe optical disector, when the tops of objects are beingrecorded, the top “. . .is a point (and thus adimensional), ithas no size, shape or orientation,”. . . “it can be sampled inonly one disector volume (i.e. it cannot be split into twodisectors)”. This, although true of the object being studied,is not true of its optical image, which is what the investi-gator has to deal with. A point source will produce aroughly spherical image with dimensions that depend onthe optics and on the observer’s eye. The focusing capacityof the observer’s eye, which for a young investigator canmake a significant contribution to the process of focusingan object, is best eliminated by studying an image on ascreen. So in any account, if a screen has been used, thisshould be stated because it improves the level of accuracy.The optics that have been used, including the nature ofthe objective lens, its numerical aperture and whether itwas oil immersion also affect the accuracy of the measure-ment, as does information about the mounting medium orthe plastic used for embedding, particularly if these havea refractive index that differs from that of glass and im-mersion oil (1.51). It is rare to see any mention of therefractive index of the mounting medium or the embed-ding medium. Possibly they are the same as glass, but
7Lillie (1965) shows a range from 1.413 to 1.8225.
5COUNTING AND COUNTING ERRORS
commonly the values are not known and their signifi-cance for the reported measures has been ignored. Thethickness of the coverslip is also relevant where accu-rate measurements are required. It is not unreasonableto expect all these variables to be reported where mea-surements along the z axis are critical to the observa-tions, yet it is rare for them all to be included and usualfor most to be omitted.
Given that there are many variables that affect theaccuracy of measurements in the z plane, it is generallynot realistic to assume that the measurements are beingmade under ideal conditions. The best that one can expectunder optimal conditions8 is a depth of focus of about0.5�m. Williams and Rakic (1988) give a measure of0.3�m, and Lange and Edstrom (1954) reported a 10%error for measurements of 5�m. West et al. (1996) reportan estimate of “depth of focus” of 1–2�m when they wereusing an oil immersion lens with a high numerical aper-ture. This is a figure that one can realistically expectunder many “usual” optical conditions. Uylings et al(1986), using X 63 and X 100 lenses (NA not given) reportan inter-individual variation of measures with a range of3�m for measuring a section that was 5�m in thickness.
Finally, the accuracy with which one can determine theprecise focal plane of the top of any object will depend onthe nature of the object. In a Nissl preparation, the top ofthe nucleolus may be relatively clear whereas the top ofthe cell, defined by the staining of the granular Nisslsubstance may be more problematic, and the degree towhich Nissl material is or is not associated with the nu-clear membrane is likely to make a difference to the accu-racy with which one can record the top of the nuclei.Heavily stained objects, in Golgi preparations or immuno-histochemical preparations, often prove difficult as well.
Where optical sections less than 5�m apart are used, asignificant error of 20% or more is likely to occur, andgiven the difficulties of settling on where the exact focalplane of an object lies it would not be wise to assume thatthis error has a random distribution about a mean thatrepresents the “real” focal plane of the object beingcounted. Counts based on optical disectors less than about10 �m apart may thus include a significant error, and thismay well constitute a bias if the observer is inclined tomisjudge the focal plane consistently in one or anotherdirection.
The preceding comments relate to widefield optics. Onecan expect to do better with measurements in the z direc-tion with a confocal microscope but there should be arequirement for some information about the nature of thecalibration of the instrument’s capacities, as these dependsignificantly on accurate adjustments of the optics and themechanical movements.
When measurements are being recorded along the zaxis, one needs not only to ask about the mechanical andoptical constraints that influence the accuracy of thesemeasures but also to ask about what it is that is beingmeasured. Does 2 �m near the top of the processed sec-tions represent the same distance in the original (un-
shrunken) tissue, as does 2 �m in the middle or near thebottom of a section? Several factors may influence thisimportant relationship. One is that the surface of a sectionmay be subject to more compression from the knife thanthe mid part of a section, a possibility that has been raisedby Hatton and Bartheld (1999) to account for the obser-vation that in their plastic embedded sections counts perunit volume of processed tissue were higher near the topand bottom surfaces of the sections than in the middle. Asecond possibility that merits consideration arises be-cause when a section, cut frozen or on a vibratome, is fixedby one surface on to a “subbed” slide, it will undergo itsmaximal shrinkage after it has been attached to the slide.This shrinkage must occur largely in the z axis, becausepoints along the other two axes are fixed to the slide. Thisshrinkage is thus relatively large, often exceeding 50% inthe one dimension, and it would seem probable that theshrinkage near the bottom of the section that is fixed tothe slide may well differ from that near the top of thesection that is relatively free. Hatton and Bartheld (1999),again recording counts per unit volume of processed tissueat different distances from the surfaces of the sections,reported no differences through the thickness of frozensections, although their figure 2D leaves open the possi-bility that the shrinkage immediately next to the slide wasgreater than that at the surface.
Another problem concerns the extent to which the stainthat has been used has penetrated all parts of the sectionbetween the two surfaces evenly. This is a particular prob-lem for immunohistochemical procedures, but can alsoaffect something as simple as a Nissl stain (Cooper andPayne, 1987). To report that the stain reached all parts ofa section along the parts of the z axis that were used forthe counts, as is sometimes done, is not sufficient becauseone needs to know that its action was evenly distributedalong all parts of the z axis used for the study. Probablythe best method of demonstrating this is the method usedby Hatton and Bartheld (1999), showing that in severalsample counts densities do not vary along the z axis, oralong the parts of the z axis used for the counts. Someobjective method for showing that, in the final processedsections, all parts of the z axis represent equivalent partsof the unprocessed tissue should be a necessary part of anyreport that, like the optical disector, involves counts oftissue volumes limited to a part of the section thickness.
There are many problems related to measures in the zaxis. Many of these problems can be avoided by planningcounts that do not depend on such measures. Importantly,many of these problems have not received sufficientlywide recognition, and counts that depend on accuratemeasures in the z axis are often published with no indi-cation that the problems have been addressed. This lastsection will have served its purpose if it can encourageinvestigators to explore the real nature of these problems,and to begin devising methods that will resolve or circum-vent the problems (see for example, Hatton and Bartheld,1999; Williams et al., 2001).
CONCLUSIONS
There are great many variables that can affect the out-come of a count of objects in histological sections. Someinfluence the variability of the counts and some produce ashift in the counts up or down from the true value, intro-ducing a bias. As far as possible, any published count
8This means an oil immersion lens, with a high numerical aperture usedwith an oil not only between the coverslip and the lens but also on thecondenser; it means a thin coverslip, and appropiate mounting medium,and can only be obtained near the cover slip. Deep in the section the qualityof the optics deteriorates.
6 R.W. GUILLERY
should include enough information for an evaluation ofthe likely size of these errors. It is generally unwise to aimfor complete accuracy. It is rarely achieved, and generallynot needed. What is needed is as detailed an account aspossible of exactly what methods were used to arrive atthe optical, mechanical and quantitative measures thatproduced the final result. The author should then be ableto demonstrate the extent to which the accuracy of theresult matches the accuracy required to sustain the con-clusions of the study.
The history of the subject demonstrates that the issuescritical to obtaining accurate counts can be readily recog-nized with hindsight, but are oddly difficult to anticipate.The first use of the “disector” method was ignored forabout 90 years. Abercrombie’s (1946) two-section methodwas conceptually closely related to this, but even thoughhis correction for profile counts in the same paper waswidely cited, the significance of the two section methodwas not recognized. Stereo’s 1984 paper was an importantadvance, and became more widely known. However, ittook a while after that before it became clear that theoptical disector or the method of simply counting topscould produce comparable results without the difficultiesand limitations of serial reconstruction. There are nowmany commercially available tools that make countingseem relatively easy. However, there is a danger that theyare applied without sufficient recognition of their limita-tions, their intrinsic inaccuracies, or the limitations im-posed by the nature of the tissue under study. It seemslikely that in the future new developments will makecounting simpler and more accessible, and anyone in-volved in counting may well be in a position to recognizeimprovements that have so far escaped the expert practi-tioners. At present the most urgent need is that methodsof counting should be adequately documented, includingdetails of sampling, measuring and counting, as well asthe calibration of the instruments used.
LITERATURE CITED
Abercrombie M. 1946. Estimation of nuclear population from microtomesections. Anat Rec 94:239–247.
Benes FM, Lange N. 2001a. Two-dimensional versus three-dimensionalcell counting: a practical perspective. Trends Neurosci 24:11–17.
Benes FM, Lange N. 2001b. Benes and Lange Respond: reconciling theoryand practice in cell counting. Trends Neurosci 24:378–380.
Bjugn R, Gundersen HJ. 1993. Estimate of the total number of neuronsand glial and endothelial cells in the rat spinal cord by means of theoptical disector. J Comp Neurol 328:406–14.
Coggeshall RE, Lekan HA. 1996. Methods for determining numbers of cellsand synapses: a case for more uniform standards of review. J CompNeurol 364:3–16.
Cooper JD, Payne JN. 1987. Incomplete Nissl staining of central nervoussystem and its avoidance. J Anat (Lond) 152:237–238.
Coupland RE. 1968. Determining sizes and distribution of sizes of spher-ical bodies such as chromaffin granules in tissue sections. Nature217:384–388.
Geuna S 2000. Appreciating the difference between design-based andmodel-based sampling strategies in quantitative morphology of thenervous system. J Comp Neurol 427:333–339.
Glaser EM, 1982. Snell’s law: the bane of computer microscopists. J Neu-rosci Methods 5:201–202.
Guillery RW, August BK. Doubt and certainty in counting. Prog Brain Res(in press).
Guillery RW, Herrup K. 1997. Quantification without pontification: choos-ing a method for counting objects in sectioned tissues. J Comp Neurol386:2–7.
Gundersen H JG, Østerby R. 1981. Optimizing sampling efficiency ofstereological studies in biology: or ‘do more less well!’. J Microscop121:65–73.
Gundersen H JG, Jensen EB, Kieu K, Nielsen J. 1999. The efficiency ofsystematic sampling in stereology reconsidered. J Microscop 193:199–211.
Gundersen H JG, Bagger P, Bendtsen TF, Evans S, Korbo L, Marcussen N,Moller A, Nielsen K, Nyengaard JR, Pakkenberg B. 1988. The newstereological tools: disector, fractionator, nucleator and point sampledintercepts and their use in pathological research and diagnosis. APMIS96:857–881.
Hatton WJ, von Bartheld CS. 1999. Analysis of cell death in the trochlearnucleus of the chick embryo: calibration of the optical disector countingmethod reveals systematic bias. J Comp Neurol 409:169–186.
Konigsmark BW. 1970. Methods for the counting of neurons. In: NautaWJH, Ebbesson SOE, Editors. Contemporary research methods in neu-roanatomy. Heidelberg: Springer. p 315–338.
Lange PW, Edstrom A. 1954. Determination of thickness of microscopicobjects. Lab Invest 3:116–131.
Lillie RD. 1965. Histopathologic technic and practical histochemistry. 3rded. New York: McGraw-Hill.
Marengo NP. 1944. Paraffin section thickness: a direct method of measure-ment. Stain Technol 19:1–10.
Mayhew TM, Gundersen HJG. 1996. “If you assume you can make an assout of u and me”: a decade of the disector for stereological counting ofparticles in 3D space. J Anat (Lond) 188:1–15.
Miller WS, Carlton EP. 1895. The relation of the cortex of the cat’s kidneyto the volume of the kidney and an estimation of the number ofglomeruli. Trans Wisc Acad Sci 10:525–538.
Saper CB. 1996. Any way you cut it: a new Journal policy for the use ofunbiased counting methods. J Comp Neurol 364:5–6.
Saper CB. 1997. Counting on our reviewers to set the standards. J CompNeurol 386:1.
Sterio DC. 1984. The unbiased estimation of number and sizes of arbitraryparticles using the disector. J Microscop 134:127–136.
West MJ, Slomianka L. 1998. Total numbers of neurons in the layers of theof the human entorhinal cortex [Corrigendum]. Hippocampus 8:426.
West MJ. 1999. Stereological methods for estimating the total number ofneurons and synapses: issues of precision and bias. Trends Neurosci22:51–61.
West MJ. 2002. Prog Brain Res (in press).West MJ, Ostergaard K, Andreassen OA, Finsen B. 1996. Estimation of the
number of somatostatin neurons in the striatum: an in situ hybridiza-tion study using the optical fractionator method. J Comp Neurol 370:11–22.
Williams RW, von Bartheld CS, Rosen GD. 2002. Counting cells in sec-tioned material: 3D counting, the optical disector and Abercrombie’stwo-section comparison method. Curr Prot Neurosci: Stereology (inpress).
Williams RW, and Rakic P. 1988. Three dimensional counting: An accurateand direct method to estimate numbers of cells in sectioned material.J Comp Neurol 278: 344–352.
7COUNTING AND COUNTING ERRORS