on coherence in neutron imaging
TRANSCRIPT
Nuclear Instruments and Methods in Physics Research A 651 (2011) 117–120
Contents lists available at ScienceDirect
Nuclear Instruments and Methods inPhysics Research A
0168-90
doi:10.1
n Corr
Univers
Straße 1
fax: +49
E-m
journal homepage: www.elsevier.com/locate/nima
On coherence in neutron imaging
W. Treimer a,b,n, U. Feye-Treimer a
a Department of Mathematics, Physics and Chemistry, University of Applied Sciences, Beuth Hochschule fur Technik, Luxemburger Straße 10, D-13353 Berlin, Germanyb Department G-G1 (Tomography), Helmholtz Zentrum fur Materialien und Energie, Germany
a r t i c l e i n f o
Available online 20 January 2011
Keywords:
Neutron radiography
Phase contrast
Coherence
02/$ - see front matter & 2011 Elsevier B.V. A
016/j.nima.2011.01.051
esponding author at: Department of Mathem
ity of Applied Sciences, Beuth Hochschule
0, D-13353 Berlin, Germany. Tel.: +49 30 45
30 4504 2011.
ail address: [email protected] (W.
a b s t r a c t
The variety of imaging signals in neutron radiography and tomography became quite large compared to
the pure absorption and scattering contrast in neutron radiographies and topographies in the early
sixties or seventies of the last century. The diversity of absorption based techniques for neutron
radiography and tomography is comparable to coherence based imaging techniques such as phase
contrast, differential phase contrast, dark field imaging, diffraction enhanced contrast, refraction
contrast, ultra small angle scattering contrast, grating interferometry and crystal interferometry, also
the spin of the neutron was successfully used for imaging [1–12]. We show which effects (total
reflection, diffraction, refraction) contribute to e.g. a step boundary or a phase boundary. Taking this
simple object, one can learn to understand the imaging procedure and what is displayed in a
radiograph.
& 2011 Elsevier B.V. All rights reserved.
1. Introduction
The underlying problem to be solved is the explanation ofcontrast effects seen as fringes or halos in radiograms andtomographies that appear especially close to phase boundariesor thickness variations like edges [1–12]. These extra effectscomplicate an accurate determination of lengths in a radiogramor tomography; hence, an accurate determination of details in asample. In earlier studies of these effects, step wedges or needleswere imaged and qualitatively explained [6]. This problem – aswas pointed out in other papers [12,13] – can be explained byreflection and refraction of the incident beam; however, as weshow in this paper, diffraction, as rather small interference effect,as well must sometimes be taken into account. Small anglescattering (SAS) at grains, at inhomogeneities, etc. causes a beambroadening depending on the size of the, e.g. scattering grain.Therefore, in imaging SAS is seen rather as background than ascontrast, because the image looses sharpness. The contribution ofSAS to imaging should be kept in mind because the blur can be ofthe order of the critical angel of total reflection of a material.Principally, a SAS contribution to absorption-based or phase-based contrast effects decreases the contrast in an image if it isnot taken as imaging signal itself. Diffraction at phase boundaries,
ll rights reserved.
atics, Physics and Chemistry,
fur Technik, Luxemburger
04 2213/2428;
Treimer).
edges, etc. must be considered as an image enhancing effectbecause it happens – as mentioned above – exactly at these sites.
The contribution of diffraction to an image is generally notsimple to calculate. Once diffraction requires a certain lateralcoherence width wcoh in order to be considered as imaging signal,then the amount of diffraction depends on the phase boundary(different materials, different path lengths of the waves in amaterial, etc.) and on the distance to the detector. Based on theHuygens principle using the Fresnel treatment we calculate thediffraction patterns of a step wedge as was measured in the pastby different groups [13,14]. Describing total reflection and refrac-tion of a neutron by a step wedge one has to keep in mind thatboth are interference effects, well known and pictured in thispaper only qualitatively.
2. Theory
In order to realize a realistic simulation of an image the beamgeometry has to be known as good as possible, i.e. the size of thesource D, the distance source-sample L, the distance sample–detector l, and the pixel size P of the 2D detector. All rays must betaken into account coming from the source D and hitting thesample under all possible angles of incidence. In the case of a(high resolution) neutron radiography, the source is a small pinhole (size mm, cm) being L meter in front of a sample, which itselfis some cm in front of a 2D detector. The pixel size P of thedetector is assumed to be several mm (10 mm).
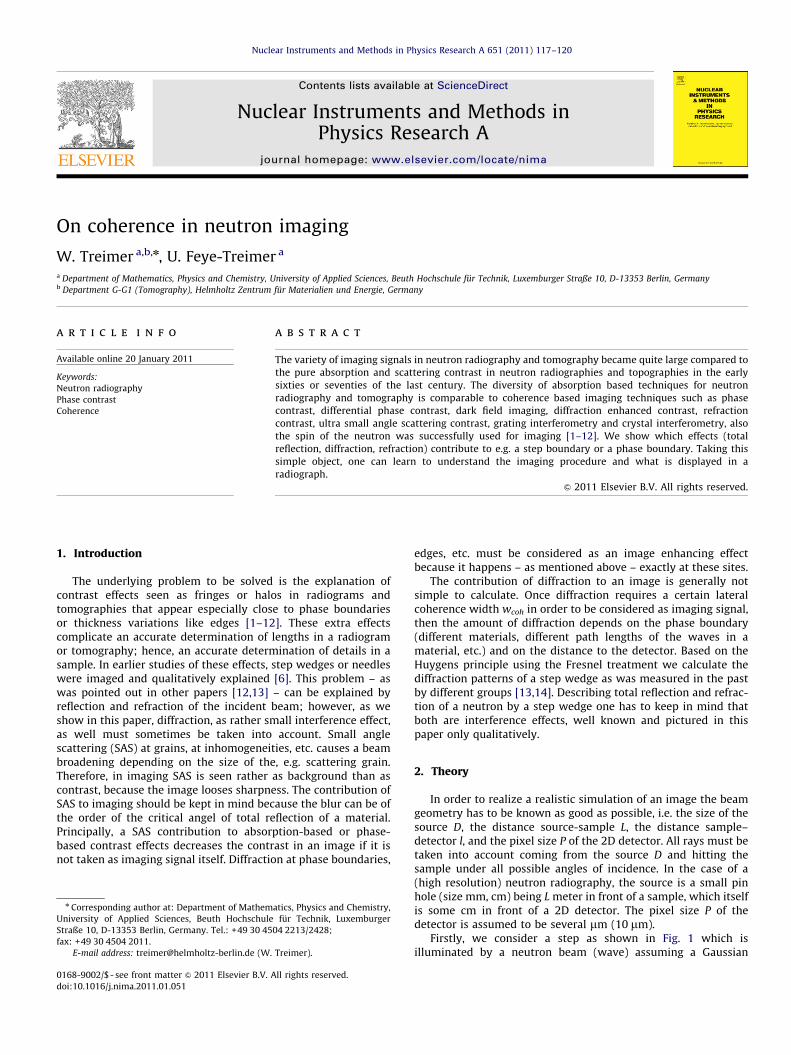
Firstly, we consider a step as shown in Fig. 1 which isilluminated by a neutron beam (wave) assuming a Gaussian
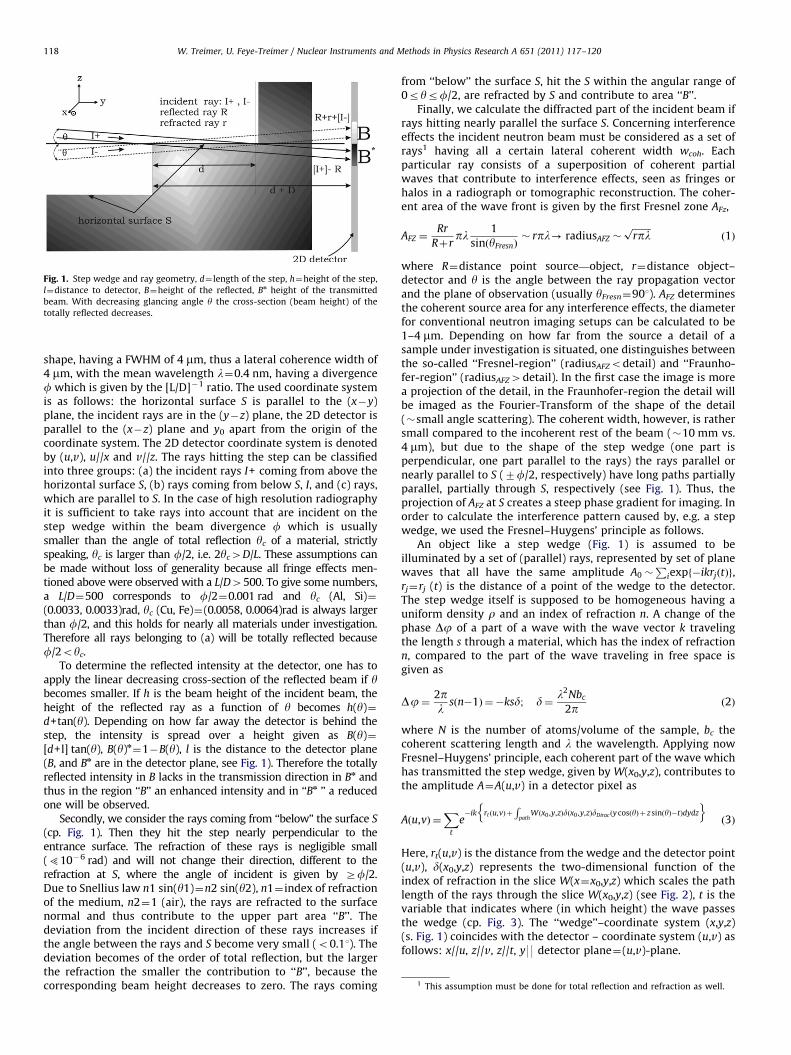
Fig. 1. Step wedge and ray geometry, d¼ length of the step, h¼height of the step,
l¼distance to detector, B¼height of the reflected, Bn height of the transmitted
beam. With decreasing glancing angle y the cross-section (beam height) of the
totally reflected decreases.
1 This assumption must be done for total reflection and refraction as well.
W. Treimer, U. Feye-Treimer / Nuclear Instruments and Methods in Physics Research A 651 (2011) 117–120118
shape, having a FWHM of 4 mm, thus a lateral coherence width of4 mm, with the mean wavelength l¼0.4 nm, having a divergencef which is given by the [L/D]�1 ratio. The used coordinate systemis as follows: the horizontal surface S is parallel to the (x�y)plane, the incident rays are in the (y�z) plane, the 2D detector isparallel to the (x�z) plane and y0 apart from the origin of thecoordinate system. The 2D detector coordinate system is denotedby (u,v), u//x and v//z. The rays hitting the step can be classifiedinto three groups: (a) the incident rays I+ coming from above thehorizontal surface S, (b) rays coming from below S, I, and (c) rays,which are parallel to S. In the case of high resolution radiographyit is sufficient to take rays into account that are incident on thestep wedge within the beam divergence f which is usuallysmaller than the angle of total reflection yc of a material, strictlyspeaking, yc is larger than f/2, i.e. 2yc4D/L. These assumptions canbe made without loss of generality because all fringe effects men-tioned above were observed with a L/D4500. To give some numbers,a L/D¼500 corresponds to f/2¼0.001 rad and yc (Al, Si)¼(0.0033, 0.0033)rad, yc (Cu, Fe)¼(0.0058, 0.0064)rad is always largerthan f/2, and this holds for nearly all materials under investigation.Therefore all rays belonging to (a) will be totally reflected becausef/2oyc.
To determine the reflected intensity at the detector, one has toapply the linear decreasing cross-section of the reflected beam if ybecomes smaller. If h is the beam height of the incident beam, theheight of the reflected ray as a function of y becomes h(y)¼d+tan(y). Depending on how far away the detector is behind thestep, the intensity is spread over a height given as B(y)¼[d+l] tan(y), B(y)n¼1�B(y), l is the distance to the detector plane(B, and Bn are in the detector plane, see Fig. 1). Therefore the totallyreflected intensity in B lacks in the transmission direction in Bn andthus in the region ‘‘B’’ an enhanced intensity and in ‘‘Bn ’’ a reducedone will be observed.
Secondly, we consider the rays coming from ‘‘below’’ the surface S
(cp. Fig. 1). Then they hit the step nearly perpendicular to theentrance surface. The refraction of these rays is negligible small(510�6 rad) and will not change their direction, different to therefraction at S, where the angle of incident is given by Zf/2.Due to Snellius law n1 sin(y1)¼n2 sin(y2), n1¼ index of refractionof the medium, n2¼1 (air), the rays are refracted to the surfacenormal and thus contribute to the upper part area ‘‘B’’. Thedeviation from the incident direction of these rays increases ifthe angle between the rays and S become very small (o0.11). Thedeviation becomes of the order of total reflection, but the largerthe refraction the smaller the contribution to ‘‘B’’, because thecorresponding beam height decreases to zero. The rays coming
from ‘‘below’’ the surface S, hit the S within the angular range of0ryrf/2, are refracted by S and contribute to area ‘‘B’’.
Finally, we calculate the diffracted part of the incident beam ifrays hitting nearly parallel the surface S. Concerning interferenceeffects the incident neutron beam must be considered as a set ofrays1 having all a certain lateral coherent width wcoh. Eachparticular ray consists of a superposition of coherent partialwaves that contribute to interference effects, seen as fringes orhalos in a radiograph or tomographic reconstruction. The coher-ent area of the wave front is given by the first Fresnel zone AFz,
AFZ ¼Rr
Rþrpl 1
sinðyFresnÞ� rpl- radiusAFZ �
ffiffiffiffiffiffiffiffirplp
ð1Þ
where R¼distance point source—object, r¼distance object–detector and y is the angle between the ray propagation vectorand the plane of observation (usually yFresn¼901). AFZ determinesthe coherent source area for any interference effects, the diameterfor conventional neutron imaging setups can be calculated to be1–4 mm. Depending on how far from the source a detail of asample under investigation is situated, one distinguishes betweenthe so-called ‘‘Fresnel-region’’ (radiusAFZodetail) and ‘‘Fraunho-fer-region’’ (radiusAFZ4detail). In the first case the image is morea projection of the detail, in the Fraunhofer-region the detail willbe imaged as the Fourier-Transform of the shape of the detail(�small angle scattering). The coherent width, however, is rathersmall compared to the incoherent rest of the beam (�10 mm vs.4 mm), but due to the shape of the step wedge (one part isperpendicular, one part parallel to the rays) the rays parallel ornearly parallel to S (7f/2, respectively) have long paths partiallyparallel, partially through S, respectively (see Fig. 1). Thus, theprojection of AFZ at S creates a steep phase gradient for imaging. Inorder to calculate the interference pattern caused by, e.g. a stepwedge, we used the Fresnel–Huygens’ principle as follows.
An object like a step wedge (Fig. 1) is assumed to beilluminated by a set of (parallel) rays, represented by set of planewaves that all have the same amplitude A0 �
Piexpf�ikrjðtÞg,
rj¼rj (t) is the distance of a point of the wedge to the detector.The step wedge itself is supposed to be homogeneous having auniform density r and an index of refraction n. A change of thephase Dj of a part of a wave with the wave vector k travelingthe length s through a material, which has the index of refractionn, compared to the part of the wave traveling in free space isgiven as
Dj¼ 2pl
sðn�1Þ ¼ �ksd; d¼l2Nbc
2p ð2Þ
where N is the number of atoms/volume of the sample, bc thecoherent scattering length and l the wavelength. Applying nowFresnel–Huygens’ principle, each coherent part of the wave whichhas transmitted the step wedge, given by W(x0,y,z), contributes tothe amplitude A¼A(u,v) in a detector pixel as
Aðu,vÞ ¼X
t
e�ik rt ðu,vÞþ
Rpath
Wðx0 ,y,zÞdðx0 ,y,zÞdDiracðy cosðyÞþ z sinðyÞ�tÞdydz
n oð3Þ
Here, rt(u,v) is the distance from the wedge and the detector point(u,v), d(x0,y,z) represents the two-dimensional function of theindex of refraction in the slice W(x¼x0,y,z) which scales the pathlength of the rays through the slice W(x0,y,z) (see Fig. 2), t is thevariable that indicates where (in which height) the wave passesthe wedge (cp. Fig. 3). The ‘‘wedge’’–coordinate system (x,y,z)(s. Fig. 1) coincides with the detector – coordinate system (u,v) asfollows: x//u, z//v, z//t, y99 detector plane¼(u,v)-plane.
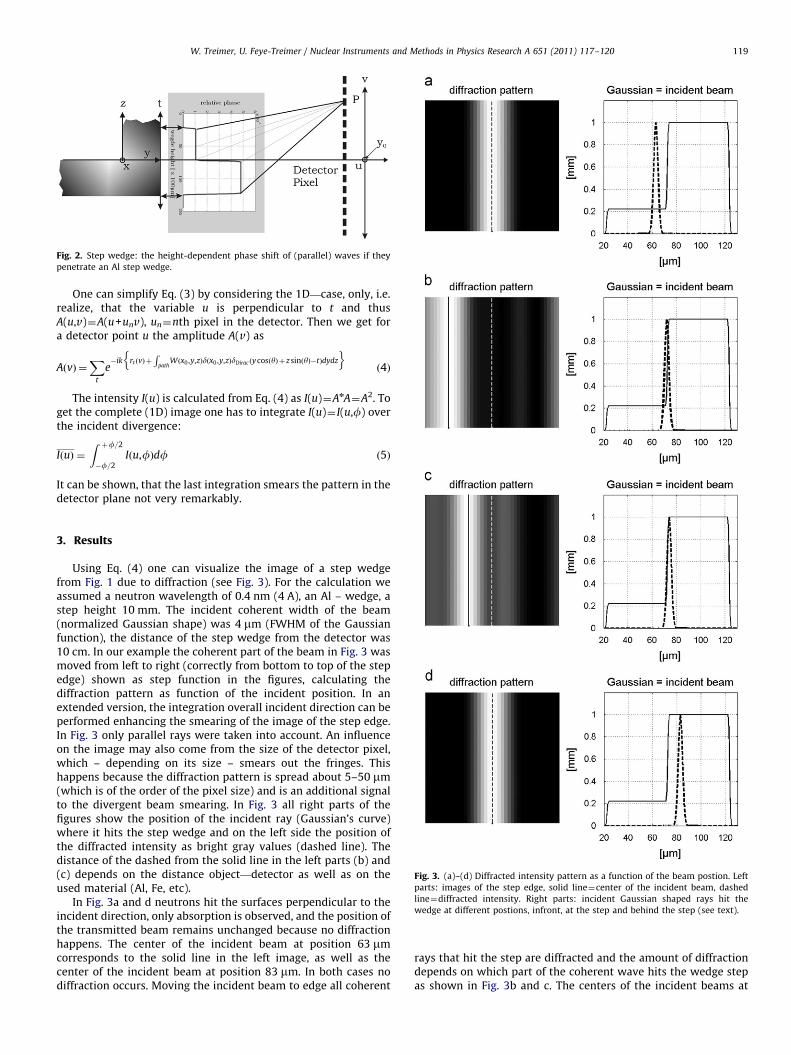
Fig. 2. Step wedge: the height-dependent phase shift of (parallel) waves if they
penetrate an Al step wedge.
W. Treimer, U. Feye-Treimer / Nuclear Instruments and Methods in Physics Research A 651 (2011) 117–120 119
One can simplify Eq. (3) by considering the 1D—case, only, i.e.realize, that the variable u is perpendicular to t and thusA(u,v)¼A(u+unv), un¼nth pixel in the detector. Then we get fora detector point u the amplitude A(v) as
AðvÞ ¼X
t
e�ik rt ðvÞþ
Rpath
Wðx0 ,y,zÞdðx0 ,y,zÞdDirac ðy cosðyÞþ z sinðyÞ�tÞdydz
n oð4Þ
The intensity I(u) is calculated from Eq. (4) as I(u)¼AnA¼A2. Toget the complete (1D) image one has to integrate I(u)¼ I(u,f) overthe incident divergence:
IðuÞ ¼
Z þf=2
�f=2Iðu,fÞdf ð5Þ
It can be shown, that the last integration smears the pattern in thedetector plane not very remarkably.
Fig. 3. (a)–(d) Diffracted intensity pattern as a function of the beam postion. Left
parts: images of the step edge, solid line¼center of the incident beam, dashed
line¼diffracted intensity. Right parts: incident Gaussian shaped rays hit the
wedge at different postions, infront, at the step and behind the step (see text).
3. Results
Using Eq. (4) one can visualize the image of a step wedgefrom Fig. 1 due to diffraction (see Fig. 3). For the calculation weassumed a neutron wavelength of 0.4 nm (4 A), an Al – wedge, astep height 10 mm. The incident coherent width of the beam(normalized Gaussian shape) was 4 mm (FWHM of the Gaussianfunction), the distance of the step wedge from the detector was10 cm. In our example the coherent part of the beam in Fig. 3 wasmoved from left to right (correctly from bottom to top of the stepedge) shown as step function in the figures, calculating thediffraction pattern as function of the incident position. In anextended version, the integration overall incident direction can beperformed enhancing the smearing of the image of the step edge.In Fig. 3 only parallel rays were taken into account. An influenceon the image may also come from the size of the detector pixel,which – depending on its size – smears out the fringes. Thishappens because the diffraction pattern is spread about 5–50 mm(which is of the order of the pixel size) and is an additional signalto the divergent beam smearing. In Fig. 3 all right parts of thefigures show the position of the incident ray (Gaussian’s curve)where it hits the step wedge and on the left side the position ofthe diffracted intensity as bright gray values (dashed line). Thedistance of the dashed from the solid line in the left parts (b) and(c) depends on the distance object—detector as well as on theused material (Al, Fe, etc).
In Fig. 3a and d neutrons hit the surfaces perpendicular to theincident direction, only absorption is observed, and the position ofthe transmitted beam remains unchanged because no diffractionhappens. The center of the incident beam at position 63 mmcorresponds to the solid line in the left image, as well as thecenter of the incident beam at position 83 mm. In both cases nodiffraction occurs. Moving the incident beam to edge all coherent
rays that hit the step are diffracted and the amount of diffractiondepends on which part of the coherent wave hits the wedge stepas shown in Fig. 3b and c. The centers of the incident beams at
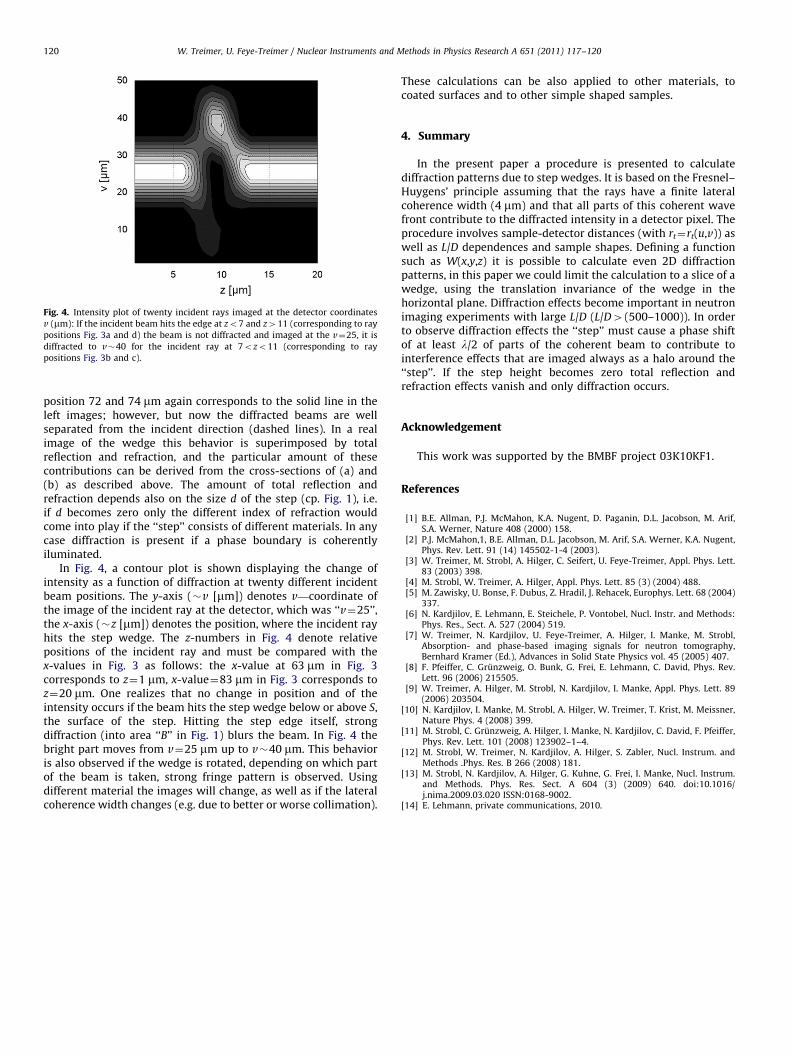
Fig. 4. Intensity plot of twenty incident rays imaged at the detector coordinates
v (mm): If the incident beam hits the edge at zo7 and z411 (corresponding to ray
positions Fig. 3a and d) the beam is not diffracted and imaged at the v¼25, it is
diffracted to v�40 for the incident ray at 7ozo11 (corresponding to ray
positions Fig. 3b and c).
W. Treimer, U. Feye-Treimer / Nuclear Instruments and Methods in Physics Research A 651 (2011) 117–120120
position 72 and 74 mm again corresponds to the solid line in theleft images; however, but now the diffracted beams are wellseparated from the incident direction (dashed lines). In a realimage of the wedge this behavior is superimposed by totalreflection and refraction, and the particular amount of thesecontributions can be derived from the cross-sections of (a) and(b) as described above. The amount of total reflection andrefraction depends also on the size d of the step (cp. Fig. 1), i.e.if d becomes zero only the different index of refraction wouldcome into play if the ‘‘step’’ consists of different materials. In anycase diffraction is present if a phase boundary is coherentlyiluminated.
In Fig. 4, a contour plot is shown displaying the change ofintensity as a function of diffraction at twenty different incidentbeam positions. The y-axis (�v [mm]) denotes v—coordinate ofthe image of the incident ray at the detector, which was ‘‘v¼25’’,the x-axis (�z [mm]) denotes the position, where the incident rayhits the step wedge. The z-numbers in Fig. 4 denote relativepositions of the incident ray and must be compared with thex-values in Fig. 3 as follows: the x-value at 63 mm in Fig. 3corresponds to z¼1 mm, x-value¼83 mm in Fig. 3 corresponds toz¼20 mm. One realizes that no change in position and of theintensity occurs if the beam hits the step wedge below or above S,the surface of the step. Hitting the step edge itself, strongdiffraction (into area ‘‘B’’ in Fig. 1) blurs the beam. In Fig. 4 thebright part moves from v¼25 mm up to v�40 mm. This behavioris also observed if the wedge is rotated, depending on which partof the beam is taken, strong fringe pattern is observed. Usingdifferent material the images will change, as well as if the lateralcoherence width changes (e.g. due to better or worse collimation).
These calculations can be also applied to other materials, tocoated surfaces and to other simple shaped samples.
4. Summary
In the present paper a procedure is presented to calculatediffraction patterns due to step wedges. It is based on the Fresnel–Huygens’ principle assuming that the rays have a finite lateralcoherence width (4 mm) and that all parts of this coherent wavefront contribute to the diffracted intensity in a detector pixel. Theprocedure involves sample-detector distances (with rt¼rt(u,v)) aswell as L/D dependences and sample shapes. Defining a functionsuch as W(x,y,z) it is possible to calculate even 2D diffractionpatterns, in this paper we could limit the calculation to a slice of awedge, using the translation invariance of the wedge in thehorizontal plane. Diffraction effects become important in neutronimaging experiments with large L/D (L/D4(500–1000)). In orderto observe diffraction effects the ‘‘step’’ must cause a phase shiftof at least l/2 of parts of the coherent beam to contribute tointerference effects that are imaged always as a halo around the‘‘step’’. If the step height becomes zero total reflection andrefraction effects vanish and only diffraction occurs.
Acknowledgement
This work was supported by the BMBF project 03K10KF1.
References
[1] B.E. Allman, P.J. McMahon, K.A. Nugent, D. Paganin, D.L. Jacobson, M. Arif,S.A. Werner, Nature 408 (2000) 158.
[2] P.J. McMahon,1, B.E. Allman, D.L. Jacobson, M. Arif, S.A. Werner, K.A. Nugent,Phys. Rev. Lett. 91 (14) 145502-1-4 (2003).
[3] W. Treimer, M. Strobl, A. Hilger, C. Seifert, U. Feye-Treimer, Appl. Phys. Lett.83 (2003) 398.
[4] M. Strobl, W. Treimer, A. Hilger, Appl. Phys. Lett. 85 (3) (2004) 488.[5] M. Zawisky, U. Bonse, F. Dubus, Z. Hradil, J. Rehacek, Europhys. Lett. 68 (2004)
337.[6] N. Kardjilov, E. Lehmann, E. Steichele, P. Vontobel, Nucl. Instr. and Methods:
Phys. Res., Sect. A. 527 (2004) 519.[7] W. Treimer, N. Kardjilov, U. Feye-Treimer, A. Hilger, I. Manke, M. Strobl,
Absorption- and phase-based imaging signals for neutron tomography,Bernhard Kramer (Ed.), Advances in Solid State Physics vol. 45 (2005) 407.
[8] F. Pfeiffer, C. Grunzweig, O. Bunk, G. Frei, E. Lehmann, C. David, Phys. Rev.Lett. 96 (2006) 215505.
[9] W. Treimer, A. Hilger, M. Strobl, N. Kardjilov, I. Manke, Appl. Phys. Lett. 89(2006) 203504.
[10] N. Kardjilov, I. Manke, M. Strobl, A. Hilger, W. Treimer, T. Krist, M. Meissner,Nature Phys. 4 (2008) 399.
[11] M. Strobl, C. Grunzweig, A. Hilger, I. Manke, N. Kardjilov, C. David, F. Pfeiffer,Phys. Rev. Lett. 101 (2008) 123902–1–4.
[12] M. Strobl, W. Treimer, N. Kardjilov, A. Hilger, S. Zabler, Nucl. Instrum. andMethods .Phys. Res. B 266 (2008) 181.
[13] M. Strobl, N. Kardjilov, A. Hilger, G. Kuhne, G. Frei, I. Manke, Nucl. Instrum.and Methods. Phys. Res. Sect. A 604 (3) (2009) 640. doi:10.1016/j.nima.2009.03.020 ISSN:0168-9002.
[14] E. Lehmann, private communications, 2010.