omnicare annual reports 2005
TRANSCRIPT
Omnicom
A N N U A L R E P O R T
2005
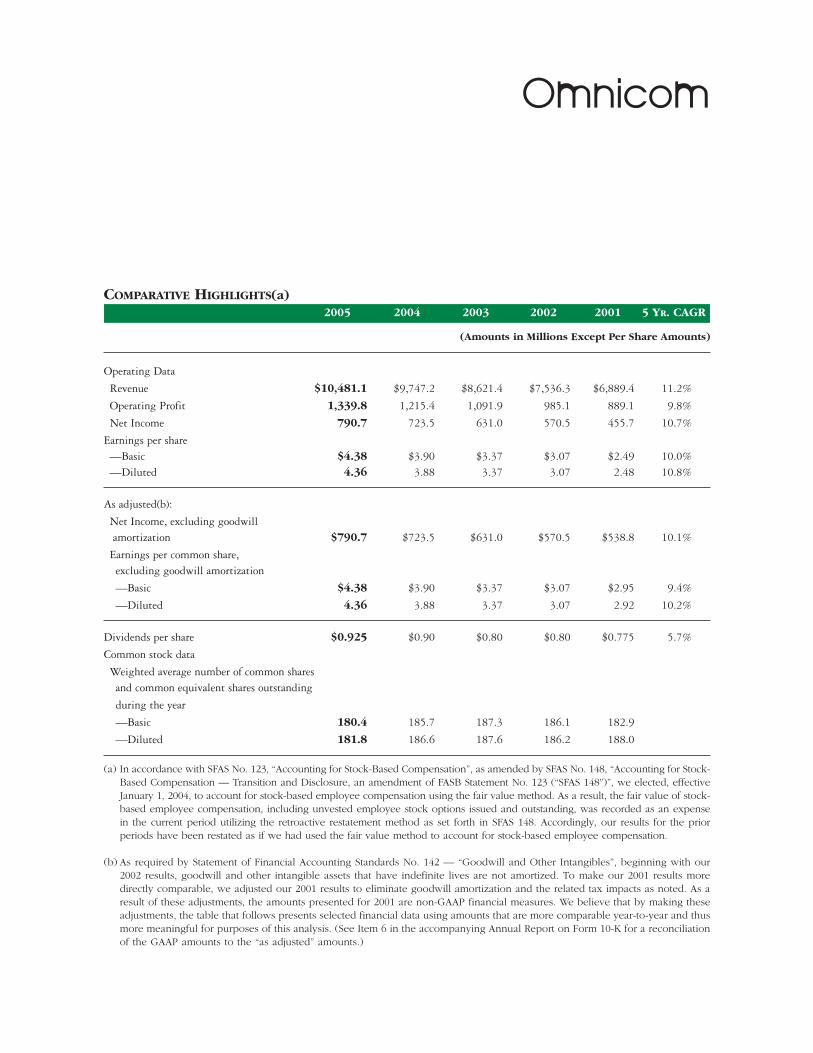
2005 2004 2003 2002 2001 5 YR. CAGR
(Amounts in Millions Except Per Share Amounts)
Operating Data
Revenue $10,481.1 $9,747.2 $8,621.4 $7,536.3 $6,889.4 11.2%
Operating Profit 1,339.8 1,215.4 1,091.9 985.1 889.1 9.8%
Net Income 790.7 723.5 631.0 570.5 455.7 10.7%
Earnings per share—Basic $4.38 $3.90 $3.37 $3.07 $2.49 10.0%—Diluted 4.36 3.88 3.37 3.07 2.48 10.8%
As adjusted(b):
Net Income, excluding goodwill amortization $790.7 $723.5 $631.0 $570.5 $538.8 10.1%
Earnings per common share,excluding goodwill amortization
—Basic $4.38 $3.90 $3.37 $3.07 $2.95 9.4%
—Diluted 4.36 3.88 3.37 3.07 2.92 10.2%
Dividends per share $0.925 $0.90 $0.80 $0.80 $0.775 5.7%
Common stock data
Weighted average number of common sharesand common equivalent shares outstanding
during the year
—Basic 180.4 185.7 187.3 186.1 182.9
—Diluted 181.8 186.6 187.6 186.2 188.0
(a) In accordance with SFAS No. 123, “Accounting for Stock-Based Compensation”, as amended by SFAS No. 148, “Accounting for Stock-Based Compensation –– Transition and Disclosure, an amendment of FASB Statement No. 123 (“SFAS 148”)”, we elected, effectiveJanuary 1, 2004, to account for stock-based employee compensation using the fair value method. As a result, the fair value of stock-based employee compensation, including unvested employee stock options issued and outstanding, was recorded as an expensein the current period utilizing the retroactive restatement method as set forth in SFAS 148. Accordingly, our results for the priorperiods have been restated as if we had used the fair value method to account for stock-based employee compensation.
(b) As required by Statement of Financial Accounting Standards No. 142 — “Goodwill and Other Intangibles”, beginning with our2002 results, goodwill and other intangible assets that have indefinite lives are not amortized. To make our 2001 results moredirectly comparable, we adjusted our 2001 results to eliminate goodwill amortization and the related tax impacts as noted. As aresult of these adjustments, the amounts presented for 2001 are non-GAAP financial measures. We believe that by making theseadjustments, the table that follows presents selected financial data using amounts that are more comparable year-to-year and thusmore meaningful for purposes of this analysis. (See Item 6 in the accompanying Annual Report on Form 10-K for a reconciliationof the GAAP amounts to the “as adjusted” amounts.)
Omnicom
COMPARATIVE HIGHLIGHTS(a)
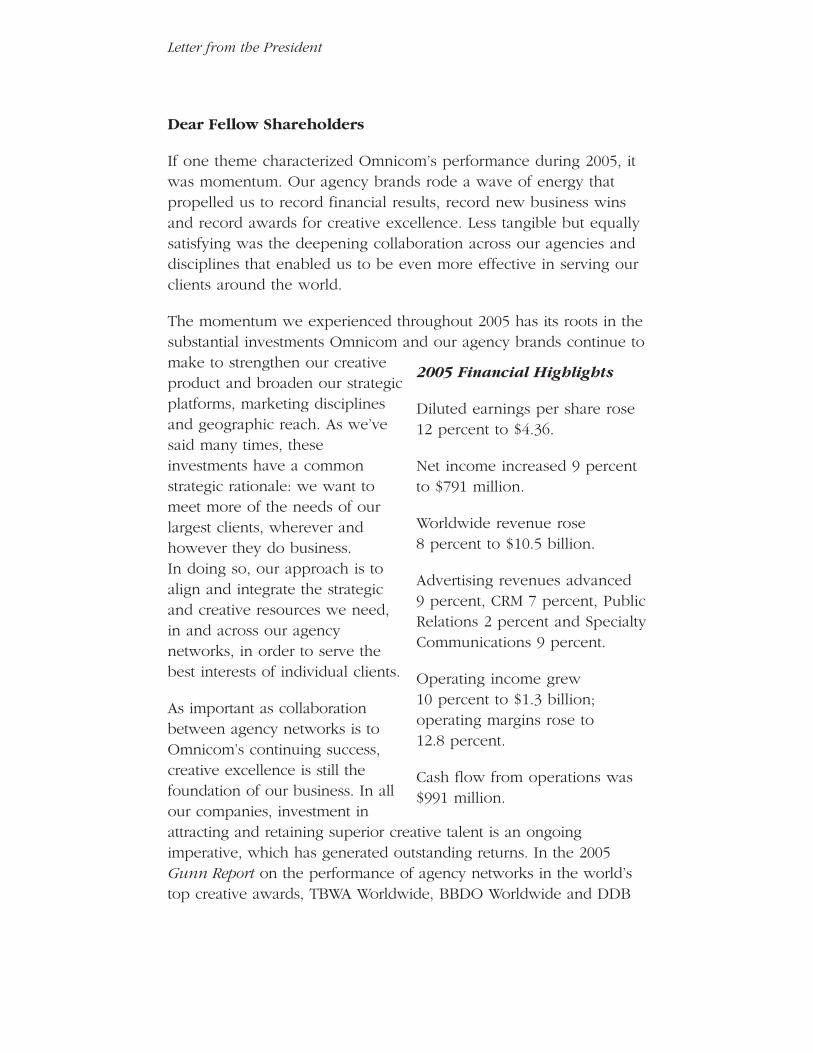
Dear Fellow Shareholders
If one theme characterized Omnicom’s performance during 2005, itwas momentum. Our agency brands rode a wave of energy thatpropelled us to record financial results, record new business winsand record awards for creative excellence. Less tangible but equallysatisfying was the deepening collaboration across our agencies anddisciplines that enabled us to be even more effective in serving ourclients around the world.
The momentum we experienced throughout 2005 has its roots in thesubstantial investments Omnicom and our agency brands continue tomake to strengthen our creativeproduct and broaden our strategicplatforms, marketing disciplinesand geographic reach. As we’vesaid many times, theseinvestments have a commonstrategic rationale: we want tomeet more of the needs of ourlargest clients, wherever andhowever they do business.In doing so, our approach is toalign and integrate the strategicand creative resources we need,in and across our agencynetworks, in order to serve thebest interests of individual clients.
As important as collaborationbetween agency networks is toOmnicom’s continuing success,creative excellence is still thefoundation of our business. In allour companies, investment inattracting and retaining superior creative talent is an ongoingimperative, which has generated outstanding returns. In the 2005Gunn Report on the performance of agency networks in the world’stop creative awards, TBWA Worldwide, BBDO Worldwide and DDB
Letter from the President
2005 Financial Highlights
Diluted earnings per share rose12 percent to $4.36.
Net income increased 9 percentto $791 million.
Worldwide revenue rose8 percent to $10.5 billion.
Advertising revenues advanced9 percent, CRM 7 percent, PublicRelations 2 percent and SpecialtyCommunications 9 percent.
Operating income grew 10 percent to $1.3 billion;operating margins rose to12.8 percent.
Cash flow from operations was$991 million.
Worldwide took first, second and third place, respectively, for thesecond consecutive year. OMD Worldwide had a terrific year,garnering the Gunn Report’s Most Creative Media Agency andAdweek’s Global Media Agency of the Year awards. And Fleishman-Hillard, one of our global public relations networks, was named 2005International Agency of the Year.
It is important to reiterate that we have invested substantially toachieve balance and diversity across Omnicom’s networks. Our mixof top agencies in each marketing discipline across all majormarkets has brought us to new heights of competitive success innew business. In 2005, our agencies demonstrated just how valuablecollaboration and integration between agencies can be in deliveringand winning client business as Omnicom posted both recordrevenues and record new business wins during the year. Moreover,the willingness of our agencies and networks to work together, andthe quality of our creative product across networks, wereinstrumental in our ability to retain within the Omnicom familyseveral accounts that may otherwise have been lost. We certainlyview this as confirmation of our investment in creative excellence.But it also readily demonstrates the ability of our broad mix ofassets to add stability to the company’s financial performance.
Integration now driving the businessOur commitment to fully integrated agency networks is alsocontributing to the revenue line. Omnicom was, for example, an earlyinvestor in interactive media. Our strategy from the beginning wasnot simply to have stand-alone Internet companies that focused onlyon that medium. Our goal was to learn client needs for ourdeveloping assets and ultimately embed them into Omnicom’s agencynetworks. We completed the assimilation of our major interactivebusinesses during 2005 when Organic joined BBDO Worldwide andAgency.com took a seat at the table with TBWA Worldwide. Tribal, anintegral part of DDB, continued to demonstrate the depth andbreadth of its creative quality, winning Adweek’s Global InteractiveAgency of the Year for 2005.
Our interactive businesses, like our media businesses, are nowessential components of nearly every new business pitch or client
Letter from the President
assignment. And for a very good reason: the fragmentation ofcommunication channels requires that our agencies be moreinnovative and proactive in allocating client spending. Over the pastyear, we’ve achieved a new level of integration prompted by anurgency to look beyond the conventional to whatever media ourclients need to drive deeper relationships with their customers.Traditional media campaigns, while still at the center of mostcommunication programs, have increasingly become only one part ofan integrated marketing effort that focuses more on the “big idea” forcontent and engagement than it does on specific media. Consumersnow have to be reached on cell phones, the Internet and other digitalchannels, as well as through traditional media, with messaging thatcaptures their attention and engages their interest. Given thechallenges and opportunities inherent in each medium, providing aneffective, consistent message across media and markets demands theskills of a truly multidisciplinary team. That is what Omnicom’s virtualnetworks are ideally designed to create, and which they did soeffectively during 2005.
Serving clients betterA central tenet of Omnicom’s competitive strategy is to continuallybroaden our business with our largest clients through a balancedmix of top agencies operating in all marketing disciplines and allkey markets.
We took important actions during 2005 in the ongoing roll-out of thisstrategy for Omnicom’s media assets. We created a global managementstructure for Omnicom Media Group to provide strategic oversight forboth our major brands and specialized assets. We subsequently begana major global expansion of our PHD media brand. PHD has longbeen a leading and often pioneering agency in the United Kingdomand North America, and along with OMD, this evolution is intended toprovide our multinational clients with a choice of innovative mediabrands in all key markets. PHD will operate globally, with separateoffices and dedicated client service teams across Asia-Pacific,continental Europe, the Middle East and Africa, in addition to itsexisting offices in North America and the UK. Both PHD and OMDwill continue to operate independently, providing proprietary research,
Letter from the President
planning and buying capabilities. Omnicom Media Group will focuson providing OMD and PHD clients with the benefits of the full mediaresources needed to harness the buying scale of Omnicom for medianegotiations.
We have added significantly to Omnicom’s management capabilitiesin the Asia-Pacific region. The appointment of Michael Birkin asChief Executive of Omnicom Asia-Pacific and Vice-Chairman ofOmnicom Group will ensure that we are developing and aligningour resources to best serve our clients’ rapidly changing needs inadvertising and marketing services in that part of the world. Whileeach of our agency networks has a specific strategy for growth inthe Asia-Pacific region, we believe an Omnicom perspective in thearea will be very useful in coordinating strategies and investmentswith our networks. The potential for serving more of the needs ofour multinational clients aligns perfectly with our competitive strategy.
That said, we intend to grow prudently as we find new assets thatfit our strategic and quality requirements, so that our networks canexpand their offering to clients. In March 2006, we took anotherstep in our strategic expansion in China with the purchase of amajority ownership interest in Unisono Fieldmarketing International.The company, which provides cost-effective channel solutions in25 major cities, will add substantial scale and reach for Omnicomclients wishing to penetrate China’s rapidly growing consumergoods and services markets.
The passing of a leader and a friendOn a very sad note, our colleague Ken Kaess passed away in lateMarch 2006 after a brave battle with cancer. Ken was the drivingforce behind the success of DDB Worldwide over the past fiveyears, and we will miss him in that role. But we feel an equalloss of his friendship and enthusiastic spirit. Bob Scarpelli, DDB’sChief Creative Officer, has assumed the additional post ofChairman of DDB Worldwide. And Chuck Brymer, Interbrand GroupChairman and Chief Executive, now becomes DDB Worldwide’snew President and CEO. They inherit from Ken one of the world’sgreat agency networks, and we’re confident that they will continue
Letter from the President
the dynamic leadership that was such a prominent feature of histenure at DDB.
The view aheadWe entered 2005 with a clear focus on profitable growth andfinished the year with record revenues, record new business winsand continued improvement in the Company’s operating results.Building on that record will depend on a superb creative productdelivered in innovative and collaborative ways. That is exactly whatOmnicom people did so well in 2005, and which I have everyconfidence they will continue to do superbly in the future.
As we approach Omnicom’s 20th anniversary, our strategic priorityremains the deepening of our relationships with our largest clients.We expect acquisition activity to pick up during 2006 as we seeknew skills or geographic reach that can serve more of our clients’needs more effectively. Asia will figure more prominently in ourinvestment strategy, and we anticipate that our media andinteractive strategies will not only evolve but also integrate morecomprehensively into everything our agencies do.
While we expect growth from existing clients, new business andacquisitions in the coming year, we will continue to depend on theengines of Omnicom’s growth: client-centered networks, exceptionalcreative talent, balance and diversity across disciplines and globalcapability in all major markets, all of which have been the perennialdrivers of revenue. We expect that momentum to continuethroughout 2006 as we seek new ways to use these capabilities toserve our clients more effectively.
Sincerely,
John D. WrenPresident & Chief Executive OfficerApril 2006
Letter from the President
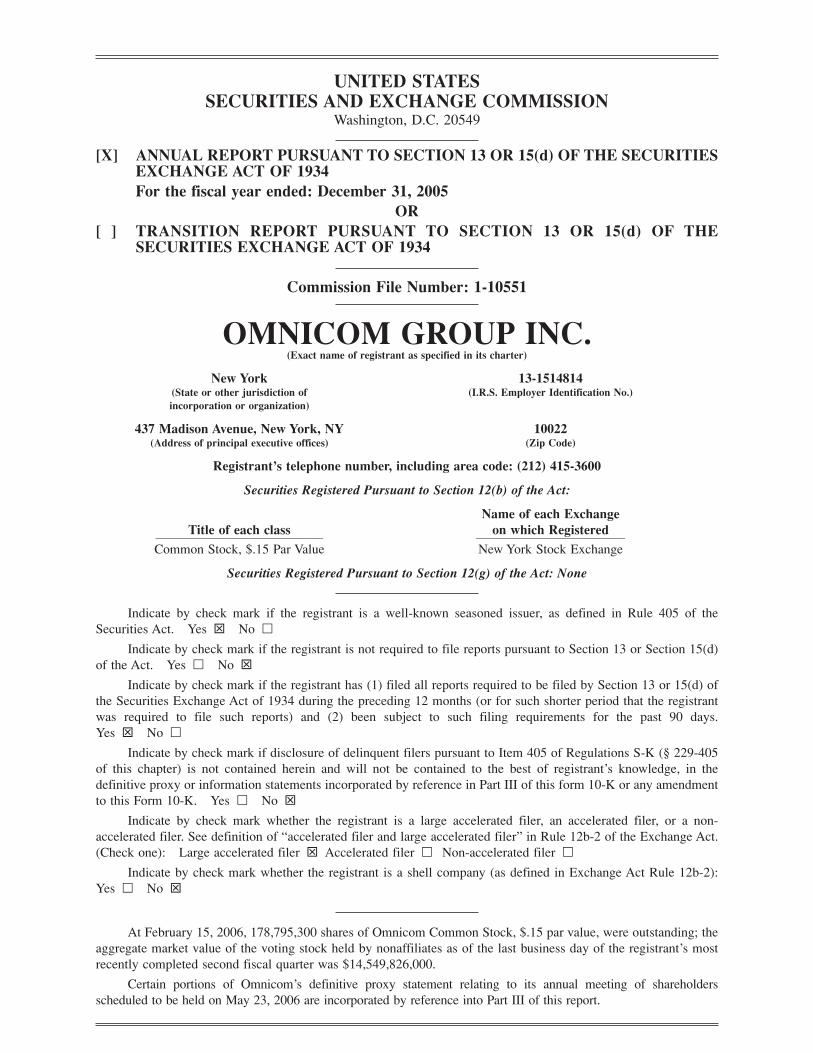
UNITED STATESSECURITIES AND EXCHANGE COMMISSION
Washington, D.C. 20549
[X] ANNUAL REPORT PURSUANT TO SECTION 13 OR 15(d) OF THE SECURITIESEXCHANGE ACT OF 1934For the fiscal year ended: December 31, 2005
OR[ ] TRANSITION REPORT PURSUANT TO SECTION 13 OR 15(d) OF THE
SECURITIES EXCHANGE ACT OF 1934
Commission File Number: 1-10551
OMNICOM GROUP INC.(Exact name of registrant as specified in its charter)
New York 13-1514814(State or other jurisdiction of (I.R.S. Employer Identification No.)incorporation or organization)
437 Madison Avenue, New York, NY 10022(Address of principal executive offices) (Zip Code)
Registrant’s telephone number, including area code: (212) 415-3600
Securities Registered Pursuant to Section 12(b) of the Act:
Name of each ExchangeTitle of each class on which Registered_______________________________________________________________ ________________________________________________________
Common Stock, $.15 Par Value New York Stock Exchange
Securities Registered Pursuant to Section 12(g) of the Act: None
Indicate by check mark if the registrant is a well-known seasoned issuer, as defined in Rule 405 of theSecurities Act. Yes � No �
Indicate by check mark if the registrant is not required to file reports pursuant to Section 13 or Section 15(d)of the Act. Yes � No �
Indicate by check mark if the registrant has (1) filed all reports required to be filed by Section 13 or 15(d) ofthe Securities Exchange Act of 1934 during the preceding 12 months (or for such shorter period that the registrantwas required to file such reports) and (2) been subject to such filing requirements for the past 90 days.Yes � No �
Indicate by check mark if disclosure of delinquent filers pursuant to Item 405 of Regulations S-K (§ 229-405of this chapter) is not contained herein and will not be contained to the best of registrant’s knowledge, in thedefinitive proxy or information statements incorporated by reference in Part III of this form 10-K or any amendmentto this Form 10-K. Yes � No �
Indicate by check mark whether the registrant is a large accelerated filer, an accelerated filer, or a non-accelerated filer. See definition of “accelerated filer and large accelerated filer” in Rule 12b-2 of the Exchange Act.(Check one): Large accelerated filer � Accelerated filer � Non-accelerated filer �
Indicate by check mark whether the registrant is a shell company (as defined in Exchange Act Rule 12b-2):Yes � No �
At February 15, 2006, 178,795,300 shares of Omnicom Common Stock, $.15 par value, were outstanding; theaggregate market value of the voting stock held by nonaffiliates as of the last business day of the registrant’s mostrecently completed second fiscal quarter was $14,549,826,000.
Certain portions of Omnicom’s definitive proxy statement relating to its annual meeting of shareholdersscheduled to be held on May 23, 2006 are incorporated by reference into Part III of this report.
OMNICOM GROUP INC.
ANNUAL REPORT ON FORM 10-K FORTHE YEAR ENDED DECEMBER 31, 2005
TABLE OF CONTENTSPage____
PART I
Item 1. Business .......................................................................................................................... 1Item 1A. Risk Factors.................................................................................................................... 3Item 1B. Unresolved Staff Comments .......................................................................................... 5Item 2. Properties ........................................................................................................................ 5Item 3. Legal Proceedings .......................................................................................................... 5Item 4. Submission of Matters to a Vote of Security Holders .................................................. 6
PART II
Item 5. Market for Registrant’s Common Equity, Related Stockholder Matters andIssuer Purchases of Equity Securities .................................................................. 7
Item 6. Selected Financial Data.................................................................................................. 7Item 7. Management’s Discussion and Analysis of Financial Condition
and Results of Operations .................................................................................... 10Item 7A. Quantitative and Qualitative Disclosures Regarding Market Risk................................ 26Item 8. Financial Statements and Supplementary Data ............................................................ 27Item 9. Changes in and Disagreements with Accountants on Accounting and
Financial Disclosure .............................................................................................. 27Item 9A. Controls and Procedures ................................................................................................ 27Item 9B. Other Information .......................................................................................................... 28
PART III
Item 10. Directors and Executive Officers of the Registrant ...................................................... *Item 11. Executive Compensation ................................................................................................ *Item 12. Security Ownership of Certain Beneficial Owners and Management .......................... *Item 13. Certain Relationships and Related Transactions .......................................................... *Item 14. Principal Accounting Fees and Services........................................................................ *
PART IV
Item 15. Exhibits, Financial Statement Schedules and Reports on Form 8-K............................ 29Index to Financial Statements........................................................................................ 29Index to Financial Statements Schedules ...................................................................... 29Exhibits .......................................................................................................................... 29
Signatures .............................................................................................................................................. 32Management Report on Internal Control Over Financial Reporting .................................................. F-1Report of Independent Registered Public Accounting Firm................................................................ F-2Report of Independent Registered Public Accounting Firm................................................................ F-3Consolidated Financial Statements ...................................................................................................... F-4Notes to Consolidated Financial Statements........................................................................................ F-8
* The information regarding Executive Officers of the Registrant is included in Part I, Item 1, “Business”.Additional information called for by Items 10, 11, 12, 13 and 14 to the extent not included in this document,is incorporated herein by reference to the information to be included under the captions “CorporateGovernance,” “Certain Transactions,” “Executive Compensation” and “Stock Ownership” in Omnicom’sdefinitive proxy statement, which is expected to be filed by April 21, 2006.
FORWARD LOOKING STATEMENTS
Certain of the statements in this annual report on Form 10-K constitute forward-looking statementswithin the meaning of the Private Securities Litigation Reform Act of 1995. In addition, from time to time, weor our representatives have made or may make forward-looking statements, orally or in writing. Thesestatements relate to future events or future financial performance and involve known and unknown risks andother factors that may cause our actual or our industry’s results, levels of activity or achievement to bematerially different from those expressed or implied by any forward-looking statements. These risks anduncertainties, including those resulting from specific factors identified under the captions “Risk Factors” and“Management’s Discussion and Analysis of Financial Condition and Results of Operations,” include, but arenot limited to, our future financial condition and results of operations, changes in general economic conditions,competitive factors, changes in client communication requirements, the hiring and retention of humanresources and our international operations, which are subject to the risks of currency fluctuations and exchangecontrols. In some cases, forward-looking statements can be identified by terminology such as “may,” “will,”“could,” “would,” “should,” “expect,” “plan,” “anticipate,” “intend,” “believe,” “estimate,” “predict,” “potential”or “continue” or the negative of those terms or other comparable terminology. These statements are presentexpectations. Actual events or results may differ materially. We undertake no obligation to update or revise anyforward-looking statement.
AVAILABLE INFORMATION
Our internet address is www.omnicomgroup.com. At this site we make available, free of charge, ourannual report on Form 10-K, quarterly reports on Form 10-Q, current reports on Form 8-K and anyamendments to those reports, as soon as reasonably practicable after we electronically file or furnish suchmaterial with or to the SEC. Our SEC reports can be accessed through the investor relations section of ourwebsite. The information found on our website is not part of this or any other report we file with or furnish tothe SEC. Any document that we file with the SEC may also be read and copied at the SEC’s Public ReferenceRoom located at Room 1580, 100 F Street, N.E., Washington, DC 20549. Please call the SEC at 1-800-SEC-0330 for further information on the public reference room. Our filings are also available from the SEC’swebsite at http://www.sec.gov and at the offices of the New York Stock Exchange.
PART I
Introduction
This report is both our 2005 annual report to shareholders and our 2005 annual report on Form 10-Krequired under federal securities laws.
We are a strategic holding company. We provide professional services to clients through multiple agenciesoperating in all major markets around the world. Our companies provide advertising, marketing and corporatecommunications services. For simplicity, however, the terms “Omnicom,” “we,” “our” and “us” each refer toOmnicom Group Inc. and our subsidiaries unless the context indicates otherwise.
1. Business
Our Business: As a strategic holding company, we are one of the largest advertising, marketing andcorporate communications companies in the world. Omnicom was formed as a corporation in 1986 by themerger of several leading advertising, marketing and corporate communications networks. Around that time andthrough the 1990s, the proliferation of media channels, especially print and cable television, and more recentlythe internet, effectively fragmented mass audiences. This development made it increasingly more difficult formarketers to reach their target audiences in a cost-effective way, and they turned to marketing service providerssuch as Omnicom for a customized mix of advertising and marketing communications services that would makebest use of their total marketing expenditures.
Our agencies provide an extensive range of services which we group into four fundamental disciplines:traditional media advertising; customer relationship management (“CRM”); public relations; and specialtycommunications. The services included in these categories are:
1
advertisingbrand consultancycrisis communicationscustom publishingdatabase managementdigital and interactive marketingdirect marketingdirectory advertisingentertainment marketingenvironmental designexperiential marketingfield marketingfinancial / corporate business-to-business advertisinggraphic artshealthcare communicationsinstore designinvestor relations
marketing researchmedia planning and buyingmobile marketing servicesmulti-cultural marketingnon-profit marketingorganizational communicationspackage designproduct placementpromotional marketingpublic affairspublic relationsreal estate advertising and marketingrecruitment communicationsreputation consultingretail marketingsearch engine marketingsports and event marketing
Although the medium used to reach a given client’s target audience may be different across each of thesedisciplines, the marketing message is developed and delivered in the same way by providing client-specificconsulting services.
Omnicom’s business model was built and evolves around its clients. While our companies operate underdifferent names and frame their ideas in different disciplines, we organize our services around our clients. Thefundamental premise of our business is to structure our business offering and allocate our resources based on thespecific requirements of our clients. As clients increase their demands for marketing effectiveness and efficiency,they have tended to consolidate their business with larger, multi-disciplinary agencies or integrated groups ofagencies. Accordingly, our business model demands that multiple agencies within Omnicom collaborate informal and informal virtual networks that cut across internal organizational structures to execute against ourclients’ specific marketing requirements. We believe that this organizational philosophy, and our ability toexecute on it, helps to differentiate us from our competition.
2
Our agency networks and our virtual networks, provide us with the ability to integrate services across alldisciplines. This means that the delivery of these services can and does take place across agencies, networks andgeographic regions simultaneously.
Longer term, we believe that our virtual network strategy facilitates better integration of services requiredby the demands of the marketplace for advertising and marketing communications services. Our over-archingstrategy for the business is to continue to use our virtual networks to grow our business relationships with ourclients.
The various components of our business and material factors that affected us in 2005 are discussed in Item7, “Management’s Discussion and Analysis of Financial Condition and Results of Operations” (“MD&A”) ofthis report. None of our acquisitions in 2005, 2004 or 2003 were material to our consolidated financial positionor results of operations. For information concerning our acquisitions, see Note 2 to our consolidated financialstatements.
Geographic Regions and Segments: Our total consolidated revenue is about evenly divided between U.S.and non-U.S. operations. For financial information concerning domestic and foreign operations and segmentreporting, see our MD&A and Note 5 to our consolidated financial statements.
Our Clients: Consistent with the fundamentals of our business strategy, our agencies serve similar clients,in similar industries, and in many cases the same clients, across a variety of geographic regions and locations.Our clients participate in virtually all industry sectors of the global economy. Furthermore, in many cases, ouragencies or networks serve different product groups within the same clients served by other of Omnicom’sagencies or networks. For example, our largest client was served by more than 100 of our agencies in 2005 andrepresented 4.0% of our 2005 consolidated revenue. No other client accounted for more than 2.9% of ourconsolidated 2005 revenue. Each of our top 100 clients were served, on average, by 40 of our agencies in 2005and represented 44.6% of our 2005 consolidated revenue.
Our Employees: We employed approximately 62,000 people at December 31, 2005. We are not party toany significant collective bargaining agreements. The skill-sets of our workforce across our agencies and withineach discipline are similar. Common to all is the ability to understand a client’s brand, its selling proposition andthe ability to develop a unique message to communicate the value of the brand to the client’s target audience.Recognizing the importance of this core competency, we have established training and education programs forour service professionals around this competency. See our MD&A for a discussion of the effect of salary andrelated costs on our historical results of operations.
Executive Officers of the Registrant: Our executive officers as of February 15, 2006 are:
Name Position Age__________ ______________ _______
Bruce Crawford . . . . . . . . . . Chairman 77John D. Wren . . . . . . . . . . . . President and Chief Executive Officer 53Randall J. Weisenburger . . . . Executive Vice President and Chief Financial Officer 47Philip J. Angelastro . . . . . . . Senior Vice President of Finance and Controller 41Michael Birkin . . . . . . . . . . . Vice Chairman 47Jean-Marie Dru . . . . . . . . . . President and Chief Executive Officer of TBWA Worldwide 59Thomas L. Harrison . . . . . . . Chairman and Chief Executive Officer of Diversified Agency Services 58Kenneth R. Kaess, Jr. . . . . . . President and Chief Executive Officer of DDB Worldwide 51Peter Mead . . . . . . . . . . . . . . Vice Chairman 66Michael J. O’Brien . . . . . . . . Senior Vice President, General Counsel and Secretary 44Andrew Robertson . . . . . . . . President and Chief Executive Officer of BBDO Worldwide 45Daryl D. Simm . . . . . . . . . . . Chairman and Chief Executive Officer of Omnicom Media Group 44
All of the executive officers have held their present positions at Omnicom for at least five years except asspecified below.
Philip Angelastro was promoted to Senior Vice President of Finance in January 2002 and was appointedController of Omnicom Group Inc. on February 1, 1999. Mr. Angelastro joined the Company in June 1997 asVice President of Finance of Diversified Agency Services (“DAS”) after being a Partner at Coopers & LybrandLLP.
Michael Birkin was appointed Vice Chairman, as well as President and CEO of Omnicom Asia-Pacific, onMarch 1, 2005. From 1999 to 2005, he has served as Worldwide President of DAS. Mr. Birkin previously servedas International President of DAS from 1997 to 1999 and European Managing Director of DAS from 1995 to1997.
Jean-Marie Dru was appointed President and Chief Executive Officer of TBWA Worldwide in March2001. He had previously been President International of TBWA Worldwide. Mr. Dru was co-founder andChairman of BDDP Group, which merged with TBWA in 1998.
Michael O’Brien joined Omnicom Group Inc. in November 2003 and was appointed Senior VicePresident, General Counsel and Secretary in December 2003. Prior to that, he was a partner in the law firm ofGoodwin Procter LLP (since April 2002). Prior to that, he was a partner in the law firm of O’Sullivan LLP.
Andrew Robertson was named Chief Executive Officer of BBDO Worldwide in May of 2004, having beenmade President of BBDO Worldwide in 2002. In 2001, Mr. Robertson was President and CEO of BBDO NorthAmerica, and was subsequently elected to the Worldwide Board of Directors of BBDO. He joined BBDO in1995.
Daryl Simm was named Chairman and Chief Executive Officer of the newly formed Omnicom MediaGroup in November 2005. Mr. Simm previously held the position of President and CEO of OMG.
Additional information about our directors and executive officers appears under the captions “CorporateGovernance,” “Certain Transactions,” “Election of Directors,” “Executive Compensation” and “StockOwnership” in our definitive proxy statement, which is expected to be filed by April 21, 2006.
1A. Risk Factors
Companies periodically review and change their advertising, marketing and corporate communicationsservices business models and relationships. If we are unable to remain competitive or retain key clients, ourbusiness and financial results may be materially adversely affected.
The businesses in which we participate are highly competitive. Key competitive considerations for keepingexisting business and winning new business include our ability to develop creative solutions that meet clientneeds, the quality and effectiveness of the services we offer, and our ability to efficiently serve clients,particularly large international clients, on a broad geographic basis. While many of our client relationships arelong-standing, companies put their advertising, marketing and corporate communications services business upfor competitive review from time to time. We have won and lost accounts in the past as a result of these reviews.To the extent that we are not able to remain competitive, our revenue may be adversely affected, which couldthen affect our results of operations and financial condition.
Government regulations and consumer advocates may limit the scope of the content of our services, whichcould affect our ability to meet our clients’ needs, which could have a materially adverse affect on ourbusiness.
Government agencies and consumer groups have directly or indirectly from time to time affected orattempted to affect the scope, content and manner of presentation of advertising, marketing and corporatecommunications services, whether through regulations or other governmental action. Any such limitations on thescope of the content of our services could affect our ability to meet our clients’ needs, which could have amaterial adverse affect on our results of operations and financial condition. In addition, there has been anincreasing tendency on the part of businesses to resort to the judicial system to challenge advertising practices.While such claims have not had a material adverse effect on our operating performance in the past, we cannotassure you that such claims by businesses or governmental agencies will not have a material adverse effect onour results of operations and financial condition in the future.
The success of our acquiring and retaining clients depends on our ability to avoid and manage conflicts ofinterest arising out of other client relationships and retention of key personnel.
Our ability to retain existing clients and to attract new clients may, in some cases, be limited by clients’perceptions of, or policies concerning, conflicts of interest arising out of other client relationships. If we areunable to maintain multiple agencies to effectively manage multiple client relationships and avoid potentialconflicts of interests our business and financial results may be materially adversely affected.
3

In addition, we may lose or fail to attract and retain key personnel. Our employees are our most importantassets. Our ability to retain key personnel is an important aspect of our competitiveness. Our continuing abilityto attract and retain those employees is important to our business and if we are unable to do so, our ability toprovide our services in the manner our customers have come to expect may be adversely affected, which couldharm our reputation and result in a loss of clients, which could have a material adverse affect on our results ofoperations and financial condition
We receive approximately 45% of our revenues from our 100 largest clients, and the loss of several of theseclients could adversely impact our prospects, business, financial condition and results of operations.
Our clients generally are able to reduce advertising and marketing spending or cancel projects at any timefor any reason. Any of our clients could decide not to continue to utilize our services to the same extent, as theyhave in the past, or at all, in the future. A significant reduction in advertising and marketing spending by ourlargest clients, or the loss of several of our largest clients, if not replaced by new client accounts or an increasein business from existing clients, would adversely affect our revenue, which could materially adversely affectour results of operations and financial condition.
We are a global service business and face certain risks of doing business abroad, including those of currencyfluctuations, political instability and exchange controls, which could have a material adverse affect on ourresults of operations.
We face the risks normally associated with global services businesses. The operational and financialperformance of our businesses are typically tied to overall economic and regional market conditions, competitionfor client assignments and talented staff, new business wins and losses and the risks associated with extensiveinternational operations. We do not believe that our international operations as a whole present any materialforeign exchange risk to our overall business because they invoice clients and pay expenses in their localcurrency. However, there are some risks of doing business abroad, including those of political instability andexchange controls, which do not affect domestic-focused firms. For financial information on our operations bygeographic area, see Note 5 to our consolidated financial statements.
We are exposed to risks from operating in developing countries.
We conduct business in various developing countries around the world. The risks associated withconducting business in developing countries can include slower payment of invoices; nationalization; social,political and economic instability; and currency repatriation restrictions, among other risks. In addition,commercial laws in many of these countries can be vague, inconsistently administered and retroactively applied.If we are deemed not to be in compliance with applicable laws in developing countries in which we conductbusiness, our prospects, business, financial condition and results of operations in those countries could beharmed, which could then have an adverse impact on our results of operations and financial condition.
Downgrades of our credit ratings could adversely affect us.
Standard and Poor’s Rating Service currently rates our long-term debt A-, Moody’s Investors Service ratesour long-term debt Baa1 and Fitch Ratings rates our long-term debt A-. Our short-term debt ratings are A2, P2and F2 by the respective agencies. Should our ratings be downgraded, neither our outstanding convertible bondsnor our existing bank credit facilities would be affected as they do not contain provisions that requireacceleration of cash payments upon a downgrade. The interest rates and fees on our bank credit facilities,however, would increase if our long-term debt rating is downgraded. Additionally, our access to the capitalmarkets could be adversely affected by adverse changes to the short or long-term debt ratings assigned to us byindependent rating agencies.
Holders of our convertible debt have the right to cause us to repurchase up to $2.3 billion, in whole orpartially, at specified dates in the future.
If we are required to satisfy a put, we expect to have sufficient available cash and unused creditcommitments to fund the put. We also believe that we will still have ample capacity under our existingcommitments to meet our cash requirements for the normal course of our business operations after the put event.In the event that our existing commitments or our cash flow from operations were decreased, we couldexperience difficulties in funding our business operations and would have to seek additional funding alternativesas described more fully in our MD&A.
4

We may be unsuccessful in evaluating material risks involved in completed and future acquisitions.
We regularly review potential acquisitions of businesses that are complementary to our businesses andclient needs. As part of the review we conduct business, legal and financial due diligence with the goal ofidentifying and evaluating material risks involved in any particular transaction. Despite our efforts, we may beunsuccessful in ascertaining or evaluating all such risks. As a result, we might not realize the intendedadvantages of any given acquisition. If we fail to identify certain material risks from one or more acquisitions,our results of operations and financial condition could be adversely affected.
Goodwill may become impaired.
We have a significant amount of goodwill recorded in accordance with U.S. generally accepted accountingprinciples (“U.S. GAAP” or “GAAP”) on our balance sheet resulting from our prior acquisition activities, whichprincipally represents the specialized know-how of the workforce at the agencies we have acquired. We annuallytest the carrying value of goodwill for impairment, as discussed in Note 1 to our consolidated financialstatements. The estimates and assumptions about future results of operations and cash flows made in connectionwith impairment testing could differ from future actual results of operations and cash flows. While weconcluded, for each year presented in the financial statements, that our goodwill is not impaired, future eventscould cause us to conclude that the asset values associated with a given operation may become impaired. Anyresulting impairment loss could materially adversely affect our results of operations and financial condition.
1B. Unresolved Staff Comments
None.
2. Properties
We maintain office space in many major cities around the world. The facility requirements of our agenciesare similar across geographic regions and disciplines and we believe that our facilities are in suitable and well-maintained condition for our current operations. This space is primarily used for office and administrativepurposes by our employees in performing professional services. Our principal corporate offices are at 437Madison Avenue, New York, New York and One East Weaver Street, Greenwich, Connecticut. We also maintainexecutive offices in London, England and Tokyo, Japan.
Substantially all of our office space is leased from third parties with varying expiration dates ranging fromone to 25 years. Certain of our leases are subject to rent reviews or contain various escalation clauses and certainof our leases require our payment of various operating expenses, which may also be subject to escalation. Leasesare generally denominated in the local currency of the operating entity. Our consolidated rent expense was$352.6 million in 2005, $345.3 million in 2004 and $335.5 million in 2003, after reduction for rents receivedfrom subleases of $23.5 million, $26.3 million and $17.3 million, respectively.
Our obligations for future minimum base rents under terms of non-cancelable real estate leases and otheroperating leases, which include primarily office furniture and computer and technology equipment, reduced byrents receivable from non-cancelable subleases are (in millions):
Net Rent_______________
2006 ............................................................................................. $412.62007 ............................................................................................. 338.62008 ............................................................................................. 276.62009 ............................................................................................. 235.92010 ............................................................................................. 209.2Thereafter ...................................................................................... 783.5
See Note 10 to our consolidated financial statements for a discussion of our lease commitments and ourMD&A for the impact of leases on our operating expenses.
3. Legal Proceedings
Beginning on June 13, 2002, several putative class actions were filed against us and certain seniorexecutives in the United States District Court for the Southern District of New York. The actions have since been
5
consolidated under the caption In re Omnicom Group Inc. Securities Litigation, No. 02-CV4483 (RCC), onbehalf of a proposed class of purchasers of our common stock between February 20, 2001 and June 11, 2002.The consolidated complaint alleges, among other things, that our public filings and other public statementsduring that period contained false and misleading statements or omitted to state material information relating to(1) our calculation of the organic growth component of period-to-period revenue growth, (2) our valuation ofand accounting for certain internet investments made by our Communicade Group (“Communicade”), which wecontributed to Seneca Investments LLC (“Seneca”) in 2001, and (3) the existence and amount of certaincontingent future obligations in respect of acquisitions. The complaint seeks an unspecified amount ofcompensatory damages plus costs and attorneys’ fees. Defendants moved to dismiss the complaint and on March28, 2005, the court dismissed portions (1) and (3) of the complaint detailed above. The court’s decision denyingthe defendants’ motion to dismiss the remainder of the complaint did not address the ultimate merits of the case,but only the sufficiency of the pleading. Defendants have answered the complaint, and fact discovery is ongoing.Plaintiffs have moved to have the proposed class certified and the defendants have opposed that motion, which isnow fully briefed.
In addition, on June 28, 2002, a derivative action was filed on behalf of Omnicom in New York state court.On February 18, 2005, a second shareholder derivative action, again purportedly brought on behalf of theCompany, was filed in New York state court. The derivative actions have been consolidated before one New YorkState Justice and the plaintiffs have filed an amended consolidated complaint. The consolidated derivativecomplaint questions the business judgment of certain current and former directors of Omnicom, by challenging,among other things, the valuation of and accounting for the internet investments made by Communicade and thecontribution of those investments to Seneca. The consolidated complaint alleges that the defendants breachedtheir fiduciary duties of good faith. The lawsuit seeks from the directors the amount of profits received fromselling Omnicom stock and other unspecified damages to be paid to the Company, as well as costs andattorneys’ fees. On September 1, 2005, the defendants moved to dismiss the derivative complaint. The motionhas now been fully briefed and was argued before the court on January 12, 2006. The court has not yet ruled onthe motion.
The defendants in both cases believe that the allegations against them are baseless and intend to vigorouslyoppose the lawsuits. Currently, we are unable to determine the outcome of these cases and the effect on ourfinancial position or results of operations. The outcome of any of these matters is inherently uncertain and maybe affected by future events. Accordingly, there can be no assurance as to the ultimate effect of these matters.
We are also involved from time to time in various routine legal proceedings in the ordinary course ofbusiness. We do not presently expect that these proceedings will have a material adverse effect on ourconsolidated financial position or results of operations.
For additional information concerning our legal proceedings, including the class action and derivativeaction described above, see Note 10 to our consolidated financial statements, which is incorporated into thissection by reference.
4. Submission of Matters to a Vote of Security Holders
Our annual shareholders’ meeting has historically been held in the second quarter of the year. No matterswere submitted to a vote of our shareholders during the last quarter of 2005.
6
PART II
5. Market for Registrant’s Common Equity, Related Stockholder Matters and Issuer Purchases of EquitySecurities
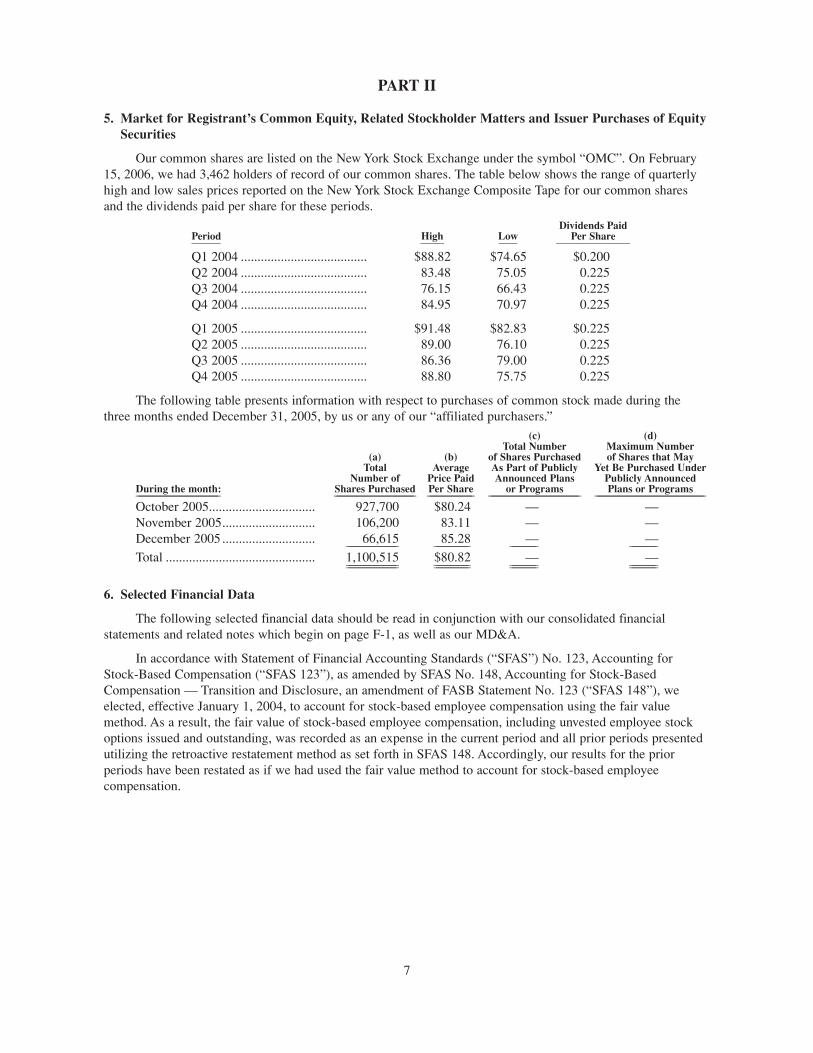
Our common shares are listed on the New York Stock Exchange under the symbol “OMC”. On February15, 2006, we had 3,462 holders of record of our common shares. The table below shows the range of quarterlyhigh and low sales prices reported on the New York Stock Exchange Composite Tape for our common sharesand the dividends paid per share for these periods.
Dividends PaidPeriod High Low Per Share___________ _________ _______ ____________________________
Q1 2004 ...................................... $88.82 $74.65 $0.200Q2 2004 ...................................... 83.48 75.05 0.225Q3 2004 ...................................... 76.15 66.43 0.225Q4 2004 ...................................... 84.95 70.97 0.225
Q1 2005 ...................................... $91.48 $82.83 $0.225Q2 2005 ...................................... 89.00 76.10 0.225Q3 2005 ...................................... 86.36 79.00 0.225Q4 2005 ...................................... 88.80 75.75 0.225
The following table presents information with respect to purchases of common stock made during thethree months ended December 31, 2005, by us or any of our “affiliated purchasers.”
(c) (d)Total Number Maximum Number
(a) (b) of Shares Purchased of Shares that MayTotal Average As Part of Publicly Yet Be Purchased Under
Number of Price Paid Announced Plans Publicly AnnouncedDuring the month: Shares Purchased Per Share or Programs Plans or Programs_______________________________ ______________________________ _________________ __________________________________ _________________________________________
October 2005................................ 927,700 $80.24 — —November 2005............................ 106,200 83.11 — —December 2005 ............................ 66,615 85.28 — —___________________ _____________ __________ __________
Total ............................................. 1,100,515 $80.82 — —___________________ _____________ __________ _____________________________ _____________ __________ __________
6. Selected Financial Data
The following selected financial data should be read in conjunction with our consolidated financialstatements and related notes which begin on page F-1, as well as our MD&A.
In accordance with Statement of Financial Accounting Standards (“SFAS”) No. 123, Accounting forStock-Based Compensation (“SFAS 123”), as amended by SFAS No. 148, Accounting for Stock-BasedCompensation — Transition and Disclosure, an amendment of FASB Statement No. 123 (“SFAS 148”), weelected, effective January 1, 2004, to account for stock-based employee compensation using the fair valuemethod. As a result, the fair value of stock-based employee compensation, including unvested employee stockoptions issued and outstanding, was recorded as an expense in the current period and all prior periods presentedutilizing the retroactive restatement method as set forth in SFAS 148. Accordingly, our results for the priorperiods have been restated as if we had used the fair value method to account for stock-based employeecompensation.
7

(Dollars in millions, except per share amounts)______________________________________________________________For the years ended December 31: 2005 2004 2003 2002 2001________ ________ ________ ________ ________
Revenue ................................................ $10,481.1 $9,747.2 $8,621.4 $7,536.3 $6,889.4Operating Profit .................................... 1,339.8 1,215.4 1,091.9 985.1 889.1Income After Income Taxes ................ 845.3 782.5 696.1 625.0 495.9Net Income .......................................... 790.7 723.5 631.0 570.5 455.7Net Income Per Common Share:
Basic ................................................ 4.38 3.90 3.37 3.07 2.49Diluted ............................................ 4.36 3.88 3.37 3.07 2.48
Dividends Declared PerCommon Share ................................ 0.925 0.900 0.800 0.800 0.775
(Dollars in millions, except per share amounts)______________________________________________________________As of December 31: 2005 2004 2003 2002 2001________ ________ ________ ________ ________
Cash, cash equivalents andshort-term investments .................... $ 1,209.9 $ 1,739.6 $ 1,548.9 $ 695.9 $ 517.0
Total assets............................................ 15,919.9 16,002.4 14,620.0 12,056.5 10,686.8Long-term obligations
Long-term debt ................................ 18.2 19.1 197.3 197.9 490.1Convertible notes ............................ 2,339.3 2,339.3 2,339.3 1,747.0 850.0Deferred compensation and
other liabilities ............................ 298.4 309.1 326.5 293.6 297.0
As discussed in Note 1 to our consolidated financial statements, as required by SFAS No. 142, Goodwilland Other Intangibles (“SFAS 142”), beginning with our 2002 results, goodwill and other intangible assets thathave indefinite lives are not amortized due to a change in GAAP. To make our results for the 2001 period moredirectly comparable in the table that follows, we adjusted our 2001 results to eliminate goodwill amortizationand the related tax impact. As a result of excluding the goodwill amortization, this presentation is a non-GAAPfinancial measure. We believe that by excluding goodwill amortization in 2001, the table below presents selectedfinancial data using amounts that are more comparable year-to-year and thus meaningful for purposes of thisanalysis. In addition, as a reminder, “Net Income, as reported, GAAP” includes the effect of our adoption ofSFAS 123 for all prior periods presented below.
(Dollars in millions, except per share amounts)______________________________________________________________For the years ended December 31: 2005 2004 2003 2002 2001________ ________ ________ ________ ________
Net Income, as adjusted:Net Income, as reported, GAAP .... $790.7 $723.5 $631.0 $570.5 $455.7Add-back goodwill amortization,
net of income taxes .................... — — — — 83.1______ ______ ______ ______ ______Net Income, excluding goodwill
amortization ................................ $790.7 $723.5 $631.0 $570.5 $538.8______ ______ ______ ______ ____________ ______ ______ ______ ______Basic Net Income per share:
as reported, GAAP .................... $4.38 $3.90 $3.37 $3.07 $2.49as adjusted .................................. $4.38 $3.90 $3.37 $3.07 $2.95
Diluted Net Income per share:as reported, GAAP .................... $4.36 $3.88 $3.37 $3.07 $2.48
as adjusted ...................................... $4.36 $3.88 $3.37 $3.07 $2.92
8
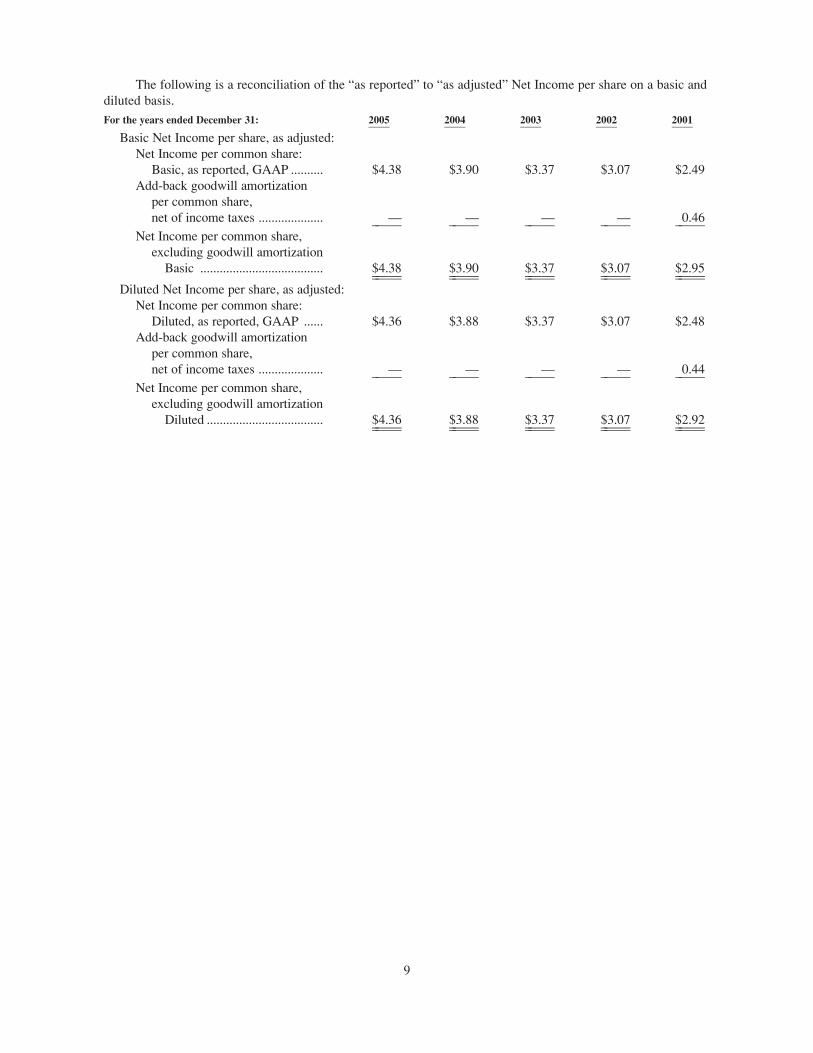
The following is a reconciliation of the “as reported” to “as adjusted” Net Income per share on a basic anddiluted basis.
For the years ended December 31: 2005 2004 2003 2002 2001________ ________ ________ ________ ________
Basic Net Income per share, as adjusted:Net Income per common share:
Basic, as reported, GAAP .......... $4.38 $3.90 $3.37 $3.07 $2.49Add-back goodwill amortization
per common share,net of income taxes .................... — — — — 0.46_____ _____ _____ _____ _____
Net Income per common share,excluding goodwill amortization
Basic ...................................... $4.38 $3.90 $3.37 $3.07 $2.95_____ _____ _____ _____ __________ _____ _____ _____ _____Diluted Net Income per share, as adjusted:
Net Income per common share:Diluted, as reported, GAAP ...... $4.36 $3.88 $3.37 $3.07 $2.48
Add-back goodwill amortizationper common share,net of income taxes .................... — — — — 0.44_____ _____ _____ _____ _____
Net Income per common share,excluding goodwill amortization
Diluted .................................... $4.36 $3.88 $3.37 $3.07 $2.92_____ _____ _____ _____ __________ _____ _____ _____ _____
9
7. Management’s Discussion and Analysis of Financial Condition and Results of Operations
Executive Summary
We are a strategic holding company. We provide professional services to clients through multiple agenciesaround the world. On a global, pan-regional and local basis, our agencies provide these services in the followingdisciplines: traditional media advertising, customer relationship management, public relations and specialtycommunications. Our business model was built and evolves around clients. While our companies operate underdifferent names and frame their ideas in different disciplines, we organize our services around clients. Thefundamental premise of our business is that clients’ specific requirements should be the central focus in how westructure our business offering and allocate our resources. This client-centric business model results in multipleagencies collaborating in formal and informal virtual networks that cut across internal organizational structuresto deliver consistent brand messages for a specific client and execute against our clients’ specific marketingrequirements. We continually seek to grow our business with our existing clients by maintaining our client-centric approach, as well as expanding our existing business relationships into new markets and with newclients. In addition, we pursue selective acquisitions of complementary companies with strong, entrepreneurialmanagement teams that typically either currently serve or have the ability to serve our existing client base.
Globally, during the past few years, our industry has continued to be affected by geopolitical unrest,lagging economic conditions, lack of consumer confidence and cautious client spending. All of these factorshave contributed to a difficult business environment and industry-wide margin contraction. Throughout thisperiod, we continued to invest in our businesses and our personnel and took action to reduce costs at some ofour agencies to address the changing economic circumstances. In recent periods, improving economicconditions, coupled with the business trends described below, have had a positive impact on our business.
Several long-term trends continue to positively affect our business, including our clients increasinglyexpanding the focus of their brand strategies from national markets to pan-regional and global markets.Additionally, in an effort to gain greater efficiency and effectiveness from their marketing dollars, clients areincreasingly requiring greater coordination of their traditional advertising and marketing activities andconcentrating these activities with a smaller number of service providers.
The diversity and balance of our portfolio of companies and service offerings have enabled us to continueto grow our revenues, operating income, net income and earnings per share. In the United States, revenue grewat a rate of 10.0% in 2005, which is comparable to our prior year rate of 10.6%. On a constant currency basis,revenue growth for our international business increased by 3.5%, which is a decrease over our prior rate of 6.0%.While our slower international growth continues to be evidenced mainly in Continental European countries, ourgrowth rate has also been impacted by the first quarter 2005 sale of a majority owned business located inAustralia and New Zealand. Overall, we believe that our businesses have performed well, including those inContinental Europe, considering the generally sluggish economy that has existed in that region over the past fewyears. In addition, in the next twelve to eighteen months, we expect to continue to increase our investment in analready improving Asian market. We plan to focus on businesses that will complement and enhance our existingstrategic platforms and service capabilities to better serve our clients in this region.
In each quarter of 2005, we experienced an increase in our operating margins over the previous year. Thisimprovement is the result of our new business initiatives and wins, as well as our previous cost reductionactions. Our operating margin for 2005 was 12.8% compared to 12.5% in 2004. We are hopeful that marginswill continue to improve as a result of recent new business wins in the second half of 2005, our continued newbusiness initiatives associated with the positive long-term industry trends described above, a stabilizingEuropean economy and the prior period cost-reduction actions taken by our agencies.
Given our size and breadth, we manage our business by monitoring several financial indicators. The keyindicators that we review focus on the areas of revenues and operating expenses.
Revenue growth is analyzed by reviewing the components and mix of the growth, including growth bymajor geographic location, growth by major marketing discipline, growth from currency changes, growth fromacquisitions and growth from our largest clients.
10
In recent years, our revenue has been divided almost evenly between domestic and internationaloperations. In 2005, our overall revenue growth was 7.5%, of which 0.5% was related to changes in foreignexchange rates and (0.3)% was related to the disposal of entities, net of entities acquired. The remainder, 7.3%,was organic growth.
In 2005, traditional media advertising represented about 44% of the total revenue and grew by 9.1% overthe prior year. Customer relationship management represented about 34% of the total revenue and grew by 6.8%over the previous year. Public relations represented about 10% of the total revenue and grew by 2.1% over theprevious year and specialty communications represented about 12% of total revenue and grew by 8.9% over theprevious year.
We measure operating expenses in two distinct cost categories, salary and service cost and office andgeneral expenses. Salary and service costs are primarily comprised of employee compensation related costs andoffice and general expenses are primarily comprised of rent and occupancy costs, technology related costs anddepreciation and amortization. Each of our agencies requires service professionals with a skill set that iscommon across our disciplines. At the core of this skill set is the ability to understand a client’s brand and itsselling proposition, and the ability to develop a unique message to communicate the value of the brand to theclient’s target audience. The facility requirements of our agencies are similar across geographic regions anddisciplines, and their technology requirements are generally limited to personal computers, servers and off-the-shelf software.
Because we are a service business, we monitor these costs on a percentage of revenue basis. Salary andservice costs tend to fluctuate in conjunction with changes in revenue, whereas office and general expenses,which are not directly related to servicing clients, tend to decrease as a percentage of revenue as revenuesincrease because a significant portion of these expenses are relatively fixed in nature. During 2005, salary andservice costs increased to 70.7% of revenue from 70.2% of revenue in 2004. This increase is primarilyattributable to increased revenue levels and the required increases in direct salaries, salary-related costs andfreelance labor costs necessary to deliver our services and pursue new business initiatives. Office and generalexpenses declined to 16.5% of revenue from 17.3% in 2004 as a result of our continuing efforts to better alignthese costs with business levels on a location-by-location basis.
Our net income for 2005 increased by 9.3% to $790.7 million from $723.5 million in 2004 and our dilutedEPS increased by 12.4% to $4.36 from $3.88 in the prior year for the reasons described above, as well as theimpact of the reduction in our weighted average shares outstanding for the year. This reduction was the result ofour purchases of treasury shares net of option exercises and share issuances under our employee stock purchaseplan.
Critical Accounting Policies and New Accounting Pronouncements
Critical Accounting Policies
We have prepared the following supplemental summary of accounting policies to assist the reader in betterunderstanding our financial statements and the related MD&A. We believe that the following policies mayinvolve a higher degree of judgment and complexity in their application and represent the critical accountingpolicies used in the preparation of our financial statements. Readers are encouraged to consider this supplementtogether with our consolidated financial statements and the related notes to our consolidated financial statements,including our discussion in Note 1 setting forth our accounting policies in greater detail, for a more completeunderstanding of accounting policies discussed below.
Estimates: The preparation of our financial statements in conformity with U.S. GAAP requiresmanagement to make estimates and assumptions. These estimates and assumptions affect the reported amountsof assets and liabilities including valuation allowances for receivables and deferred tax assets, accruals forincentive compensation and the disclosure of contingent liabilities at the date of the financial statements, as wellas the reported amounts of revenue and expenses during a reporting period. We evaluate these estimates on an
11
ongoing basis and we base our estimates on historical experience, current conditions and various otherassumptions we believe are reasonable under the circumstances. Actual results can differ from those estimates,and it is possible that the differences could be material.
A fair value approach is used in testing goodwill for impairment under SFAS 142 and when evaluatingcost-based investments, which consist of ownership interests in non-public companies, to determine if an otherthan temporary impairment has occurred. Our approach in determining fair values utilizes a discounted cashflow methodology, consideration of similar and recent transactions and when available and as appropriate, weuse comparative market multiples to supplement our analysis. Numerous estimates and assumptions necessarilyhave to be made when completing a discounted cash flow valuation, including estimates and assumptionsregarding interest rates, appropriate discount rates and capital structure. Additionally, estimates must be maderegarding revenue growth, operating margins, tax rates, working capital requirements and capital expenditures.Estimates and assumptions also need to be made when determining the appropriate comparative marketmultiples to be used. Actual results of operations, cash flows and other factors used in a discounted cash flowvaluation will likely differ from the estimates used and it is possible that differences and changes could bematerial. Additional information about impairment testing under SFAS 142 and valuation of cost-basedinvestments appears in Note 1 of our consolidated financial statements, as well as Note 6 with respect to cost-based investments.
A fair value approach is used in determining the award value of stock-based employee compensation inaccordance with SFAS 123. We currently utilize the Black-Scholes option valuation model to determine the fairvalue of option awards. This valuation model utilizes several assumptions and estimates such as expected life,rate of risk free interest, historical volatility and dividend yield. If different assumptions and estimates wereutilized to determine the fair value, our actual results of operations and cash flows would likely differ from theestimates used and it is possible that differences and changes could be material. Additional information aboutthese assumptions and estimates appears in Note 7 to our consolidated financial statements.
Acquisitions and Goodwill: We have historically made and expect to continue to make selectiveacquisitions. In making acquisitions, the price we pay is determined by various factors, including specializedknow-how, reputation, competitive position, geographic coverage and service offerings, as well as ourexperience and judgment. The amount we paid for acquisitions, including cash, stock and assumption of netliabilities, totaled $327.2 million in 2005 and $378.1 million in 2004. Approximately 63% and 51%,respectively, of these amounts related to contingent purchase price obligations paid during the respective yearrelated to acquisitions completed in prior years.
Our acquisition strategy has been focused on acquiring the expertise of an assembled workforce in order tocontinue to build upon the core capabilities of our various strategic business platforms and agency brandsthrough the expansion of their geographic reach and/or their service capabilities to better serve our clients.Accordingly, like most service businesses, a substantial portion of the intangible asset value that we acquire isthe know-how of the people, which is treated as part of goodwill and, in accordance with SFAS No. 141,Business Combinations (“SFAS 141”), is not valued separately. For each of our acquisitions we undertake adetailed review to identify other intangible assets and a valuation is performed for all such assets identified. Themajority of the value of the identifiable intangible assets that we acquire is derived from customer relationships.In executing our acquisition strategy, one of the primary drivers in identifying and executing a specifictransaction is the existence of, or the ability to, expand our existing client relationships. Additional key factorswe consider include the competitive position and specialized know-how of the acquisition targets. The expectedbenefits of our acquisitions are typically shared across multiple agencies as they work together to integrate theacquired agency into our client service strategy.
A summary of our contingent purchase price obligations, sometimes referred to as earn-outs, andobligations to purchase additional interests in certain subsidiary and affiliate companies is set forth in the“Liquidity and Capital Resources” section of this report. The amount of contingent purchase price obligationsand obligations to purchase additional interests in certain subsidiary and affiliate companies are based on futureperformance. Contingent purchase price obligations are accrued, in accordance with GAAP, when thecontingency is resolved and payment is certain.
12
Additional information about acquisitions and goodwill appears in Notes 1 and 2 to our consolidatedfinancial statements.
Revenue Recognition: Substantially all of our revenue is derived from fees for services. Additionally, weearn commissions based upon the placement of advertisements in various media. Revenue is realized when theservice is performed in accordance with terms of the arrangements with our clients and upon completion of theearnings process. This includes when services are rendered, generally upon presentation date for media, whencosts are incurred for radio and television production and when print production is completed and collection isreasonably assured.
In the majority of our businesses, we record revenue at the net amount retained when the fee orcommission is earned. In the delivery of certain services to our clients, we incur costs on their behalf for whichwe are reimbursed. Substantially all of our reimbursed costs relate to purchases on behalf of our clients of mediaand production services. We normally have no latitude in establishing the reimbursement price for theseexpenses and invoice our clients for these expenses in an amount equal to the amount of costs incurred. Thesereimbursed costs, which are a multiple of our revenue, are significant. However, the majority of these costs areincurred on behalf of our largest clients and we have not historically experienced significant losses in connectionwith the reimbursement of these costs.
A small portion of our contractual arrangements with clients includes performance incentive provisionsdesigned to link a portion of our revenue to our performance relative to both quantitative and qualitative goals.We recognize this portion of revenue when the specific quantitative goals are achieved, or when our performanceagainst qualitative goals is determined by our clients. Additional information about our revenue appears in Note1 to our consolidated financial statements.
Employee Stock-Based Compensation: In accordance with SFAS 123, as amended by SFAS 148, weelected, effective January 1, 2004, to account for stock-based employee compensation using the fair valuemethod. In determining the fair value of certain stock-based compensation awards, we use certain estimates andassumptions such as expected life, rate of risk free interest, volatility and dividend yield. If different assumptionsand estimates were used to determine the fair value, our actual results could be different. As a result of ouradoption of SFAS 123 as amended by SFAS 148, the fair value of stock-based employee compensation wasrecorded as an expense in the current and prior years. Accordingly, our results for years prior to 2004 have beenrestated as if we had used the fair value method to account for stock-based employee compensation. Pre-taxstock-based employee compensation expense for the years ended December 31, 2005, 2004 and 2003, was $87.0million, $117.2 million and $133.1 million, respectively. Information about our specific awards and stock planscan be found in Note 7 to our consolidated financial statements.
In December 2004, the FASB issued SFAS No. 123 (Revised 2004) — Share-Based Payment (“SFAS123R”) which is effective for the next fiscal year beginning after June 15, 2005 and generally applies to grantsmade after adoption. We plan to adopt SFAS 123R effective January 1, 2006. SFAS 123R revises certainrequirements of FASB Statement No. 123, Accounting for Stock-Based Compensation. We do not expect thesechanges to have a material impact on our consolidated results of operations or financial position. Additionalinformation regarding the changes required by SFAS 123R and their impact on our financial statements can befound in Note 1 to our consolidated financial statements.
13
New Accounting Pronouncements
In addition to those discussed previously, additional information regarding new accountingpronouncements can also be found in Note 13 to our consolidated financial statements. Also, Note 1 to ourconsolidated financial statements includes a summary of our significant accounting policies.
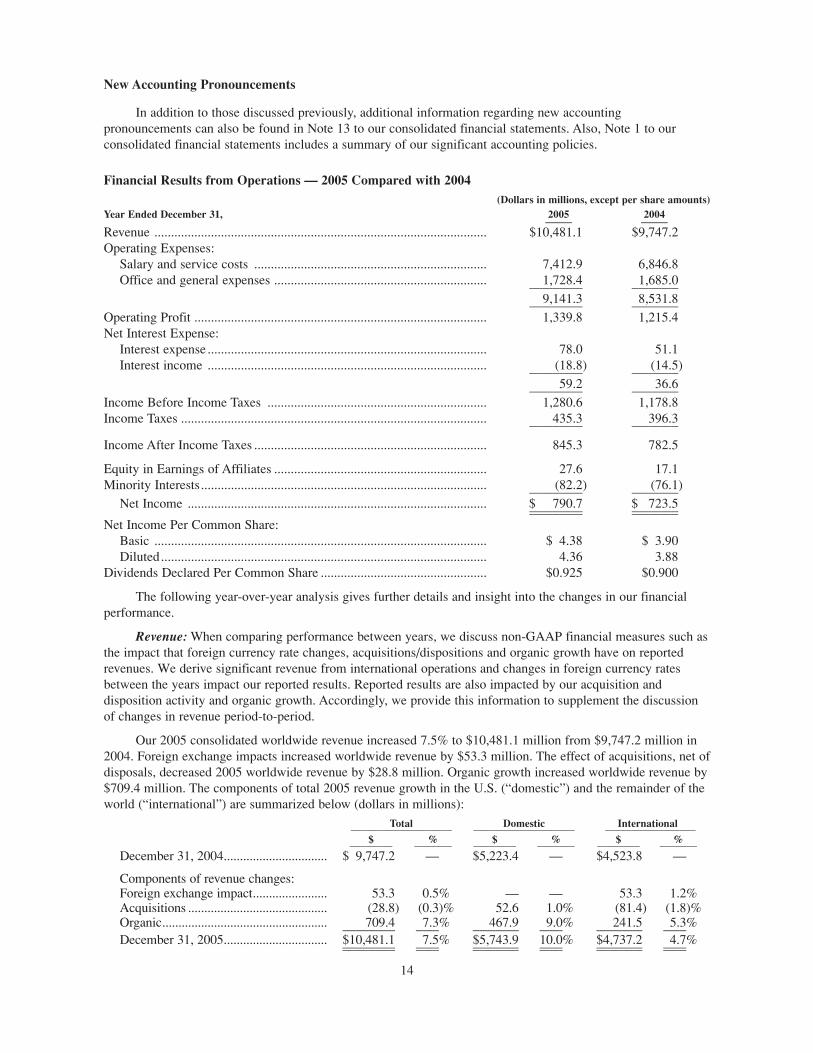
Financial Results from Operations — 2005 Compared with 2004(Dollars in millions, except per share amounts)
Year Ended December 31, 2005 2004_____ _____
Revenue .................................................................................................... $10,481.1 $9,747.2Operating Expenses:
Salary and service costs ...................................................................... 7,412.9 6,846.8Office and general expenses ................................................................ 1,728.4 1,685.0________________ ______________
9,141.3 8,531.8________________ ______________Operating Profit ........................................................................................ 1,339.8 1,215.4Net Interest Expense:
Interest expense .................................................................................... 78.0 51.1Interest income .................................................................................... (18.8) (14.5)________________ ______________
59.2 36.6________________ ______________Income Before Income Taxes .................................................................. 1,280.6 1,178.8Income Taxes ............................................................................................ 435.3 396.3________________ ______________
Income After Income Taxes ...................................................................... 845.3 782.5
Equity in Earnings of Affiliates ................................................................ 27.6 17.1Minority Interests...................................................................................... (82.2) (76.1)________________ ______________
Net Income .......................................................................................... $ 790.7 $ 723.5________________ ______________________________ ______________Net Income Per Common Share:
Basic .................................................................................................... $ 4.38 $ 3.90Diluted.................................................................................................. 4.36 3.88
Dividends Declared Per Common Share .................................................. $0.925 $0.900
The following year-over-year analysis gives further details and insight into the changes in our financialperformance.
Revenue: When comparing performance between years, we discuss non-GAAP financial measures such asthe impact that foreign currency rate changes, acquisitions/dispositions and organic growth have on reportedrevenues. We derive significant revenue from international operations and changes in foreign currency ratesbetween the years impact our reported results. Reported results are also impacted by our acquisition anddisposition activity and organic growth. Accordingly, we provide this information to supplement the discussionof changes in revenue period-to-period.
Our 2005 consolidated worldwide revenue increased 7.5% to $10,481.1 million from $9,747.2 million in2004. Foreign exchange impacts increased worldwide revenue by $53.3 million. The effect of acquisitions, net ofdisposals, decreased 2005 worldwide revenue by $28.8 million. Organic growth increased worldwide revenue by$709.4 million. The components of total 2005 revenue growth in the U.S. (“domestic”) and the remainder of theworld (“international”) are summarized below (dollars in millions):
Total Domestic International___________________ ___________________ _________________$ % $ % $ %________ _______ ________ _______ ________ _______
December 31, 2004................................ $ 9,747.2 — $5,223.4 — $4,523.8 —
Components of revenue changes:Foreign exchange impact....................... 53.3 0.5% — — 53.3 1.2%Acquisitions ........................................... (28.8) (0.3)% 52.6 1.0% (81.4) (1.8)%Organic................................................... 709.4 7.3% 467.9 9.0% 241.5 5.3%________________ _______ ______________ _______ ______________ _______December 31, 2005................................ $10,481.1 7.5% $5,743.9 10.0% $4,737.2 4.7%________________ _______ ______________ _______ ______________ _______________________ _______ ______________ _______ ______________ _______
14
The negative acquisition growth in international revenue is attributable to the disposition of a customerrelationship management agency located in Australia and New Zealand in the first quarter of 2005.
The components and percentages are calculated as follows:
• The foreign exchange impact component shown in the table is calculated by first converting the currentperiod’s local currency revenue using the average exchange rates from the equivalent prior period toarrive at a constant currency revenue (in this case $10,427.8 million for the Total column in the table).The foreign exchange impact equals the difference between the current period revenue in U.S. Dollarsand the current period revenue in constant currency (in this case $10,481.1 million less $10,427.8million for the Total column in the table).
• The acquisition component shown in the table is calculated by aggregating the applicable prior periodrevenue of the acquired businesses. Netted against this number is the revenue of any business includedin the prior period reported revenue that was disposed of subsequent to the prior period.
• The organic component shown in the table is calculated by subtracting both the foreign exchange andacquisition revenue components from total revenue growth.
• The percentage change shown in the table of each component is calculated by dividing the individualcomponent amount by the prior period revenue base of that component (in this case $9,747.2 millionfor the Total column in the table).
The components of revenue and revenue growth for 2005 compared to 2004 in our primary geographicmarkets are summarized below (dollars in millions):
$ Revenue % Growth_________ _________
United States............................................................ $ 5,743.9 10.0%Euro Markets ........................................................... 2,156.5 4.8%United Kingdom ...................................................... 1,102.4 1.6%Other ........................................................................ 1,478.3 7.1%________________ _______Total ......................................................................... $10,481.1 7.5%________________ _______________________ _______
As indicated, foreign exchange impacts increased our international revenue by $53.3 million for 2005. Themost significant impacts resulted from the strengthening of the Canadian Dollar and Brazilian Real against theU.S. Dollar, which was offset primarily by the decline of the British Pound against the U.S. Dollar. Based oncurrent exchange rates, we expect foreign exchange impacts to reduce our full-year 2006 consolidated revenuesby between 1.0% and 1.5%. Additional geographic information relating to our business is contained in Note 5 toour consolidated financial statements.
Due to a variety of factors, in the normal course, our agencies both gain and lose business from clientseach year. The net result in 2005, and historically each year for us as a whole, was an overall gain in newbusiness. Under our client-centric approach, we seek to broaden our relationships with our largest clients.Revenue from our single largest client represented 4.0% of worldwide revenue in 2005 and 4.3% in 2004 and noother client represented more than 2.9% in 2005 or 2004. Our ten largest and 100 largest clients represented18.5% and 44.6% of our 2005 worldwide revenue, respectively, and 18.3% and 45.1% of our 2004 worldwiderevenue, respectively.
Driven by clients’ continuous demand for more effective and efficient branding activities, we strive toprovide an extensive range of advertising, marketing and corporate communications services through variousclient-centric networks that are organized to meet specific client objectives. These services include advertising,brand consultancy, crisis communications, custom publishing, database management, digital and interactivemarketing, direct marketing, directory advertising, entertainment marketing, environmental design, experientialmarketing, field marketing, financial / corporate business-to-business advertising, graphic arts, healthcarecommunications, instore design, investor relations, marketing research, media planning and buying, mobilemarketing services, multi-cultural marketing, non-profit marketing, organizational communications, packagedesign, product placement, promotional marketing, public affairs, public relations, real estate advertising andmarketing, recruitment communications, reputation consulting, retail marketing, search engine marketing andsports and event marketing. In an effort to monitor the changing needs of our clients and to further expand the
15

scope of our services to key clients, we monitor revenue across a broad range of disciplines and group them intothe following four categories as summarized below: traditional media advertising, customer relationshipmanagement, referred to as CRM, public relations and specialty communications.
(Dollars in millions)Year Ended December 31,____________________________________________________________________
2005 2004 2005 vs 2004__________________ __________________ ___________________% of % of $ %
Revenue Revenue Revenue Revenue Growth Growth________ ________ ________ ________ _________ _________
Traditional media advertising .............. $ 4,589.0 43.8% $4,207.5 43.2% $381.5 9.1%CRM .................................................... 3,613.0 34.5% 3,382.6 34.7% 230.4 6.8%Public relations .................................... 1,045.7 10.0% 1,024.0 10.5% 21.7 2.1%Specialty communications .................. 1,233.4 11.7% 1,133.1 11.6% 100.3 8.9%________________ ______________ ___________
$10,481.1 $9,747.2 $733.9 7.5%________________ ______________ ___________________________ ______________ ___________
Certain reclassifications have been made in the tables above to conform the 2004 amounts to the 2005presentation.
Operating Expenses: Our 2005 worldwide operating expenses increased $609.5 million, or 7.1%, to$9,141.3 million from $8,531.8 million in 2004, as shown below.
(Dollars in millions)Year Ended December 31,___________________________________________________________________________
2005 2004 2005 vs 2004____________________________ __________________________ _________________% of % ofTotal Total
% of Operating % of Operating $ %Revenue Revenue Expenses Revenue Revenue Expenses Growth Growth________ ________ ________ ________ ________ ________ _______ _______
Revenue .......................................... $10,481.1 $9,747.2 $733.9 7.5%Operating Expenses:
Salary and service costs.............. 7,412.9 70.7% 81.1% 6,846.8 70.2% 80.3% 566.1 8.3%Office and general expenses ...... 1,728.4 16.5% 18.9% 1,685.0 17.3% 19.7% 43.4 2.6%________________ _______ _______ ______________ _______ _______ ___________ _______
Total Operating Expenses................ 9,141.3 87.2% 8,531.8 87.5% 609.5 7.1%
Operating Profit .............................. $ 1,339.8 12.8% $1,215.4 12.5% $124.4 10.2%________________ _______ ______________ _______ ___________ _______________________ _______ ______________ _______ ___________ _______
Because we provide professional services, salary and service costs represent the largest part of ouroperating expenses. During 2005, we continued to invest in our businesses and their professional personnel. As apercentage of total operating expenses, salary and service costs were 81.1% in 2005 and 80.3% in 2004. Thesecosts are comprised of salary and related costs and direct service costs. Most, or $566.1 million and 92.9%, ofthe $609.5 million increase in total operating expenses in 2005 resulted from increases in salary and servicecosts. This increase was attributable to the increase in our revenue in 2005 and the required increases in thedirect costs necessary to deliver our services and pursue new business initiatives, including direct salaries, salaryrelated costs and direct service costs, including freelance labor costs and direct administrative costs, such astravel. In addition, cash-based incentive compensation, such as bonus and profit sharing, increased in 2005 whencompared to 2004. However, this increase was largely offset by a reduction in the amortization of employeestock-based compensation. As a result, salary and service costs as a percentage of revenues increased year-to-year from 70.2% in 2004 to 70.7% in 2005.
Office and general expenses represented 18.9% and 19.7% of our operating expenses in 2005 and 2004,respectively. These costs are comprised of office and equipment rent, technology costs and depreciation,amortization of identifiable intangibles, professional fees and other overhead expenses. As a percentage ofrevenue, office and general expenses decreased in 2005 from 17.3% to 16.5% because these costs are relativelyfixed in nature and decrease as a percentage of revenue as revenue increases. In addition, this year-over-yeardecrease resulted from our continuing efforts to better align these costs with business levels on a location-by-location basis.
We expect our efforts to control operating expenses will continue as we continuously look for ways toincrease the variability of our cost structure. We are hopeful that margins will continue to improve as a result of
16
recent new business wins in the second half of 2005, our continued new business initiatives associated with thepositive long-term industry trends previously described, a stabilizing European economy and the prior periodcost-reduction actions taken by our agencies.
Included in office and general expense for 2005 is a pre-tax net gain of $6.9 million arising from the salein the first quarter of a majority-owned business located in Australia and New Zealand and the disposal of a non-strategic business located in the United States. Due to the unusually high book tax rate caused by the non-deductibility of goodwill, the book tax cost of the transactions was $6.1 million. After deducting minorityinterest expense, the impact of these transactions increased net income in 2005 by $0.4 million.
Included in office and general expense for 2004 was a net gain of $13.1 million related to investmentactivity during the first quarter of 2004. In March 2004, in connection with Seneca Investments LLC’srecapitalization, we agreed to exchange our remaining preferred stock in Seneca for a $24.0 million seniorsecured note and 40% of Seneca’s outstanding common stock. The note, which is due in March 2007, bearsinterest at a rate of 6.25% per annum. The recapitalization transaction was required to be recorded at fair valueand, accordingly, we recorded a pre-tax net gain of $24.0 million. This gain was partially offset by losses of$10.9 million on other cost-based investments unrelated to our investment in Seneca. Payments received throughJanuary 2006 have reduced the outstanding principal balance of the note to $1.2 million as of January 31, 2006.Additional information appears in Note 6 to our consolidated financial statements.
Excluding these net gains of $6.9 million and $13.1 million from investment activity, office and generalexpenses were 16.6% of revenue in 2005, compared to 17.4% of revenue in 2004 and operating marginincreased to 12.7% of revenue in 2005 from 12.3% of revenue in 2004.
Net Interest Expense: Our net interest expense increased in 2005 to $59.2 million, as compared to $36.6million in 2004. Our gross interest expense increased by $26.9 million to $78.0 million. This increase resultedfrom $24.4 million of additional interest costs associated with the amortization of payments we made during2005 and the fourth quarter of 2004 to holders of certain of our convertible notes. In August 2005, we paid $33.5million to holders of our Zero Coupon Zero Yield Convertible Notes due 2032 (“2032 Notes”) to not exercisecertain put rights and, in November 2004, we paid $14.8 million and $1.5 million in the aggregate, respectively,to consenting holders of our Liquid Yield Option Notes due 2031 (“2031 Notes”) and Zero Coupon Zero YieldConvertible Notes due 2033 (“2033 Notes”) as incentives to consent to certain amendments to our indenturesand not exercise certain put rights. Substantially all of the year-over-year increase in these payments was due tomarket increases in short-term interest rates. These increases were partially offset by interest expense savingsrelative to our Euro-denominated (“€”) 152.4 million 5.20% Notes that were redeemed upon their maturity inJune 2005.
As a result of interest related payments made in the second half of 2005 and a payment we made toholders of the 2031 Notes in February, 2006 (see Note 14 to our consolidated financial statements), we expectinterest expense to increase by $11.4 million in 2006 compared to 2005, as these payments are amortized ratablythrough their next put dates. We expect interest expense to be further increased by additional payments we maymake during the third quarter of 2006 on our 2032 Notes and 2033 Notes.
See “Liquidity and Capital Resources” for a discussion of our indebtedness and related matters.
Income Taxes: Our 2005 consolidated effective income tax rate was 34.0%. Excluding the impact relatingto the 2005 net gain on the sale of certain businesses, as described above in our discussion on operatingexpenses, our tax rate was 33.7% which is comparable to our 2004 year rate of 33.6%.
The FASB issued two staff positions on accounting for income taxes to address recent changes enacted bythe United States Congress, Staff Position FAS 109-1, Application of FASB Statement No. 109, Accounting forIncome Taxes, for the Tax Deduction Provided to U.S. Based Manufacturers by the American Jobs Creation Actof 2004 (the “Jobs Act”) (“FSP No. 109-1”), and Staff Position FAS 109-2, Accounting and Disclosure Guidancefor the Foreign Earnings Repatriation Provisions within the American Jobs Creation Act of 2004 (“FSP No. 109-2). We believe that FSP 109-1 does not apply to our business. In the fourth quarter of 2005, we repatriated $47.9million of foreign earnings utilizing the 85% dividend received deduction provided by the Jobs Act and inaccordance with FSP 109-2, we recorded a $2.7 million domestic tax liability, which is included in our full yeareffective tax rate of 34.0%.
17
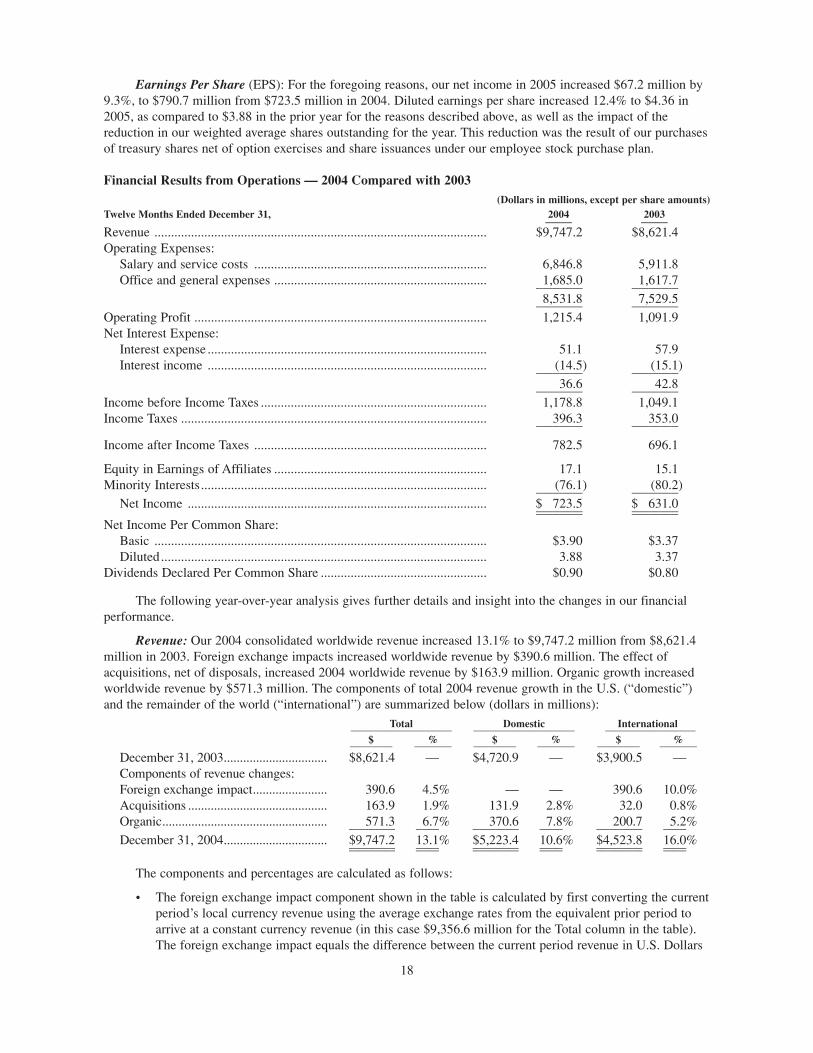
Earnings Per Share (EPS): For the foregoing reasons, our net income in 2005 increased $67.2 million by9.3%, to $790.7 million from $723.5 million in 2004. Diluted earnings per share increased 12.4% to $4.36 in2005, as compared to $3.88 in the prior year for the reasons described above, as well as the impact of thereduction in our weighted average shares outstanding for the year. This reduction was the result of our purchasesof treasury shares net of option exercises and share issuances under our employee stock purchase plan.
Financial Results from Operations — 2004 Compared with 2003(Dollars in millions, except per share amounts)
Twelve Months Ended December 31, 2004 2003_____ _____
Revenue .................................................................................................... $9,747.2 $8,621.4Operating Expenses:
Salary and service costs ...................................................................... 6,846.8 5,911.8Office and general expenses ................................................................ 1,685.0 1,617.7______________ ______________
8,531.8 7,529.5______________ ______________Operating Profit ........................................................................................ 1,215.4 1,091.9Net Interest Expense:
Interest expense .................................................................................... 51.1 57.9Interest income .................................................................................... (14.5) (15.1)______________ ______________
36.6 42.8______________ ______________Income before Income Taxes .................................................................... 1,178.8 1,049.1Income Taxes ............................................................................................ 396.3 353.0______________ ______________
Income after Income Taxes ...................................................................... 782.5 696.1
Equity in Earnings of Affiliates ................................................................ 17.1 15.1Minority Interests...................................................................................... (76.1) (80.2)______________ ______________
Net Income .......................................................................................... $ 723.5 $ 631.0______________ ____________________________ ______________Net Income Per Common Share:
Basic .................................................................................................... $3.90 $3.37Diluted.................................................................................................. 3.88 3.37
Dividends Declared Per Common Share .................................................. $0.90 $0.80
The following year-over-year analysis gives further details and insight into the changes in our financialperformance.
Revenue: Our 2004 consolidated worldwide revenue increased 13.1% to $9,747.2 million from $8,621.4million in 2003. Foreign exchange impacts increased worldwide revenue by $390.6 million. The effect ofacquisitions, net of disposals, increased 2004 worldwide revenue by $163.9 million. Organic growth increasedworldwide revenue by $571.3 million. The components of total 2004 revenue growth in the U.S. (“domestic”)and the remainder of the world (“international”) are summarized below (dollars in millions):
Total Domestic International___________________ ___________________ _________________$ % $ % $ %________ _______ ________ _______ ________ _______
December 31, 2003................................ $8,621.4 — $4,720.9 — $3,900.5 —Components of revenue changes:Foreign exchange impact....................... 390.6 4.5% — — 390.6 10.0%Acquisitions ........................................... 163.9 1.9% 131.9 2.8% 32.0 0.8%Organic................................................... 571.3 6.7% 370.6 7.8% 200.7 5.2%______________ _______ ______________ _______ ______________ _______December 31, 2004................................ $9,747.2 13.1% $5,223.4 10.6% $4,523.8 16.0%______________ _______ ______________ _______ ______________ _____________________ _______ ______________ _______ ______________ _______
The components and percentages are calculated as follows:
• The foreign exchange impact component shown in the table is calculated by first converting the currentperiod’s local currency revenue using the average exchange rates from the equivalent prior period toarrive at a constant currency revenue (in this case $9,356.6 million for the Total column in the table).The foreign exchange impact equals the difference between the current period revenue in U.S. Dollars
18
and the current period revenue in constant currency (in this case $9,747.2 million less $9,356.6 millionfor the Total column in the table).
• The acquisition component shown in the table is calculated by aggregating the applicable prior periodrevenue of the acquired businesses. Netted against this number is the revenue of any business includedin the prior period reported revenue that was disposed of subsequent to the prior period.
• The organic component shown in the table is calculated by subtracting both the foreign exchange andacquisition revenue components from total revenue growth.
• The percentage change shown in the table of each component is calculated by dividing the individualcomponent amount by the prior period revenue base of that component (in this case $8,621.4 millionfor the Total column in the table).
The components of revenue and revenue growth for 2004 compared to 2003, in our primary geographicmarkets are summarized below (dollars in millions):
$ Revenue % Growth_________ _________
United States............................................................ $5,223.4 10.6%Euro Markets ........................................................... 2,058.2 15.0%United Kingdom ...................................................... 1,085.0 15.2%Other ........................................................................ 1,380.6 18.1%______________ _______Total ......................................................................... $9,747.2 13.1%______________ _____________________ _______
As indicated, foreign exchange impacts increased our international revenue by $390.6 million for 2004.The most significant impacts resulted from the strengthening of the Euro and the British Pound against the U.S.Dollar, as our operations in these markets represented approximately 70.0% of our international revenue.Additional geographic information relating to our business is contained in Note 5 to our consolidated financialstatements.
Due to a variety of factors, in the normal course, our agencies both gain and lose business from clientseach year. The net result in 2004, and historically each year for us as a whole, was an overall gain in newbusiness. Under our client-centric approach, we seek to broaden our relationships with our largest clients.Revenue from our single largest client represented 4.3% of worldwide revenue in 2004 and 4.7% in 2003 and noother client represented more than 2.8% in 2004 or 2003. Our ten largest and 100 largest clients represented18.3% and 45.1% of our 2004 worldwide revenue, respectively, and 18.7% and 43.1% of our 2003 worldwiderevenue, respectively.
In an effort to monitor the changing needs of our clients and to further expand the scope of our services tokey clients, we monitor revenue across a broad range of disciplines and group them into the following fourcategories: traditional media advertising, customer relationship management, referred to as CRM, publicrelations and specialty communications as summarized below.
(Dollars in millions)Twelve Months Ended December 31,____________________________________________________________________
2004 2003 2004 vs 2003__________________ __________________ ___________________% of % of $ %
Revenue Revenue Revenue Revenue Growth Growth________ ________ ________ ________ _________ _________
Traditional media advertising .............. $4,207.5 43.2% $3,775.7 43.8% $ 431.8 11.4%CRM .................................................... 3,382.6 34.7% 2,953.4 34.2% 429.2 14.5%Public relations .................................... 1,024.0 10.5% 928.6 10.8% 95.4 10.3%Specialty communications .................. 1,133.1 11.6% 963.7 11.2% 169.4 17.6%______________ ______________ ______________
$9,747.2 $8,621.4 $1,125.8 13.1%______________ ______________ ____________________________ ______________ ______________
Certain reclassifications have been made in the tables above to conform the 2004 and 2003 amounts to thecurrent year’s presentation.
19
Operating Expenses: Our 2004 worldwide operating expenses increased $1,002.3 million, or 13.3%, to$8,531.8 million from $7,529.5 million in 2003, as shown below.
(Dollars in millions)Year Ended December 31,_________________________________________________________________________
2004 2003 2004 vs 2003__________________________ __________________________ _________________% of % ofTotal Total
% of Operating % of Operating $ %Revenue Revenue Expenses Revenue Revenue Expenses Growth Growth________ ________ ________ ________ ________ ________ _______ _______
Revenue .......................................... $9,747.2 $8,621.4 $1,125.8 13.1%Operating Expenses:
Salary and service costs.............. 6,846.8 70.2% 80.3% 5,911.8 68.6% 78.5% 935.0 15.8%Office and general expenses ...... 1,685.0 17.3% 19.7% 1,617.7 18.8% 21.5% 67.3 4.2%______________ _______ _______ ______________ _______ _______ ______________ _______
Total Operating Expenses................ 8,531.8 87.5% 7,529.5 87.3% 1,002.3 13.3%Operating Profit .............................. $1,215.4 12.5% $1,091.9 12.7% $ 123.5 11.3%______________ ______________ ____________________________ ______________ ______________
Because we provide professional services, salary and service costs represent the largest part of ouroperating expenses. During 2004, we continued to invest in our businesses and their professional personnel. As apercentage of operating expenses, salary and service costs were 80.3% in 2004 and 78.5% in 2003. These costsare comprised of salary and related costs and direct service costs. Most, or $935.0 million and 93.3%, of the$1,002.3 million increase in operating expenses in 2004 resulted from increases in salary and service costs. Thisincrease was attributable to increased revenue levels and the required increases in direct salary and salary relatedcosts necessary to deliver our services and pursue new business initiatives, including increases in incentivecompensation costs, as well as increases in direct service costs, including freelance labor costs and recruitingcosts. This was partially offset by a reduction in severance costs and the expected positive impact in 2004 ofprevious cost actions. As a result, salary and service costs as a percentage of revenues increased year-to-yearfrom 68.6% in 2003 to 70.2% in 2004.
Office and general expenses represented 19.7% and 21.5% of our operating expenses in 2004 and 2003,respectively. These costs are comprised of office and equipment rent, technology costs and depreciation,amortization of identifiable intangibles, professional fees and other overhead expenses. As a percentage ofrevenue, office and general expenses decreased in 2004 from 18.8% to 17.3% because these costs are relativelyfixed in nature and decrease as a percentage of revenue as revenue increases. In addition, this year-over-yeardecrease resulted from our continuing efforts to better align these costs with business levels on a location-by-location basis. This decrease was partially offset by increased costs incurred in connection with theimplementation of Sarbanes-Oxley Section 404 and $9.9 million of costs incurred in connection with thedisposal of two non-strategic businesses early in 2004.
Included in office and general expense was a net gain of $13.1 million related to investment activity duringthe first quarter of 2004. In March 2004, in connection with Seneca LLC’s recapitalization, we agreed toexchange our remaining preferred stock in Seneca for a $24.0 million senior secured note and 40% of Seneca’soutstanding common stock. The note, which is due in March 2007, bears interest at a rate of 6.25% per annum.The recapitalization transaction was required to be recorded at fair value and, accordingly, we recorded a pre-taxnet gain of $24.0 million. This gain was partially offset by losses of $10.9 million on other cost-basedinvestments unrelated to our investment in Seneca. Additional information appears in Note 6 to our consolidatedfinancial statements.
Excluding the net gain of $13.1 million from investment activity, office and general expenses were 17.4%of revenue in 2004, compared to 18.8% of revenue in 2003, and operating margin decreased to 12.3% of revenuefrom 12.7% of revenue.
Net Interest Expense: Our net interest expense decreased in 2004 to $36.6 million, as compared to $42.8million in 2003. Our gross interest expense decreased by $6.8 million to $51.1 million. This decrease isattributed to a reduction of $5.1 million in the amortization of interest related payments on our convertible notesfrom $28.1 million in 2003 to $23.0 million in 2004 and reductions resulting from cash management effortsduring the course of the year. This reduction was partially offset by an increase in interest expense relative to the€152.4 million 5.20% Notes due to the foreign currency change of the Euro relative to the U.S. Dollar in 2004.
See “Liquidity and Capital Resources” for a discussion of our indebtedness and related matters.
Income Taxes: Our 2004 consolidated effective income tax rate of 33.6% was unchanged from 2003.
20
Liquidity and Capital Resources
Cash Requirements, Including Contractual Obligations
Historically, substantially all of our non-discretionary cash requirements have been funded from operatingcash flow and cash on hand. Our principal non-discretionary funding requirement is our working capital. Inaddition, as discussed below, we have contractual obligations related to our debt and convertible notes, ourrecurring business operations primarily related to lease obligations, as well as certain contingent acquisitionobligations related to acquisitions made in prior years.
Our principal discretionary cash requirements include dividend payments to our shareholders, repurchasesof our common stock, payments for strategic acquisitions and capital expenditures. In 2005 and 2004, ourdiscretionary spending was funded from operating cash flow and cash on hand. However, in any given year,depending on the level of discretionary activity, we may use other sources of available funding, such as theliquidation of short-term investments or the issuance of commercial paper to finance these activities.
We have a seasonal working capital cycle. Working capital requirements are lowest at year-end. Thefluctuation in working capital requirements between the lowest and highest points during the course of the yearcan be more than $1.5 billion during the year. This cycle occurs because our businesses incur costs on behalf ofour clients, including when we place media and incur production costs. We generally require collection from ourclients prior to our payment for the media and production cost obligations. This pattern was similar during thepast three years. During the year we manage liquidity through our credit facilities as discussed below under“Cash Management.” At the end of 2005, our cash and cash equivalents decreased by $329.8 million from theprevious year-end. The components of the decrease are summarized below:
SOURCES
Cash Flow from Operations ................................................................ $ 991.2Add back changes in net working capital at
year-end resulting from the adverse effect of timing of receipts and disbursements in 2005 ................................ 151.2________________
Subtotal, Principal Cash Sources ........................................................ 1,142.4
USES
Capital expenditures ............................................................................ $(162.7)Dividends paid...................................................................................... (164.0)Acquisition payments, net of cash acquired and
proceeds from sale of $29.3 million ................................................ (268.6)Purchase of treasury shares (net of proceeds from
stock option exercises and stock sold in our employee stock purchase plan of $88.1 million) ............................ (643.7)_____________
Subtotal, Principal Discretionary Cash Uses ...................................... (1,239.0)________________Discretionary Cash Uses in excess of Principal
Cash Sources ................................................................................ (96.6)Repayment of long-term debt .............................................................. (188.4)Exchange rate changes ........................................................................ (41.9)Other, net .............................................................................................. (2.9)________________
Decrease in cash and cash equivalents ............................................ $ 329.8________________________________
The Principal Cash Sources and Principal Discretionary Cash Uses numbers presented above arenon-GAAP financial measures. These amounts exclude changes in working capital and certain other investingand financing activities used to fund these working capital changes. This presentation reflects the metrics usedby management to assess our sources and uses of cash and was derived from our consolidated statement of cashflow. We believe that this presentation is meaningful for understanding our primary sources and primary uses ofthat cash flow. Additional information regarding our cash flows can be found in our consolidated financialstatements.
21
Contractual Obligations and Other Commercial Commitments: We enter into numerous contractual andcommercial undertakings in the normal course of our business. The following table summarizes informationabout certain of our obligations as of December 31, 2005 and should be read together with Note 3 (bank loansand lines of credit), Note 4 (long-term debt and convertible notes), Note 10 (commitments and contingentliabilities), Note 11 (fair value of financial instruments) and Note 12 (financial instruments and market risk) toour consolidated financial statements.
Due in Due in DueLess than 1 to 5 after 5 Total
1 Year Years Years Due_________ _________ _________ _________
Contractual Obligations at December 31, 2005 (Dollars in millions)_______________________________________________________________________________________________________________________________
Long-term debt.......................................... $ 1.1 $ 18.2 $ — $ 19.3Convertible notes ...................................... — — 2,339.3 2,339.3Lease obligations....................................... 412.6 1,060.3 783.5 2,256.4Other.......................................................... 16.0 17.0 — 33.0____________ _____________ ______________ ______________Total........................................................... $429.7 $1,095.5 $3,122.8 $4,648.0____________ _____________ ______________ __________________________ _____________ ______________ ______________
As more fully described below under the heading “Debt Instruments, Guarantees and Related Covenants,”the holders of the convertible notes included in the table above have the right to cause us to repurchase up to theentire aggregate face amount of the notes then outstanding for par value at certain dates in the future. If theserights were exercised at the earliest possible future date, as set forth in Note 4 to our consolidated financialstatements, $2,339.3 million of the convertible notes could be due in less than one year in the “Due after 5Years” category above.
Due in Due in DueLess than 1 to 5 after 5 Total
1 Year Years Years Due_________ _________ _________ _________
Other Commercial Commitments at December 31, 2005 (Dollars in millions)_______________________________________________________________________________________________________________________________
Lines of credit ........................................... $ — $ — $ — $ —Guarantees and letters of credit ................ 0.1 0.1 0.0 0.2_______ _______ _______ _______Total........................................................... $0.1 $0.1 $0.0 $0.2_______ _______ _______ ______________ _______ _______ _______
In the normal course of business, our agencies enter into various contractual media commitments on behalfof our clients at levels substantially exceeding our revenue. These commitments are included in our accountspayable balance when the media services are delivered by the providers. Historically, we have not experiencedsignificant losses for media commitments entered into on behalf of our clients and we believe that we do nothave substantial exposure to potential losses of this nature in the future as we monitor closely the creditworthiness of our clients. In the event that we are committed to the media services and our client has not paid us,we believe that the risk of material loss is minimal because in the normal course of business we have reasonableoptions available to us to substantially mitigate potential losses.
Contingent Acquisition Obligations: Certain of our acquisitions are structured with contingent purchaseprice obligations, often referred to as earn-outs. We utilize contingent purchase price structures in an effort tominimize the risk to us associated with potential future negative changes in the performance of the acquiredentity during the post-acquisition transition period. These payments are not contingent upon future employment.The amount of future contingent purchase price payments that we would be required to pay for prioracquisitions, assuming that the businesses perform over the relevant future periods at their current profit levels,is approximately $397 million as of December 31, 2005. The ultimate amounts payable cannot be predicted withreasonable certainty because they are dependent upon future results of operations of subject businesses and aresubject to changes in foreign currency exchange rates. In accordance with U.S. GAAP, we have not recorded aliability for these items on our balance sheet since the definitive amount is not determinable or distributable.Actual results can differ from these estimates and the actual amounts that we pay are likely to be different fromthese estimates. Our obligations change from period to period primarily as a result of payments made during thecurrent period, changes in the acquired entities’ performance and changes in foreign currency exchange rates.
22
These differences could be significant. The contingent purchase price obligations as of December 31, 2005,calculated assuming that the acquired businesses perform over the relevant future periods at their current profitlevels, are as follows:
(Dollars in millions)______________________________________________________________________________________________________2006 2007 2008 2009 Thereafter Total____ ____ ____ ____ _________ _____
$126 $113 $89 $47 $22 $397
In addition, owners of interests in certain of our subsidiaries or affiliates have the right in certaincircumstances to require us to purchase additional ownership interests in those companies. Assuming that thesubsidiaries and affiliates perform over the relevant periods at their current profit levels, the aggregate amountwe could be required to pay in future periods is approximately $272 million, $159 million of which relate toobligations that are currently exercisable. If these rights are exercised, there would be an increase in our netincome as a result of our increased ownership and the reduction of minority interest expense. The ultimateamount payable relating to these transactions will vary because it is primarily dependent on the future results ofoperations of the subject businesses, the timing of the exercise of these rights and changes in foreign currencyexchange rates. The actual amount that we pay is likely to be different from this estimate and the differencecould be significant. The obligations that exist for these agreements as of December 31, 2005, calculated usingthe assumptions above, are as follows:
(Dollars in millions)_______________________________________________________________________________________Currently Not Currently
Exercisable Exercisable Total____________________ _________________________ __________
Subsidiary agencies ............................................................. $116 $108 $224Affiliated agencies............................................................... 43 5 48________ ________ ________Total ..................................................................................... $159 $113 $272________ ________ ________________ ________ ________
Sources and Uses of Cash
Although our cash requirements in 2005 and 2004 were funded by a combination of our operating cashflow and cash on hand, during 2003 and prior years, we have opportunistically accessed the capital markets byissuing convertible debt in an aggregate principle amount of $600 million, $900 million and $850 million in2003, 2002 and 2001, respectively. The proceeds were used for general corporate purposes, including therepayment of maturing debt and the repurchase of our shares.
At December 31, 2005, we had $835.8 million in cash and cash equivalents. In addition, we had $2.5billion in unused committed credit facilities available for immediate use to fund our cash needs. These creditfacilities are more fully described in Note 3 to our consolidated financial statements.
Our operating cash flow and access to the capital markets could be impacted by macroeconomic factorsoutside of our control. Additionally, access to the capital markets could be impaired by adverse changes to theshort and long-term debt ratings assigned to us by independent rating agencies.
Standard and Poor’s Rating Service currently rates our long-term debt A-, Moody’s Investors Service ratesour long-term debt Baa1 and Fitch Ratings rates our long-term debt A-. Our short-term debt ratings are A2, P2and F2 by the respective agencies. Neither our outstanding convertible bonds nor our bank credit facilitiescontain provisions that require acceleration of cash payments should our ratings be downgraded. The interestrates and fees on our bank credit facilities, however, will increase if our long-term debt rating is lowered.
As described in Note 3, our committed bank facilities contain two financial covenants relating to cash flowand interest coverage, which we met by a significant margin as of December 31, 2005.
We believe that our current financial condition provides us with the ability to readily access the capitalmarkets. Also, our cash balances combined with our liquidity of short-term investments, operational cash flowsand unused committed borrowing capacity are sufficient to support our foreseeable cash requirements, arisingfrom working capital, outstanding debt, capital expenditures, dividends, acquisitions and stock repurchases.
Cash Management
We manage our cash and liquidity centrally through treasury centers in North America and Europe. Eachday, operations with excess funds invest these funds with their regional treasury center. Likewise, operations that
23
require funding will borrow funds from their regional treasury center. The treasury centers then aggregate the netposition of the operating companies. The net position is either invested with or borrowed from third partyproviders. To the extent that our treasury centers require liquidity, they have the ability to access local currencylines of credit, our $2.5 billion committed bank facilities, or issue up to $1,500.0 million of U.S. Dollar-denominated commercial paper. This enables us to reduce our consolidated debt levels and minimize interestexpense as well as centrally manage our exposure to foreign exchange.
Our cash and cash equivalents decreased by $329.8 million and our short-term investments decreased by$199.9 million from the prior year. Short-term investments include investments of our excess cash which weexpect to convert into cash in our current operating cycle, generally within one year. A portion of the $1,165.6million in cash and cash equivalents and $574.0 million in short-term investments at December 31, 2004 wereused to repay the maturing €152.4 million, or $185.1 million 5.20% Euro notes.
We manage our net debt position, which we define as total debt outstanding less cash and short-terminvestments, centrally through our treasury centers as discussed above. Our net debt outstanding at December31, 2005 increased $318.2 million as compared to the prior year-end. The components of the increase aresummarized below:
Discretionary Cash Uses in excess of Principal Cash Sources, as calculated in the Cash Requirements section above...................................................... $ 96.6
Working capital requirements ....................................................... 151.2Exchange rate changes.................................................................. 41.9Other, net....................................................................................... 28.5___________Total increase in net debt .............................................................. $318.2______________________
The Discretionary Cash Uses in excess of Principal Cash Sources amount, as previously calculated in theCash Requirements, Including Contractual Obligations section above, is a non-GAAP financial measure. Thisamount excludes changes in working capital and certain other investing and financing activities used to fundthese changes in working capital. This presentation reflects the metrics used by management to assess ourchanges in net debt and was derived from our consolidated statement of cash flow. We believe that thispresentation is meaningful for understanding the changes in our net debt. Additional information regarding ourcash flows can be found in our consolidated financial statements.
Debt Instruments, Guarantees and Related Covenants
We maintain two revolving credit facilities with a consortium of banks providing borrowing capacity of upto $2,500.0 million as described in Note 3 to our consolidated financial statements. These credit facilities areavailable to provide credit support for issuances under our $1,500.0 million commercial paper program, as wellas to provide back-up liquidity in the event any of our convertible bond issues are put back to us. We typicallyfund our daily borrowing needs by issuing commercial paper or by borrowing under our short-term uncommittedlines of credit. Occasionally, we may draw down on our revolving credit facilities. During 2005, we issued andredeemed $43.4 billion of commercial paper. The average term of the commercial paper was 3.0 days. As ofDecember 31, 2005, we had no commercial paper or bank loans outstanding under these credit facilities. AtDecember 31, 2005, we had short-term bank loans of $15.0 million outstanding, which are comprised of bankoverdrafts by our international subsidiaries. These bank overdrafts are treated as unsecured loans pursuant to thesubsidiaries’ bank agreements.
Our credit facilities contain financial covenants that restrict our ability to incur indebtedness as defined inthe agreements. These financial covenants limit the ratio of total consolidated indebtedness to total consolidatedEBITDA (for these purposes, EBITDA is defined as earnings before interest, taxes, depreciation andamortization) to no more than 3.0 times. In addition, they require us to maintain a minimum ratio of EBITDA tointerest expense of at least 5.0 times. At December 31, 2005, we were in compliance with these covenants, asour ratio of debt to EBITDA was 1.6 times and our ratio of EBITDA to interest expense was 19.4 times.
At December 31, 2005, we had a total of $2,339.3 million aggregate principal amount of convertible notesoutstanding, including $847.0 million Liquid Yield Option Notes due 2031 (“2031 Notes”), which were issued inFebruary 2001, $892.3 million Zero Coupon Zero Yield Convertible Notes due 2032 (“2032 Notes”), whichwere issued in March 2002 and $600.0 million Zero Coupon Zero Yield Convertible Notes dues 2033 (“2033Notes”), which were issued in June 2003.
24
The holders of our 2031 Notes have the right to cause us to repurchase up to the entire aggregate faceamount of the notes then outstanding for par value in February of each year beginning in 2006. The holders ofour 2032 Notes have the right to cause us to repurchase up to the entire aggregate face amount of the notes thenoutstanding for par value in August of each year. The holders of our 2033 Notes have the right to cause us torepurchase up to the entire aggregate face amount of the notes then outstanding for par value on June 15, 2006,2008, 2010, 2013, 2018, 2023 and on each June 15 annually thereafter through June 15, 2032. The 2031 Notes,the 2032 Notes and the 2033 Notes are convertible, at specified ratios, only upon the occurrence of certainevents, including: if our common shares trade above certain levels, if we effect extraordinary transactions or, inthe case of the 2031 Notes and the 2032 Notes, if our long-term debt ratings are downgraded to BBB or lowerby Standard & Poor’s Ratings Service, or Baa3 or lower by Moody’s Investors Service or in the case of the 2033Notes, to BBB- or lower by S&P, and Ba1 or lower by Moody’s. These events would not, however, result in anadjustment of the number of shares issuable upon conversion and would not accelerate the holder’s right to causeus to repurchase the notes. For additional information about the terms of these notes, see Note 4 to ourconsolidated financial statements.
On August 12, 2004, we paid $25.4 million to qualified noteholders of our 2032 Notes, equal to $27.50per $1,000 principal amount of notes, as an incentive to the holders not to exercise their put right and to consentto an amendment to the indenture. This payment was being amortized over the 12-month period ended August2005. Under the amendment, we will pay cash to noteholders for the initial principal amount of the notessurrendered for conversion. The remainder of the conversion value would be paid in cash or shares at our option.We have also amended the method by which we will pay contingent interest.
On November 16, 2004, we paid $1.2 million to qualified noteholders of our 2033 Notes as an incentive tothe holders to consent to an amendment to the indenture. At later dates in November and December 2004, wepaid an additional $0.3 million to the remaining qualified noteholders. These payments are being amortizedratably through the next put date of June 2006. Under the amendment, we will pay cash to noteholders for theinitial principal amount of the notes surrendered for conversion. The remainder of the conversion value would bepaid in cash or shares at our option.
On November 30, 2004, we paid $14.8 million to qualified noteholders of our 2031 Notes as an incentiveto the holders not to exercise their February 2005 put right and to consent to an amendment to the indenture.This payment is being amortized ratably through the next put date in February 2006. Under the amendment, wewill pay cash to noteholders for the initial principal amount of the notes surrendered for conversion. Theremainder of the conversion value would be paid in cash or shares at our option. We also amended the methodby which we will pay contingent interest.
In June 2005, upon maturity, we redeemed our Euro-denominated bonds for $185.1 million. The bondspaid a fixed rate of 5.2% to maturity.
On August 2, 2005, we paid $33.5 million to qualified noteholders of our 2032 Notes, equal to $37.50 per$1,000 principal amount of notes, as an incentive to the holders not to exercise their put right. This payment isbeing amortized over the 12-month period ending in August 2006.
In February 2006, we paid $39.2 million to qualified noteholders of our 2031 Notes as an incentive to theholders not to exercise their February 2006 put right. This payment is being amortized ratably through the nextput date in February 2007.
Our outstanding debt and amounts available under these facilities as of December 31, 2005 (dollars inmillions) were as follows:
Debt AvailableOutstanding Credit___________ _________
Bank loans (due in less than 1 year) .................................................... $ 15.0 —Commercial Paper issued under
$2,100.0 Million Revolver — due May 23, 2010............................ — $2,100.0$400.0 Million Facility — due June 29, 2006 ................................ — 400.0
Convertible notes — due February 7, 2031 ........................................ 847.0 —Convertible notes — due July 31, 2032 .............................................. 892.3 —Convertible notes — due June 15, 2033 .............................................. 600.0 —Other debt ............................................................................................ 19.3 —______________ ______________Total...................................................................................................... $2,373.6 $2,500.0______________ ____________________________ ______________
25
Additional information about our indebtedness is included in Notes 3 and 4 to our consolidated financialstatements.
7A. Quantitative and Qualitative Disclosures Regarding Market Risk
Foreign Exchange: Our results of operations are subject to risk from the translation to the U.S. Dollar ofthe revenue and expenses of our foreign operations, which are generally denominated in the local currency. Theeffects of currency exchange rate fluctuation on the translation of our results of operations are discussed in Note12 of our consolidated financial statements. For the most part, our revenues and the expenses incurred related tothose revenues are denominated in the same currency. This minimizes the impact that fluctuations in exchangerates will have on our net income.
While our agencies conduct business in more than 70 different currencies, our major non-U.S. currencymarkets are the European Monetary Union (EMU), the United Kingdom, Japan, Brazil and Canada. As anintegral part of our treasury operations, we enter into short-term forward foreign exchange contracts whichmanage the foreign exchange risk of the intercompany cash movements between subsidiaries operating indifferent currency markets from that of our treasury centers from which they borrow or invest. In the limitednumber of instances where operating expenses and revenues are not denominated in the same currency, amountsare promptly settled or hedged in the foreign currency market with forward contracts. At December 31, 2005, wehad forward foreign exchange contracts outstanding with an aggregate notional principal of $50.4 millionmitigating the foreign exchange risk of these intercompany cash movements. The majority of the contracts weredenominated in our major international market currencies with maturities ranging from 2 to 365 days with anaverage duration of less than 30 days.
In addition to hedging intercompany cash movements, we enter into short-term forward foreign exchangecontracts which hedge U.S. Dollar commercial paper issued by our London treasury center, whose functionalcurrency is the British Pound. At December 31, 2005, we had no forward contracts outstanding relating to thisactivity as there was no commercial paper outstanding.
Additionally, at December 31, 2005 we had cross-currency interest rate swaps in place with an aggregatenotional principal amount of €230.0 million (Euro) maturing in 2010. At December 31, 2004, we had JapaneseYen-based interest rate swaps which matured during the second and third quarters of 2005 and were notreplaced. See Note 12 to our consolidated financial statements for information about the fair value of each typeof derivative instrument.
The forward foreign exchange and swap contracts discussed above were entered into for the purpose ofhedging certain specific currency risks. These risks are primarily the result of the temporary movement of moneyfrom one local market to another as part of our cash management program. As a result of these financialinstruments, we reduced financial risk in exchange for foregoing any gain (reward) which might have occurred ifthe markets moved favorably. In using these contracts, we exchanged the risks of the financial markets forcounterparty risk. To minimize counterparty risk, we only enter into these contracts with major well-knownbanks and financial institutions that have credit ratings equal to or better than our credit rating.
These hedging activities are confined to risk management activities related to our international operations.We have established a centralized reporting system to evaluate the effects of changes in interest rates, currencyexchange rates and other relevant market risks. We periodically determine the potential loss from market risk byperforming a value-at-risk computation. Value-at-risk analysis is a statistical model that utilizes historic currencyexchange and interest rate data to measure the potential impact on future earnings of our existing portfolio ofderivative financial instruments. The value-at-risk analysis we performed on our December 31, 2005 portfolio ofderivative financial instruments indicated that the risk of loss was immaterial. This overall system is designed toenable us to initiate remedial action, if appropriate.
Debt Instruments: Our bank credit facilities mentioned above are available to provide credit support forissuances of commercial paper, as well as to provide back-up liquidity in the event any of our convertible bondissues are put back to us. We currently have a $400.0 million 364-day facility with a one-year term out optionexpiring on June 29, 2006 and a $2,100.0 million 5-year facility expiring on May 23, 2010. Accordingly, wehave the ability to classify outstanding borrowings, if any, under these facilities as long-term debt.
26
Our bank syndicates typically include large global banks such as Citibank, JP Morgan Chase, HSBC, ABNAmro, Societe Generale, Barclays, Bank of America and BBVA. We also include large regional banks in theU.S. such as Wachovia, US Bancorp, Northern Trust, PNC and Wells Fargo. We also include banks that have amajor presence in countries where we conduct business such as Sumitomo in Japan, Fortis in Belgium, SanPaolo in Italy, Scotia in Canada and Westpac in Australia.
Our other long-term debt consists principally of convertible notes. The holders of these convertible noteshave the right on specific dates to cause us to repurchase up to the aggregate face amount as previouslydiscussed. We may offer the holders of our convertible notes a cash payment or other incentives to induce themnot to put the convertible notes to us in advance of a put date. If we were to decide to pay a cash incentive, theamount of the incentive incurred would be based on a combination of market factors, principally short-terminterest rates and our stock price.
If the convertible notes are put back to us, our interest expense could increase. The extent, if any, of theincrease in interest expense will depend on the portion of the amount repurchased that was refinanced, when werefinance, the type of instrument we use to refinance and the term of the instrument.
The incentive payments made in 2004 and 2005 to qualified noteholders, as described above under “DebtInstruments, Guarantees and Related Covenants,” are one method of keeping the convertible notes outstanding.If we are required to satisfy a put, based on our current financial condition and expectations, we expect to havesufficient available cash and unused credit commitments to fund any put, while still preserving ample capacityunder these commitments to meet our cash requirements for the normal course of our business operations afterthe put event.
Our credit commitments allow either the issuance of commercial paper or bank loans, and we would likelyfund the put initially using some combination of these instruments. We would then evaluate all fundingalternatives available to us to replenish our credit capacity and liquidity. We believe the funding alternativeswould include substantially all forms of debt, equity and convertible instruments available to us by accessing thepublic or private capital markets. Our evaluation would likely include the expected cash flows from the normalcourse of our business operations and the credit capacity to fund additional potential puts on the remainingoutstanding convertible notes.
If we were to replace the convertible notes with another form of debt on a dollar-for-dollar basis, it wouldhave no impact on either our debt to capital ratios or our debt to EBITDA ratio. If we were to replace ourconvertible notes with interest-bearing debt at prevailing rates, we do not expect any negative impact to ourcredit ratings. However, a potential increase in interest expense would negatively impact our coverage ratios,such as EBITDA to interest expense, if the replacement debt were at higher rates. Currently our coverage ratiosapplicable to our current rating levels are well above the thresholds. Based on present expectations of our futureoperating cash flows and expected access to debt and equity capital markets, we believe any increase in interestexpense and reduction in coverage ratios would still place us comfortably above the coverage ratio requirements.Thus, we do not expect any negative impact on our credit ratings if the convertible notes are put to us.
8. Financial Statements and Supplementary Data
Our financial statements and supplementary data are included at the end of this report beginning on pageF-1. See the index appearing on the following pages of this report.
9. Changes in and Disagreements with Accountants on Accounting and Financial Disclosure
None.
9A. Controls and Procedures
We have established and continue to maintain disclosure controls and procedures and internal control overfinancial reporting designed to ensure that information required to be disclosed in our SEC reports is recorded,processed, summarized and reported within applicable time periods. We conducted an evaluation of theeffectiveness of our disclosure controls and procedures as of December 31, 2005. Based on that evaluation, ourCEO and CFO concluded that as of December 31, 2005, our disclosure controls and procedures are effective toensure that decisions can be made timely with respect to required disclosures, as well as ensuring that the
27

recording, processing, summarization and reporting of information required to be included in our Annual Reporton Form 10-K for the year ended December 31, 2005 is appropriate. Omnicom management is responsible forestablishing and maintaining adequate internal control over financial reporting, as such term is defined inExchange Act Rule 13a-15(f). Under the supervision of management and with the participation of our CEO,CFO and our agencies, we conducted an evaluation of the effectiveness of our internal control over financialreporting based on the framework in Internal Control – Integrated Framework issued by the Committee ofSponsoring Organizations of the Treadway Commission published in 1987. Based on that evaluation,management concluded that our internal control over financial reporting was effective as of December 31, 2005.KPMG LLP, an independent registered public accounting firm that audited our consolidated financial statementsincluded in this Annual Report on Form 10-K, has issued an attestation report on management’s assessment ofOmnicom’s internal control over financial reporting as of December 31, 2005, dated February 24, 2006. Therehave not been any changes in our internal control over financial reporting that occurred during our fourth fiscalquarter that have materially affected or are reasonably likely to materially affect our internal controls overfinancial reporting.
9B. Other Information
None.
28
PART IV
15. Exhibits, Financial Statement Schedules, and Reports on Form 8-K
(a)(1) Financial Statements: Page_____
Management Report on Internal Controls Over Financial Reporting ................................................ F-1Report of Independent Registered Public Accounting Firm .............................................................. F-2Report of Independent Registered Public Accounting Firm .............................................................. F-3Consolidated Statements of Income for the Three Years Ended December 31, 2005 ........................ F-4Consolidated Balance Sheets as of December 31, 2005 and 2004 .................................................... F-5Consolidated Statements of Shareholders’ Equity for the Three Years Ended
December 31, 2005.......................................................................................................................... F-6Consolidated Statements of Cash Flows for the Three Years Ended December 31, 2005 ................ F-7Notes to Consolidated Financial Statements ...................................................................................... F-8Quarterly Results of Operations (Unaudited) .................................................................................... F-31
(a)(2) Financial Statement Schedules:Schedule II — Valuation and Qualifying Accounts (for the three years ended
December 31, 2005) ........................................................................................................................ S-1
All other schedules are omitted because they are not applicable.
(a)(3) Exhibits:Exhibit
Numbers Description_______ _________(3)(i) Restated Certificate of Incorporation (Exhibit 3.1 to our Quarterly Report on Form 10-Q for
the quarter ended June 30, 2003 (the “6-30-03 10-Q”) and incorporated herein by reference).
(ii) By-laws (Exhibit 3.2 to our 6-30-03 10-Q) and incorporated herein by reference (File No.1-10551).
4.1 Indenture, dated February 7, 2001, between JPMorgan Chase Manhattan Bank, as trustee,and us in connection with our issuance of $850,000,000 Liquid Yield Option Notes due 2031(the “2031 Indenture”) (Exhibit 4.1 to our Registration Statement on Form S-3 (RegistrationNo. 333-55386) and incorporated herein by reference).
4.2 Form of Liquid Yield Option Notes due 2031 (included in Exhibit 4.1 above).
4.3 First Supplemental Indenture to the 2031 Indenture, dated as of February 13, 2004, amongus, Omnicom Capital Inc., Omnicom Finance Inc. and JPMorgan Chase Bank (Exhibit 4.3 toour Registration Statement on Form S-3 (Registration No. 112840) and incorporated hereinby reference).
4.4 Second Supplemental Indenture to the 2031 Indenture, dated November 4, 2004, amongOmnicom Group Inc., Omnicom Capital Inc., Omnicom Finance Inc. and JPMorgan ChaseBank, as trustee, to the 2031 Indenture, as amended by the First Supplemental Indenture tothe 2031 Indenture, dated February 13, 2004 (Exhibit 4.2 to our Quarterly Report on Form10-Q for the quarter ended September 30, 2004 (the “9-30-04 10-Q”) and incorporatedherein by reference).
4.5 Third Supplemental Indenture to the 2031 Indenture, dated November 30, 2004, among us,Omnicom Capital Inc., Omnicom Finance Inc., and JP Morgan Chase Bank, N.S., as trustee,to the 2031 Indenture, as amended by the First Supplemental Indenture to the 2031Indenture dated February 13, 2004, and the Second Supplemental Indenture to the 2031Supplemental Indenture dated November 4, 2004 (Exhibit 4.1 to the Form 8-K (RegistrationNo. 1-10551) dated November 30, 2004 and incorporated herein by reference).
4.6 Indenture, dated March 6, 2002, between JPMorgan Chase Bank as trustee and us inconnection with our issuance of $900,000,000 Zero Coupon Zero Yield Convertible notesdue 2032 (the “2032 Indenture”) (Exhibit 4.6 to our Annual Report on Form 10-K for theyear ended December 31, 2001 and incorporated herein by reference).
29
4.7 Form of Zero Coupon Zero Yield Convertible Notes due 2032 (included in Exhibit 4.6above).
4.8 First Supplemental Indenture to the 2032 Indenture, dated as of February 13, 2004, amongus, Omnicom Capital Inc., Omnicom Finance Inc. and JPMorgan Chase Bank (Exhibit 4.3 toour Registration Statement on Form S-3 (Registration No. 112841) and incorporated hereinby reference).
4.9 Second Supplemental Indenture to the 2032 Indenture, dated August 12, 2004, among us,Omnicom Capital Inc., Omnicom Finance Inc., and JPMorgan Chase Bank, as trustee, to the2032 Indenture, as amended by the First Supplemental Indenture to the 2032 Indenture,dated February 13, 2004 (Exhibit 4.1 to our 9-30-04 10-Q and incorporated herein byreference).
4.10 Third Supplemental Indenture to the 2032 Indenture, dated November 4, 2004, among us,Omnicom Capital Inc., Omnicom Finance Inc. and JPMorgan Chase Bank, as trustee, to the2032 Indenture, as amended by the First Supplemental Indenture to the 2032 Indenture,dated as of February 13, 2004, and the Second Supplemental Indenture to the 2032Indenture, dated August 12, 2004 (Exhibit 4.3 to our 9-30-04 10-Q and incorporated hereinby reference).
4.11 Indenture, dated as of June 30, 2003, between JPMorgan Chase Bank, as trustee, and us inconnection with our issuance of $600,000,000 Zero Coupon Zero Yield Convertible Notesdue 2033 (the “2033 Indenture”) (Exhibit 4.1 to our Registration Statement on Form S-3(Registration No. 333-108611) and incorporated herein by reference).
4.12 Form of the Zero Coupon Zero Yield Convertible Notes due 2033 (included in Exhibit 4.11above).
4.13 First Supplemental Indenture, to the 2033 Indenture, dated as of November 5, 2003, amongus, Omnicom Capital Inc., Omnicom Finance Inc. and JPMorgan Chase Bank, as trustee,(Exhibit 4.4 to our Registration Statement on Form S-3 (Registration No. 333-108611) andincorporated herein by reference).
4.14 Second Supplemental Indenture to the 2033 Indenture, dated as of November 4, 2004,among us, Omnicom Capital Inc., Omnicom Finance Inc. and JPMorgan Chase Bank, astrustee, as amended by the First Supplemental Indenture to the 2033 Indenture, datedNovember 5, 2003 (Exhibit 4.4 to our 9-30-04 10-Q and incorporated herein by reference).
4.15 Third Supplemental Indenture to the 2033 Indenture, dated November 10, 2004, among us,Omnicom Capital Inc., Omnicom Finance Inc. and JPMorgan Chase Bank, as trustee, to the2033 Indenture, as amended by the First Supplemental Indenture to the 2033 Indenture,dated November 5, 2003, and the Second Supplemental Indenture to the 2033 Indenturedated November 4, 2004 (Exhibit 4.1 to the Form 8-K (Registration No. 1-10551) datedNovember 10, 2004 and incorporated herein by reference).
10.1 Amended and Restated Five Year Credit Agreement (the “Agreement”), dated as of May 23,2005, by and among Omnicom Finance Inc., Omnicom Capital Inc., Omnicom FinancePLC, Omnicom Group Inc., the banks, financial institutions and other institutional lendersand initial issuing banks listed on the signature pages of the Agreement, Citigroup GlobalMarkets Inc. and J.P. Morgan Securities Inc., as lead arrangers and book managers, ABNAmro Bank N.V., as syndication agent, JPMorgan Chase Bank, N.A. and HSBC Bank USA,N.V., as documentation agents and Citibank, N.A., as administrative agent for the lenders(Exhibit 10.2 to the Form 8-K dated May 26, 2005 (Registration No. 001-10551) andincorporated herein by reference).
10.2 364-day Credit Agreement (the “Credit Agreement”), dated as of June 30, 2005, by andamong Omnicom Group Inc., Omnicom Finance Inc., Omnicom Capital Inc., OmnicomFinance PLC, the lenders named in the Credit Agreement (the “Lenders”), Citigroup GlobalMarkets Inc. and J.P. Morgan Securities Inc., as lead arrangers and book managers, ABNAmro Bank N.V., as syndication agent and JPMorgan Chase Bank N.A., Bank of America,N.A. and Balco Bilbao Vizcaya Argentaria, as documentation agents, and Citibank, N.A. asadministrative agent for the Lenders (Exhibit 10.1 to the Form 8-K dated June 30, 2005(Registration No. 001-10551) and incorporated herein by reference).
30
10.3 Amended and Restated 1998 Incentive Compensation Plan (Exhibit B to our ProxyStatement filed on April 10, 2000 and incorporated herein by reference).
10.4 Director Equity Plan for Non-employee Directors (Appendix B to our Proxy Statement filedon April 23, 2004 and incorporated herein by reference).
10.5 Standard form of our Executive Salary Continuation Plan Agreement (Exhibit 10.24 to ourAnnual Report on Form 10-K for the year ended December 31, 1998 and incorporatedherein by reference).
10.6 Standard form of the Director Indemnification Agreement (Exhibit 10.25 to our AnnualReport on Form 10-K for the year ended December 31, 1989 and incorporated herein byreference).
10.7 Long-Term Shareholder Value Plan (Exhibit 4.4 to our Registration Statement on Form S-8(Registration No. 333-84498) and incorporated herein by reference).
10.8 Executive Salary Continuation Plan Agreement — John Wren (Exhibit 10.7E to our 6-30-0210-Q and incorporated herein by reference).
10.9 Equity Incentive Plan (Exhibit 4.3 to our Registration Statement on Form S-8 dated August18, 2003 (File No. 333-108063) and incorporated herein by reference).
10.10 Executive Salary Continuation Plan Agreement — Kenneth R. Kaess (Exhibit 10.3 to our6-30-04 10-Q and incorporated herein by reference).
10.11 Employment Agreement, dated as of April 22, 2005, among Omnicom Group Inc., TBWAWorldwide Inc. and Jean-Marie Dru (Exhibit 10.1 to the Form 8-K dated April 28, 2005(Registration No. 001-10551) and incorporated herein by reference).
10.12 Executive Salary Continuation Plan Agreement — Jean-Marie Dru (Exhibit 10.1 to ourQuarterly Report on Form 10-Q for the period ended March 31, 2005 (Registration No.001-10551) (the “3-31-05 10-Q”) and incorporated herein by reference).
10.13 Executive Salary Continuation Plan Agreement — Andrew Robertson (Exhibit 10.2 to the3-31-05 10-Q and incorporated herein by reference).
10.14 Executive Salary Continuation Plan Agreement — Randall Weisenburger (Exhibit 10.3 tothe 3-31-05 10-Q and incorporated herein by reference).
10.15 Senior Management Incentive Plan (Exhibit 10.1 to the Form 8-K dated May 26, 2005(Registration No. 001-10551) and incorporated herein by reference).
12.1 Ratio of Earnings to Fixed Charges.
21.1 Subsidiaries of the Registrant.
23.1 Consent of KPMG LLP.
31.1 Certification of Chief Executive Officer and President required by Rule 13a-14(a) under theSecurities Exchange Act of 1934, as amended.
31.2 Certification of Executive Vice President and Chief Financial Officer required by Rule13a-14(a) under the Securities Exchange Act of 1934, as amended.
32.1 Certification of the Chief Executive Officer and President and the Executive Vice Presidentand Chief Financial Officer required by Rule 13a-14(b) under the Securities Exchange Actof 1934, as amended, and 18 U.S.C §1350.
31
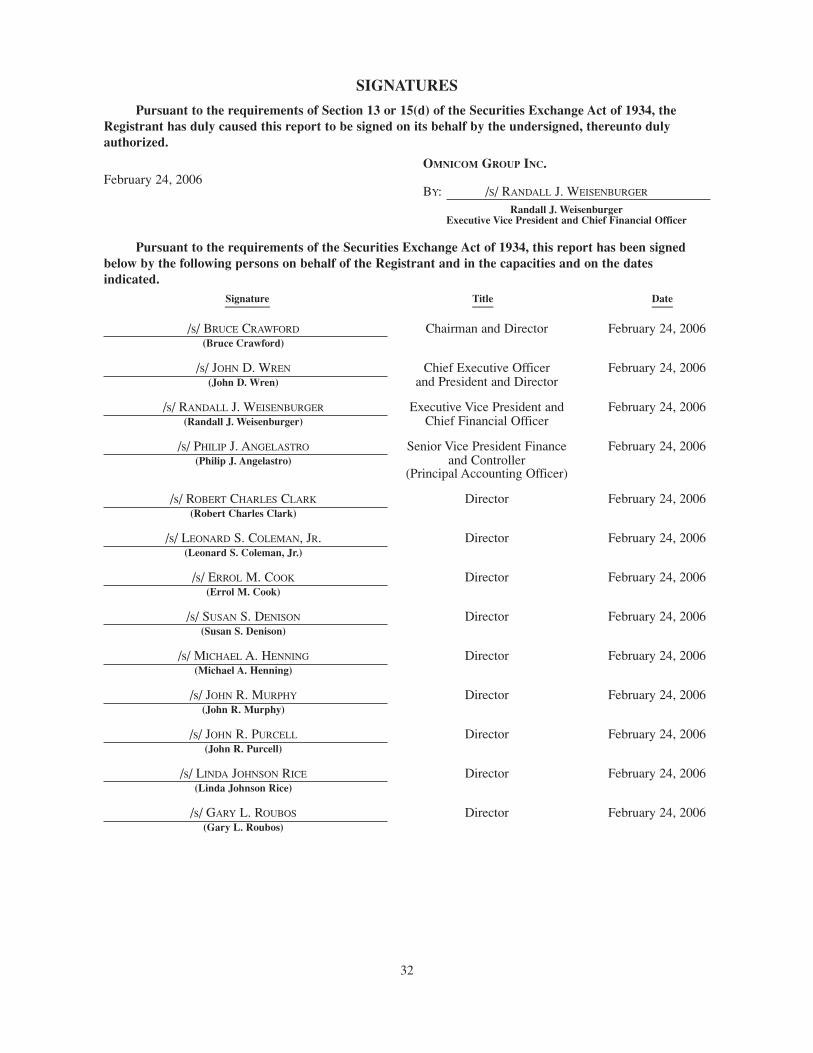
SIGNATURES
Pursuant to the requirements of Section 13 or 15(d) of the Securities Exchange Act of 1934, theRegistrant has duly caused this report to be signed on its behalf by the undersigned, thereunto dulyauthorized.
OMNICOM GROUP INC.February 24, 2006
BY: /S/ RANDALL J. WEISENBURGER
Randall J. WeisenburgerExecutive Vice President and Chief Financial Officer
Pursuant to the requirements of the Securities Exchange Act of 1934, this report has been signedbelow by the following persons on behalf of the Registrant and in the capacities and on the datesindicated.
Signature Title Date_________________ ________ ________
/s/ BRUCE CRAWFORD Chairman and Director February 24, 2006(Bruce Crawford)
/s/ JOHN D. WREN Chief Executive Officer February 24, 2006(John D. Wren) and President and Director
/s/ RANDALL J. WEISENBURGER Executive Vice President and February 24, 2006(Randall J. Weisenburger) Chief Financial Officer
/s/ PHILIP J. ANGELASTRO Senior Vice President Finance February 24, 2006(Philip J. Angelastro) and Controller
(Principal Accounting Officer)
/s/ ROBERT CHARLES CLARK Director February 24, 2006(Robert Charles Clark)
/s/ LEONARD S. COLEMAN, JR. Director February 24, 2006(Leonard S. Coleman, Jr.)
/s/ ERROL M. COOK Director February 24, 2006(Errol M. Cook)
/s/ SUSAN S. DENISON Director February 24, 2006(Susan S. Denison)
/s/ MICHAEL A. HENNING Director February 24, 2006(Michael A. Henning)
/s/ JOHN R. MURPHY Director February 24, 2006(John R. Murphy)
/s/ JOHN R. PURCELL Director February 24, 2006(John R. Purcell)
/s/ LINDA JOHNSON RICE Director February 24, 2006(Linda Johnson Rice)
/s/ GARY L. ROUBOS Director February 24, 2006(Gary L. Roubos)
32
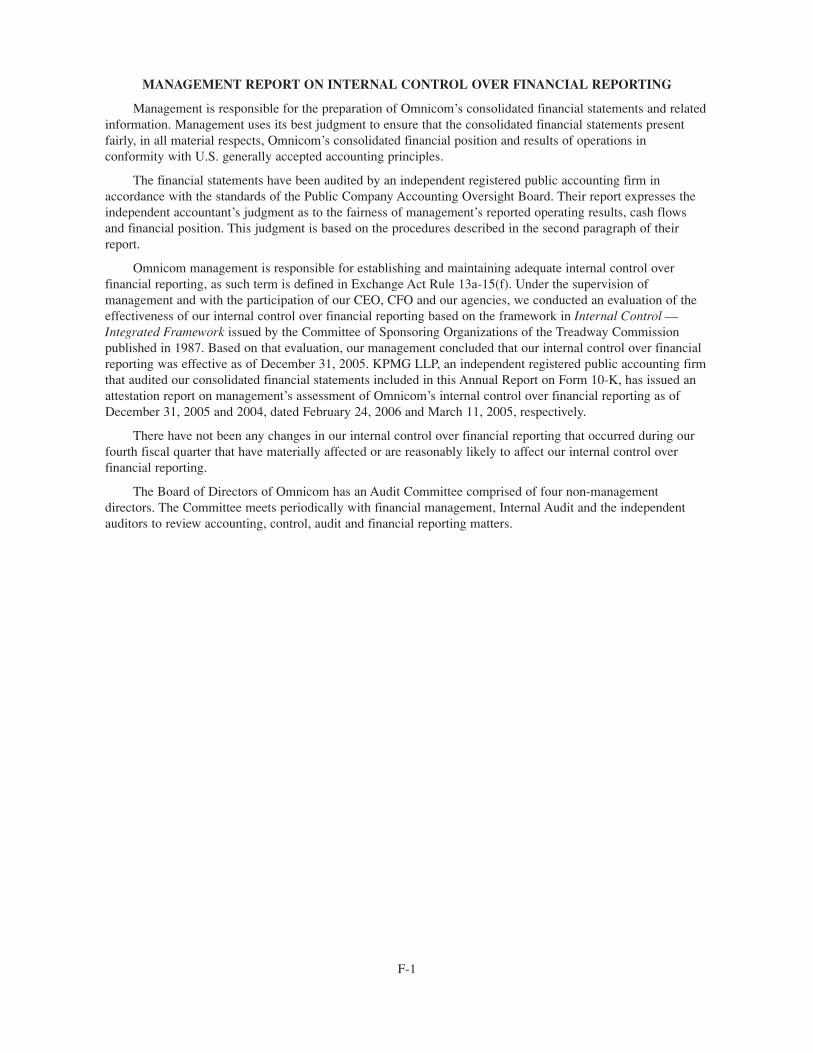
F-1
MANAGEMENT REPORT ON INTERNAL CONTROL OVER FINANCIAL REPORTING
Management is responsible for the preparation of Omnicom’s consolidated financial statements and relatedinformation. Management uses its best judgment to ensure that the consolidated financial statements presentfairly, in all material respects, Omnicom’s consolidated financial position and results of operations inconformity with U.S. generally accepted accounting principles.
The financial statements have been audited by an independent registered public accounting firm inaccordance with the standards of the Public Company Accounting Oversight Board. Their report expresses theindependent accountant’s judgment as to the fairness of management’s reported operating results, cash flowsand financial position. This judgment is based on the procedures described in the second paragraph of theirreport.
Omnicom management is responsible for establishing and maintaining adequate internal control overfinancial reporting, as such term is defined in Exchange Act Rule 13a-15(f). Under the supervision ofmanagement and with the participation of our CEO, CFO and our agencies, we conducted an evaluation of theeffectiveness of our internal control over financial reporting based on the framework in Internal Control —Integrated Framework issued by the Committee of Sponsoring Organizations of the Treadway Commissionpublished in 1987. Based on that evaluation, our management concluded that our internal control over financialreporting was effective as of December 31, 2005. KPMG LLP, an independent registered public accounting firmthat audited our consolidated financial statements included in this Annual Report on Form 10-K, has issued anattestation report on management’s assessment of Omnicom’s internal control over financial reporting as ofDecember 31, 2005 and 2004, dated February 24, 2006 and March 11, 2005, respectively.
There have not been any changes in our internal control over financial reporting that occurred during ourfourth fiscal quarter that have materially affected or are reasonably likely to affect our internal control overfinancial reporting.
The Board of Directors of Omnicom has an Audit Committee comprised of four non-managementdirectors. The Committee meets periodically with financial management, Internal Audit and the independentauditors to review accounting, control, audit and financial reporting matters.
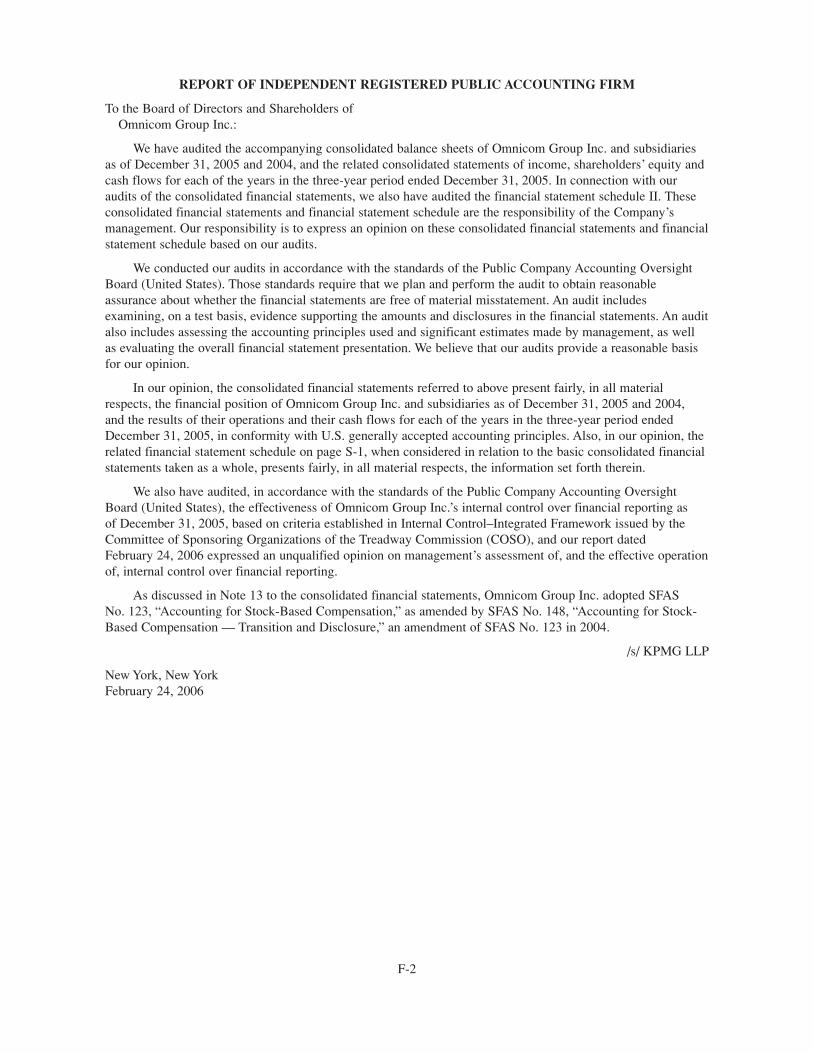
F-2
REPORT OF INDEPENDENT REGISTERED PUBLIC ACCOUNTING FIRM
To the Board of Directors and Shareholders ofOmnicom Group Inc.:
We have audited the accompanying consolidated balance sheets of Omnicom Group Inc. and subsidiariesas of December 31, 2005 and 2004, and the related consolidated statements of income, shareholders’ equity andcash flows for each of the years in the three-year period ended December 31, 2005. In connection with ouraudits of the consolidated financial statements, we also have audited the financial statement schedule II. Theseconsolidated financial statements and financial statement schedule are the responsibility of the Company’smanagement. Our responsibility is to express an opinion on these consolidated financial statements and financialstatement schedule based on our audits.
We conducted our audits in accordance with the standards of the Public Company Accounting OversightBoard (United States). Those standards require that we plan and perform the audit to obtain reasonableassurance about whether the financial statements are free of material misstatement. An audit includesexamining, on a test basis, evidence supporting the amounts and disclosures in the financial statements. An auditalso includes assessing the accounting principles used and significant estimates made by management, as wellas evaluating the overall financial statement presentation. We believe that our audits provide a reasonable basisfor our opinion.
In our opinion, the consolidated financial statements referred to above present fairly, in all materialrespects, the financial position of Omnicom Group Inc. and subsidiaries as of December 31, 2005 and 2004,and the results of their operations and their cash flows for each of the years in the three-year period endedDecember 31, 2005, in conformity with U.S. generally accepted accounting principles. Also, in our opinion, therelated financial statement schedule on page S-1, when considered in relation to the basic consolidated financialstatements taken as a whole, presents fairly, in all material respects, the information set forth therein.
We also have audited, in accordance with the standards of the Public Company Accounting OversightBoard (United States), the effectiveness of Omnicom Group Inc.’s internal control over financial reporting asof December 31, 2005, based on criteria established in Internal Control–Integrated Framework issued by theCommittee of Sponsoring Organizations of the Treadway Commission (COSO), and our report datedFebruary 24, 2006 expressed an unqualified opinion on management’s assessment of, and the effective operationof, internal control over financial reporting.
As discussed in Note 13 to the consolidated financial statements, Omnicom Group Inc. adopted SFASNo. 123, “Accounting for Stock-Based Compensation,” as amended by SFAS No. 148, “Accounting for Stock-Based Compensation — Transition and Disclosure,” an amendment of SFAS No. 123 in 2004.
/s/ KPMG LLP
New York, New YorkFebruary 24, 2006
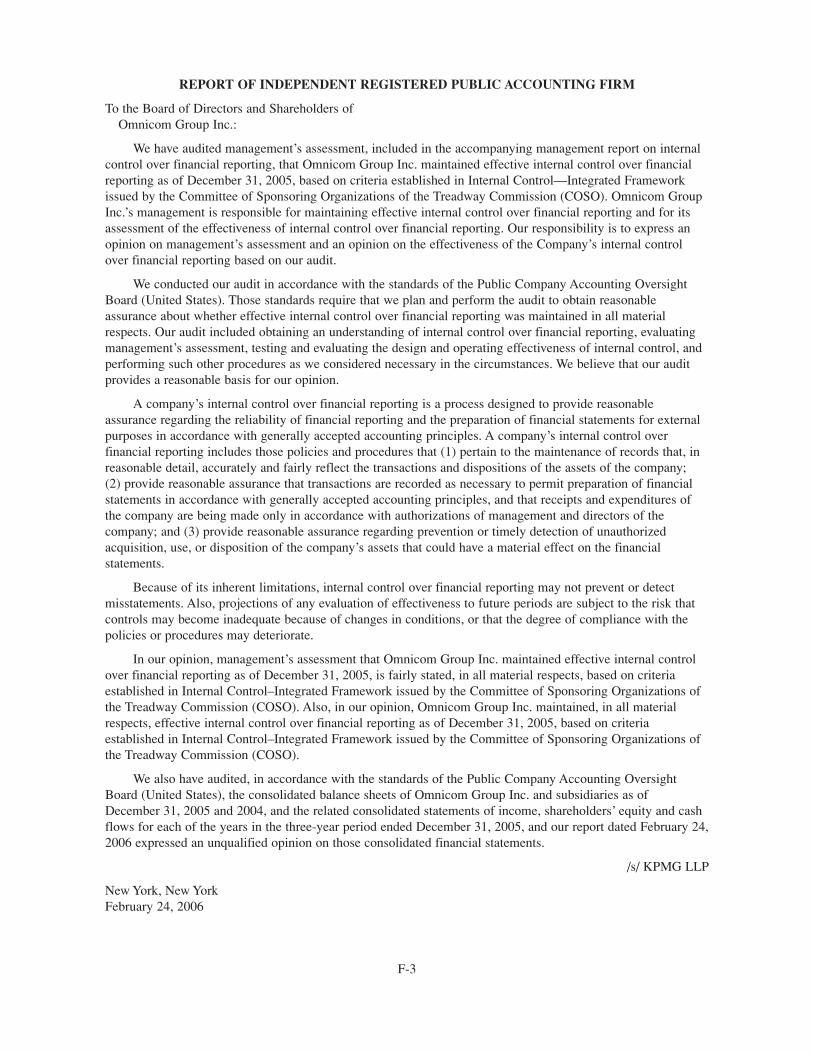
F-3
REPORT OF INDEPENDENT REGISTERED PUBLIC ACCOUNTING FIRM
To the Board of Directors and Shareholders ofOmnicom Group Inc.:
We have audited management’s assessment, included in the accompanying management report on internalcontrol over financial reporting, that Omnicom Group Inc. maintained effective internal control over financialreporting as of December 31, 2005, based on criteria established in Internal Control—Integrated Frameworkissued by the Committee of Sponsoring Organizations of the Treadway Commission (COSO). Omnicom GroupInc.’s management is responsible for maintaining effective internal control over financial reporting and for itsassessment of the effectiveness of internal control over financial reporting. Our responsibility is to express anopinion on management’s assessment and an opinion on the effectiveness of the Company’s internal controlover financial reporting based on our audit.
We conducted our audit in accordance with the standards of the Public Company Accounting OversightBoard (United States). Those standards require that we plan and perform the audit to obtain reasonableassurance about whether effective internal control over financial reporting was maintained in all materialrespects. Our audit included obtaining an understanding of internal control over financial reporting, evaluatingmanagement’s assessment, testing and evaluating the design and operating effectiveness of internal control, andperforming such other procedures as we considered necessary in the circumstances. We believe that our auditprovides a reasonable basis for our opinion.
A company’s internal control over financial reporting is a process designed to provide reasonableassurance regarding the reliability of financial reporting and the preparation of financial statements for externalpurposes in accordance with generally accepted accounting principles. A company’s internal control overfinancial reporting includes those policies and procedures that (1) pertain to the maintenance of records that, inreasonable detail, accurately and fairly reflect the transactions and dispositions of the assets of the company;(2) provide reasonable assurance that transactions are recorded as necessary to permit preparation of financialstatements in accordance with generally accepted accounting principles, and that receipts and expenditures ofthe company are being made only in accordance with authorizations of management and directors of thecompany; and (3) provide reasonable assurance regarding prevention or timely detection of unauthorizedacquisition, use, or disposition of the company’s assets that could have a material effect on the financialstatements.
Because of its inherent limitations, internal control over financial reporting may not prevent or detectmisstatements. Also, projections of any evaluation of effectiveness to future periods are subject to the risk thatcontrols may become inadequate because of changes in conditions, or that the degree of compliance with thepolicies or procedures may deteriorate.
In our opinion, management’s assessment that Omnicom Group Inc. maintained effective internal controlover financial reporting as of December 31, 2005, is fairly stated, in all material respects, based on criteriaestablished in Internal Control–Integrated Framework issued by the Committee of Sponsoring Organizations ofthe Treadway Commission (COSO). Also, in our opinion, Omnicom Group Inc. maintained, in all materialrespects, effective internal control over financial reporting as of December 31, 2005, based on criteriaestablished in Internal Control–Integrated Framework issued by the Committee of Sponsoring Organizations ofthe Treadway Commission (COSO).
We also have audited, in accordance with the standards of the Public Company Accounting OversightBoard (United States), the consolidated balance sheets of Omnicom Group Inc. and subsidiaries as ofDecember 31, 2005 and 2004, and the related consolidated statements of income, shareholders’ equity and cashflows for each of the years in the three-year period ended December 31, 2005, and our report dated February 24,2006 expressed an unqualified opinion on those consolidated financial statements.
/s/ KPMG LLP
New York, New YorkFebruary 24, 2006

F-4
The accompanying notes to the consolidated financial statements are an integral part of these statements.
OMNICOM GROUP INC. AND SUBSIDIARIES
CONSOLIDATED STATEMENTS OF INCOMEYears Ended December 31,
(Dollars in millions, except per share data)__________________________________________________________________________________________2005 2004 2003______________ ______________ ______________
REVENUE ............................................................................ $10,481.1 $9,747.2 $8,621.4
OPERATING EXPENSES:Salary and service costs .................................................... 7,412.9 6,846.8 5,911.8Office and general expenses .............................................. 1,728.4 1,685.0 1,617.7________________ ______________ ______________
9,141.3 8,531.8 7,529.5 ________________ ______________ ______________
OPERATING PROFIT .......................................................... 1,339.8 1,215.4 1,091.9
NET INTEREST EXPENSE:Interest expense.................................................................. 78.0 51.1 57.9Interest income .................................................................. (18.8) (14.5) (15.1)________________ ______________ ______________
59.2 36.6 42.8________________ ______________ ______________
INCOME BEFORE INCOME TAXES ................................ 1,280.6 1,178.8 1,049.1
INCOME TAXES .................................................................. 435.3 396.3 353.0________________ ______________ ______________
INCOME AFTER INCOME TAXES.................................... 845.3 782.5 696.1
EQUITY IN EARNINGS OF AFFILIATES ........................ 27.6 17.1 15.1
MINORITY INTERESTS .................................................... (82.2) (76.1) (80.2)________________ ______________ ______________
NET INCOME ...................................................................... $ 790.7 $ 723.5 $ 631.0________________ ______________ ______________________________ ______________ ______________
NET INCOME PER COMMON SHARE:Basic .................................................................................. $ 4.38 $ 3.90 $ 3.37Diluted................................................................................ $ 4.36 $ 3.88 $ 3.37
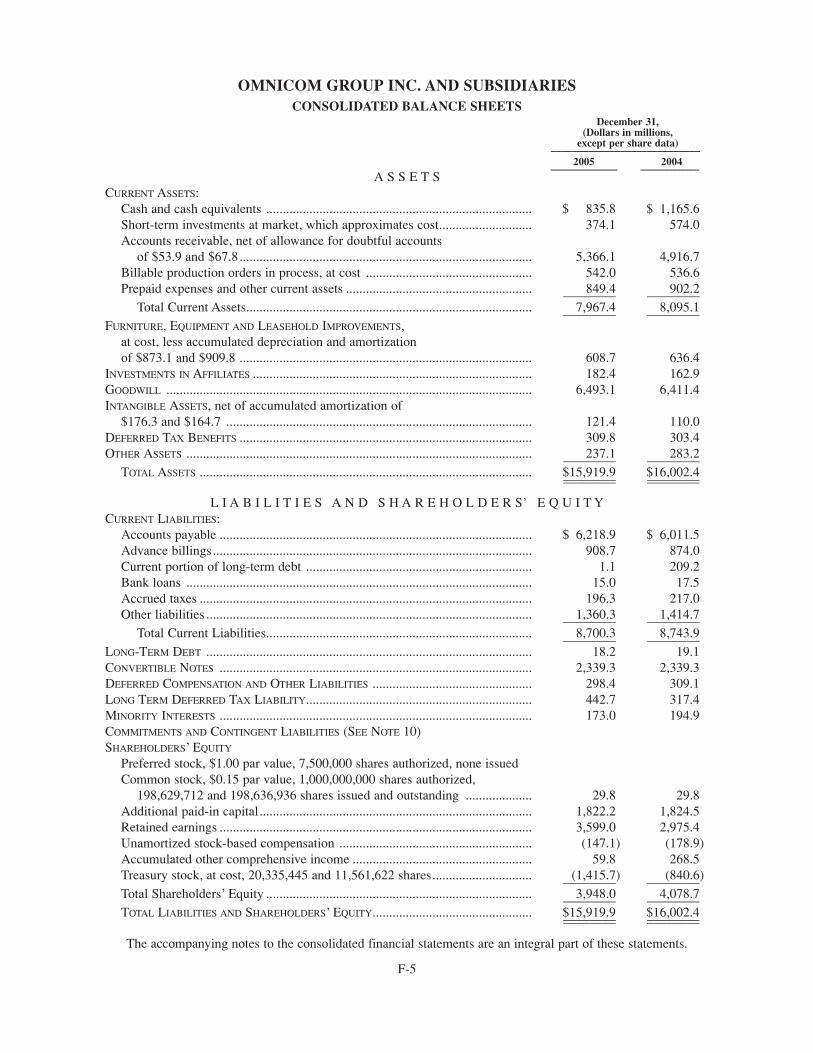
F-5
The accompanying notes to the consolidated financial statements are an integral part of these statements.
OMNICOM GROUP INC. AND SUBSIDIARIES CONSOLIDATED BALANCE SHEETS
December 31,(Dollars in millions,
except per share data)____________________________
2005 2004_________________________ ______________________A S S E T S
CURRENT ASSETS:Cash and cash equivalents ................................................................................ $ 835.8 $ 1,165.6Short-term investments at market, which approximates cost............................ 374.1 574.0Accounts receivable, net of allowance for doubtful accounts
of $53.9 and $67.8........................................................................................ 5,366.1 4,916.7Billable production orders in process, at cost .................................................. 542.0 536.6Prepaid expenses and other current assets ........................................................ 849.4 902.2________ ________
Total Current Assets...................................................................................... 7,967.4 8,095.1________ ________FURNITURE, EQUIPMENT AND LEASEHOLD IMPROVEMENTS,
at cost, less accumulated depreciation and amortizationof $873.1 and $909.8 ........................................................................................ 608.7 636.4
INVESTMENTS IN AFFILIATES .................................................................................... 182.4 162.9GOODWILL .............................................................................................................. 6,493.1 6,411.4INTANGIBLE ASSETS, net of accumulated amortization of
$176.3 and $164.7 ............................................................................................ 121.4 110.0DEFERRED TAX BENEFITS ........................................................................................ 309.8 303.4OTHER ASSETS ........................................................................................................ 237.1 283.2________ ________
TOTAL ASSETS .................................................................................................... $15,919.9 $16,002.4________ ________________ ________
L I A B I L I T I E S A N D S H A R E H O L D E R S’ E Q U I T YCURRENT LIABILITIES:
Accounts payable .............................................................................................. $ 6,218.9 $ 6,011.5Advance billings................................................................................................ 908.7 874.0Current portion of long-term debt .................................................................... 1.1 209.2Bank loans ........................................................................................................ 15.0 17.5Accrued taxes .................................................................................................... 196.3 217.0Other liabilities .................................................................................................. 1,360.3 1,414.7________ ________
Total Current Liabilities................................................................................ 8,700.3 8,743.9________ ________LONG-TERM DEBT .................................................................................................. 18.2 19.1CONVERTIBLE NOTES .............................................................................................. 2,339.3 2,339.3DEFERRED COMPENSATION AND OTHER LIABILITIES ................................................ 298.4 309.1LONG TERM DEFERRED TAX LIABILITY.................................................................... 442.7 317.4MINORITY INTERESTS .............................................................................................. 173.0 194.9COMMITMENTS AND CONTINGENT LIABILITIES (SEE NOTE 10)SHAREHOLDERS’ EQUITY
Preferred stock, $1.00 par value, 7,500,000 shares authorized, none issuedCommon stock, $0.15 par value, 1,000,000,000 shares authorized,
198,629,712 and 198,636,936 shares issued and outstanding .................... 29.8 29.8Additional paid-in capital.................................................................................. 1,822.2 1,824.5Retained earnings .............................................................................................. 3,599.0 2,975.4Unamortized stock-based compensation .......................................................... (147.1) (178.9)Accumulated other comprehensive income ...................................................... 59.8 268.5Treasury stock, at cost, 20,335,445 and 11,561,622 shares.............................. (1,415.7) (840.6)________ ________Total Shareholders’ Equity ................................................................................ 3,948.0 4,078.7________ ________TOTAL LIABILITIES AND SHAREHOLDERS’ EQUITY................................................ $15,919.9 $16,002.4________ ________________ ________

F-6
OMNICOM GROUP INC. AND SUBSIDIARIES CONSOLIDATED STATEMENTS OF SHAREHOLDERS’ EQUITY
Three Years Ended December 31, 2005(Dollars in millions)
Unamortized Accumulated
Common Stock Additional Stock- Other TotalComprehensive ______________________ Paid-in Retained Based Comprehensive Treasury Shareholders’
Income Shares Par Value Capital Earnings Compensation (Loss) Income Stock Equity____________________________ ___________________ _________________ ___________________ _______________ _______________________ __________________________ ________________ ________________________Balance December 31, 2002 ..... 198,600,891 $29.8 $1,864.9 $1,937.9 $(292.3) $(154.2) $(704.8) $2,681.3Comprehensive Income:
Net Income ............................ $631.0 631.0 631.0Translation adjustments,
net of taxes of $142.1........ 263.9 263.9 263.9___________Comprehensive income ............. 894.9______________________Dividends Declared ................... (149.8) (149.8)Amortization of stock-based
compensation......................... 133.1 133.1Shares transactions under
employee stock plans ............ (35.6) (57.2) 146.0 53.2Shares issued for acquisitions ... 79,940 4.9 11.3 16.2Purchase of treasury shares ....... (25.9) (25.9)Cancellation of shares ............... (16,915) (2.2) 2.2 —____________________ _________ ______________ ______________ ____________ ____________ ____________ ______________Balance December 31, 2003 ..... 198,663,916 29.8 1,832.0 2,419.1 (216.4) 109.7 (571.2) 3,603.0Comprehensive Income:
Net Income ............................ 723.5 723.5 723.5Translation adjustments,
net of taxes of $85.5.......... 158.8 158.8 158.8___________Comprehensive income ............. 882.3______________________Dividends Declared ................... (167.2) (167.2)Amortization of stock-based
compensation......................... 117.2 117.2Shares transactions under
employee stock plans ............ (6.1) (79.7) 170.7 84.9Shares issued for acquisitions ... 0.5 4.5 5.0Purchase of treasury shares ....... (446.5) (446.5)Cancellation of shares ............... (26,980) (1.9) 1.9 —____________________ _________ ______________ ______________ ____________ ____________ ____________ ______________Balance December 31, 2004 ..... 198,636,936 29.8 1,824.5 2,975.4 (178.9) 268.5 (840.6) 4,078.7Comprehensive Income:
Net Income ............................ 790.7 790.7 790.7Translation adjustments,
net of tax benefit of$(112.4) ............................. (208.7) (208.7) (208.7)___________
Comprehensive income ............. $582.0______________________Dividends Declared ................... (167.1) (167.1)Amortization of stock-based
compensation......................... 87.0 87.0Shares transactions under
employee stock plans ............ (1.7) (55.2) 147.1 90.2Shares issued for acquisitions ... 9.0 9.0Purchase of treasury shares ....... (731.8) (731.8)Cancellation of shares ............... (7,224) (0.6) 0.6 —____________________ _________ ______________ ______________ ____________ ____________ ____________ ______________Balance December 31, 2005 ..... 198,629,712 $29.8 $1,822.2 $3,599.0 $(147.1) $ 59.8 $(1,415.7) $3,948.0____________________ _________ ______________ ______________ ____________ ____________ _______________ __________________________________ _________ ______________ ______________ ____________ ____________ _______________ ______________
The accompanying notes to the consolidated financial statements are an integral part of these statements.
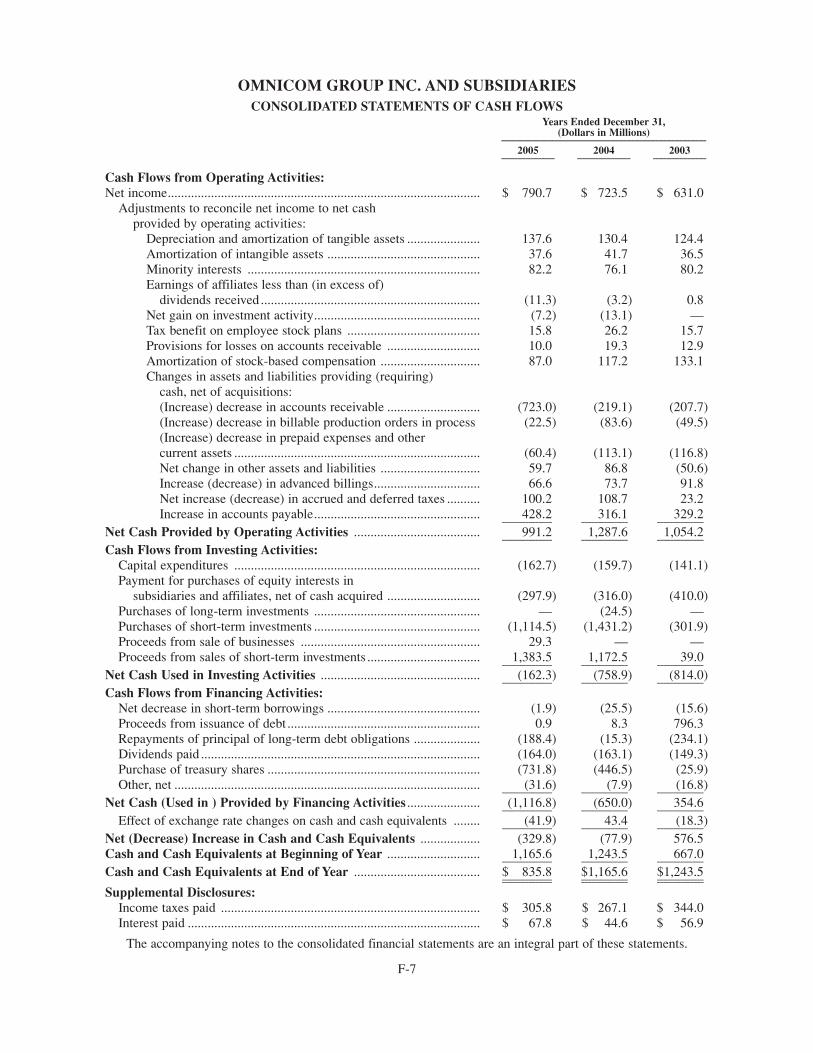
F-7
OMNICOM GROUP INC. AND SUBSIDIARIESCONSOLIDATED STATEMENTS OF CASH FLOWS
Years Ended December 31,(Dollars in Millions)_____________________________________________________________________________
2005 2004 2003____________________ ____________________ ____________________
Cash Flows from Operating Activities:Net income.............................................................................................. $ 790.7 $ 723.5 $ 631.0
Adjustments to reconcile net income to net cashprovided by operating activities:
Depreciation and amortization of tangible assets ...................... 137.6 130.4 124.4Amortization of intangible assets .............................................. 37.6 41.7 36.5Minority interests ...................................................................... 82.2 76.1 80.2Earnings of affiliates less than (in excess of)
dividends received .................................................................. (11.3) (3.2) 0.8Net gain on investment activity.................................................. (7.2) (13.1) —Tax benefit on employee stock plans ........................................ 15.8 26.2 15.7Provisions for losses on accounts receivable ............................ 10.0 19.3 12.9Amortization of stock-based compensation .............................. 87.0 117.2 133.1Changes in assets and liabilities providing (requiring)
cash, net of acquisitions:(Increase) decrease in accounts receivable ............................ (723.0) (219.1) (207.7)(Increase) decrease in billable production orders in process (22.5) (83.6) (49.5)(Increase) decrease in prepaid expenses and othercurrent assets .......................................................................... (60.4) (113.1) (116.8)Net change in other assets and liabilities .............................. 59.7 86.8 (50.6)Increase (decrease) in advanced billings................................ 66.6 73.7 91.8Net increase (decrease) in accrued and deferred taxes .......... 100.2 108.7 23.2Increase in accounts payable.................................................. 428.2 316.1 329.2_______________ ______________ ______________
Net Cash Provided by Operating Activities ...................................... 991.2 1,287.6 1,054.2_______________ ______________ ______________Cash Flows from Investing Activities:
Capital expenditures .......................................................................... (162.7) (159.7) (141.1)Payment for purchases of equity interests in
subsidiaries and affiliates, net of cash acquired ............................ (297.9) (316.0) (410.0)Purchases of long-term investments .................................................. — (24.5) —Purchases of short-term investments .................................................. (1,114.5) (1,431.2) (301.9)Proceeds from sale of businesses ...................................................... 29.3 — —Proceeds from sales of short-term investments .................................. 1,383.5 1,172.5 39.0_______________ ______________ ______________
Net Cash Used in Investing Activities ................................................ (162.3) (758.9) (814.0)_______________ ______________ ______________Cash Flows from Financing Activities:
Net decrease in short-term borrowings .............................................. (1.9) (25.5) (15.6)Proceeds from issuance of debt .......................................................... 0.9 8.3 796.3Repayments of principal of long-term debt obligations .................... (188.4) (15.3) (234.1)Dividends paid .................................................................................... (164.0) (163.1) (149.3)Purchase of treasury shares ................................................................ (731.8) (446.5) (25.9)Other, net ............................................................................................ (31.6) (7.9) (16.8)_______________ ______________ ______________
Net Cash (Used in ) Provided by Financing Activities ...................... (1,116.8) (650.0) 354.6_______________ ______________ ______________Effect of exchange rate changes on cash and cash equivalents ........ (41.9) 43.4 (18.3)_______________ ______________ ______________
Net (Decrease) Increase in Cash and Cash Equivalents .................. (329.8) (77.9) 576.5Cash and Cash Equivalents at Beginning of Year ............................ 1,165.6 1,243.5 667.0_______________ ______________ ______________Cash and Cash Equivalents at End of Year ...................................... $ 835.8 $1,165.6 $1,243.5_______________ ______________ _____________________________ ______________ ______________Supplemental Disclosures:
Income taxes paid .............................................................................. $ 305.8 $ 267.1 $ 344.0Interest paid ........................................................................................ $ 67.8 $ 44.6 $ 56.9
The accompanying notes to the consolidated financial statements are an integral part of these statements.

F-8
OMNICOM GROUP INC. AND SUBSIDIARIESNOTES TO CONSOLIDATED FINANCIAL STATEMENTS
1. Summary of Significant Accounting Policies
Basis and Presentation. The accompanying consolidated financial statements include the accounts ofOmnicom Group Inc. and its domestic and international subsidiaries and are prepared in conformity withgenerally accepted accounting principles in the United States of America (“U.S. GAAP”). Intercompanybalances and transactions have been eliminated.
Revenue Recognition. Substantially all revenue is derived from fees for services. Additionally, we earncommissions based upon the placement of advertisements in various media. Revenue is realized when theservice is performed in accordance with the terms of each client arrangement and upon completion of theearnings process. This includes when services are rendered, upon presentation date for media, when costs areincurred for radio and television production and when print production is completed and collection is reasonablyassured.
A small portion of our contractual arrangements with clients includes performance incentive provisionswhich allow us to earn additional revenues as a result of our performance relative to both quantitative andqualitative goals. We recognize the incentive portion of revenue under these arrangements when specificquantitative goals are achieved, or when performance against qualitative goals is determined by our clients.
Our revenue recognition policies are in compliance with the Securities and Exchange Commission’s(“SEC”) Staff Accounting Bulletin (“SAB”) 101, Revenue and Recognition in Financial Statements (“SAB101”) as updated by SAB 104, Revenue Recognition (“SAB 104”). SAB 101 and SAB 104 summarize certainviews of the SEC staff in applying generally accepted accounting principles to revenue recognition in financialstatements. In July 2000, the Emerging Issues Task Force (“EITF”) of the Financial Accounting StandardsBoard (“FASB”) released Issue 99-19, Reporting Revenue Gross as a Principal versus Net as an Agent (“EITF99-19”). This Issue summarized the EITF’s views on when revenue should be recorded at the gross amountbilled because revenue has been earned from the sale of goods or services, or the net amount retained becauserevenue has been earned from a fee or commission. Additionally, in January 2002, the EITF released Issue01-14, Income Statement Characterization of Reimbursements Received for “Out-of-Pocket” Expenses Incurred(“EITF 01-14”). EITF 01-14 summarized the EITF’s views on when out-of-pocket expenses should becharacterized as revenue. Our revenue recognition policies are in compliance with SAB 101, SAB 104, EITF99-19 and EITF 01-14. In the majority of our businesses, we act as an agent and record revenue equal to the netamount retained, when the fee or commission is earned.
Billable Production. Billable production orders in process consist principally of costs incurred on behalfof clients when providing advertising, marketing and corporate communications services to clients. Suchamounts are invoiced to clients at various times over the course of the production process.
Investments Available for Sale. Investments available for sale are comprised of the following twocategories of investments:
Short-term investments and time deposits with financial institutions consist principally of investmentsmade with our excess cash which we expect to convert into cash in our current operating cycle, generally withinone year. Certain of these investments mature at par with maturities longer than one year, however they are resetto par every 49 days or less, with any changes reflected in our interest income. There are no realized gains orlosses, or unrealized gains or losses from these short-term investments because market approximates cost.Therefore, they are classified as current assets.
Long-term investments are included in other assets in our balance sheet and are comprised of minorityownership interests in certain marketing and corporate communications services companies where we do notexercise significant influence over the operating and financial policies of the investee. We account for theseinvestments under the cost method. We periodically evaluate our cost-based investments to determine if therehave been any other than temporary declines in value. A variety of factors are considered when determining if adecline in market value below book value is other than temporary, including, among others, the financialcondition and prospects of the investee, as well as our investment intent.
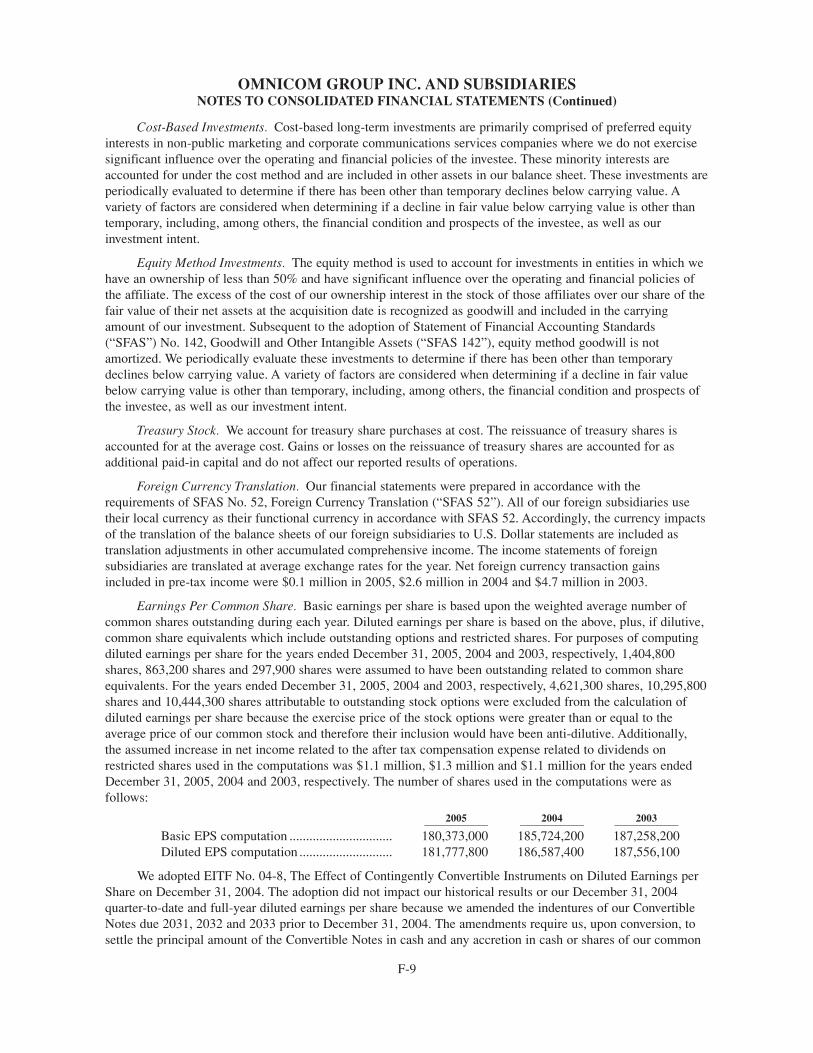
OMNICOM GROUP INC. AND SUBSIDIARIESNOTES TO CONSOLIDATED FINANCIAL STATEMENTS (Continued)
F-9
Cost-Based Investments. Cost-based long-term investments are primarily comprised of preferred equityinterests in non-public marketing and corporate communications services companies where we do not exercisesignificant influence over the operating and financial policies of the investee. These minority interests areaccounted for under the cost method and are included in other assets in our balance sheet. These investments areperiodically evaluated to determine if there has been other than temporary declines below carrying value. Avariety of factors are considered when determining if a decline in fair value below carrying value is other thantemporary, including, among others, the financial condition and prospects of the investee, as well as ourinvestment intent.
Equity Method Investments. The equity method is used to account for investments in entities in which wehave an ownership of less than 50% and have significant influence over the operating and financial policies ofthe affiliate. The excess of the cost of our ownership interest in the stock of those affiliates over our share of thefair value of their net assets at the acquisition date is recognized as goodwill and included in the carryingamount of our investment. Subsequent to the adoption of Statement of Financial Accounting Standards(“SFAS”) No. 142, Goodwill and Other Intangible Assets (“SFAS 142”), equity method goodwill is notamortized. We periodically evaluate these investments to determine if there has been other than temporarydeclines below carrying value. A variety of factors are considered when determining if a decline in fair valuebelow carrying value is other than temporary, including, among others, the financial condition and prospects ofthe investee, as well as our investment intent.
Treasury Stock. We account for treasury share purchases at cost. The reissuance of treasury shares isaccounted for at the average cost. Gains or losses on the reissuance of treasury shares are accounted for asadditional paid-in capital and do not affect our reported results of operations.
Foreign Currency Translation. Our financial statements were prepared in accordance with therequirements of SFAS No. 52, Foreign Currency Translation (“SFAS 52”). All of our foreign subsidiaries usetheir local currency as their functional currency in accordance with SFAS 52. Accordingly, the currency impactsof the translation of the balance sheets of our foreign subsidiaries to U.S. Dollar statements are included astranslation adjustments in other accumulated comprehensive income. The income statements of foreignsubsidiaries are translated at average exchange rates for the year. Net foreign currency transaction gainsincluded in pre-tax income were $0.1 million in 2005, $2.6 million in 2004 and $4.7 million in 2003.
Earnings Per Common Share. Basic earnings per share is based upon the weighted average number ofcommon shares outstanding during each year. Diluted earnings per share is based on the above, plus, if dilutive,common share equivalents which include outstanding options and restricted shares. For purposes of computingdiluted earnings per share for the years ended December 31, 2005, 2004 and 2003, respectively, 1,404,800shares, 863,200 shares and 297,900 shares were assumed to have been outstanding related to common shareequivalents. For the years ended December 31, 2005, 2004 and 2003, respectively, 4,621,300 shares, 10,295,800shares and 10,444,300 shares attributable to outstanding stock options were excluded from the calculation ofdiluted earnings per share because the exercise price of the stock options were greater than or equal to theaverage price of our common stock and therefore their inclusion would have been anti-dilutive. Additionally,the assumed increase in net income related to the after tax compensation expense related to dividends onrestricted shares used in the computations was $1.1 million, $1.3 million and $1.1 million for the years endedDecember 31, 2005, 2004 and 2003, respectively. The number of shares used in the computations were asfollows:
2005 2004 2003________________________ ________________________ ________________________
Basic EPS computation ............................... 180,373,000 185,724,200 187,258,200Diluted EPS computation ............................ 181,777,800 186,587,400 187,556,100
We adopted EITF No. 04-8, The Effect of Contingently Convertible Instruments on Diluted Earnings perShare on December 31, 2004. The adoption did not impact our historical results or our December 31, 2004quarter-to-date and full-year diluted earnings per share because we amended the indentures of our ConvertibleNotes due 2031, 2032 and 2033 prior to December 31, 2004. The amendments require us, upon conversion, tosettle the principal amount of the Convertible Notes in cash and any accretion in cash or shares of our common
OMNICOM GROUP INC. AND SUBSIDIARIESNOTES TO CONSOLIDATED FINANCIAL STATEMENTS (Continued)
F-10
stock at our option. For additional information, see Note 4 to these consolidated financial statements. Theamendments made the notes compliant with EITF 90-19, Convertible Bonds with Issuer Options to Settle for Cash Upon Conversion, “Instrument C” treatment. Compliance with “Instrument C” treatment did not result inadditional dilution to our Diluted EPS because our weighted average share price was less than the conversionprice of the Convertible Notes for all of the periods set forth above. In accordance with the transition provisionsof EITF 04-8, it is assumed that “Instrument C” treatment occurred at the beginning of the first period presented.
Gains and Losses on Issuance of Stock in Affiliates and Subsidiaries. Gains and losses on the issuance ofstock in equity method affiliates and consolidated subsidiaries are recognized directly in our shareholders’equity through an increase or decrease to additional paid-in capital in the period in which the sale occurs and donot affect reported results of operations.
Salary Continuation Agreements. Arrangements with certain present and former employees provide forcontinuing payments for periods up to 10 years after cessation of their full-time employment in considerationfor agreements by the employee not to compete with us and to render consulting services during the post-employment period. Such payments, the amounts of which are also subject to certain limitations, including ouroperating performance during the post-employment period, represent the fair value of the services rendered andare expensed in such periods.
Depreciation of Furniture and Equipment and Amortization of Leasehold Improvements. Depreciationcharges are computed on a straight-line basis over the estimated useful lives of furniture of seven to ten yearsand equipment of three to five years. Leasehold improvements are amortized on a straight-line basis over thelesser of the terms of the related lease or the estimated useful life of these assets.
Goodwill and Other Intangibles Assets. In accordance with SFAS 142, goodwill acquired resulting from abusiness combination is not amortized, but is periodically tested for impairment. Additionally, in accordancewith SFAS No. 141, Business Combinations (“SFAS 141”), we allocate the cost of an acquired entity to theassets acquired and liabilities assumed based on their estimated fair values including other identifiableintangible assets, as applicable, primarily customer relationships and trade names. See Note 2 for informationabout our acquisitions.
Under SFAS 142, we no longer amortize goodwill and intangible assets with indefinite lives and we arerequired to perform an annual impairment test on goodwill balances and intangible assets with indefinite lives.In performing the impairment test, SFAS 142 requires that we identify the components of our operatingsegments that are reporting units and their respective carrying value, estimate the fair value of the reportingunits and compare the fair value to the carrying value of the reporting units to determine if there is a potentialimpairment. If there is a potential impairment, SFAS 142 requires that additional analysis be performed todetermine the amount of the impairment, if any, to be recorded.
In accordance with paragraph 30 of SFAS 142, we identified our regional reporting units as componentsof our operating segments, which are our five agency networks. During 2005, we completed the reorganizationof our operating segments and the formation of a fifth agency network. Specifically identifiable assets andliabilities were transferred to the fifth agency network from our other four agency networks in accordance withparagraphs 32 and 33 and as required by paragraph 36 of SFAS 142. In addition, we reassigned goodwill fromour other four agency networks utilizing the relative fair value approach in accordance with paragraph 36 ofSFAS 142.
The regional reporting units of each agency network are responsible for the agencies in their region. Theyreport to the segment managers and facilitate the administrative and logistical requirements of our client-centricstrategy for delivering services to clients in their regions. We then concluded that for each of our operatingsegments, their regional reporting units had similar economic characteristics and should be aggregated forpurposes of testing goodwill for impairment at the operating segment level. Our conclusion was based on adetailed analysis of the aggregation criteria set forth in paragraph 17 of SFAS No.131, Disclosures aboutSegments of an Enterprise and Related Information (“SFAS 131”), and the guidance set forth in EITF D-101:Clarification of Reporting Unit Guidance in Paragraph 30 of FASB Statement No. 142. Consistent with the
OMNICOM GROUP INC. AND SUBSIDIARIESNOTES TO CONSOLIDATED FINANCIAL STATEMENTS (Continued)
F-11
fundamentals of our business strategy, the agencies within our regional reporting units serve similar clients insimilar industries, and in many cases the same clients. In addition, the agencies within our regional reportingunits have similar economic characteristics, as the main economic components of each agency are the salary andservice costs associated with providing professional services, the office and general costs associated with officespace and occupancy, and the provision of technology requirements which are generally limited to personalcomputers, servers and off-the-shelf software. Finally, the expected benefits of our acquisitions are typicallyshared across multiple agencies and regions as they work together to integrate the acquired agency into ourclient service strategy.
We perform our impairment test during the second quarter of each year. In determining the fair value ofour operating segments, we perform a discounted cash flow analysis assuming they could be sold in anontaxable transaction between willing parties. Additionally, to supplement our analysis of fair value, whenavailable and appropriate, we use comparative market multiples and we consider similar and recent transactions.When comparing the fair value of our operating segments to their carrying value, we include deferred taxes inthe carrying value of each of our reporting units. We have concluded, for each year presented in the financialstatements, that our goodwill was not impaired. We plan to continue to perform our impairment test during thesecond quarter of each year unless certain events, as defined in SFAS 142, trigger the need for an earlierevaluation for impairment.
Deferred Taxes. Deferred income taxes are provided for the temporary difference between the financialreporting basis and tax basis of our assets and liabilities. Deferred tax assets result principally from recordingcertain expenses in the financial statements which are not currently deductible for tax purposes, includingemployee stock-based compensation expense and from differences between the tax and book basis of assets andliabilities recorded in connection with acquisitions. Deferred tax liabilities result principally from expensesarising from financial instruments which are currently deductible for tax purposes but have not been expensed inthe financial statements and, basis differences arising from tangible and deductible intangible assets, as well as,investments and capital transactions.
Employee Stock Options. Stock options are accounted for in accordance with SFAS No. 123, Accountingfor Stock-Based Compensation” (“SFAS 123”), as amended by SFAS No. 148, Accounting for Stock-BasedCompensation — Transition and Disclosure, an amendment of FASB Statement No. 123 (“SFAS 148”). Weelected, effective January 1, 2004, to account for stock-based employee compensation using the fair valuemethod. In determining the fair value of certain stock based compensation awards, we use certain estimates andassumptions such as expected life, rate of risk free interest, volatility and dividend yield. As a result of ouradoption of SFAS 123 as amended by SFAS 148, the fair value of stock-based employee compensation wasrecorded as an expense in the current and prior years. Accordingly, our results for years prior to 2004 have beenrestated as if we had used the fair value method to account for stock-based employee compensation in the prioryears. Pre-tax stock-based employee compensation expense for the years ended December 31, 2005, 2004 and2003, was $87.0 million, $117.2 million and $133.1 million, respectively. Information about our specific awardsand stock plans can be found in Note 7.
In December 2004, the FASB issued SFAS No. 123 (Revised 2004) — Share-Based Payment (“SFAS123R”) which is effective for the next fiscal year beginning after June 15, 2005 and generally applies to grantsmade after adoption. We plan to adopt SFAS 123R effective January 1, 2006. SFAS 123R revises certainrequirements of FASB Statement No. 123, Accounting for Stock-Based Compensation. We do not expect thesechanges to have a material impact on our consolidated results of operations or financial position.
The changes that will have an effect on our financial statements subsequent to our adoption of SFAS 123Rinclude the requirement to record compensation expense net of an estimate for awards that are expected to beforfeited. We currently reduce compensation expense only when the forfeiture actually occurs. Upon adoption ofSFAS 123R, we will apply our estimate of awards to be forfeited to the compensation expense related to allunvested awards outstanding at January 1, 2006 and record a corresponding adjustment on an after-tax basis toour income statement to reflect the cumulative effect of this change in accounting principle. Currently, weestimate that the adjustment to be made in the first quarter of 2006 will not have a material effect on our resultsof operations and financial condition.
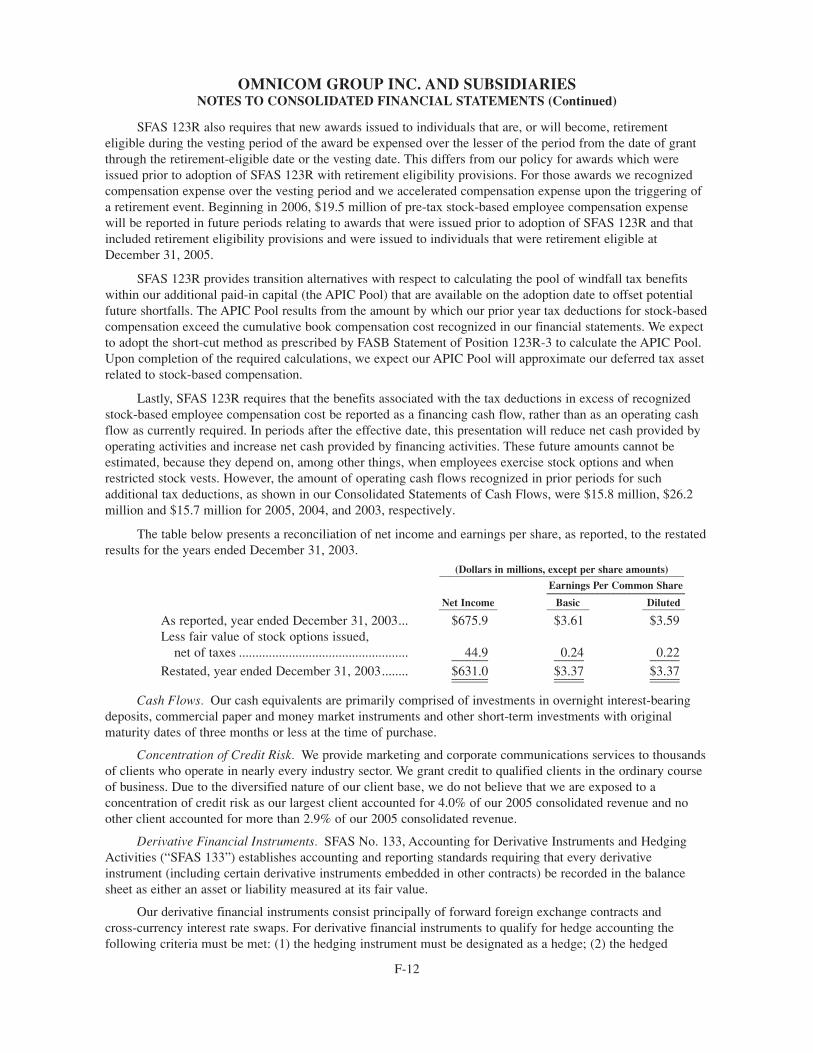
OMNICOM GROUP INC. AND SUBSIDIARIESNOTES TO CONSOLIDATED FINANCIAL STATEMENTS (Continued)
F-12
SFAS 123R also requires that new awards issued to individuals that are, or will become, retirementeligible during the vesting period of the award be expensed over the lesser of the period from the date of grantthrough the retirement-eligible date or the vesting date. This differs from our policy for awards which wereissued prior to adoption of SFAS 123R with retirement eligibility provisions. For those awards we recognizedcompensation expense over the vesting period and we accelerated compensation expense upon the triggering ofa retirement event. Beginning in 2006, $19.5 million of pre-tax stock-based employee compensation expensewill be reported in future periods relating to awards that were issued prior to adoption of SFAS 123R and thatincluded retirement eligibility provisions and were issued to individuals that were retirement eligible atDecember 31, 2005.
SFAS 123R provides transition alternatives with respect to calculating the pool of windfall tax benefitswithin our additional paid-in capital (the APIC Pool) that are available on the adoption date to offset potentialfuture shortfalls. The APIC Pool results from the amount by which our prior year tax deductions for stock-basedcompensation exceed the cumulative book compensation cost recognized in our financial statements. We expectto adopt the short-cut method as prescribed by FASB Statement of Position 123R-3 to calculate the APIC Pool.Upon completion of the required calculations, we expect our APIC Pool will approximate our deferred tax assetrelated to stock-based compensation.
Lastly, SFAS 123R requires that the benefits associated with the tax deductions in excess of recognizedstock-based employee compensation cost be reported as a financing cash flow, rather than as an operating cashflow as currently required. In periods after the effective date, this presentation will reduce net cash provided byoperating activities and increase net cash provided by financing activities. These future amounts cannot beestimated, because they depend on, among other things, when employees exercise stock options and whenrestricted stock vests. However, the amount of operating cash flows recognized in prior periods for suchadditional tax deductions, as shown in our Consolidated Statements of Cash Flows, were $15.8 million, $26.2million and $15.7 million for 2005, 2004, and 2003, respectively.
The table below presents a reconciliation of net income and earnings per share, as reported, to the restatedresults for the years ended December 31, 2003.
(Dollars in millions, except per share amounts)____________________________________________________________________________________________Earnings Per Common Share__________________________
Net Income Basic Diluted______________________ ________________ ________________
As reported, year ended December 31, 2003... $675.9 $3.61 $3.59Less fair value of stock options issued,
net of taxes ................................................... 44.9 0.24 0.22___________ _________ _________Restated, year ended December 31, 2003........ $631.0 $3.37 $3.37___________ _________ ____________________ _________ _________
Cash Flows. Our cash equivalents are primarily comprised of investments in overnight interest-bearingdeposits, commercial paper and money market instruments and other short-term investments with originalmaturity dates of three months or less at the time of purchase.
Concentration of Credit Risk. We provide marketing and corporate communications services to thousandsof clients who operate in nearly every industry sector. We grant credit to qualified clients in the ordinary courseof business. Due to the diversified nature of our client base, we do not believe that we are exposed to aconcentration of credit risk as our largest client accounted for 4.0% of our 2005 consolidated revenue and noother client accounted for more than 2.9% of our 2005 consolidated revenue.
Derivative Financial Instruments. SFAS No. 133, Accounting for Derivative Instruments and HedgingActivities (“SFAS 133”) establishes accounting and reporting standards requiring that every derivativeinstrument (including certain derivative instruments embedded in other contracts) be recorded in the balancesheet as either an asset or liability measured at its fair value.
Our derivative financial instruments consist principally of forward foreign exchange contracts andcross-currency interest rate swaps. For derivative financial instruments to qualify for hedge accounting thefollowing criteria must be met: (1) the hedging instrument must be designated as a hedge; (2) the hedged
OMNICOM GROUP INC. AND SUBSIDIARIESNOTES TO CONSOLIDATED FINANCIAL STATEMENTS (Continued)
F-13
exposure must be specifically identifiable and expose us to risk; and (3) it must be highly probable that a changein fair value of the derivative financial instrument and an opposite change in the fair value of the hedgedexposure will have a high degree of correlation.
If the derivative is a hedge, depending on the nature of the hedge, changes in the fair value of thederivative will either be offset against the change in fair value of the hedged assets, liabilities or firmcommitments through earnings or recognized in other comprehensive income until the hedged item isrecognized in earnings. The ineffective portion of the change in fair value of a derivative used as hedge isrequired to be immediately recognized in the statement of income.
The majority of our activity relates to forward foreign exchange contracts. We execute these contracts inthe same currency as the related exposure, whereby 100% correlation is achieved based on spot rates. Gains andlosses on derivative financial instruments which are hedges of foreign currency assets or liabilities are recordedat market value and changes in market value are recognized in the statement of income in the current period.Gains and losses on derivative financial instruments which are hedges of net investments, are recorded toaccumulated comprehensive income as translation adjustments to the extent of change in the spot exchange rate.The remaining difference is recorded in the statement of income in the current period.
Use of Estimates. The preparation of financial statements in conformity with U.S. GAAP requiresmanagement to make estimates and assumptions that affect the reported amounts of assets and liabilities anddisclosures of contingent assets and liabilities at the date of the financial statements and the reported amounts ofrevenue and expenses during the reporting period. Actual results could differ from those estimates.
Reclassifications. Certain prior year amounts have been reclassified to conform to the 2005 presentation.
2. Acquisitions
During 2005, we completed fifteen acquisitions of new subsidiaries and made additional investments incompanies in which we already had an ownership interest. In addition, we made contingent purchase pricepayments related to acquisitions completed in prior years. The aggregate cost of these transactions, includingcash payments and the assumption of liabilities in 2005 was as follows (dollars in millions):
New and existing subsidiaries................................................................................ $122.2
Contingent purchase price payments ..................................................................... 205.0___________$327.2______________________
Valuations of these acquired companies were based on a number of factors, including specializedknow-how, reputation, geographic coverage, competitive position and service offerings. Our acquisition strategyhas been focused on acquiring the expertise of an assembled workforce in order to continue to build upon thecore capabilities of our various strategic business platforms through the expansion of their geographic areaand/or their service capabilities to better serve our clients. Consistent with our acquisition strategy and pastpractice, most acquisitions completed in 2005 included an initial payment at the time of closing and provide forfuture additional contingent purchase price payments. Contingent payments for these transactions, as well ascertain acquisitions completed in prior years, are derived using the performance of the acquired entity and arebased on pre-determined formulas. These contingent purchase price obligations are accrued when thecontingency is resolved and payment is certain.
For each of our acquisitions, we undertake a detailed review to identify other intangible assets and avaluation is performed for all such assets identified. Like most service businesses, a substantial portion of theintangible asset value that we acquire is the specialized know-how of the workforce, which is treated as part ofgoodwill and is not required to be valued separately by SFAS 141. The majority of the value of the identifiableintangible assets that we acquire is derived from customer relationships and the related customer contracts. In
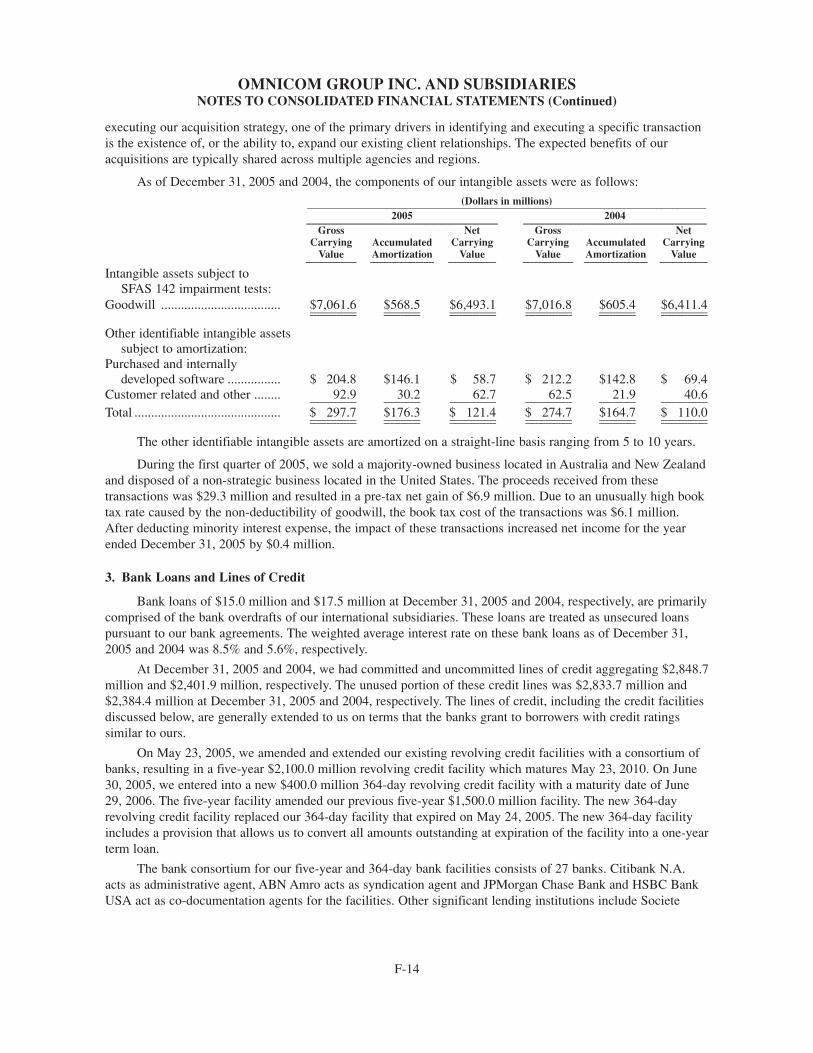
OMNICOM GROUP INC. AND SUBSIDIARIESNOTES TO CONSOLIDATED FINANCIAL STATEMENTS (Continued)
F-14
executing our acquisition strategy, one of the primary drivers in identifying and executing a specific transactionis the existence of, or the ability to, expand our existing client relationships. The expected benefits of ouracquisitions are typically shared across multiple agencies and regions.
As of December 31, 2005 and 2004, the components of our intangible assets were as follows:
(Dollars in millions)______________________________________________________________________________________________________________________________________________________2005 2004________________________________________________________________________ _____________________________________________________________________
Gross Net Gross NetCarrying Accumulated Carrying Carrying Accumulated Carrying
Value Amortization Value Value Amortization Value___________________ ________________________ __________________ ___________________ ________________________ __________________
Intangible assets subject toSFAS 142 impairment tests:
Goodwill .................................... $7,061.6 $568.5 $6,493.1 $7,016.8 $605.4 $6,411.4______________ ___________ ______________ ______________ ___________ ____________________________ ___________ ______________ ______________ ___________ ______________
Other identifiable intangible assetssubject to amortization:
Purchased and internallydeveloped software ................ $ 204.8 $146.1 $ 58.7 $ 212.2 $142.8 $ 69.4
Customer related and other ........ 92.9 30.2 62.7 62.5 21.9 40.6______________ ___________ ______________ ______________ ___________ ______________Total ............................................ $ 297.7 $176.3 $ 121.4 $ 274.7 $164.7 $ 110.0______________ ___________ ______________ ______________ ___________ ____________________________ ___________ ______________ ______________ ___________ ______________
The other identifiable intangible assets are amortized on a straight-line basis ranging from 5 to 10 years.
During the first quarter of 2005, we sold a majority-owned business located in Australia and New Zealandand disposed of a non-strategic business located in the United States. The proceeds received from thesetransactions was $29.3 million and resulted in a pre-tax net gain of $6.9 million. Due to an unusually high booktax rate caused by the non-deductibility of goodwill, the book tax cost of the transactions was $6.1 million.After deducting minority interest expense, the impact of these transactions increased net income for the yearended December 31, 2005 by $0.4 million.
3. Bank Loans and Lines of Credit
Bank loans of $15.0 million and $17.5 million at December 31, 2005 and 2004, respectively, are primarilycomprised of the bank overdrafts of our international subsidiaries. These loans are treated as unsecured loanspursuant to our bank agreements. The weighted average interest rate on these bank loans as of December 31,2005 and 2004 was 8.5% and 5.6%, respectively.
At December 31, 2005 and 2004, we had committed and uncommitted lines of credit aggregating $2,848.7million and $2,401.9 million, respectively. The unused portion of these credit lines was $2,833.7 million and$2,384.4 million at December 31, 2005 and 2004, respectively. The lines of credit, including the credit facilitiesdiscussed below, are generally extended to us on terms that the banks grant to borrowers with credit ratingssimilar to ours.
On May 23, 2005, we amended and extended our existing revolving credit facilities with a consortium ofbanks, resulting in a five-year $2,100.0 million revolving credit facility which matures May 23, 2010. On June30, 2005, we entered into a new $400.0 million 364-day revolving credit facility with a maturity date of June29, 2006. The five-year facility amended our previous five-year $1,500.0 million facility. The new 364-dayrevolving credit facility replaced our 364-day facility that expired on May 24, 2005. The new 364-day facilityincludes a provision that allows us to convert all amounts outstanding at expiration of the facility into a one-yearterm loan.
The bank consortium for our five-year and 364-day bank facilities consists of 27 banks. Citibank N.A.acts as administrative agent, ABN Amro acts as syndication agent and JPMorgan Chase Bank and HSBC BankUSA act as co-documentation agents for the facilities. Other significant lending institutions include Societe
OMNICOM GROUP INC. AND SUBSIDIARIESNOTES TO CONSOLIDATED FINANCIAL STATEMENTS (Continued)
F-15
Generale, Bank of America, Wachovia and Sumitomo Mitsui. These facilities provide us with the ability toclassify up to $2,500.0 million of our borrowings that could come due within one year as long-term debt, whenit is our intention to keep the borrowings outstanding on a long-term basis.
Both our $2,100.0 million five-year revolving credit facility and our $400.0 million 364-day revolvingcredit facility provide support for our $1,500.0 million commercial paper program. The gross amount ofcommercial paper issued and redeemed under our commercial paper program during 2005 was $43.4 billion,with an average term of 3.0 days. During 2004, $27.2 billion of commercial paper was issued and redeemedwith an average term of 2.3 days. As of December 31, 2005 and 2004, we had no commercial paper borrowingsoutstanding.
The credit facilities contain financial covenants limiting the ratio of total consolidated indebtedness tototal consolidated EBITDA (for purposes of these covenants EBITDA is defined as earnings before interest,taxes, depreciation and amortization) to no more than 3.0 times. In addition, we are required to maintain aminimum ratio of EBITDA to interest expense of at least 5.0 times. At December 31, 2005, our ratio of debt toEBITDA was 1.6 times and our ratio of EBITDA to interest expense was 19.4 times. We were in compliancewith these covenants. In addition, the credit facilities do not limit our ability to declare or pay dividends.
4. Long-Term Debt and Convertible Notes
Long-term debt and convertible notes outstanding as of December 31, 2005 and 2004 consisted of thefollowing:
(Dollars in millions)_____________________________________________________2005 2004_________________ _________________
Euro 152.4 million 5.20% Notes, due June 24, 2005 .................................................................... $ — $ 206.6
Other notes and loans at rates from 2.9% to 10.5%,due through 2010 .............................................................. 19.3 21.7______________ ______________
19.3 228.3Less current portion .............................................................. 1.1 209.2______________ ______________
Total long-term debt.......................................................... $ 18.2 $ 19.1______________ ____________________________ ______________
Convertible Notes — due February 7, 2031......................... $ 847.0 $ 847.0Convertible Notes — due July 31, 2032 .............................. 892.3 892.3Convertible Notes — due June 15, 2033.............................. 600.0 600.0______________ ______________
2,339.3 2,339.3Less current portion .............................................................. — —______________ ______________
Total convertible notes ...................................................... $2,339.3 $2,339.3______________ ____________________________ ______________
In June 1998, we issued €152.4 million 5.20% Notes. The notes were senior unsecured obligations of theCompany and were redeemed upon maturity in June 2005 for $185.1 million.
In February 2001, we issued $850.0 million aggregate principal amount of Liquid Yield Option Notes dueFebruary 7, 2031 (“2031 Notes”). These notes are senior unsecured zero-coupon securities that are convertibleinto 7.7 million shares of our common stock, implying a conversion price of $110.01 per common share, subjectto normal anti-dilution adjustments. These notes are convertible at a specified ratio only upon the occurrence ofcertain events, including; if our common shares trade above certain levels, if we effect extraordinary transactionsor if our long-term debt ratings are downgraded by at least two notches from their December 31, 2005 level ofA- to BBB or lower by Standard & Poor’s Ratings Service (“S&P”), or from their December 31, 2005 level ofBaa1 to Baa3 or lower by Moody’s Investors Service (“Moody’s”). These events would not, however, result inan adjustment of the number of shares issuable upon conversion. Holders of these notes have the right to put thenotes back to us for cash in February of each year and we have agreed not to redeem the notes for cash beforeFebruary 7, 2009. There are no events that accelerate the noteholders’ put rights. Beginning in February 2006
OMNICOM GROUP INC. AND SUBSIDIARIESNOTES TO CONSOLIDATED FINANCIAL STATEMENTS (Continued)
F-16
and every six months thereafter, if the market price of our common shares exceeds certain thresholds, we maybe required to pay contingent cash interest for that period. Our initial calculation in February 2006 did notrequire us to pay contingent cash interest. In prior years, $3.0 million principal amount of notes were put backto us reducing the total outstanding balance to $847.0 million.
In March 2002, we issued $900.0 million aggregate principal amount of Zero Coupon Zero YieldConvertible Notes due July 31, 2032 (“2032 Notes”). The notes are senior unsecured zero-coupon securities thatare convertible into 8.1 million shares of our common stock, implying a conversion price of $110.01 percommon share, subject to normal anti-dilution adjustments. These notes are convertible at a specified ratio onlyupon the occurrence of certain events, including; if our common shares trade above certain levels, if we effectextraordinary transactions or if our long-term debt ratings are downgraded at least two notches from theirDecember 31, 2005 level of A- to BBB or lower by S&P, or from their December 31, 2005 level of Baa1 toBaa3 or lower by Moody’s. These events would not, however, result in an adjustment of the number of sharesissuable upon conversion. Holders of these notes have the right to put the notes back to us for cash in August ofeach year and we have agreed not to redeem the notes for cash before July 31, 2009. There are no events thataccelerate the noteholders’ put rights. Beginning in August 2007, if the market price of our common sharesexceeds certain thresholds, we may be required to pay contingent cash interest. In prior years, $7.7 millionprincipal amount of notes were put back to us reducing the total outstanding balance to $892.3 million.
In June 2003, we issued $600.0 million aggregate principal amount of Zero Coupon Zero YieldConvertible Notes due June 15, 2033 (“2033 Notes”). The notes are senior unsecured obligations that areconvertible into 5.8 million shares of our common stock, implying a conversion price of $103.00 per commonshare, subject to normal anti-dilution adjustments. These notes are convertible at the specified ratio only uponthe occurrence of certain events, including; if our common shares trade above certain levels, if we effectextraordinary transactions or if our long-term debt ratings are downgraded from their current level to Ba1 orlower by Moody’s or BBB- or lower by S&P. The occurrence of these events will not result in an adjustment ofthe number of shares issuable upon conversion. Holders of these notes have the right to put the notes back tous for cash on June 15, 2006, 2008, 2010, 2013, 2018, 2023 and on each June 15 annually thereafter throughJune 15, 2032 and we have a right to redeem the notes for cash beginning on June 15, 2010. There are no eventsthat accelerate the noteholders’ put rights. Beginning in June 2010, if the market price of our common sharesexceeds certain thresholds, we may be required to pay contingent cash interest.
In August 2004, we amended the indenture governing the 2032 Notes. In November 2004, we amendedthe indentures governing the 2031 Notes and the 2033 Notes. The amendments to all three indentures weresimilar with respect to settlement of the notes on put or conversion. We amended the provisions regardingpayment to the noteholders in the event of a put. Previously, we could satisfy the put obligation in cash, sharesor a combination of both, at our option. The amendments provide that we can only satisfy the put obligation incash. We also amended the provisions regarding payment to the noteholders in the event the noteholdersexercise their conversion right. Previously, we were required to satisfy the conversion obligation of each note bydelivering the underlying number of shares, as adjusted, into which the note converts. The amendments providethat the conversion obligation is equal to a conversion value determined on the day of conversion, calculated bymultiplying the share price at the close of business on that day by the underlying number of shares into whichthe note converts. We then satisfy the conversion value by paying the initial principal amount of the note in cashand the balance of the conversion value in cash or shares, at our option. At the same time we amended theindenture provisions governing settlement on put or conversion, we also amended the provisions of 2031 Notesand the 2032 Notes governing the payment of contingent cash interest.
For the years ended December 31, 2005, 2004 and 2003, our gross interest expense on our borrowingswas $78.0 million, $51.1 million and $57.9 million, respectively. Included in our interest expense in 2005, 2004and 2003, and described below was $47.3 million, $23.0 million and $28.1 million related to our convertiblenotes, respectively. In addition, interest expense relative to our €152.4 million 5.20% Notes was $3.9 million,$10.4 million and $10.3 million in 2005, 2004 and 2003, respectively. The remainder of our interest expense inthese years was related to our short-term borrowings.
OMNICOM GROUP INC. AND SUBSIDIARIESNOTES TO CONSOLIDATED FINANCIAL STATEMENTS (Continued)
F-17
Interest expense in 2005 was impacted by the amortization of a portion of the $33.5 million interestpayment made in August 2005 to holders of our 2032 Notes to not exercise certain put rights and, in November2004, we paid $14.8 million and $1.5 million in the aggregate, respectively, to consenting holders of our 2031Notes and 2033 Notes as incentives to consent to certain amendments to our indentures and not exercise certainput rights. Interest expense in 2004 was impacted by the amortization of a portion of the $6.7 million and $24.5million interest payments made in August of 2003 and 2004, respectively, related to our 2032 Notes,amortization of a portion of the interest payment of $1.5 million made in November and December of 2004related to our 2033 Notes and amortization of a portion of the interest payment of $14.8 million made inNovember 2004 related to our 2031 Notes.
The aggregate stated maturities of long-term debt and convertible notes are as follows:
(Dollars in millions)__________________________________
2006 ......................................................................................................................... $ 1.12007 ......................................................................................................................... 0.82008 ......................................................................................................................... 0.82009 ......................................................................................................................... 0.62010 ......................................................................................................................... 16.02011 ......................................................................................................................... —Thereafter................................................................................................................. 2,339.3
5. Segment Reporting
Our wholly and partially owned agencies operate within the advertising, marketing and corporatecommunications services industry. These agencies are organized into agency networks, virtual client networks,regional reporting units and operating groups. During 2005, we completed the reorganization of our operatingsegments and the formation of a fifth agency network. Consistent with the fundamentals of our businessstrategy, our agencies serve similar clients, in similar industries, and in many cases the same clients across avariety of geographic regions. In addition, our agency networks have similar economic characteristics andsimilar long-term operating margins, as the main economic components of each agency are the salary andservice costs associated with providing professional services, the office and general costs associated with officespace and occupancy, and the provision of technology requirements which are generally limited to personalcomputers, servers and off-the-shelf software. Therefore, given these similarities and in accordance with theprovisions of SFAS 131, most specifically paragraph 17, we aggregate our operating segments, which are ourfive agency networks, into one reporting segment.
A summary of our revenue and long-lived assets by geographic area for the years then ended, and as ofDecember 31, 2005, 2004 and 2003 is presented below:
(Dollars in millions)________________________________________Americas EMEA Asia/Australia_________ _________ _____________
2005Revenue .......................................................................................... $6,261.6 $3,586.0 $633.5Long-Lived Assets .......................................................................... 415.9 149.8 43.0Goodwill .......................................................................................... 5,508.4 932.2 52.5
2004Revenue .......................................................................................... $5,626.5 $3,448.2 $672.5Long-Lived Assets .......................................................................... 408.7 181.2 46.5Goodwill .......................................................................................... 5,283.4 1,081.3 46.7
2003Revenue .......................................................................................... $5,079.9 $2,982.7 $558.8Long-Lived Assets .......................................................................... 367.9 182.8 46.1Goodwill .......................................................................................... 4,758.6 1,053.4 74.2
OMNICOM GROUP INC. AND SUBSIDIARIESNOTES TO CONSOLIDATED FINANCIAL STATEMENTS (Continued)
F-18
The Americas is primarily composed of the U.S., Canada and Latin American countries. EMEA isprimarily composed of various Euro countries, the United Kingdom, other non-Euro countries, the Middle-Eastand Africa. Asia/Australia is primarily composed of China, Japan, Korea, Singapore, Australia and other Asiancountries.
6. Equity and Cost-Based Investments
We have investments in unconsolidated affiliated companies accounted for under the equity method. Theaffiliated companies offer marketing and corporate communications services similar to those offered by ouroperating companies. The equity method is used when we own less than 50% of the common stock but exercisesignificant influence over the operating and financial policies of the affiliate. The following table summarizesthe balance sheets and income statements of our unconsolidated affiliates, as of December 31, 2005 and 2004and for the years then ended:
(Dollars in millions)___________________________2005 2004_________ _________
Total net assets ................................................................................ $243.4 $176.4
Gross revenue.................................................................................. 535.3 472.4
Net income...................................................................................... 52.0 37.7
Our equity interest in the net income of these affiliated companies was $27.6 million and $17.1 million forthe years ended December 31, 2005 and 2004, respectively. Our equity interest in the net assets of theseaffiliated companies was $114.9 million and $108.2 million at December 31, 2005 and 2004, respectively.Owners of interests in certain of our affiliated companies have the right in certain circumstances to require us topurchase additional ownership interests at fair value. The terms of these rights vary for each arrangement andthe ultimate amount payable in the future also varies based upon the future earnings of the affiliated companiesand changes in the applicable foreign currency exchange rates.
Our cost-based investments at December 31, 2005 were primarily comprised of preferred interestsrepresenting equity interests of less than 20% in various service companies. This method is used when we ownless than a 20% equity interest and do not exercise significant influence over the operating and financial policiesof the investee. The total cost basis of these investments, which we evaluate for impairment, as of December 31,2005 and 2004 was $38.3 million and $41.8 million, respectively and are included in other assets on our balancesheet.
In prior years, we held a non-voting, non-participating preferred stock interest in Seneca Investments LLC(“Seneca”). Seneca was initially formed in 2001 from our contribution of Communicade, our subsidiary thatconducted e-services industry investment activities. All of Communicade’s investments at that time werecomprised of minority interests in e-services industry businesses. Upon Seneca’s formation, the transaction wasaccounted for in accordance with SFAS 140, Accounting for Transfers and Servicing Financial Assets andExtinguishments of Liabilities, and resulted in no gain or loss being recognized by us on Seneca’s formation.The preferred stock was non-voting and was entitled to dividends at a rate of 8.5%, compounded semi-annuallyand was redeemable on the 10th anniversary of issuance or earlier upon the occurrence of certain extraordinaryevents. No cash dividends were paid by Seneca or accrued by us subsequent to Seneca’s formation.
In December 2002, we acquired all of the common stock of Organic, Inc. from Seneca. The transactionwas effected by the redemption of $99.0 million of the preferred stock and the assumption of $7.2 million ofliabilities. In June 2003, we acquired all of the common stock of AGENCY.com from Seneca. The transactionwas effected by the redemption of $181.0 million of the preferred stock and the assumption of $15.8 million ofliabilities.
On Seneca’s formation and for all subsequent periods, the fair value of our investment in Seneca exceededits carrying value. Because our preferred stock did not have a conversion feature, we considered it similar to adebt instrument where it is not probable that the contractual interest payments may be collected as scheduled in
OMNICOM GROUP INC. AND SUBSIDIARIESNOTES TO CONSOLIDATED FINANCIAL STATEMENTS (Continued)
F-19
OMNICOM GROUP INC. AND SUBSIDIARIESNOTES TO CONSOLIDATED FINANCIAL STATEMENTS (Continued)
the loan agreement. Accordingly, we applied the cost-recovery method, in accordance with the provisions ofSFAS 114, Accounting by Creditors for Impairment of a Loan — an Amendment of FASB Statement No. 5, andSFAS 118, Accounting by Creditors for Impairment of a Loan-Income Recognition and Disclosures — anAmendment of FASB Statement No. 114, and we did not accrue any dividend income. Under the cost-recoverymethod, investment income cannot be recorded until it is probable of realization. Consequently, we did notrecord any investment income related to unpaid dividends and in connection with the purchases of Organic, Inc.and AGENCY.com from Seneca, we applied the redemption of our preferred stock against our remainingcarrying value of our investment such that at December 31, 2003, our remaining carrying value was reduced tozero.
In March 2004, we exchanged our remaining shares of preferred stock in Seneca for a $24.0 millionsenior secured note due in 2007 that bears interest at a rate of 6.25% and 40% of Seneca’s outstanding commonstock which we are accounting for under the equity method. The senior secured note is recorded in our otherassets. The restructuring was proposed by the common stockholders of Seneca because the expected value ofthe assets that remained in Seneca in early 2004 was insufficient to fund the preferred dividends that hadaccrued to that date and were expected to accrue prior to potential realization events in the future. Therestructuring re-aligned the incentives of the common shareholders with ours because it provided them withadditional incentives to maximize the value of the Seneca assets and to monetize the assets on an acceleratedbasis. The exchange was accounted for at fair value in accordance with APB No. 29: Accounting forNon-Monetary Transactions and Emerging Issues Task Force (“EITF”) Issue 98-3: Determining Whether aNonmonetary Transaction Involves Receipt of Productive Assets or of a Business and we recorded a net pre-taxgain of $24.0 million. The $24.0 million pre-tax gain, which was included in our 2004 operating income, waspartially offset by losses of $10.9 million from other investment activity unrelated to Seneca.
We received distributions from Seneca during 2005 and January 2006, which when applied against thesenior secured note reduced the outstanding principal balance to $1.2 million as of January 31, 2006.
7. Employee Stock Plans
Our equity incentive compensation plan was adopted in 2002 and was amended in 2003 (“EquityIncentive Plan”) and reserved 9.2 million shares of our common stock for options and other awards, of which3.3 million were for restricted stock awards. Pursuant to the Equity Incentive Plan, the exercise price of optionsawarded may not be less than 100% of the market price of the stock at the date of grant and the option termcannot be longer than seven years from the date of grant. The terms of each option and the times at which eachoption will be exercisable will be determined by the Compensation Committee of the Board of Directors. It isanticipated that the full vesting period for options will be no shorter than three years. Current year option grantsbecome exercisable 30% on each of the first two anniversary dates of the grant date with the final 40%becoming exercisable three years from the grant date.
Our prior incentive compensation plan was adopted in 1998 (“1998 Plan”) and was amended in 2000. Asa result of the adoption of the Equity Incentive Plan in 2002, no new awards may be granted under the 1998Plan. Awards that are forfeited or cancelled may be reissued under the Equity Incentive Plan.
Under the terms of our long-term shareholder value plan (“LTSV Plan”), common shares were reservedfor option awards to key employees of the Company at an exercise price that is no less than 100% of the marketprice of the stock at the date of the grant. The options become exercisable after the sixth anniversary date ofgrant. The options can become exercisable prior to this anniversary date in increments of one-third if the marketvalue of our common stock increases compared to the market price on the date of grant by at least 50%, 75%and 100%, respectively. As a result of the adoption of the Equity Incentive Plan in 2002, no new awards may begranted under the LTSV Plan. Awards that are forfeited or cancelled may be reissued under the Equity IncentivePlan.

OMNICOM GROUP INC. AND SUBSIDIARIESNOTES TO CONSOLIDATED FINANCIAL STATEMENTS (Continued)
F-20
The plans described above do not permit the holder of an award to elect cash settlement under anycircumstances.
Stock Options:
Options included under all incentive compensation plans, all of which were approved by our shareholders,for the past three years are:
2005 2004 2003_____________________________________________ ___________________________________________ __________________________________________Weighted Weighted WeightedAverage Average AverageExercise Exercise Exercise
Shares Price Shares Price Shares Price__________ ____________ _________ ____________ _________ ____________
Shares under option, beginning of year.............................................. 17,304,047 $73.05 18,677,095 $70.62 19,157,495 $69.83
Options granted under:1998 Plan ........................................ — — — — — —LTSV Plan ...................................... — — — — — —Equity Incentive Plan ...................... 20,000 80.50 50,000 77.37 617,500 47.85
Options exercised ................................ (1,452,939) 62.33 (1,376,837) 40.52 (899,943) 38.89Options forfeited .................................. (168,273) 72.90 (46,211) 67.41 (197,957) 67.43__________________ ___________ _________________ ___________ _________________ ___________Shares under option, end of year ........ 15,702,835 $74.05 17,304,047 $73.05 18,677,095 $70.62__________________ ___________ _________________ ___________ _________________ _____________________________ ___________ _________________ ___________ _________________ ___________Options exercisable at year-end .......... 11,294,439 11,822,997 10,972,492__________________ __________________ ____________________________________ __________________ __________________
The following table summarizes the information above about options outstanding and options exercisableat December 31, 2005:
Options Outstanding Options Exercisable_______________________________________________ ____________________________Weighted Average
Range of Exercise Options Remaining Weighted Average Options Weighted AveragePrices (in dollars) Outstanding Contractual Life Exercise Price Exercisable Exercise Price___________________ ___________ ______________ ______________ __________ ______________
$19.72 200,000 1 year $19.72 200,000 $19.7224.28 250,000 1-2 years 24.28 250,000 24.2839.75 to 48.03 360,000 2-3 years 42.37 360,000 42.3760.39 to 91.22 2,170,649 3-4 years 80.40 2,170,649 80.4047.74 to 81.75 2,047,200 4-5 years 71.56 1,834,200 74.3162.35 to 87.16 8,523,679 5-6 years 72.62 4,348,283 76.4480.50 to 93.55 2,151,307 6-7 years 91.83 2,131,307 91.94_________ _________
15,702,835 11,294,439_________ __________________ _________
The weighted average fair value, calculated on the basis summarized below, of each option granted was$16.87, $20.65 and $9.87 for 2005, 2004 and 2003, respectively. The fair value of each option grant has beendetermined as of the date of grant using the Black-Scholes option valuation model and with the followingassumptions (without adjusting for the risk of forfeiture and lack of liquidity):
2005 2004 2003________________________________ ________________________________ ________________________________
Expected option lives......................... 3.5 years 3.5 years 3.5 yearsRisk free interest rate ......................... 3.8% 2.2% - 3.4% 2.1%Expected volatility ............................. 24.1% 33.4% - 36.2% 29.0%Dividend yield.................................... 1.1% 1.1% - 1.2% 1.7%
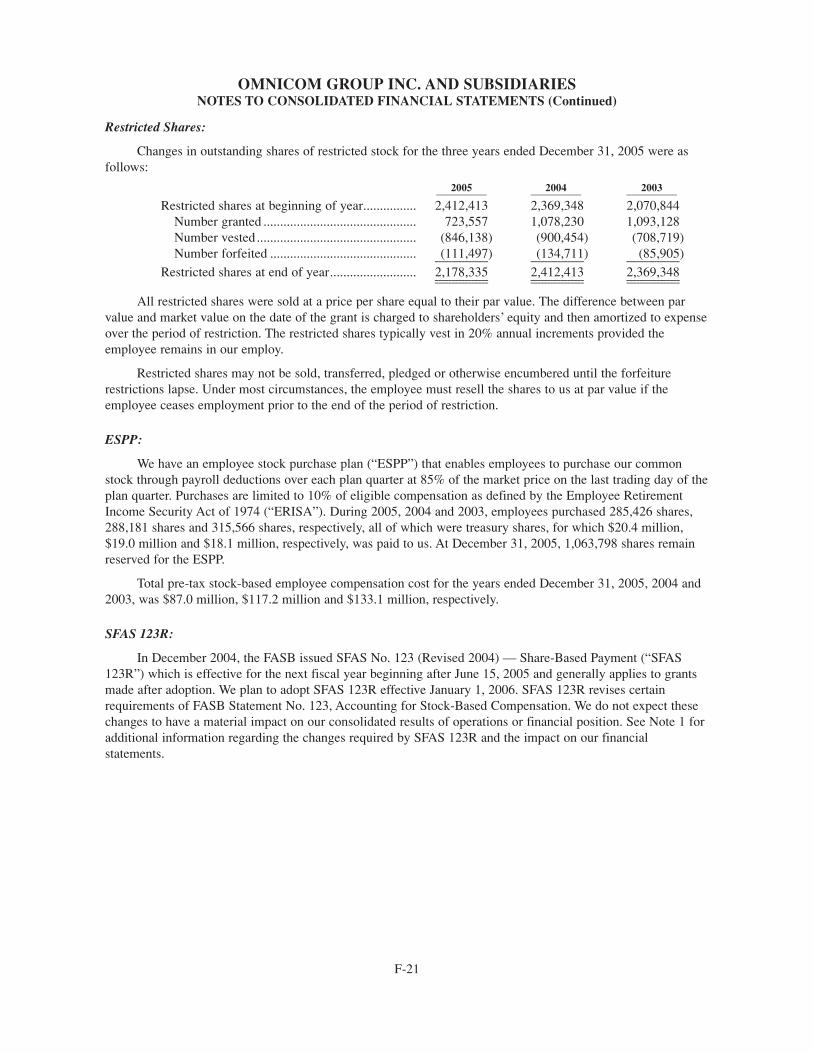
OMNICOM GROUP INC. AND SUBSIDIARIESNOTES TO CONSOLIDATED FINANCIAL STATEMENTS (Continued)
F-21
Restricted Shares:
Changes in outstanding shares of restricted stock for the three years ended December 31, 2005 were asfollows:
2005 2004 2003___________________ ___________________ ___________________
Restricted shares at beginning of year................ 2,412,413 2,369,348 2,070,844Number granted .............................................. 723,557 1,078,230 1,093,128Number vested ................................................ (846,138) (900,454) (708,719)Number forfeited ............................................ (111,497) (134,711) (85,905)________________ ________________ ________________
Restricted shares at end of year.......................... 2,178,335 2,412,413 2,369,348________________ ________________ ________________________________ ________________ ________________
All restricted shares were sold at a price per share equal to their par value. The difference between parvalue and market value on the date of the grant is charged to shareholders’ equity and then amortized to expenseover the period of restriction. The restricted shares typically vest in 20% annual increments provided theemployee remains in our employ.
Restricted shares may not be sold, transferred, pledged or otherwise encumbered until the forfeiturerestrictions lapse. Under most circumstances, the employee must resell the shares to us at par value if theemployee ceases employment prior to the end of the period of restriction.
ESPP:
We have an employee stock purchase plan (“ESPP”) that enables employees to purchase our commonstock through payroll deductions over each plan quarter at 85% of the market price on the last trading day of theplan quarter. Purchases are limited to 10% of eligible compensation as defined by the Employee RetirementIncome Security Act of 1974 (“ERISA”). During 2005, 2004 and 2003, employees purchased 285,426 shares,288,181 shares and 315,566 shares, respectively, all of which were treasury shares, for which $20.4 million,$19.0 million and $18.1 million, respectively, was paid to us. At December 31, 2005, 1,063,798 shares remainreserved for the ESPP.
Total pre-tax stock-based employee compensation cost for the years ended December 31, 2005, 2004 and2003, was $87.0 million, $117.2 million and $133.1 million, respectively.
SFAS 123R:
In December 2004, the FASB issued SFAS No. 123 (Revised 2004) — Share-Based Payment (“SFAS123R”) which is effective for the next fiscal year beginning after June 15, 2005 and generally applies to grantsmade after adoption. We plan to adopt SFAS 123R effective January 1, 2006. SFAS 123R revises certainrequirements of FASB Statement No. 123, Accounting for Stock-Based Compensation. We do not expect thesechanges to have a material impact on our consolidated results of operations or financial position. See Note 1 foradditional information regarding the changes required by SFAS 123R and the impact on our financialstatements.
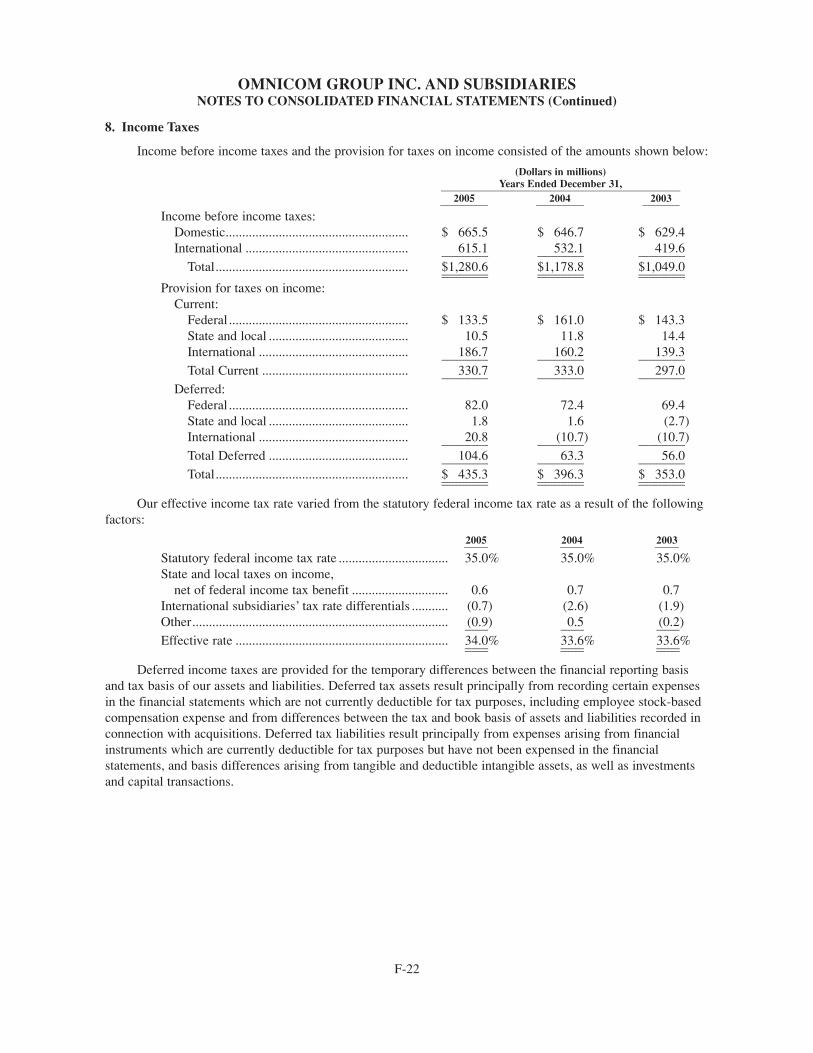
OMNICOM GROUP INC. AND SUBSIDIARIESNOTES TO CONSOLIDATED FINANCIAL STATEMENTS (Continued)
8. Income Taxes
Income before income taxes and the provision for taxes on income consisted of the amounts shown below:
(Dollars in millions)Years Ended December 31,__________________________________________________________________________________________
2005 2004 2003__________________ __________________ ______________
Income before income taxes:Domestic....................................................... $ 665.5 $ 646.7 $ 629.4International ................................................. 615.1 532.1 419.6______________ ______________ ______________
Total.......................................................... $1,280.6 $1,178.8 $1,049.0______________ ______________ ____________________________ ______________ ______________Provision for taxes on income:
Current:Federal ...................................................... $ 133.5 $ 161.0 $ 143.3State and local .......................................... 10.5 11.8 14.4International ............................................. 186.7 160.2 139.3______________ ______________ ______________Total Current ............................................ 330.7 333.0 297.0______________ ______________ ______________
Deferred:Federal ...................................................... 82.0 72.4 69.4State and local .......................................... 1.8 1.6 (2.7)International ............................................. 20.8 (10.7) (10.7)______________ ______________ ______________Total Deferred .......................................... 104.6 63.3 56.0______________ ______________ ______________Total.......................................................... $ 435.3 $ 396.3 $ 353.0______________ ______________ ____________________________ ______________ ______________
Our effective income tax rate varied from the statutory federal income tax rate as a result of the followingfactors:
2005 2004 2003_________ _________ _________
Statutory federal income tax rate ................................. 35.0% 35.0% 35.0%State and local taxes on income,
net of federal income tax benefit ............................. 0.6 0.7 0.7International subsidiaries’ tax rate differentials ........... (0.7) (2.6) (1.9)Other............................................................................. (0.9) 0.5 (0.2)_______ _______ _______Effective rate ................................................................ 34.0% 33.6% 33.6%_______ _______ ______________ _______ _______
Deferred income taxes are provided for the temporary differences between the financial reporting basisand tax basis of our assets and liabilities. Deferred tax assets result principally from recording certain expensesin the financial statements which are not currently deductible for tax purposes, including employee stock-basedcompensation expense and from differences between the tax and book basis of assets and liabilities recorded inconnection with acquisitions. Deferred tax liabilities result principally from expenses arising from financialinstruments which are currently deductible for tax purposes but have not been expensed in the financialstatements, and basis differences arising from tangible and deductible intangible assets, as well as investmentsand capital transactions.
F-22
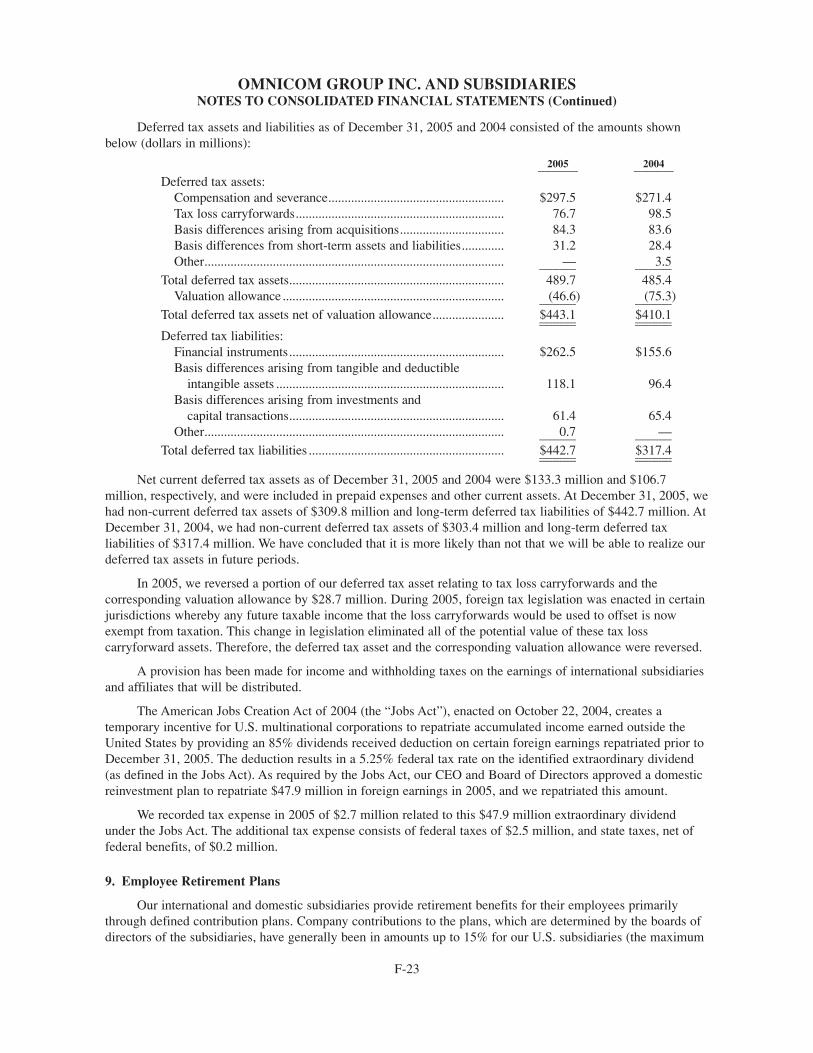
OMNICOM GROUP INC. AND SUBSIDIARIESNOTES TO CONSOLIDATED FINANCIAL STATEMENTS (Continued)
Deferred tax assets and liabilities as of December 31, 2005 and 2004 consisted of the amounts shownbelow (dollars in millions):
2005 2004____________ ____________Deferred tax assets:
Compensation and severance...................................................... $297.5 $271.4Tax loss carryforwards................................................................ 76.7 98.5Basis differences arising from acquisitions................................ 84.3 83.6Basis differences from short-term assets and liabilities............. 31.2 28.4Other............................................................................................ — 3.5___________ ___________
Total deferred tax assets.................................................................. 489.7 485.4Valuation allowance .................................................................... (46.6) (75.3)___________ ___________
Total deferred tax assets net of valuation allowance...................... $443.1 $410.1___________ ______________________ ___________Deferred tax liabilities:
Financial instruments.................................................................. $262.5 $155.6Basis differences arising from tangible and deductible
intangible assets ...................................................................... 118.1 96.4Basis differences arising from investments and
capital transactions.................................................................. 61.4 65.4Other............................................................................................ 0.7 —___________ ___________
Total deferred tax liabilities ............................................................ $442.7 $317.4___________ ______________________ ___________
Net current deferred tax assets as of December 31, 2005 and 2004 were $133.3 million and $106.7million, respectively, and were included in prepaid expenses and other current assets. At December 31, 2005, wehad non-current deferred tax assets of $309.8 million and long-term deferred tax liabilities of $442.7 million. AtDecember 31, 2004, we had non-current deferred tax assets of $303.4 million and long-term deferred taxliabilities of $317.4 million. We have concluded that it is more likely than not that we will be able to realize ourdeferred tax assets in future periods.
In 2005, we reversed a portion of our deferred tax asset relating to tax loss carryforwards and thecorresponding valuation allowance by $28.7 million. During 2005, foreign tax legislation was enacted in certainjurisdictions whereby any future taxable income that the loss carryforwards would be used to offset is nowexempt from taxation. This change in legislation eliminated all of the potential value of these tax losscarryforward assets. Therefore, the deferred tax asset and the corresponding valuation allowance were reversed.
A provision has been made for income and withholding taxes on the earnings of international subsidiariesand affiliates that will be distributed.
The American Jobs Creation Act of 2004 (the “Jobs Act”), enacted on October 22, 2004, creates atemporary incentive for U.S. multinational corporations to repatriate accumulated income earned outside theUnited States by providing an 85% dividends received deduction on certain foreign earnings repatriated prior toDecember 31, 2005. The deduction results in a 5.25% federal tax rate on the identified extraordinary dividend(as defined in the Jobs Act). As required by the Jobs Act, our CEO and Board of Directors approved a domesticreinvestment plan to repatriate $47.9 million in foreign earnings in 2005, and we repatriated this amount.
We recorded tax expense in 2005 of $2.7 million related to this $47.9 million extraordinary dividendunder the Jobs Act. The additional tax expense consists of federal taxes of $2.5 million, and state taxes, net offederal benefits, of $0.2 million.
9. Employee Retirement Plans
Our international and domestic subsidiaries provide retirement benefits for their employees primarilythrough defined contribution plans. Company contributions to the plans, which are determined by the boards ofdirectors of the subsidiaries, have generally been in amounts up to 15% for our U.S. subsidiaries (the maximum
F-23
OMNICOM GROUP INC. AND SUBSIDIARIESNOTES TO CONSOLIDATED FINANCIAL STATEMENTS (Continued)
amount deductible for U.S. federal income tax purposes) of total eligible compensation of participatingemployees. Expenses related to the Company’s contributions to these plans in 2005 were $85.6 million, 2004were $82.6 million and in 2003 were $65.3 million.
Our pension plans are primarily related to non-U.S. businesses. These plans are not subject to ERISA.Substantially all of these plans are funded by fixed premium payments to insurance companies which undertaketo provide specific benefits to the individuals covered. Pension expense recorded for these plans in 2005, 2004and 2003 was $7.2 million, $10.3 million and $7.3 million, respectively.
Certain of our subsidiaries have executive retirement programs under which benefits will be paid toparticipants or to their beneficiaries over periods up to 15 years beginning after cessation of full-timeemployment, at age 65 or death. In addition, other subsidiaries have individual deferred compensationarrangements with certain executives which provide for payments over varying terms upon retirement, cessationof employment or death. The costs related to these benefits, which are accrued during the employee’s serviceperiod with us, were not material to the 2005, 2004 and 2003 consolidated results of operations or financialposition. Our obligation with respect to these programs is included in deferred compensation and otherliabilities on the balance sheet.
10. Commitments and Contingent Liabilities
Leases:
We lease substantially all our office facilities and certain of our equipment under operating leases thatexpire at various dates. Certain leases provide us with the option to renew for additional periods. Where leasescontain escalation clauses, rent abatements, and/or concessions, such as rent holidays and landlord or tenantincentives or allowances, we apply them in the determination of straight-line rent expense over the lease term.Leasehold improvements made at inception or during the lease term are amortized over the shorter of the assetlife or the lease term, which may include renewal periods where the renewal is reasonably assured, as defined inSFAS No. 13, Accounting for Leases, as amended by SFAS No. 98, and is included in the determination ofstraight-line rent expense. Certain leases require the payment of real estate taxes or other occupancy costs,which may be subject to escalation. Rent expense for the years ended December 31, 2005, 2004 and 2003 was:
(Dollars in millions)______________________________________________________________________________________2005 2004 2003______________ ______________ ______________
Office rent ........................................................... $376.1 $371.6 $352.8Third party sublease ........................................... (23.5) (26.3) (17.3)___________ ___________ ___________
Total office rent............................................... 352.6 345.3 335.5Equipment rent ................................................... 120.1 137.6 152.4___________ ___________ ___________
Total rent......................................................... $472.7 $482.9 $487.9___________ ___________ ______________________ ___________ ___________
Future minimum office and equipment base rents under terms of non-cancelable operating leases, reducedby rents to be received from existing non-cancelable subleases, are as follows:
(Dollars in millions)______________________________________________________________________________________Gross Sublease NetRent Rent Rent______________ ______________ ______________
2006 .................................................................... $429.8 $17.2 $412.62007 .................................................................... 352.2 13.6 338.62008 .................................................................... 288.0 11.4 276.62009 .................................................................... 245.3 9.4 235.92010 .................................................................... 216.2 7.0 209.2Thereafter............................................................ 793.4 9.9 783.5
F-24
OMNICOM GROUP INC. AND SUBSIDIARIESNOTES TO CONSOLIDATED FINANCIAL STATEMENTS (Continued)
Legal Proceedings:
Beginning on June 13, 2002, several putative class actions were filed against us and certain seniorexecutives in the United States District Court for the Southern District of New York. The actions have sincebeen consolidated under the caption In re Omnicom Group Inc. Securities Litigation, No. 02-CV4483 (RCC), onbehalf of a proposed class of purchasers of our common stock between February 20, 2001 and June 11, 2002.The consolidated complaint alleges, among other things, that our public filings and other public statementsduring that period contained false and misleading statements or omitted to state material information relating to(1) our calculation of the organic growth component of period-to-period revenue growth, (2) our valuation ofand accounting for certain internet investments made by our Communicade Group (“Communicade”), which wecontributed to Seneca Investments LLC (“Seneca”) in 2001, and (3) the existence and amount of certaincontingent future obligations in respect of acquisitions. The complaint seeks an unspecified amount ofcompensatory damages plus costs and attorneys’ fees. Defendants moved to dismiss the complaint and onMarch 28, 2005, the court dismissed portions (1) and (3) of the complaint detailed above. The court’s decisiondenying the defendants’ motion to dismiss the remainder of the complaint did not address the ultimate merits ofthe case, but only the sufficiency of the pleading. Defendants have answered the complaint, and fact discovery isongoing. Plaintiffs have moved to have the proposed class certified and the defendants have opposed thatmotion, which is now fully briefed.
In addition, on June 28, 2002, a derivative action was filed on behalf of Omnicom in New York statecourt. On February 18, 2005, a second shareholder derivative action, again purportedly brought on behalf of theCompany, was filed in New York state court. The derivative actions have been consolidated before one NewYork State Justice and the plaintiffs have filed an amended consolidated complaint. The consolidated derivativecomplaint questions the business judgment of certain current and former directors of Omnicom, by challenging,among other things, the valuation of and accounting for the internet investments made by Communicade and thecontribution of those investments to Seneca. The consolidated complaint alleges that the defendants breachedtheir fiduciary duties of good faith. The lawsuit seeks from the directors the amount of profits received fromselling Omnicom stock and other unspecified damages to be paid to the Company, as well as costs andattorneys’ fees. On September 1, 2005, the defendants moved to dismiss the derivative complaint. The motionhas now been fully briefed and was argued before the court on January 12, 2006. The court has not yet ruled onthe motion.
The defendants in both cases believe that the allegations against them are baseless and intend tovigorously oppose the lawsuits. Currently, we are unable to determine the outcome of these cases and the effecton our financial position or results of operations. The outcome of any of these matters is inherently uncertainand may be affected by future events. Accordingly, there can be no assurance as to the ultimate effect of thesematters.
We are also involved from time to time in various legal proceedings in the ordinary course of business. Wedo not presently expect that these proceedings will have a material adverse effect on our consolidated financialposition or results of operations.
F-25
OMNICOM GROUP INC. AND SUBSIDIARIESNOTES TO CONSOLIDATED FINANCIAL STATEMENTS (Continued)
11. Fair Value of Financial Instruments
The following table presents the carrying amounts and fair values of our financial instruments atDecember 31, 2005 and 2004 (dollars in millions). Amounts in parentheses represent liabilities.
2005 2004_________________________________________________ _________________________________________________Carrying Fair Carrying FairAmount Value Amount Value__________ __________ __________ __________
Cash and cash equivalents...................................... $ 835.8 $ 835.8 $ 1,165.6 $ 1,165.6Short-term investments........................................... 374.1 374.1 574.0 574.0Other investments................................................... 38.3 38.3 41.8 41.8Long-term debt and convertible notes.................... (2,358.6) (2,320.4) (2,567.6) (2,570.3)Financial commitments:
Cross-currency interest rate swaps..................... (0.7) (0.7) (53.0) (53.0)Forward foreign exchange contracts .................. (0.4) (0.4) (2.8) (2.8)Guarantees .......................................................... — (0.2) — (0.2)Letters of credit .................................................. — — — —
The following methods and assumptions were used to estimate the fair value of each class of financialinstruments for which it is practicable to estimate that value.
Short-term investments:
Short-term investments consist primarily of investments made with our excess cash which we expect toconvert into cash in our current operating cycle, generally within one year. They are carried at market whichapproximates cost.
Other investments:
Other investments are carried at cost, which approximates fair value. See Note 6 for additionalinformation about these investments.
Long-term debt and convertible notes:
A portion of our long-term debt includes floating rate debt, the carrying value of which approximates fairvalue. Our long-term debt includes convertible notes and fixed rate debt in the prior year. The fair value of theseinstruments was determined by reference to quotations available in markets where these instruments are traded.
Financial commitments:
The estimated fair values of derivative positions in cross-currency interest rate swaps and forward foreignexchange contracts are based upon quotations received from independent, third party banks and represent thenet amount required to terminate the positions, taking into consideration market rates and counterparty creditrisk. The fair values of guarantees and letters of credit are based upon the stated value of the underlyinginstruments. The guarantees, which relate to real estate leases, were issued by us for affiliated companies.Letters of credit, when issued, represent guarantees issued by us on behalf of our operating companies foractivities in the normal course of business.
12. Financial Instruments and Market Risk
SFAS No. 133 establishes accounting and reporting standards requiring that derivative instruments whichmeet the SFAS 133 definition of a derivative (including certain derivative instruments embedded in othercontracts) be recorded in the balance sheet as either an asset or liability measured at its fair value.
Derivatives that do not qualify for hedge accounting must be adjusted to fair value through earnings. If thederivative is a hedge, depending on the nature of the hedge, changes in the fair value of derivatives will either beoffset against the change in fair value of the hedged assets, liabilities or firm commitments through earnings or
F-26

OMNICOM GROUP INC. AND SUBSIDIARIESNOTES TO CONSOLIDATED FINANCIAL STATEMENTS (Continued)
recognized in other comprehensive income until the hedged item is recognized in earnings. The ineffectiveportion of the change in fair value of a derivative used as a hedge is required to be immediately recognized inour statement of income.
Our derivative activities are confined to risk management activities related to our international operations.We enter into short-term forward foreign exchange contracts which mitigate the foreign exchange risk of ourintercompany cash movements between subsidiaries operating in different currency markets from that of ourtreasury centers from which they borrow or invest. In the limited number of instances where operating expensesand revenues are not denominated in the same currency, amounts are promptly settled in the foreign currencymarket with forward contracts. Changes in market value of the forward contracts are included in the incomestatement and are offset by the corresponding change in value of the underlying asset or liability. The terms ofthese contracts are generally 90 days or less. At December 31, 2005 and 2004, the aggregate amount ofintercompany receivables and payables subject to this hedge program was $50.4 million and $1,453.0 million,respectively. The table below summarizes by major currency the notional principal amounts of the Company’sforward foreign exchange contracts outstanding at December 31, 2005 and 2004. The “buy” amounts representthe U.S. Dollar equivalent of commitments to purchase the respective currency, and the “sell” amounts representthe U.S. Dollar equivalent of commitments to sell the respective currency. See Note 11 for a discussion of thevalue of these instruments.
(Dollars in millions)Notional Principal Amount_____________________________________________________
2005 2004______________________________________________ ______________________________________________Company Company Company Company
Buys Sells Buys Sells________ ________ ________ ________U.S. Dollar ................................................ $ 3.2 $10.0 $ 51.2 $ 36.0British Pound ............................................ 13.2 7.8 551.1 125.9Euro........................................................... 8.6 0.2 36.0 498.8Japanese Yen ............................................. — 0.2 79.0 3.7Other.......................................................... — 7.2 8.2 63.1_________ _________ ___________ ___________Total........................................................... $25.0 $25.4 $725.5 $727.5_________ _________ ___________ ____________________ _________ ___________ ___________
The decline in the outstanding foreign exchange contracts at December 31, 2005, reflects our strategy formanaging the risk of foreign exchange currency fluctuations in our intercompany balances. We implementedmulticurrency pooling arrangements instead of using foreign exchange forward contracts. This changeaccomplishes the same result without the need for third-party contracts.
We manage the foreign exchange fluctuations that may be caused by our intercompany cash movements,by entering into short-term forward foreign exchange contracts which mitigate the foreign exchange risk of theU.S. Dollar commercial paper issued by our London treasury center, whose functional currency is the BritishPound. At December 31, 2005, we had no forward contracts outstanding relating to this activity as there was nocommercial paper outstanding.
At December 31, 2004, we had Japanese Yen 19.1 billion aggregate notional principal amount ofcross-currency interest rate swaps. During the second and third quarters of 2005, our Japanese Yen basedinterest rate swaps matured and were not replaced. The swaps effectively hedged our net investment in JapaneseYen denominated assets. Also, during the second half of the year, we entered into €230.0 million (Euro)aggregate notional principal amount cross-currency interest rate swaps which mature in 2010. These swapseffectively hedge our net investment in certain Euro-denominated assets.
We have established a centralized reporting system to evaluate the effects of changes in interest rates,currency exchange rates and other relevant market risks. We periodically determine the potential loss frommarket risk by performing a value-at-risk computation. Value-at-risk analysis is a statistical model that utilizeshistoric currency exchange and interest rate data to measure the potential impact on future earnings of ourexisting portfolio of derivative financial instruments. The value-at-risk analysis we performed on ourDecember 31, 2005 portfolio of derivative financial instruments indicated that the risk of loss was immaterial.Counterparty risk arises from the inability of a counterparty to meet its obligations. To mitigate counterparty
F-27
OMNICOM GROUP INC. AND SUBSIDIARIESNOTES TO CONSOLIDATED FINANCIAL STATEMENTS (Continued)
risk, we entered into derivative contracts with major well-known banks and financial institutions that have creditratings at least equal to our credit rating. This system is designed to enable us to initiate remedial action, ifappropriate.
The foreign currency and swap contracts existing during the years ended December 31, 2005 and 2004were entered into for the purpose of seeking to mitigate the risk of certain specific adverse currency risks. As aresult of these financial instruments, we reduced financial risk in exchange for foregoing any gain (reward) thatmight have occurred if the markets moved favorably. In using these contracts, management exchanged the risksof the financial markets for counterparty risk. To minimize counterparty risk, we only enter into these contractswith major well-known banks and financial institutions that have credit ratings equal to or better than our creditrating.
13. New Accounting Pronouncements
The following pronouncements were either issued by the FASB or adopted by us in 2003, 2004 and 2005,and impacted our financial statements as discussed below:
• SFAS No. 146, Accounting for Costs Associated with Exit or Disposal Activities (“SFAS 146”),
• SFAS No. 123, Accounting for Stock-Based Compensation (“SFAS 123”), as amended by SFAS 148,Accounting for Stock-Based Compensation — Transition and Disclosure — An Amendment of FASBNo. 123 (“SFAS 148”) and as subsequently revised by SFAS No. 123 (Revised 2004) — Share BasedPayment (“SFAS 123R”),
• SFAS No. 150, Accounting for Certain Financial Instruments with Characteristics of Both Liabilitiesand Equity (“SFAS 150”), and
• SFAS No. 154, Accounting Changes and Error Corrections — a replacement of APB Opinion No. 20and FASB Statement No. 3 (“SFAS 154”).
SFAS 146 requires costs associated with exit or disposal activities be recognized and measured initially atfair value only when the liability is incurred. SFAS 146 is effective for exit or disposal costs that are initiatedafter December 31, 2002. We adopted SFAS 146 effective January 1, 2003. The adoption did not have a materialimpact on our consolidated results of operations or financial condition.
In accordance with SFAS No. 123, as amended by SFAS No. 148, we elected, effective January 1, 2004,to account for stock-based employee compensation using the fair value method. As a result, the fair value ofstock-based employee compensation, including unvested employee stock options issued and outstanding, wererecorded as an expense in the current year utilizing the retroactive restatement method as set forth in SFAS 148.Accordingly, our results for the prior years have been restated as if we had used the fair value method toaccount for stock-based employee compensation. Pre-tax stock-based employee compensation expense for theyears ended December 31, 2005, 2004 and 2003 was $87.0 million, $117.2 million and $133.1 million,respectively. Also in connection with the restatement, our December 31, 2003 balance sheet reflects an increasein deferred tax benefits of $120.5 million, an increase in additional paid-in capital of $434.7 million, an increasein unamortized stock-based compensation of $92.6 million and a decrease in retained earnings of $221.6million.
In December 2004, the FASB issued SFAS No. 123 (Revised 2004) — Share-Based Payment (“SFAS123R”) which is effective for the next fiscal year beginning after June 15, 2005 and generally applies to grantsmade after adoption. We plan to adopt SFAS 123R effective January 1, 2006. SFAS 123R revises certainrequirements of FASB Statement No. 123, Accounting for Stock-Based Compensation. We do not expect thesechanges to have a material impact on our consolidated results of operations or financial position. Additionalinformation also can be found in Note 1 regarding the changes required by SFAS 123R and the impact on ourfinancial statements.
F-28
OMNICOM GROUP INC. AND SUBSIDIARIESNOTES TO CONSOLIDATED FINANCIAL STATEMENTS (Continued)
SFAS 150 establishes standards for how an issuer classifies and measures certain financial instrumentswith characteristics of both liabilities and equity. It requires that an issuer classify a financial instrument that iswithin its scope as a liability (or as an asset in some circumstances). We adopted the standard, as modified byFSP 150-3, in the third quarter of 2003. The adoption did not have an impact on, or result in additionaldisclosure in, our consolidated results of operations or financial condition.
SFAS 154 provides guidance on the accounting for and reporting of accounting changes and errorcorrections. SFAS 154 is effective for accounting changes and error corrections made in fiscal years beginningafter December 15, 2005. We are in the process of assessing the full impact; however, we believe that theadoption of SFAS 154 will not have a material impact on our consolidated results of operations or financialcondition.
The FASB issued two staff positions on accounting for income taxes to address recent changes enacted bythe United States Congress. Staff Position FAS 109-1, Application of FASB Statement No. 109, Accounting forIncome Taxes, for the Tax Deduction Provided to U.S. Based Manufacturers by the American Jobs Creation Actof 2004 (the “Jobs Act”) (“FSP No. 109-1”), and Staff Position FAS 109-2, Accounting and DisclosureGuidance for the Foreign Earnings Repatriation Provisions within the American Jobs Creation Act of 2004(“FSP No. 109-2”). We believe that FSP 109-1 does not apply to our business. In the fourth quarter of 2005, werepatriated $47.9 million of foreign earnings utilizing the 85% dividend received deduction provided by the JobsAct and in accordance with FSP 109-2, we recorded a $2.7 million domestic tax liability, which is included inour full year effective tax rate of 34.0%.
The FASB Interpretation (“FIN”) 46, Consolidation of Variable Interest Entities — An Interpretation ofARB No. 51 (“FIN 46”) addresses the consolidation by business enterprises of variable interest entities, asdefined in FIN 46, and is based on the concept that companies that control another entity through interests,other than voting interests, should consolidate the controlled entity. The consolidation requirements applyimmediately to FIN 46 interests held in variable interest entities created after January 31, 2003 and to interestsheld in variable interest entities that existed prior to February 1, 2003 and remain in existence as of July 1,2003. The FASB subsequently issued FIN 46R in December 2003, which modified certain provisions of FIN 46.The effective date of FIN 46R applies to the first reporting period after March 15, 2004. The application of FIN46 as originally issued and as revised by the issuance of FIN 46R did not have an impact on, or result inadditional disclosure in, our consolidated results of operations or financial condition.
The FASB issued FIN 47, Accounting for Conditional Asset Retirement Obligations — An Interpretationof FASB Statement No. 143 (“FIN 47”). FIN 47 clarifies the timing of liability recognition for legal obligationsassociated with the retirement of a tangible long-lived asset when the timing and/or method of settlement areconditional on a future event. We adopted FIN 47 during the fourth quarter of 2005. The adoption did not have amaterial impact on our consolidated results of operations or financial condition.
The FASB issued several FASB Staff Positions (“FSP”) during 2004 and 2005, covering several topicsthat impact our financial statements. These topics include:
• other-than-temporary impairment of certain investments (“FSP FAS 115-1” and “FSP FAS 124-1”),
• the classification of freestanding instruments (“FSP FAS 123(R)-1”),
• the clarification and definition of grant date (“FSP FAS 123(R)-2”),
• the transition election related to the tax effects of share-based awards (“FSP FAS 123(R)-3”),
• the disclosure requirements related to contingently convertible securities (“FSP FAS 129-1”),
• the accounting for variable interests of specific assets (“FSP FIN 46(R)-1”),
• the calculation of losses related to variable interests (“FSP FIN 46(R)-2”),
• the determination of direct or indirect voting rights (“FSP FIN 46(R)-3”),
F-29
OMNICOM GROUP INC. AND SUBSIDIARIESNOTES TO CONSOLIDATED FINANCIAL STATEMENTS (Continued)
• guidance in implementing variable accounting in a lease transaction (“FSP FIN 46(R)-4” and “FSPFIN 46(R)-5”),
• accounting for freestanding financial instruments issued as employee compensation (“FSP EITF00-19-1”),
• accounting for other-than-temporary impairment on certain investments (“FSP EITF Issue 03-1-1”),and
• accounting for other comprehensive income of an investee (“FSP APB 18-1”).
The application of these FSPs did not have a material impact on our consolidated result of operations orfinancial condition.
The Emerging Issues Task Force (“EITF”) of the FASB released interpretive guidance in 2003, 2004 and2005 covering several topics that impact our financial statements. These topics include:
• revenue arrangements with multiple deliverables (“EITF 00-21”),
• application of equity method accounting to investments other than common stock (“EITF 02-14”),
• vendor rebates (“EITF 02-16”),
• customer relationship intangible assets acquired (“EITF 02-17”),
• other-than-temporary impairment related to certain investments (“EITF 03-1”),
• participating securities and the two-class method (“EITF 03-6”),
• reporting impairment or disposal of long-lived assets (“EITF 03-13”),
• accounting for investments in limited liability companies (“EITF 03-16”),
• accounting for pre-existing relationships with a business combination (“EITF 04-1”),
• the effect of contingently convertible debt on diluted earnings per share (“EITF 04-8”),
• aggregation of operating segments (“EITF 04-10”),
• accounting for certain derivative instruments (“EITF 05-2”),
• determining amortization periods for leasehold improvement (“EITF 05-6”), and
• income tax consequences of issuing convertible debt with beneficial conversion features (“EITF 05-8”).
The application of these guidance topics did not have a material impact on our consolidated results ofoperations or financial condition.
14. Subsequent Event
In February 2006, we paid $39.2 million to qualified noteholders of our 2031 Notes as an incentive to theholders not to exercise their February 2006 put right. Accordingly, none of our 2031 Notes were put back to us.This payment is being amortized ratably through the next put date in February 2007.
F-30
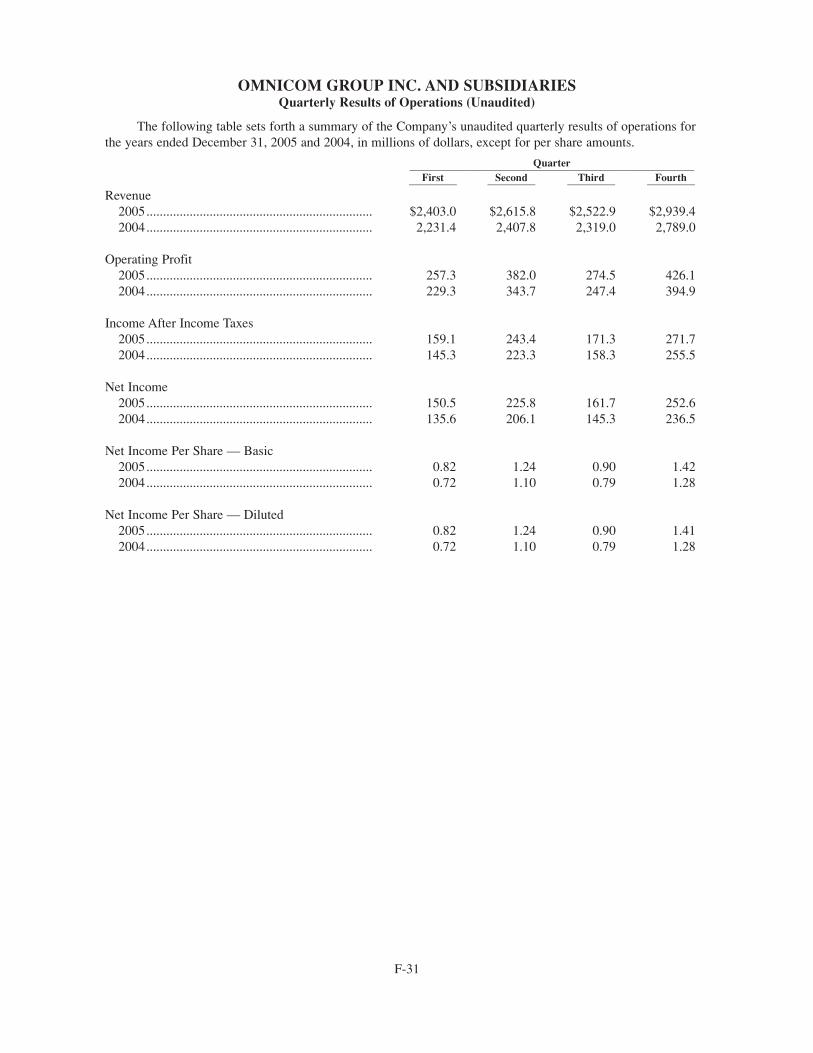
OMNICOM GROUP INC. AND SUBSIDIARIESQuarterly Results of Operations (Unaudited)
The following table sets forth a summary of the Company’s unaudited quarterly results of operations forthe years ended December 31, 2005 and 2004, in millions of dollars, except for per share amounts.
Quarter___________________________________________________________________________________________________________First Second Third Fourth_________ _________ _________ _________
Revenue2005.................................................................... $2,403.0 $2,615.8 $2,522.9 $2,939.42004.................................................................... 2,231.4 2,407.8 2,319.0 2,789.0
Operating Profit2005.................................................................... 257.3 382.0 274.5 426.12004.................................................................... 229.3 343.7 247.4 394.9
Income After Income Taxes2005.................................................................... 159.1 243.4 171.3 271.72004.................................................................... 145.3 223.3 158.3 255.5
Net Income2005.................................................................... 150.5 225.8 161.7 252.62004.................................................................... 135.6 206.1 145.3 236.5
Net Income Per Share — Basic2005.................................................................... 0.82 1.24 0.90 1.422004.................................................................... 0.72 1.10 0.79 1.28
Net Income Per Share — Diluted2005.................................................................... 0.82 1.24 0.90 1.412004.................................................................... 0.72 1.10 0.79 1.28
F-31

S-1
Schedule IIOMNICOM GROUP INC. AND SUBSIDIARIES
SCHEDULE II — VALUATION AND QUALIFYING ACCOUNTS
For the Three Years Ended December 31, 2005(Dollars in millions)
Column A Column B Column C Column D Column E
TranslationBalance at Charged Removal of Adjustments BalanceBeginning to Costs Uncollectible (Increase) at End of
Description of Period and Expenses Receivables (1) Decrease Period
Valuation accounts deducted fromAssets to which they apply —Allowance for doubtful accounts:
December 31, 2005 .................................. $67.8 $10.0 $19.7 $ 4.2 $53.9
December 31, 2004 .................................. 69.7 19.3 24.0 (2.8) 67.8
December 31, 2003 .................................. 75.6 12.9 24.6 (5.8) 69.7
(1) Net of acquisition date balances in allowance for doubtful accounts of companies acquired of $0.7 million,$0.1 million and $0.6 million in 2005, 2004 and 2003, respectively.

EXHIBIT 12.1
Computation of Ratio of Earnings to Fixed Charges(Dollars in millions, except ratios)
For the Years Ended December 31,___________________________________________________________________________________________________________________________________2005 2004 2003 2002 2001______________________ ______________________ ______________________ ______________________ ___________________
Earnings as defined:Income before income taxes, as reported $1,280.6 $1,178.8 $1,049.1 $ 954.4 $ 816.3Add: Dividends from affiliates ............ 16.2 13.9 15.9 17.2 28.4
Interest expense............................ 78.0 51.1 57.9 45.5 90.9Interest factor (re: rentals)(a) ........ 157.6 161.0 162.6 154.4 150.9______________ ______________ ______________ ______________ ______________
Total earnings ............................................ $1,532.4 $1,404.8 $1,285.5 $1,171.5 $1,086.5______________ ______________ ______________ ______________ ____________________________ ______________ ______________ ______________ ______________
Fixed charges as defined:Interest expense ........................................ $ 78.0 $ 51.1 $ 57.9 $ 45.5 $ 90.9Interest factor (re: rentals)(a) ...................... 157.6 161.0 162.6 154.5 150.9______________ ______________ ______________ ______________ ______________
Total fixed charges ........................................ $ 235.6 $ 212.1 $ 220.5 $ 200.0 $ 241.8______________ ______________ ______________ ______________ ____________________________ ______________ ______________ ______________ ______________Ratio of earnings to fixed charges ................ 6.50x 6.62x 5.83x 5.86x 4.49x
(a) The interest factor related to rentals reflects the appropriate portion of rental expense representative of aninterest factor.
S-2
EXHIBIT 23.1
CONSENT OF INDEPENDENT REGISTERED PUBLIC ACCOUNTING FIRM
The Board of DirectorsOmnicom Group Inc.:
We consent to the incorporation by reference in the registration statements (Registration Statement Nos.333-84498, 333-33972, 333-37634, 333-41717, 333-70091, 333-74591, 333-74727, 333-74879, 333-84349,333-90931, 333-108063, 333-115892) on Form S-8, (Registration Statement No. 333-47426) on Form S-4 and(Registration Statement Nos. 333-22589, 333-35670, 333-43883, 333-44481, 333-44483, 333-47047,333-47342, 333-52828, 333-104391, 333-108611, 333-112840, 333-112841) on Form S-3 of Omnicom GroupInc. and subsidiaries of our reports dated February 24, 2006, with respect to the consolidated balance sheets ofOmnicom Group Inc. and subsidiaries as of December 31, 2005 and 2004, and the related consolidatedstatements of income, shareholders’ equity, and cash flows for each of the years in the three-year period endedDecember 31, 2005, and all related financial statement schedules, management’s assessment of the effectivenessof internal control over financial reporting as of December 31, 2005 and the effectiveness of internal control overfinancial reporting as of December 31, 2005, which reports appear in the December 31, 2005 annual report onForm 10-K of Omnicom Group Inc. and subsidiaries.
As discussed in Note 13 to the consolidated financial statements, Omnicom Group Inc. adopted SFAS No.123, “Accounting for Stock-Based Compensation,” as amended by SFAS No. 148, “Accounting for Stock-BasedCompensation — Transition and Disclosure,” an amendment of SFAS No. 123 in 2004.
/s/ KPMG LLP
New York, New YorkFebruary 24, 2006
S-3
EXHIBIT 31.1
CERTIFICATIONI, John D. Wren, certify that:
1. I have reviewed this Annual Report on Form 10-K for the period ended December 31, 2005 ofOmnicom Group Inc.;
2. Based on my knowledge, this report does not contain any untrue statement of a material fact or omit tostate a material fact necessary to make the statements made, in light of the circumstances under whichsuch statements were made, not misleading with respect to the period covered by this report;
3. Based on my knowledge, the financial statements, and other financial information included in thisreport, fairly present in all material respects the financial condition, results of operations and cashflows of the registrant as of, and for, the periods presented in this report;
4. The registrant’s other certifying officer and I are responsible for establishing and maintainingdisclosure controls and procedures (as defined in Exchange Act Rules 13a-15(e) and 15d-15(e)) andinternal control over financial reporting (as defined in Exchange Act Rules 13a-15(f) and 15d-15(f))for the registrant and have:
a) Designed such disclosure controls and procedures, or caused such disclosure controls andprocedures to be designed under our supervision, to ensure that material information relating tothe registrant, including its consolidated subsidiaries, is made known to us by others withinthose entities, particularly during the period in which this annual report is being prepared;
b) Designed such internal control over financial reporting, or caused such internal control overfinancial reporting to be designed under our supervision, to provide reasonable assuranceregarding the reliability of financial reporting and the preparation of financial statements forexternal purposes in accordance with generally accepted accounting principles;
c) Evaluated the effectiveness of the registrant’s disclosure controls and procedures and presentedin this report our conclusions about the effectiveness of the disclosure controls and procedures,as of the end of the period covered by this report based on such evaluation; and
d) Disclosed in this report any change in the registrant’s internal control over financial reportingthat occurred during the registrant’s most recent fiscal quarter (the registrant’s fourth fiscalquarter in the case of our annual report) that has materially affected, or is reasonably likely tomaterially affect, the registrant’s internal control over financial reporting; and
5. The registrant’s other certifying officer and I have disclosed, based on our most recent evaluation ofinternal control over financial reporting, to the registrant’s auditors and the audit committee of theregistrant’s board of directors (or persons performing the equivalent functions):
a) All significant deficiencies and material weaknesses in the design or operation of internalcontrol over financial reporting which are reasonably likely to adversely affect the registrant’sability to record, process, summarize and report financial information; and
b) Any fraud, whether or not material, that involves management or other employees who have asignificant role in the registrant’s internal control over financial reporting.
Date: February 24, 2006 /s/ John D. WrenJohn D. Wren
Chief Executive Officer and President
S-4

EXHIBIT 31.2
CERTIFICATIONI, Randall J. Weisenburger, certify that:
1. I have reviewed this Annual Report on Form 10-K for the period ended December 31, 2005 ofOmnicom Group Inc.;
2. Based on my knowledge, this report does not contain any untrue statement of a material fact or omit tostate a material fact necessary to make the statements made, in light of the circumstances under whichsuch statements were made, not misleading with respect to the period covered by this report;
3. Based on my knowledge, the financial statements, and other financial information included in thisreport, fairly present in all material respects the financial condition, results of operations and cashflows of the registrant as of, and for, the periods presented in this report;
4. The registrant’s other certifying officer and I are responsible for establishing and maintainingdisclosure controls and procedures (as defined in Exchange Act Rules 13a-15(e) and 15d-15(e)) andinternal control over financial reporting (as defined in Exchange Act Rules 13a-15(f) and 15d-15(f))for the registrant and have:
a) Designed such disclosure controls and procedures, or caused such disclosure controls andprocedures to be designed under our supervision, to ensure that material information relating tothe registrant, including its consolidated subsidiaries, is made known to us by others withinthose entities, particularly during the period in which this annual report is being prepared;
b) Designed such internal control over financial reporting, or caused such internal control overfinancial reporting to be designed under our supervision, to provide reasonable assuranceregarding the reliability of financial reporting and the preparation of financial statements forexternal purposes in accordance with generally accepted accounting principles;
c) Evaluated the effectiveness of the registrant’s disclosure controls and procedures and presentedin this report our conclusions about the effectiveness of the disclosure controls and procedures,as of the end of the period covered by this report based on such evaluation; and
d) Disclosed in this report any change in the registrant’s internal control over financial reportingthat occurred during the registrant’s most recent fiscal quarter (the registrant’s fourth fiscalquarter in the case of our annual report) that has materially affected, or is reasonably likely tomaterially affect, the registrant’s internal control over financial reporting; and
5. The registrant’s other certifying officer and I have disclosed, based on our most recent evaluation ofinternal control over financial reporting, to the registrant’s auditors and the audit committee of theregistrant’s board of directors (or persons performing the equivalent functions):
a) All significant deficiencies and material weaknesses in the design or operation of internalcontrol over financial reporting which are reasonably likely to adversely affect the registrant’sability to record, process, summarize and report financial information; and
b) Any fraud, whether or not material, that involves management or other employees who have asignificant role in the registrant’s internal control over financial reporting.
Date: February 24, 2006 /s/ Randall J. WeisenburgerRandall J. Weisenburger
Executive Vice President andChief Financial Officer
S-5

EXHIBIT 32.1
CERTIFICATION OFANNUAL REPORT ON FORM 10-K
Pursuant to 18 U.S.C. ss. 1350, as adopted pursuant to ss. 906 of the Sarbanes-Oxley Act of 2002, inconnection with the filing of Omnicom Group Inc.’s Annual Report on Form 10-K for the year ended December31, 2005, as filed with the Securities and Exchange Commission on the date hereof (the “Report”), each of theundersigned officers of Omnicom Group Inc. certifies that, to such officer’s knowledge:
• the Report fully complies with the requirements of Section 13(a) or 15(d) of the Securities ExchangeAct of 1934; and
• the information contained in the Report fairly presents, in all material aspects, the financial conditionand results of operations of Omnicom Group Inc. as of the dates and for the periods expressed in theReport.
Executed as of February 24, 2006.
/S/ JOHN D. WREN________________________________Name: John D. WrenTitle: Chief Executive Officer and President
/S/ RANDALL J. WEISENBURGER________________________________Name: Randall J. WeisenburgerTitle: Executive Vice President and
Chief Financial Officer
S-6

Omnicom
Board Of Directors
BRUCE CRAWFORDChairman,Omnicom Group
JOHN D. WRENPresident and Chief Executive Officer,Omnicom Group
ROBERT CHARLES CLARKHarvard University Distinguished Service Professor,Harvard Law School
LEONARD S. COLEMAN, JR.Former President, National League of Professional Baseball,Former Chairman, Arena Co.
ERROL M. COOKPrivate Investor and Consultant,Former Managing Director and Partner,Warburg Pincus
SUSAN S. DENISONPartner, Cook Associates
MICHAEL A. HENNINGFormer Deputy Chairman, Ernst & Young
JOHN R. MURPHYVice Chairman,National Geographic Society
JOHN R. PURCELLChairman and Chief Executive Officer,Grenadier Associates Ltd.
LINDA JOHNSON RICEPresident and Chief Executive Officer,Johnson Publishing Company, Inc.
GARY L. ROUBOSFormer Chairman,Dover Corporation
Committees Of The Board
AUDITJohn R. Murphy, Chairman Robert Charles ClarkErrol M. Cook Michael A. Henning
COMPENSATIONGary L. Roubos, ChairmanLeonard S. Coleman, Jr.Susan S. DenisonLinda Johnson Rice
FINANCEBruce Crawford, Chairman John R. Purcell Gary L. Roubos
GOVERNANCEJohn R. Purcell, ChairmanRobert Charles ClarkLeonard S. Coleman, Jr.Susan S. DenisonJohn R. MurphyLinda Johnson Rice
Omnicom Officers
JOHN D. WRENPresident and Chief Executive Officer
RANDALL J. WEISENBURGERExecutive Vice President andChief Financial Officer
MICHAEL BIRKINVice Chairman
PETER MEADVice Chairman
BRUCE REDDITTExecutive Vice President
SUSAN SMITH ELLISExecutive Vice President
PHILIP J. ANGELASTROSenior Vice President Finance and Controller
MICHAEL J. O’BRIENSenior Vice President, General Counsel andSecretary
PHILIP J. GEORGETax Counsel
DENNIS E. HEWITTTreasurer
Omnicom
CORPORATE INFORMATION
PRINCIPAL EXECUTIVE OFFICES
OMNICOM GROUP INC. 437 Madison Avenue New York, New York 10022 Tel: (212) 415-3600
OMNICOM GROUP INC
One East Weaver Street Greenwich, Connecticut 06831 Tel: (203) 618-1500
OMNICOM EUROPE LIMITED
239 Old Marylebone Road London, NWI 5QT Tel: +44 (0) 7298 7007
OMNICOM ASIA PACIFIC — TOKYO
Harumi Triton Square X 39F 1-8-10 Harumi, Chuo-ku Tokyo 104-6039 Japan Tel: +81 3 6221 3300
OMNICOM ASIA PACIFIC — SHANGHAI
3701, 1 Grand Gateway, No. 1 Hong Qiao Road Xu Hui District, Shanghai 200030 P.R. China Tel: +86 21 6407 9393
www.omnicomgroup.com
ANNUAL MEETING
The Annual Meeting of Stockholders will beheld on Tuesday, May 23, 2006, at10:00 a.m. Pacific Time atDDB San Francisco555 Market StreetSan Francisco, California 94105
SEC CERTIFICATIONS
The certifications by the Chief Executive Officerand President and the Executive Vice Presidentand Chief Financial Officer of Omnicom GroupInc., required under Section 302 of the Sarbanes-Oxley Act of 2002, have also been filed asexhibits to the company’s 2005 Annual Reporton Form 10-K.
NYSE CERTIFICATION
The Chief Executive Officer and President ofOmnicom Group Inc. made an unqualifiedcertification to the New York Stock Exchange(NYSE) with respect to the company’scompliance with the NYSE CorporateGovernance listing standards in June 2005.
STOCK LISTING
Omnicom common stock istraded on the New York Stock Exchange.The ticker symbol is OMC.
TRANSFER AGENT & REGISTRAR
Mellon Investor Services LLC480 Washington Blvd.Jersey City, New Jersey 07310-1900 www.melloninvestor.com
INVESTOR SERVICES PROGRAM
An Investor Services Program, which includesdirect stock purchase and dividend reinvestmentfeatures, is available to stockholders of recordand other interested investors. For furtherinformation, please contact Mellon InvestorServices at 877.870.2370 or go towww.melloninvestor.com.
STOCK TRANSFER MATTERS/CHANGE OF ADDRESS
To assist you in handling matters relating tostock transfer or change of address, pleasewrite to or call our transfer agent:Mellon Investor Services LLCShareholder Relations Dept.P.O. Box 3315South Hackensack, New Jersey 07606-1915877.870.2370
INDEPENDENT AUDITORS
KPMG LLP345 Park AvenueNew York, New York 10154
Printed on Recycled Paper