ofr 2004-15, tsunami hazard map of the bellingham...
TRANSCRIPT
1
2
3
5
4
1 Washington Division of Geology and Earth Resources, PO Box 47007, Olympia, WA 98504-7007, [email protected] National Oceanic and Atmospheric Administration, Pacific Marine Environmental Laboratory, 7600 Sand Point Way NE, Seattle, WA 98115-6349
[email protected], [email protected], [email protected], [email protected]
WASHINGTON DIVISION OF GEOLOGY AND EARTH RESOURCES
OPEN FILE REPORT 2004-15
Division of Geology and Earth Resources
Ron Teissere - State Geologist
SCALE 1:50,000
15000 FEET10000500005000
11 0 2 3 MILES
11 0 2 3 4 5 KILOMETERS
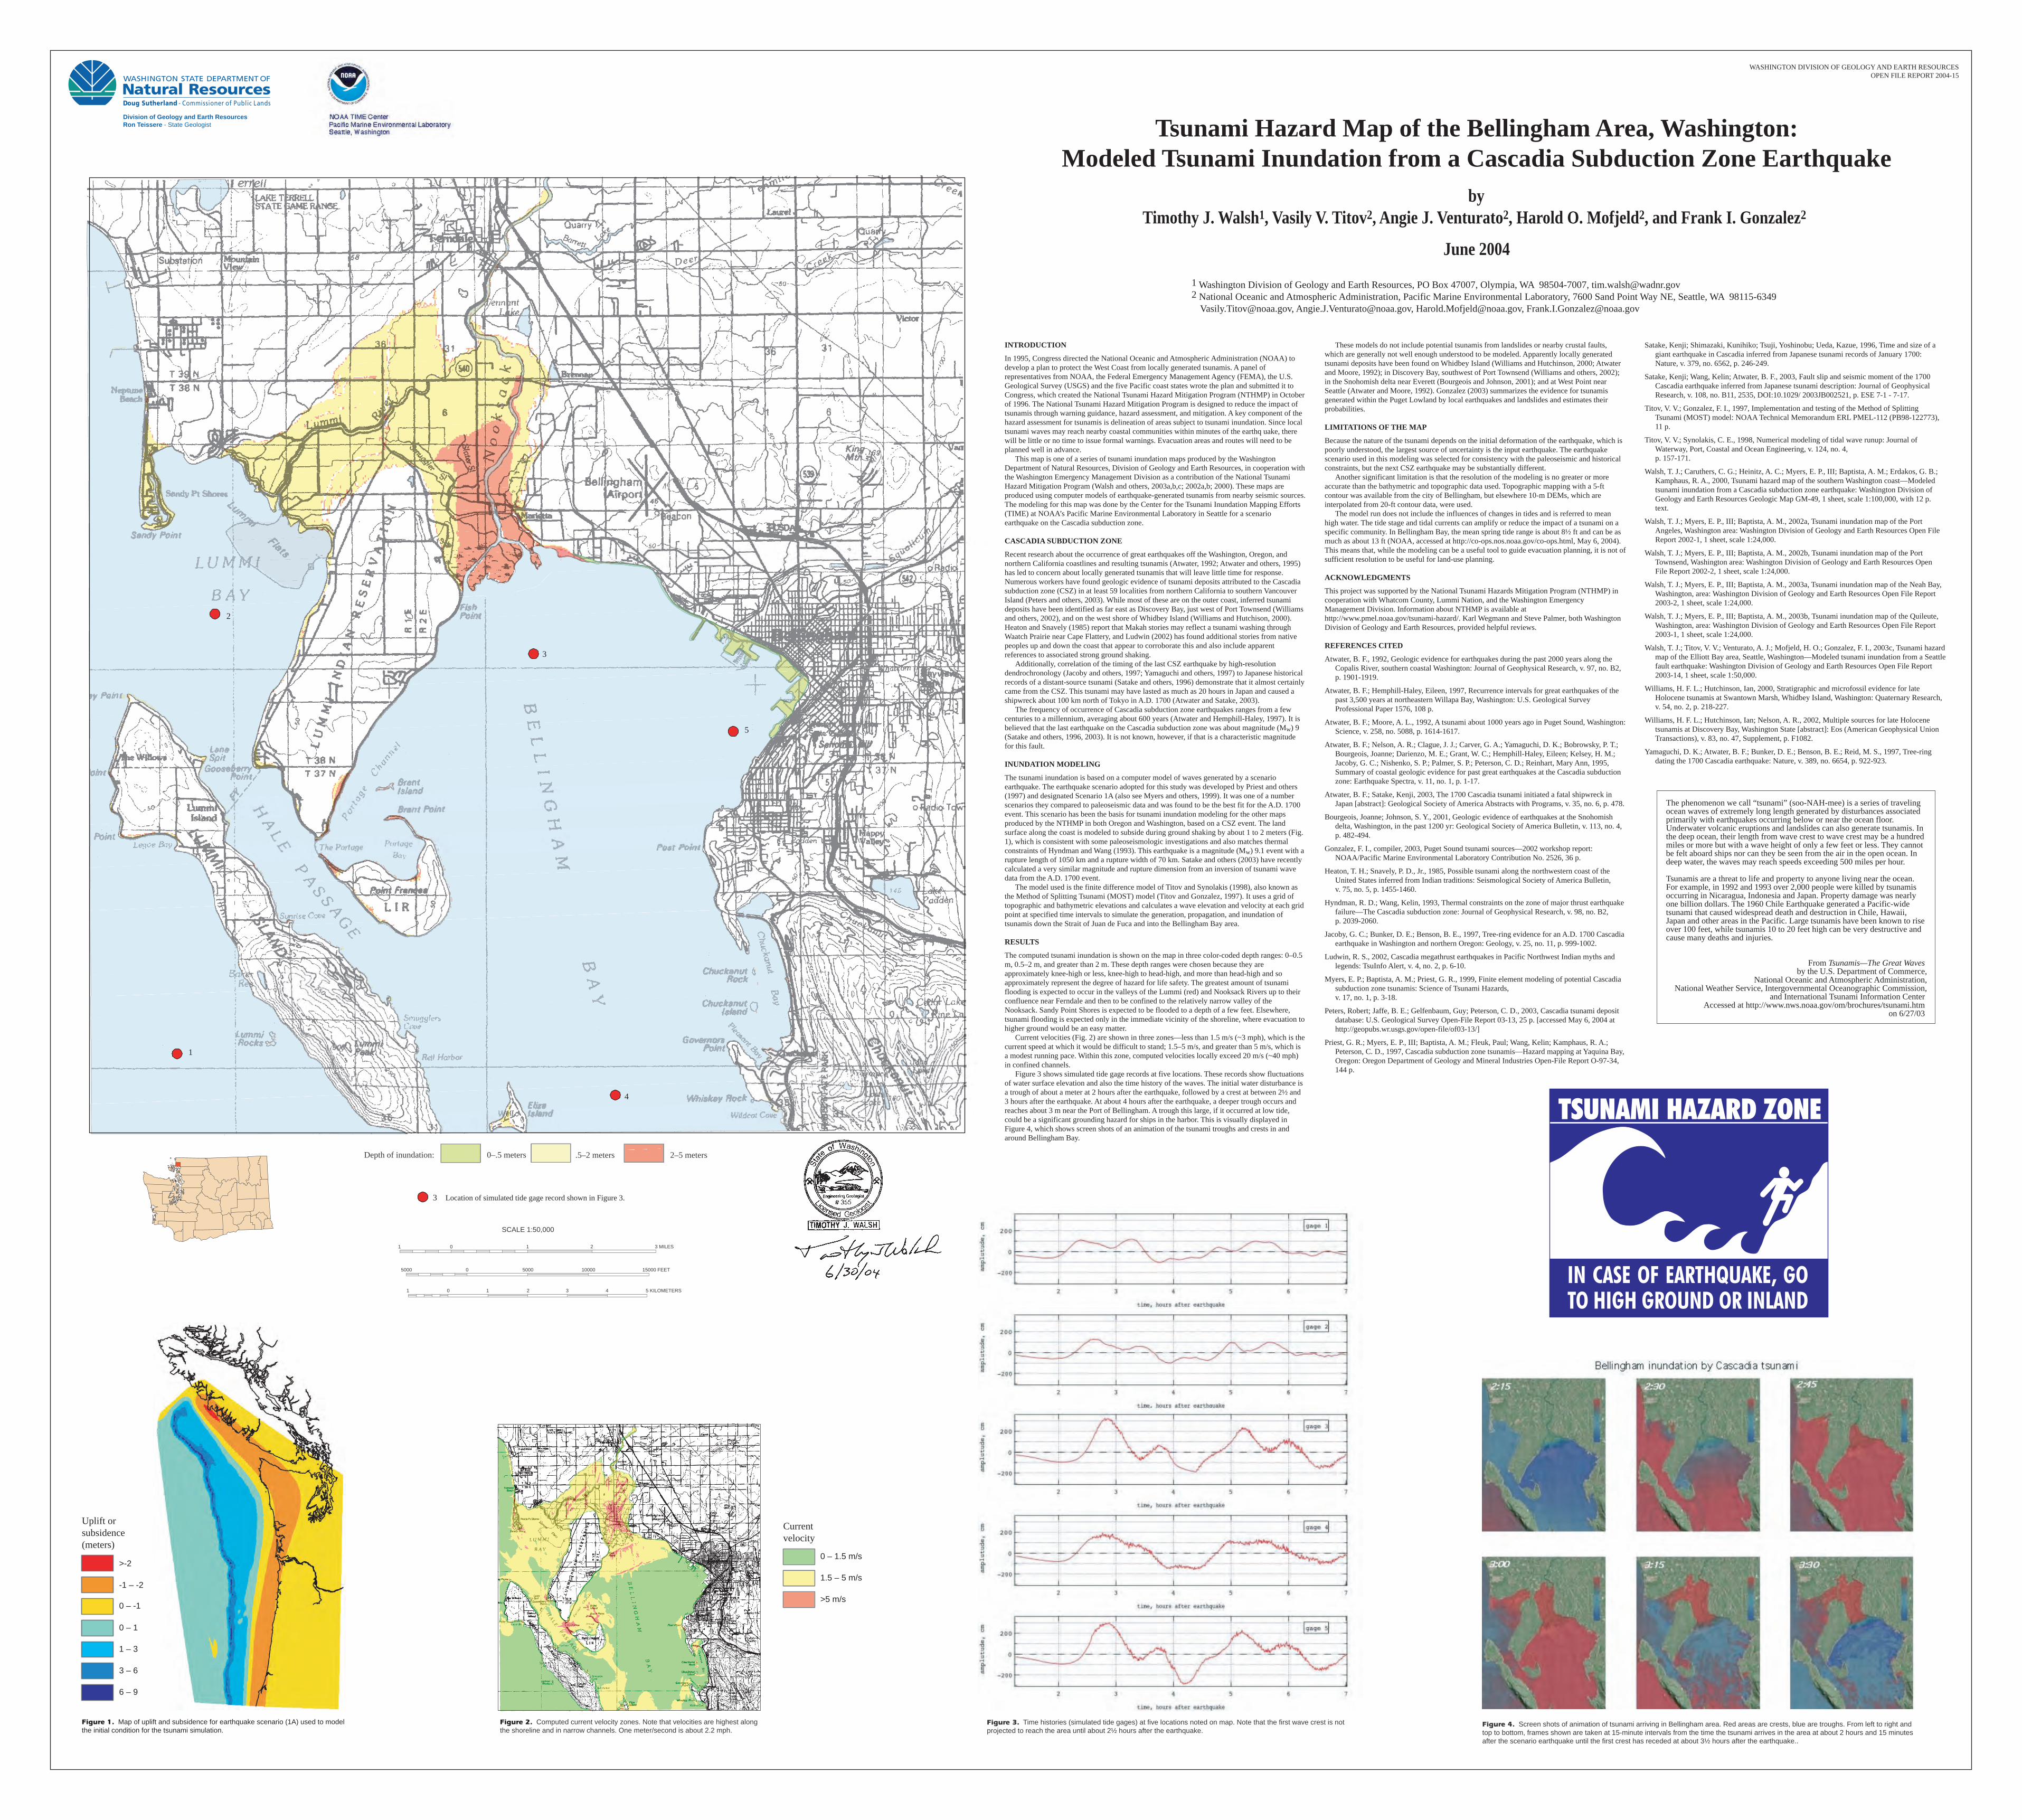
Depth of inundation: 0–.5 meters .5–2 meters 2–5 meters
3 Location of simulated tide gage record shown in Figure 3.
Tsunami Hazard Map of the Bellingham Area, Washington:
Modeled Tsunami Inundation from a Cascadia Subduction Zone Earthquake
by
Timothy J. Walsh1, Vasily V. Titov2, Angie J. Venturato2, Harold O. Mofjeld2, and Frank I. Gonzalez2
The phenomenon we call “tsunami” (soo-NAH-mee) is a series of traveling ocean waves of extremely long length generated by disturbances associated primarily with earthquakes occurring below or near the ocean floor. Underwater volcanic eruptions and landslides can also generate tsunamis. In the deep ocean, their length from wave crest to wave crest may be a hundred miles or more but with a wave height of only a few feet or less. They cannot be felt aboard ships nor can they be seen from the air in the open ocean. In deep water, the waves may reach speeds exceeding 500 miles per hour.
Tsunamis are a threat to life and property to anyone living near the ocean. For example, in 1992 and 1993 over 2,000 people were killed by tsunamis occurring in Nicaragua, Indonesia and Japan. Property damage was nearly one billion dollars. The 1960 Chile Earthquake generated a Pacific-wide tsunami that caused widespread death and destruction in Chile, Hawaii, Japan and other areas in the Pacific. Large tsunamis have been known to rise over 100 feet, while tsunamis 10 to 20 feet high can be very destructive and cause many deaths and injuries.
From Tsunamis—The Great Waves
by the U.S. Department of Commerce,National Oceanic and Atmospheric Administration,
National Weather Service, Intergovernmental Oceanographic Commission, and International Tsunami Information Center
Accessed at http://www.nws.noaa.gov/om/brochures/tsunami.htm on 6/27/03
June 2004
INTRODUCTION
In 1995, Congress directed the National Oceanic and Atmospheric Administration (NOAA) to
develop a plan to protect the West Coast from locally generated tsunamis. A panel of
representatives from NOAA, the Federal Emergency Management Agency (FEMA), the U.S.
Geological Survey (USGS) and the five Pacific coast states wrote the plan and submitted it to
Congress, which created the National Tsunami Hazard Mitigation Program (NTHMP) in October
of 1996. The National Tsunami Hazard Mitigation Program is designed to reduce the impact of
tsunamis through warning guidance, hazard assessment, and mitigation. A key component of the
hazard assessment for tsunamis is delineation of areas subject to tsunami inundation. Since local
tsunami waves may reach nearby coastal communities within minutes of the earthq uake, there
will be little or no time to issue formal warnings. Evacuation areas and routes will need to be
planned well in advance.
This map is one of a series of tsunami inundation maps produced by the Washington
Department of Natural Resources, Division of Geology and Earth Resources, in cooperation with
the Washington Emergency Management Division as a contribution of the National Tsunami
Hazard Mitigation Program (Walsh and others, 2003a,b,c; 2002a,b; 2000). These maps are
produced using computer models of earthquake-generated tsunamis from nearby seismic sources.
The modeling for this map was done by the Center for the Tsunami Inundation Mapping Efforts
(TIME) at NOAA’s Pacific Marine Environmental Laboratory in Seattle for a scenario
earthquake on the Cascadia subduction zone.
CASCADIA SUBDUCTION ZONE
Recent research about the occurrence of great earthquakes off the Washington, Oregon, and
northern California coastlines and resulting tsunamis (Atwater, 1992; Atwater and others, 1995)
has led to concern about locally generated tsunamis that will leave little time for response.
Numerous workers have found geologic evidence of tsunami deposits attributed to the Cascadia
subduction zone (CSZ) in at least 59 localities from northern California to southern Vancouver
Island (Peters and others, 2003). While most of these are on the outer coast, inferred tsunami
deposits have been identified as far east as Discovery Bay, just west of Port Townsend (Williams
and others, 2002), and on the west shore of Whidbey Island (Williams and Hutchison, 2000).
Heaton and Snavely (1985) report that Makah stories may reflect a tsunami washing through
Waatch Prairie near Cape Flattery, and Ludwin (2002) has found additional stories from native
peoples up and down the coast that appear to corroborate this and also include apparent
references to associated strong ground shaking.
Additionally, correlation of the timing of the last CSZ earthquake by high-resolution
dendrochronology (Jacoby and others, 1997; Yamaguchi and others, 1997) to Japanese historical
records of a distant-source tsunami (Satake and others, 1996) demonstrate that it almost certainly
came from the CSZ. This tsunami may have lasted as much as 20 hours in Japan and caused a
shipwreck about 100 km north of Tokyo in A.D. 1700 (Atwater and Satake, 2003).
The frequency of occurrence of Cascadia subduction zone earthquakes ranges from a few
centuries to a millennium, averaging about 600 years (Atwater and Hemphill-Haley, 1997). It is
believed that the last earthquake on the Cascadia subduction zone was about magnitude (Mw) 9
(Satake and others, 1996, 2003). It is not known, however, if that is a characteristic magnitude
for this fault.
INUNDATION MODELING
The tsunami inundation is based on a computer model of waves generated by a scenario
earthquake. The earthquake scenario adopted for this study was developed by Priest and others
(1997) and designated Scenario 1A (also see Myers and others, 1999). It was one of a number
scenarios they compared to paleoseismic data and was found to be the best fit for the A.D. 1700
event. This scenario has been the basis for tsunami inundation modeling for the other maps
produced by the NTHMP in both Oregon and Washington, based on a CSZ event. The land
surface along the coast is modeled to subside during ground shaking by about 1 to 2 meters (Fig.
1), which is consistent with some paleoseismologic investigations and also matches thermal
constraints of Hyndman and Wang (1993). This earthquake is a magnitude (Mw) 9.1 event with a
rupture length of 1050 km and a rupture width of 70 km. Satake and others (2003) have recently
calculated a very similar magnitude and rupture dimension from an inversion of tsunami wave
data from the A.D. 1700 event.
The model used is the finite difference model of Titov and Synolakis (1998), also known as
the Method of Splitting Tsunami (MOST) model (Titov and Gonzalez, 1997). It uses a grid of
topographic and bathymetric elevations and calculates a wave elevation and velocity at each grid
point at specified time intervals to simulate the generation, propagation, and inundation of
tsunamis down the Strait of Juan de Fuca and into the Bellingham Bay area.
RESULTS
The computed tsunami inundation is shown on the map in three color-coded depth ranges: 0–0.5
m, 0.5–2 m, and greater than 2 m. These depth ranges were chosen because they are
approximately knee-high or less, knee-high to head-high, and more than head-high and so
approximately represent the degree of hazard for life safety. The greatest amount of tsunami
flooding is expected to occur in the valleys of the Lummi (red) and Nooksack Rivers up to their
confluence near Ferndale and then to be confined to the relatively narrow valley of the
Nooksack. Sandy Point Shores is expected to be flooded to a depth of a few feet. Elsewhere,
tsunami flooding is expected only in the immediate vicinity of the shoreline, where evacuation to
higher ground would be an easy matter.
Current velocities (Fig. 2) are shown in three zones—less than 1.5 m/s (~3 mph), which is the
current speed at which it would be difficult to stand; 1.5–5 m/s, and greater than 5 m/s, which is
a modest running pace. Within this zone, computed velocities locally exceed 20 m/s (~40 mph)
in confined channels.
Figure 3 shows simulated tide gage records at five locations. These records show fluctuations
of water surface elevation and also the time history of the waves. The initial water disturbance is
a trough of about a meter at 2 hours after the earthquake, followed by a crest at between 2½ and
3 hours after the earthquake. At about 4 hours after the earthquake, a deeper trough occurs and
reaches about 3 m near the Port of Bellingham. A trough this large, if it occurred at low tide,
could be a significant grounding hazard for ships in the harbor. This is visually displayed in
Figure 4, which shows screen shots of an animation of the tsunami troughs and crests in and
around Bellingham Bay.
These models do not include potential tsunamis from landslides or nearby crustal faults,
which are generally not well enough understood to be modeled. Apparently locally generated
tsunami deposits have been found on Whidbey Island (Williams and Hutchinson, 2000; Atwater
and Moore, 1992); in Discovery Bay, southwest of Port Townsend (Williams and others, 2002);
in the Snohomish delta near Everett (Bourgeois and Johnson, 2001); and at West Point near
Seattle (Atwater and Moore, 1992). Gonzalez (2003) summarizes the evidence for tsunamis
generated within the Puget Lowland by local earthquakes and landslides and estimates their
probabilities.
LIMITATIONS OF THE MAP
Because the nature of the tsunami depends on the initial deformation of the earthquake, which is
poorly understood, the largest source of uncertainty is the input earthquake. The earthquake
scenario used in this modeling was selected for consistency with the paleoseismic and historical
constraints, but the next CSZ earthquake may be substantially different.
Another significant limitation is that the resolution of the modeling is no greater or more
accurate than the bathymetric and topographic data used. Topographic mapping with a 5-ft
contour was available from the city of Bellingham, but elsewhere 10-m DEMs, which are
interpolated from 20-ft contour data, were used.
The model run does not include the influences of changes in tides and is referred to mean
high water. The tide stage and tidal currents can amplify or reduce the impact of a tsunami on a
specific community. In Bellingham Bay, the mean spring tide range is about 8½ ft and can be as
much as about 13 ft (NOAA, accessed at http://co-ops.nos.noaa.gov/co-ops.html, May 6, 2004).
This means that, while the modeling can be a useful tool to guide evacuation planning, it is not of
sufficient resolution to be useful for land-use planning.
ACKNOWLEDGMENTS
This project was supported by the National Tsunami Hazards Mitigation Program (NTHMP) in
cooperation with Whatcom County, Lummi Nation, and the Washington Emergency
Management Division. Information about NTHMP is available at
http://www.pmel.noaa.gov/tsunami-hazard/. Karl Wegmann and Steve Palmer, both Washington
Division of Geology and Earth Resources, provided helpful reviews.
REFERENCES CITED
Atwater, B. F., 1992, Geologic evidence for earthquakes during the past 2000 years along the
Copalis River, southern coastal Washington: Journal of Geophysical Research, v. 97, no. B2,
p. 1901-1919.
Atwater, B. F.; Hemphill-Haley, Eileen, 1997, Recurrence intervals for great earthquakes of the
past 3,500 years at northeastern Willapa Bay, Washington: U.S. Geological Survey
Professional Paper 1576, 108 p.
Atwater, B. F.; Moore, A. L., 1992, A tsunami about 1000 years ago in Puget Sound, Washington:
Science, v. 258, no. 5088, p. 1614-1617.
Atwater, B. F.; Nelson, A. R.; Clague, J. J.; Carver, G. A.; Yamaguchi, D. K.; Bobrowsky, P. T.;
Bourgeois, Joanne; Darienzo, M. E.; Grant, W. C.; Hemphill-Haley, Eileen; Kelsey, H. M.;
Jacoby, G. C.; Nishenko, S. P.; Palmer, S. P.; Peterson, C. D.; Reinhart, Mary Ann, 1995,
Summary of coastal geologic evidence for past great earthquakes at the Cascadia subduction
zone: Earthquake Spectra, v. 11, no. 1, p. 1-17.
Atwater, B. F.; Satake, Kenji, 2003, The 1700 Cascadia tsunami initiated a fatal shipwreck in
Japan [abstract]: Geological Society of America Abstracts with Programs, v. 35, no. 6, p. 478.
Bourgeois, Joanne; Johnson, S. Y., 2001, Geologic evidence of earthquakes at the Snohomish
delta, Washington, in the past 1200 yr: Geological Society of America Bulletin, v. 113, no. 4,
p. 482-494.
Gonzalez, F. I., compiler, 2003, Puget Sound tsunami sources—2002 workshop report:
NOAA/Pacific Marine Environmental Laboratory Contribution No. 2526, 36 p.
Heaton, T. H.; Snavely, P. D., Jr., 1985, Possible tsunami along the northwestern coast of the
United States inferred from Indian traditions: Seismological Society of America Bulletin,
v. 75, no. 5, p. 1455-1460.
Hyndman, R. D.; Wang, Kelin, 1993, Thermal constraints on the zone of major thrust earthquake
failure—The Cascadia subduction zone: Journal of Geophysical Research, v. 98, no. B2,
p. 2039-2060.
Jacoby, G. C.; Bunker, D. E.; Benson, B. E., 1997, Tree-ring evidence for an A.D. 1700 Cascadia
earthquake in Washington and northern Oregon: Geology, v. 25, no. 11, p. 999-1002.
Ludwin, R. S., 2002, Cascadia megathrust earthquakes in Pacific Northwest Indian myths and
legends: TsuInfo Alert, v. 4, no. 2, p. 6-10.
Myers, E. P.; Baptista, A. M.; Priest, G. R., 1999, Finite element modeling of potential Cascadia
subduction zone tsunamis: Science of Tsunami Hazards,
v. 17, no. 1, p. 3-18.
Peters, Robert; Jaffe, B. E.; Gelfenbaum, Guy; Peterson, C. D., 2003, Cascadia tsunami deposit
database: U.S. Geological Survey Open-File Report 03-13, 25 p. [accessed May 6, 2004 at
http://geopubs.wr.usgs.gov/open-file/of03-13/]
Priest, G. R.; Myers, E. P., III; Baptista, A. M.; Fleuk, Paul; Wang, Kelin; Kamphaus, R. A.;
Peterson, C. D., 1997, Cascadia subduction zone tsunamis—Hazard mapping at Yaquina Bay,
Oregon: Oregon Department of Geology and Mineral Industries Open-File Report O-97-34,
144 p.
Satake, Kenji; Shimazaki, Kunihiko; Tsuji, Yoshinobu; Ueda, Kazue, 1996, Time and size of a
giant earthquake in Cascadia inferred from Japanese tsunami records of January 1700:
Nature, v. 379, no. 6562, p. 246-249.
Satake, Kenji; Wang, Kelin; Atwater, B. F., 2003, Fault slip and seismic moment of the 1700
Cascadia earthquake inferred from Japanese tsunami description: Journal of Geophysical
Research, v. 108, no. B11, 2535, DOI:10.1029/ 2003JB002521, p. ESE 7-1 - 7-17.
Titov, V. V.; Gonzalez, F. I., 1997, Implementation and testing of the Method of Splitting
Tsunami (MOST) model: NOAA Technical Memorandum ERL PMEL-112 (PB98-122773),
11 p.
Titov, V. V.; Synolakis, C. E., 1998, Numerical modeling of tidal wave runup: Journal of
Waterway, Port, Coastal and Ocean Engineering, v. 124, no. 4,
p. 157-171.
Walsh, T. J.; Caruthers, C. G.; Heinitz, A. C.; Myers, E. P., III; Baptista, A. M.; Erdakos, G. B.;
Kamphaus, R. A., 2000, Tsunami hazard map of the southern Washington coast—Modeled
tsunami inundation from a Cascadia subduction zone earthquake: Washington Division of
Geology and Earth Resources Geologic Map GM-49, 1 sheet, scale 1:100,000, with 12 p.
text.
Walsh, T. J.; Myers, E. P., III; Baptista, A. M., 2002a, Tsunami inundation map of the Port
Angeles, Washington area: Washington Division of Geology and Earth Resources Open File
Report 2002-1, 1 sheet, scale 1:24,000.
Walsh, T. J.; Myers, E. P., III; Baptista, A. M., 2002b, Tsunami inundation map of the Port
Townsend, Washington area: Washington Division of Geology and Earth Resources Open
File Report 2002-2, 1 sheet, scale 1:24,000.
Walsh, T. J.; Myers, E. P., III; Baptista, A. M., 2003a, Tsunami inundation map of the Neah Bay,
Washington, area: Washington Division of Geology and Earth Resources Open File Report
2003-2, 1 sheet, scale 1:24,000.
Walsh, T. J.; Myers, E. P., III; Baptista, A. M., 2003b, Tsunami inundation map of the Quileute,
Washington, area: Washington Division of Geology and Earth Resources Open File Report
2003-1, 1 sheet, scale 1:24,000.
Walsh, T. J.; Titov, V. V.; Venturato, A. J.; Mofjeld, H. O.; Gonzalez, F. I., 2003c, Tsunami hazard
map of the Elliott Bay area, Seattle, Washington—Modeled tsunami inundation from a Seattle
fault earthquake: Washington Division of Geology and Earth Resources Open File Report
2003-14, 1 sheet, scale 1:50,000.
Williams, H. F. L.; Hutchinson, Ian, 2000, Stratigraphic and microfossil evidence for late
Holocene tsunamis at Swantown Marsh, Whidbey Island, Washington: Quaternary Research,
v. 54, no. 2, p. 218-227.
Williams, H. F. L.; Hutchinson, Ian; Nelson, A. R., 2002, Multiple sources for late Holocene
tsunamis at Discovery Bay, Washington State [abstract]: Eos (American Geophysical Union
Transactions), v. 83, no. 47, Supplement, p. F1082.
Yamaguchi, D. K.; Atwater, B. F.; Bunker, D. E.; Benson, B. E.; Reid, M. S., 1997, Tree-ring
dating the 1700 Cascadia earthquake: Nature, v. 389, no. 6654, p. 922-923.
Uplift or
subsidence
(meters)
>-2
-1 – -2
0 – -1
0 – 1
1 – 3
3 – 6
6 – 9
Current
velocity
0 – 1.5 m/s
1.5 – 5 m/s
>5 m/s
Figure 3. Time histories (simulated tide gages) at five locations noted on map. Note that the first wave crest is not
projected to reach the area until about 2½ hours after the earthquake.Figure 4. Screen shots of animation of tsunami arriving in Bellingham area. Red areas are crests, blue are troughs. From left to right and
top to bottom, frames shown are taken at 15-minute intervals from the time the tsunami arrives in the area at about 2 hours and 15 minutes
after the scenario earthquake until the first crest has receded at about 3½ hours after the earthquake..
Figure 1. Map of uplift and subsidence for earthquake scenario (1A) used to model
the initial condition for the tsunami simulation.
Figure 2. Computed current velocity zones. Note that velocities are highest along
the shoreline and in narrow channels. One meter/second is about 2.2 mph.