off-field movement and dissipation of soil-incorporated ... f off-field movement and dissipation of...
TRANSCRIPT

1 -
f
OFF-FIELD MOVEMENT AND DISSIPATION OF SOIL-INCORPORATED CARBOFURAN
FROM THREE COMMERCIAL RICE FIELDS, AND POTENTIAL DISCHARGE
IN AGRICULTURAL RUNOFF WATER
March, 1990
ENVIRONMENTAL HAZARDS PROGRAM
ASSESSMENT
STATE OF CALIFORNIA Department of Food and Agriculture
Division of Pest Management, Environmental Protection and Worker Safety Branch of Environmental Monitoring and Pest Management
1220 N Street, Sacramento, California 95814 EH 90-4

OFF-FIELD MOVEMENT AND DISSIPATION OF SOIL-INCORPORATED CARBOFURAN FROM THREE COMMERCIAL RICE FIELDS
AND POTENTIAL DISCHARGE IN AGRICULTURAL RUNOFF WATER
S. Nicosia, N. Carr and D.A. Gonzales California Department of Food and Agriculture
and
M.K. Orr California Analytical Laboratories, Enseco
MARCH 1990
EWIR0N"AL HAZARDS ASSESSMENT PROGRAH
ABSTRACT
Res idues of c a r b o f u r a n ( F u r a d a n @ ; 2 ,3 -d ihydro -2 ,2 -d ime thy1-7 -benzofu rany l me thy lca rbamate ) were detected i n a g r i c u l t u r a l d r a i n water c o l l e c t e d i n t h e Sacramento Val ley , a major r ice growing region of C a l i f o r n i a . R u n o f f water from r ice (Oryza sativa L . ) and sugar beet (Beta vulgaris L . ) f i e l d s were d e t e r m i n e d t o be p o t e n t i a l s o u r c e s f o r these r e s i d u e s . I n r e s p o n s e t o t h i s problem, mass d i s c h a r g e o f c a r b o f u r a n f r o m three commercial r ice f i e l d s i n Co lusa and G lenn Coun t i e s , i n Ca l i fo rn ia , was m e a s u r e d . P o t e n t i a l d i s c h a r g e s o f ca rbofu ran f rom r ice and sugar beet runof f water i n a t h r e e - c o u n t y area were t h e n estimated a n d c o m p a r e d . I n a d d i t i o n , d i s s i p a t i o n o f s o i l - i n c o r p o r a t e d c a r b o f u r a n f r o m rice paddy s o i l and water was examined for 70 t o 80 d a y s a f te r f i e lds were f looded .
Maximum c o n c e n t r a t i o n s o f c a r b o f u r a n i n r u n o f f water ranged from 21 t o 33 pg L-l and occu r red w i th in 26 days a f t e r i n i t i a l f l o o d i n g o f r ice f i e lds . A t o t a l o f 1 . 7 2 , 5.40 and 11.03% of ca rbofu ran mass a p p l i e d was d i s c h a r g e d i n r u n o f f water f r o m F i e l d s 1 , 2 and 3 , r e s p e c t i v e l y , d u r i n g a 54 t o 80 day p e r i o d a f t e r f l o o d i n g . T h e p o t e n t i a l mass o f c a r b o f u r a n d i s c h a r g e d i n t o a g r i c u l t u r a l d r a i n s i n C o l u s a , G l e n n a n d Yo10 Coun t i e s was estimated t o be a p p r o x i m a t e l y 1 1 times g r e a t e r from r ice (461 kg) than f rom sugar beet ( 4 1 kg) f i e lds d u r i n g A p r i l t h r o u g h J u l y , 1 9 8 8 .
Maximum 0.80 rng Maximum
t o 3 8 . 2
a v e r a g e c o n c e n t r a t i o n s o f c a r b o f u r a n i n p a d d y s o i l r a n g e d f r o m 0.50 t o kg-’and occurred within 1 1 to 20 days after f l o o d i n g t h e f i e l d s .
a v e r a g e c o n c e n t r a t i o n s o f c a r b o f u r a n i n p a d d y water ranged from 24 .5 pg L-l and occu r red w i th in 1 t o 28 days after f l o o d i n g t h e f ie lds .
D i s s i p a t i o n o f c a r b o f u r a n mass from r ice paddy s o i l and water was a l o g - l i n e a r f u n c t i o n of time. An e x c e p t i o n o c c u r r e d i n p a d d y s o i l of F i e l d 3 where c a r b o f u r a n mass d i d n o t d e c l i n e s i g n i f i c a n t l y over a 70 day sampl ing period. Soi l h a l f - l i v e s , e s t i m a t e d from t h e s e f u n c t i o n s , were 58 and 43 d a y s af ter f l o o d i n g for F i e l d s 1 a n d 2 , r e s p e c t i v e l y . Water h a l f - l i v e s for F i e l d s 1 , 2 and 3 were 22, 26 and 18 d a y s , r e s p e c t i v e l y . Most o f t h e c a r b o f u r a n mass a p p l i e d t o t h e f ie lds remained in paddy s o i l and , on average , no more than 27% o f the a p p l i e d mass was found in paddy water o n a n y s i n g l e d a y d u r i n g t h e s t u d y .
i
ACKNOWLEDGEMENTS
The authors wish to thank the Environmental Hazards Assessment Program field, computer, laboratory and office personnel for their efforts in this project. We would also like to thank the personnel at Pearce Hydrology, Inc., especially Robert Johnson, for providing equipment and expertise necessary for measurements of rice field water flow.
Our thanks to Colusa and Glenn County Agricultural Commissioners and their staff, and also to Lou Hoskey of the Glenn-Colusa Irrigation District, for valuable information and assistance in locating fields to sample.
Collection and analysis of agricultural drain water samples by personnel from the Department of Fish and Game was greatly appreciated.
Finally, our special thanks to the growers for their cooperation and patience,
DISCLAIMER
The mention of commercial products, their source or use in connection with material reported herein is not to be construed as either an actual or implied endorsement of such product.
ii

TABLE OF CONTENTS
Page
Abstract ....................................................... Acknowledgements . . . . . . . . . . . . . . . . . . . . . . . . . . . . . . , . . . . . . . . . . . . . . . . Disclaimer .....,............................................... Table of Contents. . . . . . . . . . . . . . . . . . . . . . . . . , . , . . . . . . . . . . . , . . , . . . iii-iv List of Figures ................................................ List of Tables....... .......................................... vi
i ii ii
V
I. Introduction. .............................................. 1
11. Materials and Methods ..................................... 3
Study Sites...... ........................................ 3 Agricultural Drains.,.... ................................ 7 Application Rates...... .................................. 7 Sample Collection ........................................ 10
Field Runoff and Agricultural Drain Water..... ........ 10 Dissipation from Rice Fields.......................... 12
Quality Control and Chemical Analysis.. . . . . . . . . . . . . . . . . . . 14 Calculations ............................................. 15
111. Results and Discussion. .................................. 20
Mass Discharged from Rice.,..,..,........,.,.........,... 20 Rice vs. Sugar Beet...... ................................ 27 Dissipation from Paddy Soil and Water.................... 32 Mass Recovered from Paddy Soil and Water.. . . . . . . . . . . . . . . . 36
IV. Conclusions.. . . . . . . . . . . . . . . . . . . . . . . . . . . . . . . . . . . . . . . . . . . . . . 38
V. References. . . . . . . , . . , . . , . . . . . . , . . , . . . . , . . . . . . . . . . . . . . . , . . . . 41
Appendix I. California Department of Fish and Game laboratory methods for analysis of carbofuran in agricultural drain water samples, 1988.
Appendix 11. Split sample results for carbofuran in rice paddy soil and water.
Appendix 111. Part B. Daily volume of water released, percent of total volume released, daily mass of carbofuran discharged and percent of total mass discharged for three rice fields in Colusa and Glenn Counties, CA, 1988.
Appendix IV. Concentrations of carbofuran in runoff water from three sugar beet fields, Colusa County, CA, 1988.
iii

Appendix V. Part A. Calculations o f carbofuran potential discharge values f o r rice fields in Colusa, 'Glenn and Yolo Counties, CA, 1988.
Part B. Calculations of carbofuran potential discharge values for sugar beet fields in Colusa, Glenn and Yolo Counties, CA, 1988,.
Appendix VI. Carbofuran concentration and mass in paddy soil and water from three rice fields in Colusa and Glenn Counties, CA, 1988.
iv

LIST OF FIGURES
Page
Figure 1 . Fields were located adjacent to the source of irrigation water, the Glenn-Colusa Canal, in Colusa and Glenn Counties, California. Water flowed through fields via weir boxes or pipes ( I I ) and runoff was sampled at outlets. Samples of soil and water were also collected around the perimeters of bottom paddies where carbofuran was applied (shaded areas) ... 4
Figure 2. Agricultural drain water sampling locations along the Colusa Basin Drain ( m ) and its tributaries ( A ) in the Sacramento Valley, California ........................................... 8
Figure 3. Daily mass of carbofuran discharged, after initial flooding, in runoff water from three rice fields. Arrows indicate beginning ( + ) and ending ( 4 ) points of the water holding period for molinate applications ............................. 25
Figure 4 . Daily average carbofuran concentrations and daily volume of runoff water released from three rice fields, after initial flooding. Arrows indicate beginning (IC) and ending ( 4 ) points of the water holding period for molinate applications. 26
Figure 5. Total mass of carbofuran used per week in Colusa, Glenn and Yolo Counties vs. concentrations of carbofuran in water (detection limit 1.0 pg L- ' ) at the CBDl agricultural drain site in Yolo County, California, 1988 ........................ 30
Figure 6. Carbofuran water concentrations (detection limit 1 .O pg L-l ) found at agricultural drain sampling sites in Colusa and Yolo Counties, California, 1988 .................................. 31
V

LIST OF TABLES
Page
Table 1.
Table 2.
Table 3.
table 4.
Table 5.
Tabie 6.
Table 7.
Table 8.
Table 9.
Table I O .
Table 11.
Schedule of events for three rice fields monitored f o r carbofuran dissipation and runoff ............................ Carbofuran application rates, total and treated field areas, and total amounts of carbofuran applied to three fields in Colusa and Glenn Counties, California ........................ Sampling frequency and sampling periods for measurement of carbofuran i n runoff water released from three rice fields.,.
Sampling schedule for measurement of carbofuran dissipation from soil and water of bottom rice paddies in Fields 1 , 2 aild . . . . . . . . . . . . . . . . . . . . . . . . . . . . . . . . . . . . . . . . . . . . . . . . . . . . . . . . .
Calculated volume of runoff water and number of days of run- off from three rice fields in Colusa and Glenn Counties, California, 1988 ............................................. Calculated carbofuran mass discharged in runoff water and per- cent of applied carbofuran moved off-field in runoff water from three rice fields in dolusa and Glenn Counties, Califor- nia, 1988.. .................................................. Runoff loads for carbofuran discharged in runoff water from three rice fields for three time periods after initial floodink.. ................................................... Concentrations and days of maximum carbofuran residues in runoff water from three rice fields, and days water was held on fields due to molinate application ........................ Maximum average (n = 3) concentrations of carbofuran found after flooding rice fields and final average (n = 3) concen- trations found in s o i l and water of bottom paddies of three rice fields,. ................................................ Regres&ion analyses of carbofuran dissipation in paddy soil afid water and calculated half-lives, ......................... Carbofuran mass and percent of applied carbqfuran recovered from soil and water in bottom paddies of rice fields. Total mass recovered from soil and water as percent of carbofuran mass applied ................................................
6
9
1 1
13
21
22
23
28
33
34
37
v i

INTRODUCTION The California Department of Food and Agriculture (CDFA), in conjunction with other state agencies, conducts an ongoing program to control the discharge of rice pesticides into surface waters. During monitoring in 1987, residues of a broad spectrum systemic insecticide, carbofuran (Furadan@; 2,3-Dihydro-2,2-dimethyl-7-benzofuranyl methylcarbamate), were found in agricultural drains in the Sacramento Valley and in the Sacramento River. Carbofuran residues were found most consistently and at highest concentrations in May and early June in the Colusa Basin Drain (CBD), a large agricultural drain contributing a major portion of irrigation return flow to the Sacramento River. In a three-county area encompassing the CBD, applications of carbofuran, from the latter part of April through June 1987, were made exclusively to rice (Oryza sa t iva L,), a flooded crop, and sugar beet (Be ta vulgaris L. ) a row crop. Caro et al. ( 1973) reported high
concentrations of carbofuran ( > 1,000 vg L-l ) in irrigation runoff water from a row crop, indicating that runoff water from sugar beet fields may have contributed a portion of the residues found in agricultural drain water. The major portion of carbofuran residues found in agricultural drain water probably originated from rice since approximately 12 times more carbofuran was applied to rice than sugar beet fields (9,414 vs. 757 kg a.i., respectively) ( C D F A , 1987), and the volume of runoff water is greater for rice.
The behavior of carbofuran in the rice field environment needs to be understood in order t o develop regulatory strategies to control off-field movement. Under neutral and basic environmental conditions the primary mechanism of carbofuran degradation in soil and water is hydrolysis (Getzin, 1973; Seiber et al., 1978). The rate of hydrolysis increases with increasing pH and temperature. Persistence of carbofuran in soil may be increased by: soil-incorporation methods of application; granular formulation; high soil organic matter content; and low soil pH, temperature and moisture (Caro et a l . , 1973; Getzin, 1973; Ahmad et al., 1979; Miles et al., 1981; Ou et al., 1982; Harris et al., 1988). Several factors with modest influence on the dissipation of carbofuran in water include evaporation, photolysis and oxidation (Seiber et al., 1978; Deuel et al.,
1
1979). Recently, carbofuran application methods in rice fields, in counties surrounding the CBD, have changed from broadcasting granules onto the soil surface (without soil incorporation) to incorporating granules into the soil of the top one or two paddies, or in some cases entire fields. Agricultural commissioners have requested this change in order to prevent poisoning of the water fowl which feed at the water's edge as the first paddies are initially flooded. Caro (1973) determined that incorporation of carbofuran in a row crop increased persistence and reduced the mass of carbofuran available to move off-field in runoff water. The effect of incorporation of carbofuran granules has not been studied irl rice fields.
This study was undertaken since carbofuran studies published in the literature were conducted using various formulations and methods of application not used for rice, or under environmental conditions different from those found in the rice growing regions of California. The purpose of this study was tMo-fold: first, to quantify the mass of carbofuran discharged in runoff water from rice fields and use this information to compare hypottietical estimations of carbofuran discharged from rice and sugar beet fieids in a three-county area; and second, to examine dissipation of' incorporated carbofuran from rice paddy soil and water.
2
MATERIALS AND METHODS
Study Sites Three commercial r i ce f i e l d s loca ted i n Co lusa and G lenn Coun t i e s , C a l i f o r n i a , were selected f o r d e t e r m i n i n g t h e c o n c e n t r a t i o n s o f c a r b o f u r a n
i n r u n o f f water and paddy s o i l and water. F i e l d s 1 , 2 , and 3 had t o t a l areas of 24 , 34 , and 32 h a , and bottom paddy areas o f 6 .5 , 2 . 8 , and 5 . 3 h a ,
r e s p e c t i v e l y ( F i g . 1 ) . Each f i e l d h a d o n l y o n e i n l e t a n d o u t l e t . F i e l d s 1
and 2 b o t h c o n t a i n e d two s o i l t y p e s , H i l l g a t e c l a y ( T y p i c P e l l o x e r e r t ) a n d
M y e r s c l a y ( E n t i c C h r o m o x e r e r t ) ; F i e l d 3 con ta ined Wi l lows c l ay (Typ ic
Pelloxerert) (Begg, 1968). Organic matter c o n t e n t i n s o i l a v e r a g e d 2 . 4 % i n F i e l d 1 , 2.2% i n F i e l d 2 , a n d 2.8% i n F i e l d 3. S o i l b u l k d e n s i t y was 1.4 g
f o r F i e l d 1 and 1.3 g cm-3 f o r F i e l d s 2 and 3. Carbofuran had been a p p l i e d t o a l l o f t h e f i e l d s in p rev ious yea r s , Average background s o i l
c o n c e n t r a t i o n s o f c a r b o f u r a n were 0.02 mg kg-’ ( n e a r the d e t e c t i o n limit of
0.01 mg kg-’) f o r a l l three f ie lds .
F i e l d s were c u l t i v a t e d t o a d e p t h of a p p r o x i
d i s c i n g , a n d t r i - p l a n i n g . A 5% g r a n u l a r a p p l i e d u s i n g a broadcast spreader mounted on 4 t o 10 d p r i o r t o f lood ing . Ca rbofu ran is
w e e v i l ( L i s s o r h o p t r u s oryzophilus Kuschel) whi
mately 15 cm by c h i s e l i n g ,
f o r m u l a t i o n of c a r b o f u r a n was a l i q u i d fe r t i l i zer ground rig used t o c o n t r o l t h e rice water ch m i g r a t e s i n t o the p a d d i e s
from t h e weeds growing a long levees and roads ; therefore, c a r b o f u r a n is g e n e r a l l y a p p l i e d o n l y t o t h e b o r d e r s of r ice p a d d i e s . G r a n u l e s were a p p l i e d t o o n e , o r i n some places two, 6 .27 m wide swaths a r o u n d t h e b o r d e r s of each paddy i n F i e l d s 1 and 2 , a n d i n c o r p o r a t e d t o a d e p t h of a b o u t 5 cm w i t h a rice r o l l e r p r e c e d e d by a s p r i n g - t o o t h h a r r o w a t t a c h m e n t . I n F i e l d 3 c a r b o f u r a n was a p p l i e d t o two 7.39 m swaths (14.78 m t o t a l w i d t h ) around the borders o f t h e padd ies and i nco rpora t ed wi th a harrow t o a d e p t h of 1 t o 3 cm. Carbofuran was a p p l i e d t o F i e l d 1 on 16 A p r i l , F i e l d 2 on 12 Apr i l and F i e l d 3 on 14 Apri l 1988. After a p p l i c a t i o n F i e l d s 1 and 2 were r o l l e d ; F i e l d 3 was ro l l ed be tween t h e d i sc a n d t r i - p l a n e o p e r a t i o n s .
J u s t p r i o r t o f l o o d i n g a S t e v e n s A 35 g raph ic recorder was i n s t a l l e d i n a 61 cm diameter s t i l l i n g well a t the o u t l e t o f each f i e ld t o take c o n t i n u o u s
3

Outlet
Figure 1. Fields were located adjacent to
Field 3 32.0 ha
Outlet
.I) NORTH
the source of irrigation water, the Glenn-Colusa Canal, in Colusa and Glenn Counties, California. Water flowed through fields via weir boxes or pipes ( I 1 ) and runoff was sampled at outlets. Samples of s o i l and water were also collected around the perimeters of bottom paddies where carbofuran was applied (shaded areas).

readings of water height in the bottom paddy. Other measurements needed for calculation of runoff water flow rates (height of weir boards and height of water flowing over the boards) were recorded manually.
Field 1 was completely flooded 10 d after carbofuran application and was seeded the day after flooding (Table 1). Field 2 was completely flooded and was then seeded 6 d after application. Field 3 was completely flooded 4 d
after application and was seeded 2 d after flooding. In general, water management varied between the three fields, but certain water management practices were related to herbicide applications. Molinate, an herbicide, was applied 1 1 to 14 d after flooding, and a 12 to 18 d period followed during which water was held on the fields (Table 1). Fields 2 and 3 were first drained and then treated with a second herbicide, MCPA, 39 and 43 d
after flooding, respectively. Reflooding of these fields began 1 d
following the MCPA application. Field 3 was treated with bentazon, another herbicide, 62 d after initial flooding, and water was held on the field for the remainder of the growing season. A summary of events is presented in Table 1.
Between 1 1 April and 15 July 1988, the average daily high air temperature was 28OC and low was 12'C. High and low average daily relative humidity was
90% and 37%, respectively, and average wind speeds were 1.2 to 3.7 m s-' . During the study period water depths averaged 11.0 cm, 15.1 cm, and 18.3 cm, and water temperatures averaged 22.goC, 22.4OC, and 24.5OC in bottom paddies of Fields 1 , 2, and 3 , respectively.
Three sugar beet fields (Fields 4, 5 and 6) in Colusa County were selected to measure carbofuran concentrations in runoff water during the first irrigation of these fields. Fields 4, 5, and 6 were 14, 40, and 97 ha, respectively. All fields used 76 cm furrow spacing. Carbofuran was applied with seed as a 10% granular formulation, to Field 4 as 13 cm-wide bands on rows and pressed into the soil, to Field 5 as 1 cm-wide bands which were incorporated 3 cm deep, and to Field 6 in wide bands (exact width unknown) incorporated to a depth of 0.6 cm. Applications were made to Fields 4, 5, and 6 on 18 to 20 May, 10 to 22 May, and 31 May to 1 June, 1988,
5

Table 1 . Schedule of events for three rice fields monitored for carbofuran dissipation and runoff.
I n i t i a l Events Date (1988)
Field 1 Field 2 Field 3
Carbofuran application 16 Aprila 12 Aprila 14 April b
Init ial f looding of f i e lds 26 Apr i l 18 April 18 Apr i l
Seeding 1 0
fidlinate application
Mdlinate water holding period . .
MCPA application
Bentazon application
Events After Flooding DayC
Field 1 Field 2 Field 3
2
14 11 14
14-25 1 1-22 12-29
-- 39 43
62 -- --
a After application, the field was rolled and carbofuran incorporated.
Field was rolled prior to appliction and incorporation of carbofuran.
Days a f te r in i t ia l f looding of r ice f ie lds . C
6

respectively. Irrigations began immediately after application and seeding in all 3 fields.
Agricultural Drains In addition to the monitoring conducted by CDFA, the California Department of Fish and Game (CDFG) collected and analyzed surface water samples from agricultural drains for carbofuran. Samples were collected from each of the following fou r locations in Colusa County: Freshwater Creek/Salt Creek near the confluence with the Colusa Basin Drain; Stone Corral Creek at Maxwell Road; Colusa Basin Drain at Colusa Wildlife Refuge (CBD5); and Willow Creek at Norman Road (Fig. 2 ) .
Application Rates Application rates for carbofuran in rice fields were calculated from the measured weights of granules applied and areas of application. Areas of application were determined from perimeter measurements of each paddy in each field and the swath width of the application equipment. Application
rates in Fields 1 , 2, and 3 were 1.10, 1.21, and 0.64 kg a.i. ha-’ for the
whole field, and 1.10, 1.81, and 0.66 kg a.i. ha-’ for the bottom paddy only, respectively (Table 2). Application rates in Fields 1 and 2 were two
to three times the recommended label rate of 0.56 kg a. i . ha-’. Analysis of granule samples from each bag used on the fields were analyzed and confirmed that the actual percentage of active ingredient was 5.2 f 0.11% (n=15). Calculations were performed based on a 5.0% formulation.
Carbofuran application rates for sugar beet fields determined from growers‘
records were 1.5, 1.7, and 1.1 to 1.3 kg a. i. ha-’ for Fields 4, 5, and 6, respectively. These rates are close t o the recommended label rate of 1.57
kg a. i. ha-’ for banded and incorporated Furadan@ 10G used on rows with 76.2
cm spacings.
7


Table 2. Carbofuran application rates, total and treated field areas, and total amounts of carbofuran applied to three rice fields in Colusa and Glenn Counties, California.
Measurement Field 1 Fi . e ld 2 Field 3
Carbofuran application rate (kg a. i. ha-’) a
Whole field Bottom paddy
Total area (ha)
Whole field Bottom paddy
Treated areab (ha)
Whole field Bottom paddy
Total carbofuran mass applied (kg a.i.)
Whole field Bottom paddy
1.10 1.10
24 6.5
5.1 1.3
5.59 1.41
1.21 1.81
34 2.8
6.8 0.8
8.24 1.47
0.64 0.66
32 5.3
8.5 1.4
5 .43 0.89
a Carbofuran recommended label rate 0.56 kg a. i. ha-’.
Carbofuran was applied only to borders of the rice paddies.
9

Sample Col.lection
Field Runoff and Agricultural Drain Water Runoff water samples were collected at the outlet of each rice field and analyzed for carbofuran concentrations during a three month period from mid- April to early-July, Water was sampled during periods of runoff for 72, 80
and 54 d after flooding for Fields 1 , 2 and 3 , respectively. Samples were collected with decreasing frequency as the study progressed. The frequency of sampling in relation to the number of days after flooding varied for each field due to differences in growers' management practices. Prior to the molinate holding period, outlet samples were collected three times per day (morning, midday and early evening) on each day that runoff water was released (Table 3 ) . Samples were collected twice each day (morning and late afternoon) of runoff water release for approximately two weeks following the molinate holding period. Subsequently, sampling was reduced to once per day (morning) for approximately three weeks, and then two times per week, for two more weeks. Field 2 had one sample taken during the final week of the study. Periodic sampling of irrigation water at field inlets indicated that carbofuran was not present in measurable amounts in source water (detection
limit =, 0.5 p& 6' ) .
Runoff water samples were collected from the stream of water flowing over the drain weir in I -L amber glass bottles. Water aamples were then acidified (pH < 3 ) with concentrated sulfuric acid to prevent degradation of carbofuran, sealed with Teflon*-lined caps and placed immediately on wet ice; samples were stored at 4'C until analyzed, When more than one sample was taken per day, sampling times were spaced as evenly as possible throughout the day. Inlet water samples were collected in a similar manner by immersin8 the bottle in the stream of water entering the top paddy in each field, and stored as described above.
Irrigation runoff water was collected from sugar beet fields during the first furrow irrigations, when greatest losses of residues in runoff were expected, 3 to 5 d after carbofuran applications. Samples were collected 3 times a day (morning, midday, evening) for approximately two 24-hour
10

Table 3. Sampling frequency and sampling periods for measurement of carbofuran in runoff water released from three rice fields.
3 (per dayP
2 (per day) d
1 (per dayId
2 (per week)
1 (per week)
d
d
Field 1 Field 2 Field 3
0- 13 0-9 1-10
26-40 23-36 30-40
4 1-62 37-57 4 1-54
63-72 58-73 -- -- 74-80 -
a During this period, sampling occurred only on days of water release.
Days after initial flooding of rice fields.
These samples were collected prior to molinate water holding period.
These samples were collected after molinate water holding period.
11

periods. Water was sampled from the tail-water ditch by immersing a 1-L amber glass bott le i n t o the center of the stream. Water samples were pH-
adjusted, sealed, and stored as previously described. Inlet water collected
once from the s u p p l y canal for Field 6 contained a low level ( 1 .O pg L-l ) of
carbofuran, near the detection limit (0 .5 pg L-’).
Samples were taken from the CBD and t r ibutary agr icul tural d r a i n s by
submerging 500-mL amber glass bot t les 15 cm below the water surface, After f i l l i n g , bot t les were closed with Teflon@-lined caps while submerged to avoid surface contamination. Samples were placed on ice imedia te ly following collection and stored i n re f r igera tors a t 4 ° C u n t i l analysis. Replicate samples were collected on the following 6 dates: 21 Apr i l , 5 May, 19 May, 2 June, 16 June, and 30 June, 1988.
Dissipation from Rice Fields Dissipation of carbofuran from s o i l and water of r ice f i e l d s was examined by
sampling treated areas i n the bottom paddies of eqch f ie ld . Soi l and water samples were collecked according t o t h e schedule i n Table 4. The perimeter of each battom paddy was d i v i d e d into three sections and three repl icate samples o f each matrix ( s o i l and water) were taken approximately 4.5 rn from the levee edge. Each sample was a composite of three subsamples, one from a d i f fe ren t random location i n each section.
. ,
Soil samples were collected w i t h a 4.8 cm i . d . glass cylinder pushed into the paddy s o i l t o a depth of 7.6 cm. Soil p l u g s were placed i n 946-mL mason jars which were sealed w i t h foil- l ined licp. Samples were placed immediately on wet ice, transferred to freezers and stored frozen a t -8°C u n t i l analyzed.
Water samples were scheduled f o r collection 0 , 1 , 2, 4, 6 , 8, 12, 16 , 20,
24, 28, 36, 44, 52, 60 , 70, and 80 d a f t e r bottom paddies were i n i t i a l l y flooded. Exceptions to t h i s schedule were: Field I was sampled 3 d a f t e r flooding (instead of 4 d after flooding); Fields 2 and 3 were sampled 1 1 d
after flooding (instead of 12 d after f looding); and i n Fields 2 and 3 water samples were not collected 44 d after f looding. Water was collected w i t h a
12

Table 4. Sampling schedule for measurement of carbofuran dissipation from s o i l and water of bottom rice paddies in Fields 1 , 2 and 3.
Sample type Daya
Paddy soil
Paddy water 0,1,2,3 c b ,4 ,6,8,11b,12',16,20,24,28,36, 44,52,60,70,80d
Day after initial flooding of Fields 1 , 2 and 3 .
Only Fields 2 and 3 were sampled.
Only Field 1 was sampled.
Only Fields 1 and 2 were sampled.

glass jar at tached t o a 4 .5 m long pole which was extended into the paddy from the bank. The j a r was dipped into the paddy and water was poured into the bott les th rough a stainless steel funnel. Water pH was adjusted and samples were placed on wet ice u n t i l t ransferred to refrigerators and stored a t 4,"C u n t i l analyzed.
Quality Control and Chemical Analysis Storage stabil i ty of carbofuran i n s o i l and water was examined and interlaboratory a,nalyses were conduct,ed as part of the quality, control ( Q C )
program for t h i , s s t u d y . Agricultural draip samp1,es collected by the CDFG
were not inu1,uded i n the QC program due to the limited number of samples
cpli1,ected. The CDEG laboratory method of analysis for carbofuran i n agricultural. drain water samnles i s described i n Appendix I .
, ,
Fi;eld sampks were extracted w,i thin 65 d af ter col lect ion for soi l and 28 d
after collection for water. Blank s o i l samples were spiked w i t h 500 Mg kg-' Carbofuran and stored for 70 days. Water samples,were spiked with 100 pg
L-' of carbqfuran, acidified (pH < 3 ) with concentrated sulfuric acid, and stored for 64 dgys. No appreciable loss of carbofuran occurred over these time periods. Approximately 10% of f i e ld so i l and water samples were s p l i t and analyzed for carbofuran by the primary laboratory, California Analytical Laboratories (CAL; a contract laboratory), and the QC laboratory, CDFA's
laboratory. A comparison of resu l t s (Appendix 11) from the two Laboratories, u s i n g the SAS Means procedure (SAS Ins t . , 1988), showed no difference between the soil analyses. CDFA's lab,oratory reported carbofuran
concentrations that were an average of 2.6 pg L-' (range 1 t o 7 pg L-' )
lqwer i n s p l i t water samples than those rep,orted by CAL (paired t- test , n = l l , a=O.Ol). T h i s small difference would not affect dissipation rates or re la t ive amounts of carbofuran i n runoff water determined i n t h i s study. A
cause for tbe discrepancy was not determined.
Soi l samples (50 g ) were shaken 1 h w i t h 125 mL of 0.25 N HC1 to ex t rac t carbofuran residues. Celite was added and samples shaken br ie f ly to homogenize, then samples were f i l t e r ed . The f i l t e r , c e l i t e and s o i l were extracted again wi th 100 mL HC1, shaken 30 min , f i l t e r ed , and rinsed 3 times
, '

with H C 1 . The extracts were brought up to a final volume of 400 mL. Thirty g of sodium sulfate were added to the extracts in a separatory funnel, then samples were shaken 3 times with methylene chloride. These extracts were pooled; isooctane was added as a solvent keeper, and the solution was concentrated to approximately 4 mL by rotary evaporation. The samples were reduced and exchanged to isooctane 4 times under a stream of nitrogen to a final concentration of 1 mL. Samples were analyzed for carbofuran by gas chromatography (GC) with a Varian Model 3000 (Varian, Palo Alto, CA) equipped with a thermionic selective detector and 30-m megabore columns: either DB-5 or D B - 6 0 8 (both were 0.53 mm i.d.) ( J and W Scientific, Folsom, C A ) . Columns were operated at 1 6 0 ° C and injection volumes were 5 pL. Gases
used were: helium as a carrier (approximately 30 mL min-l) and make up gas
(approximately 25 mL min- ' ) , and hydrogen as a detector gas (approximately 4.5 mL min-l). Detector and injector temperatures were 300°C and 22OoC,
respectively. Mean recoveries from soil were 94 i 12% (n = 23).
Water samples (500 mL) were combined with 10 mL concentrated H C 1 and 30 g
NaCl in a separatory funnel. Samples were extracted 3 times with 60 mL methylene chloride. These extracts were combined, 5 mL isooctane was added as a solvent keeper, and samples were concentrated by rotary evaporation to approximately 4 mL. Extracts were reduced under nitrogen and exchanged 5 times to isooctane; final volume was 1 mL. This extraction procedure was
suitable for residue levels below 200 pg mL-l . Samples were analyzed by GC as described above. Mean recoveries from water were 95 f 14% (n = 58).
Calculations The mass of carbofuran discharged from rice fields was determined by a series of five interpolation and calculation steps. First, concentrations of carbofuran in runoff water were assigned to discrete periods of time over the duration of the study by interpolation of measured carbofuran concentrations. Carbofuran concentrations in runoff water were measured daily (during water release) during the beginning of the study, then tapered off to weekly and biweekly samples (Table 3 ) . On some days, three samples of runoff concentrations were taken and on other days no samples were taken.

Because of this uneven distribution of samples over time, concentrations on all days of runoff were derived by interpolation of measured values by the following method. A given measured concentration was assigned to the time period halfway before and’halfway after the measured sample. For example, a carbofuran concentration measured at 0930 h on 0 d after flooding would be assumed constant from 0000 h (when the field was initially flooded and runoff began) to halfway between the 0930 h sample and the next sample. If the second sample was taken at 1600 h on the same day, then the measured concentration would be assumed constant from 1245 h to halfway between 1600
h and the next sample. The calculations involved are: from 0930 to 1600 is 6.5 h; 6.5 h /2 = 3.25 h; and 0930 + 3.25 h is 1245. Therefore, the first measured carbofuran concentration would be assumed constant for a time period of 12.75 h on 0 days after flooding (0000 to 0930 is 9.5 h; 0930 to 1245 is 3.25 h; 9.5 h + 3.25 h = 12.75 h) . The last measured carbofuran concentration before runoff stopped was assumed constant from the time of measurement until the end of runoff release. When runoff began again, the first measured carbofuran concentration was assumed constant for the period of time from the beginning of runoff release until halfway between the first sample and the next sample, as described above.
Second, the volume of runoff water (L) released from rice fields was
calculated as the product of flow rate (L h-’) and length of time (h) water was released at a given flow rate. Flow rates were calculated using methods for broad- and sharp-crested weirs (Hulsing, 1967), and field measurements of water height over weirs and weir board heights and widths. Third, carbofuran mass (kg) discharged from rice fields was calculated as the
product of concentration in runoff water (kg L-’) and the volume of water (L) released during a given time period (h). Time periods varied to coincide with halfway points between sampling of carbofuran in runoff water (discussed above) and changes in flow rates occurring within and between 24- h (daily) periods (Appendix 111, Part A). A conceptual diagram for time period determination is given below:

Fourth, both daily volume of runoff water and daily mass of carbofuran were calculated by summing the time weighted values for each of these variables, volume and mass, by day after flooding (Appendix 111, Part 9). An example from Appendix I11 (Parts A and B) is given below:
Day Carbo- after furan flood- Flow Time Water concen- Mass
Field ina rate period volume trat ion discharged
(L h-l) (h) (L) (kg L-l) (kg)
2 0 163 1 1 1 1 . 00 1794 16 0.0000000052 0.0009330 0 63203 1 .75 1 10606 0.0000000052 0,0005750 0 63203 6.25 39502 1 0.00000002 13 0.0084 140 0 63203 5.00 3 160 17 0,0000000067 0.002 1 170
Daily totals 24.00 1001059 0.0 120394
Fifth, the daily average carbofuran concentration (kg L-l) was calculated by dividing the daily mass discharged (kg) by the daily volume of water
released (L). When multiplied by the conversion factor 1 x lo-’ kg pg-’ , daily average carbofuran concentration can also be expressed in units of
17

pg L- ’ . For days with multiple concentration o r flow measurements the daily value represents a weighted average as described above. On some days, only one value was available for measured and/or interpolated runoff water concentrations and for flow.
Potential carbofuran discharge values for rice and sugar beet (P, Eq. [ 13 )
were calculated by multiplying the fraction of applied carbofuran discharged in runoff water from a field, by the total mass applied in Glenn, Colusa and Yolo Counties during April to June, 1988:
P = pQtential discharge of carbofuran mass (kg) in agricultural d?rains ;
Cd = carbofuran (kg) discharged from a field;
Ca = carbofuran (kg) applied to a field;
Ct = total carbofuran (kg) applied in Colusa, Glenn and Yolo Counties
, ,
(data from County Agricultural Commissioners),
Estimates of the amount of carbofuran (kg) discharged from rice fields were derived from measurements taken during this study. Values for the amount of carbofuran (kg) discharged from sugar beet fields (Cdosb, Eq. [ 2 ] ) were
estimated from measurements of carbofuran concentyakions in grab samples of runoff water from three beet fields (Appendix IV), and from an assumed volume of water discharged:
‘d sb = crvc
‘d sb = carbofuran (kg) discharged from sugar beet fields;
‘r = carbofuran concentration (pg L-’ ) measured in .runoff water
from sugar beet fields;
18

V = volume (L) of runoff water from sugar beet fields (assumed equal to the average volume of runoff measured by Spencer et al. (1985) ) ;
C = lo-' ( k g pg-' ) conversion factor.
Measurements of the volume of runoff water were not made f o r sugar beet fields. For comparison purposes, the volume of runoff water discharged from sugar beet fields (V, Eq. [2]) was assumed to equal an average volume calculated from measurements of runoff water reported by Spencer et al. (1985). In that study, the volume of irrigation runoff water was monitored for two furrow-irrigated sugar beet fields in Imperial Valley, California, during the 1978-79 and/or 1979-80 crop year.
Carbofuran mass (kg and kg ha-') calculations were based upon concentrations measured in bottom paddy soil and water, and corresponding areas. For soil, calculations were based upon the border area of application (Treated area, Table 2). For water, calculations were based upon the entire area (Total area, Table 2). The assumption was made that little or no lateral movement, or adsorption, occurred in soil outside of the applied area. On the other hand, carbofuran was assumed t o spread over the entire paddy area in water, due t o mixing and diffusion.

RESULTS AND DISCUSSION
Mass Discharged from Rice The total number of days that water was released from fields, during the 80 d sampling period, ranged from 34 to 65 days (Table 5 ) . The pattern of individual days of water release varied for each field. During the first 30 d period after flooding there were relatively few days when water was released from Field 1. In addition, during this period molinate (an herbicide) was applied and water was held on the fields for the following 12 to 18 d, After the holding period for molinate (which allows time for dissipation of this herbicide on-field), water was released almost continuously for the remainder of the study, except in Field 3. Field 3 was boarded up 54 d after flooding for application of bentazon (an herbicide) and water was held on this field for the rest of the study. Although Field 3 had the fewest number of days of water discharge (34 d),
the greatest total volume of water (151.82 x I& L) was released from this field. Total volumes O f water released over the 54 to 80 d period (80.40 to
151.82 x 18 L) were greater than the findings of McGill (1982) for two rice
fields (27 and 72 x 18 L during the first 69 and 46 d of water release, respectively) located in Colusa and Glenn Counties.
The percent of applied carbofuran discharged in runoff water over the study period totaled 1.72, 5.40 and 11.03% for Fields 1 , 2, and 3, respectively (Table 6 ) . The average percent of applied carbofuran discharged in runoff water from these fields was 6.05% over an 80 d period. Comparable carbofuran runoff data for rice fields do not exist in the literature; however, in comparison with other rice pesticides the 6.05% of applied carbofuran discharged was approximately one-half of the average percents of applied molinate (112, n = 9) and thiobencarb (14.22, n = 5) discharged in runoff water from rice fields within one month after application (Ross et al.? 1984).
Runoff loads, the ratio of total carbofuran mass discharged in runoff water to the total volume of runoff water released, were calculated for each of three time periods (Table 7). The greatest runoff loads consistently
20
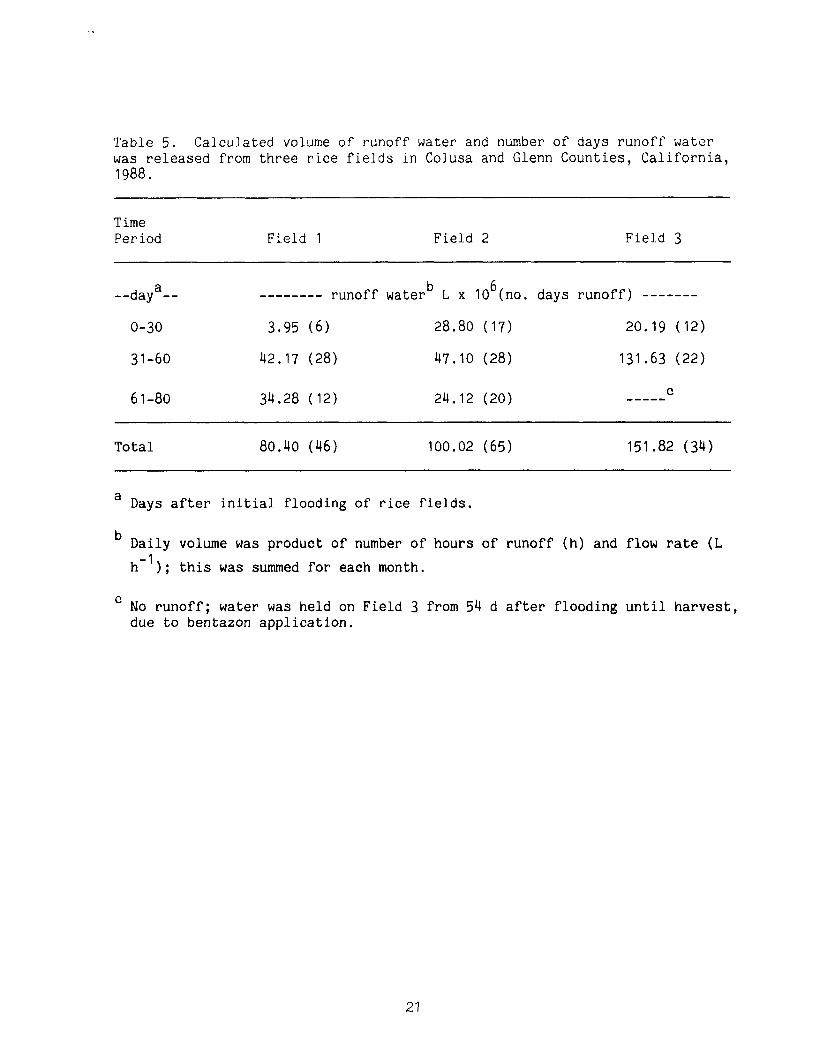
Table 5 . Calculated volume of runof f water and number o f d a y s r u n o f f water was released from three r ice f i e l d s in Co lusa and G lenn Coun t i e s , Ca l i fo rn ia , 1988.
Time Period F i e l d 1 F i e l d 2 F i e l d 3
a 6 --day -- -------- runof f waterb L x 10 (no . days runof f ) -------
0-30 3 . 9 5 ( 6 ) 28.80 (17) 20 .19 (12 )
3 1-60 42.17 (28) 47.10 (28) 131.63 ( 2 2 )
6 1-80 34 .28 ( 1 2 ) 24.12 (20) C
~~
To t a l 80 .40 (46) 100 .02 (65) 151 .82 (34)
a Days after i n i t i a l f l o o d i n g of r ice f ie lds .
Daily volume was produc t of number of h o u r s o f r u n o f f ( h ) and flow rate ( L
h - l ) ; t h i s was summed for each month.
No r u n o f f ; water was he ld on F i e l d 3 from 54 d after f l o o d i n g u n t i l h a r v e s t , due t o b e n t a z o n a p p l i c a t i o n .
21

Table 6 . Calculated carbofuran mass discharged i n runoff water and percent of applied carbofuran moved off-field i n runoff water from three r ice f ie lds i n Colusa and Glenn Counties, California, 1988.
Time Period Field 1 Field 2 Field 3
--day -- a __-_-------- carbofuranb kg a . i . ( $ of appliedc) ------------
0-30 0.027 (0.49) 0.354 (4.30) 0.215 (3.97)
3 1-60 0.045 (0.81) 0.064 (0.77) 0.384 (7.06)
6 1-80 0.024 (0.43) 0.027 (0.33) d -----
Total 0.096 (1.72) 0.445 (5.40) 0.599 ( 1 1.03)
a Days af te r in i t ia l f looding i n r ice f ie lds .
Daily carbofuran mass discharged i n runoff water was calculated as the product of the carbofuran concentration (kg L-') and the volume of runoff water (L); t h i s mass was summed over each month.
Mass of carbofuran applied to entire field was 5.59, 8.24 and 5.43 kg a . i . for Fields 1, 2 and 3 , respectively.
No runoff; water was held on Field 3 from 54 d after f looding, u n t i l harvest, due to bentazon application.
22

Table 7 . Runoff loads for ca rbofu ran discharged i n r u n o f f water from three r ice f i e lds f o r three time p e r i o d s a f t e r i n i t i a l f l o o d i n g .
Time Period F i e l d 1 F i e l d 2 F i e l d 3
--day -- a
0-30
3 1-60
6 1-80
---- runof f l oadb , ca rbo fu ran kg L-’ X lo” ----
6.84 12.29 10.65
1.07 1.36 2.92
0.70 1.12 C ---
a Days af ter i n i t i a l f l o o d i n g i n r ice f i e lds .
Runof f l oads (kg L-’ x lo-’) are q u o t i e n t s o f t h e mass of ca rbofu ran d i s c h a r g e d ( k g ) d i v i d e d by t h e volume of runof f water (L), for each of the three time p e r i o d s .
C NO r u n o f f ; water was h e l d on F i e l d 3 from 54 d af ter f l o o d i n g u n t i l h a r v e s t , due t o b e n t a z o n a p p l i c a t i o n .

o c c u r r e d d u r i n g t h e f i r s t 30 d pe r iod a f t e r f l o o d i n g , for a l l t h r e e f i e l d s . Runoff l oads decreased in subsequen t time p e r i o d s . The h i g h r u n o f f l o a d s
d u r i n g t h e f i r s t 30 d a f t e r f l o o d i n g were c o n s i s t e n t w i t h the f i n d i n g s o f H a i t h (1987) . He de termined f rom s imula t ion model ing t h a t t h e r u n o f f l o a d s
o f c a r b o f u r a n from s u r f a c e a p p l i c a t i o n s t o s o i l i n c o r n f i e l d s would be
g r e a t e s t d u r i n g the month of a p p l i c a t i o n .
Mass d i s c h a r g e is a f u n c t i o n o f b o t h t h e c o n c e n t r a t i o n o f c a r b o f u r a n i n
r u n o f f water and the volume of water released. Al though runoff loads
decreased g r e a t l y af ter the f i r s t 30 d p e r i o d , the amount of mass d i s c h a r g e d ( T a b l e 6 and F ig . 3) was g r e a t e s t d u r i n g t h e p e r i o d 31 t o 60 d af ter f l o o d i n g , i n F i e l d s 1 and 3. T h i s was d u e t o t he g r e a t e r volume o f water released from these f i e l d s ove r more d a y s d u r i n g t h i s p e r i o d ( T a b l e 5 and F i g . 4 ) . T h e g r e a t e s t mass d i s c h a r g e of c a r b o f u r a n from F i e l d 2 o c c u r r e d d u r i n g t h e f i rs t 30 d after f l o o d i n g . T h i s was d u e t o the movement o f f - f i e l d of approx ima te ly 0.2 kg o f c a r b o f u r a n (44% o f the to t a l c a r b o f u r a n
mass d i s c h a r g e d ) w i t h i n three consecu t ive days soon after t h e m o l i n a t e h o l d i n g p e r i o d (24 t o 26 d af ter f l o o d i n g ) ( F i g . 3 ) . During t h i s p e r i o d , a combina t ion of h i g h d a i l y a v e r a g e c o n c e n t r a t i o n s o f c a r b o f u r a n i n r u n o f f
water (22 t o 28 pg L-' ) and l a rge vo lumes of water r e l e a s e d ( 2 . 1 0 t o 3.21 x
10 L) ( F i g . 4) r e s u l t e d i n t h e l a r g e mass of carbofuran moving off-f ie ld .
T h e s e t h r e e d a y s d e m o n s t r a t e t h e effect t h a t d a i l y mass d i s c h a r g e s can have o n t h e t o t a l mass of ca rbofu ran released o f f - f i e l d . L a r g e c a r b o f u r a n mass d i s c h a r g e s were n o t a l w a y s t h e r e s u l t o f h i g h c o n c e n t r a t i o n s c o u p l e d wi th
l a r g e releases of r u n o f f water. Approximately 9 t o 10% o f the t o t a l
6
c a r b o f u r a n mass d i s c h a r g e d was r e l e a s e d from F i e l d 1 (0.9 t o 1 .O kg x 16'
ca rbofu ran ) on bo th 0 and 32 d after f lood ing and from F i e l d 3 (5.7 t o 6.1 x
10-L kg ca rbofu ran ) on bo th 32 and 33 d a f te r f l o o d i n g ( F i g . 3 ) . T h i s o c c u r r e d when d a i l y a v e r a g e c o n c e n t r a t i o n s o f c a r b o f u r a n were low t o
moderate ( 4 . 2 t o 6 . 8 pg L-' ) and water volumes released were l a r g e ( 1.57 t o
9.18 x 18 L) ( F i g . 4 ) .


Field 1 20
- Concentration 0 Volume
15
10
5
0 0 10 20 30 40 50 60 70 80
Day after Flooding
Figure 4. Daily average carbofuran concentrations and daily volume of runoff water released from three rice fields, after initial flood- ing. Arrows indicate beginning ( + ) and ending ( 4 ) points of the water holding period for rnolinate applications.
26

Maximum concentrations of carbofuran in runoff water from all fields ranged
from 21 to 33 pg L-’ and occurred within 26 d after flooding (Table 8). In Fields 1 and 2 , maximum carbofuran concentrations occurred in runoff water released following the molinate holding period (26, and 24 to 26 d after flooding, respectively), Maximum carbofuran concentrations in Field 3 runoff water occurred 1 d after flooding, prior to the molinate holding period, on the first day of water release, The reasons for maximum carbofuran concentrations occurring before or after the molinate holding period are unknown and cannot be determined by this study, but in some cases may have been related to low water levels in the fields. Concentrations in
runoff water declined with time and generally remained below 5 1.(g L-l by 43 d after flooding in all fields.
Rice vs. Sugar Beet Average concentrations of carbofuran in runoff water from three sugar beet fields sampled during their first irrigations were generally higher than the early season concentrations from rice runoff. Average and maximum concentrations for Fields 4, 5 and 6 were 25 f 12 and 45, 1 f 1 and 4, and
134 f 49 and 200 ug 6’ , respectively (Appendix IV),
Information was obtained from County Agricultural Commissioners on carbofuran use in Colusa, Glenn and Yolo Counties and used to calculate potential mass discharged from rice and sugar beet fields from April through July, 1988. The total amount of carbofuran active ingredient applied in the three counties was 7,619 kg for rice and 967 kg f o r sugar beet fields. Approximately 461 kg of carbofuran from rice fields and 41 kg from sugar beet fields were hypothetically discharged into agricultural drains in 1988 (Appendix V, Parts A and B). It should be noted that these values were derived from only three rice fields (in Colusa and Glenn Counties only) and from grab samples from three sugar beet fields (in Colusa County only). Therefore, these estimates of potential carbofuran mass discharged may not be entirely representative of rice and sugar beet fields in Colusa, Glenn and Yolo Counties. Concentrations measured from these rice fields, where carbofuran was incorporated into the soil, were low (maximum concentration =
27

Table 8. Concentrations and days of maximum oarbofuran residues in runoff water from three rice fields, and days water was held on fields due to molinate application.
Field Max. carbofuran residues Molinate holding period . .
i -i Fig L- -- a -- day -- -------- .. daya ___---__
1 21,1 26 14 - 25 2 32 ;8 24-26 1 1 - 22
3 27.1 1 12 - 29
a bays a f t e r initial flooding of rice fieldd,
28

33 pg L-’ ) compared with concentrations resulting from a non-incorporated application. Deuel et al. (1979) found maximum concentrations of carbofuran
in rice paddy water at approximately 200 to 300 pg L- ’ when granules were applied to standing water at a rate of 0.56 kg a. i, ha-’. Therefore, the calculated potential discharge for rice, which was based on incorporated carbofuran applications, may be low. Also, in calculating these values for sugar beet fields, the volume of water discharged was assumed to equal an
average volume (1.0 x 18 L ha-’ , over four irrigations) calculated from measurements of runoff water reported by Spencer et al. (1985). This assumption is reasonable; but even if the volumes of water released from sugar beet fields were doubled, the ratio of carbofuran mass discharged from rice to sugar beet would only be reduced from 1 1 : 1 (461 :4 1 kg) to 6: 1
(461:82 kg). These estimates indicate that the potential discharge of carbofuran in agricultural runoff water is greater from rice than sugar beet fields in this three-county area,
To further support the case that the major portion of carbofuran residues in agricultural drains came from rice fields, information on carbofuran use (described above) was compared with concentrations of carbofuran found in Colusa Basin Drain (CBD) water samples collected by the CDFG. These samples were collected as part of an ongoing program to monitor surface waters for residues of pesticides used in rice fields (CDFA, 1988). Figure 5 shows that the highest concentrations of carbofuran were found in drain water at the CBDl site during the end of April and the first half of May. Very little carbofuran was applied to sugar beet fields during this time period in comparison with rice. Warm weather occurred in the beginning of April in 1988, prompting rice growers to get an early start. In addition, the largest amounts of carbofuran applied to sugar beet fields during this time period were in Yo10 County where a small percentage of the agricultural water drains into the CBD. As a part of this study, water samples were collected from four additional sites along agricultural drains in Colusa County. Concentrations of carbofuran in water at these locations support the levels found at the CBDl site (Fig. 6) and indicate that sources for

Carbofuran use (kg a.i.) Concentration (ug/L) 3000
2500
2000
1500
1000
500
0
...................................
............... .....................................................................
4/7 4/14 4/21 4/25 4/28 5/2 5/5 5/9 5/12 5/16 5/19 5/23 5/26 5/30 612 616 6/9
Date
-+t+ CBDI Rice use (kg a.i.) Beet use (kg a.i.)
Figure 5. Total mass of carbofuran used per week in Colusa, Glenn and Yolo Counties vs. concentrations of carbofuran in water (detection limit 1.0 pg L-' ) at the CBDl agricultural drain site in Yolo County, California, 1988.
5
4
3
2
1
0

Concentration (ug/L) 5
b
--c CBD1 -+ CBDS -+-- Willow Creek
-e- Stone Corral Creek * Freshwater/Salt Creek
Figure 6. Carbofuran water concentrations (detection limit 1.0 vg L") found at agricultural drain sampling sites in Colusa and Yo10 Counties, California, 1988.

most of the residues were north of Yo10 County where the majority of carbofuran use is in rice fields.
Dissipation from Paddy Soil and Water Concentrations of carbofuran in paddy soil were quite variable (average coefficient of variation within day was 38%) in all three fields, but generally declined over the 80 d sampling period in Fields 1 and 2.
Concentrations did not decline appreciably in Field 3 during 70 d of sampling. Variability was due to the uneven distribution of granules incorporated into the soil (Taylor et al., 1985). Maximum average (n=3)
concentrations of carbofuran in paddy soil ranged from 0.50 to 0.79 mg kg-’ and occurred within 1 1 t o 20 d after flooding the fields. Final average
concentrations in soil were 0.15, 0.19 and 0.57 mg kg-’ in Fields 1, 2 and 3, respectively (Table 9).
Dissipation of the mass of carbofuran in paddy soil in Fields 1 and 2 was a log-linear function of time. Dissipation half-lives in soil were determined to be 58 and 43 d after flooding in Field 1 and Field 2, respectively (Table 10). Regression analysis indicated that dissipation in Field 3 was not significant (F = 0.44; df = 1,9; P > 0.5) over the 70 day sampling period; therefore, the best predictor of carbofuran mass in soil for Field 3 on any
day during the study was the overall mean of 0.50 kg ha- I . Degradation within the zone of sampling or movement of carbofuran mass out of that zone, by leaching or by diffusion into paddy water, may have contributed t o the dissipation process. Soil pH can affect the hydrolytic degradation rate of carbofuran (Caro et al., 1973; Getzin, 1973). Since soil pH was similar in all of the fields (average pH = 6.2, 5.8 and 6.31 in Fields 1 , 2 and 3, respectively), persistence of carbofuran in Field 3 so i l indicated that degradation by hydrolysis was not an important factor in the dissipation process. This may have been due to low pH levels. Deuel et al. ( 1979)
determined that hydrolysis was not a major contributing factor in the dissipation of carbofuran from rice paddy water (pH 6.0 t o 6.5). These half-lives should be taken as an approximation of dissipation, since the data were variable and the models were only able to explain 61 to 68% of the variation (Table 10).

Table 9 . Maximum average ( n = 3 ) concentrations of carbofuran found a f t e r flooding r ice fields and f ina l average ( n = 3) bancentrations found i n s o i l and water of bottom paddies of three r ice f ie lds .
so1 L WATER Max. Final Max. Final ayg; ay3 * avg. avg . conc (. conc. con'c . conc. ----- , ,
' ' mg kg-' (day )" ------ ---e- pg L-l (day la ------ . I .
1.2 (80) 2
a i Fj9y.s af ter ini t , ia l , fl,ood,i,ng o f the field,. I . , 9 , 8 . , , : , , . , * .
33

Table 10. Regression analyses of carbofuran dissipation in paddy soil and water and calculated half-lives.
Modela
Calc. half-
b
R2 life (day)c
so1 L
Field 1 y= -0.80 - 0.012 (day) 58
Field 2 y= -0.43 - 0.016 (day) 0.68 43
C 0.61
Field 3 y= -0.62 - 0.002 (day) 0 . 05d -- e WATER
Field 1 y= -4.03 - 0.031 (day) 0.73 22
Field 2 y= -4.23 - 0.027 (day) 0.73 26
Field 3 y= -3.39 - 0.039 (day) 0.77 18
a Dependent variable (y) = In [avg. carbofuran mass per unit area (kg ha-’ ) 1 .
Half-life calculated by: tl,* = I n 2 ; b = regression slope; n = 11 to 17.
lb17 1
C Day= days after initial flooding of the field.
Regression model was not significant (F= 0.44; df= 1,9; P > 0.5)
e Half-life not calculated; dissipation not significant over study period.

Carbofuran soil half-lives for Fields 1 and 2 were considerably shorter than the half-life determined by Caro et al. (1973) f o r carbofuran granules
incorporated (4.61 kg a.i. ha-’) in seed-furrows of a corn field (half-life = 117 d after application). Low soil pH (5.2) and low soil moisture content (compared with flooded soil), which promote stability of carbofuran, may have been contributing factors in his study.
Carbofuran concentrations fluctuated widely in paddy water early in the study, but variability within day (average coefficient of variation = 18%) was less in water than in paddy soil. Maximum average (n = 3)
concentrations of carbofuran in paddy water ranged from 24.5 to 38.2 pg L” within 1 to 28 d after flooding the fields. These concentrations were low compared with maximum water concentrations of approximately 200 to 300 pg
L-’ reported by Deuel et al. ( 1979) for carbofuran applied directly to paddy water. Final average concentrations of carbofuran in water were 1.2, 0.7
Dissipation of carbofuran mass in paddy water was similar for a l l three fields. Regression analyses indicated that dissipation of carbofuran mass in water was a log-linear function of days after flooding the fields. Water dissipation half-lives calculated from regression curves ranged from 18 to 26 d after flooding (Table 10). Shorter dissipation times were reported by Deuel et al. (1979) for a rice field in Texas. He found that granular
carbofuran applied at the recommended rate (0.56 kg a. i . ha- ’ ) to paddy water generally dissipated within four days. In the Philippines, Siddaramappa et al. (1978) found that broadcast applications of granular
carbofuran (2 kg a. i . ha-’) to paddy water resulted in hydrolysis of carbofuran to carbofuran phenol within five days,
Although significant dissipation of carbofuran in soil was not observed in Field 3, this did not influence the dissipation of carbofuran in paddy water. This may have been due to higher pH levels in water (average pH 7.0 to 7.6) than in soil (average pH 5.8 to 6.3) which increased rates of carbofuran degradation by hydrolysis (Seiber, 1978).
35

Mass Recovered from Paddy Soil and Water The mass of carbofuran recovered in paddy soil 0 d after flooding was 44, 32
and 109% of the mass applied in Fields 1,2 and 3, respectively (Table 11) .
Recoveries of carbofuran mass in paddy soil over 100% occurred due to the variable distribution of granules and extrapolation of sample mass recovered to the entire treated paddy area. Low recovery occurred despite the high
rates of application in Fields 1 and 2 (1.10 and 1.81 kg a.i. ha-',
respectively) compared with Field 3 (0.66 kg a. i. ha"). This may be due to the difference in final preparation of the fields. Fields 1 and 2 were "rolled" to create ridges in the seed bed (to prevent seeds from moving to field edges) and to pack and seal the soil surface which prevents loose soil from covering the seeds during periods of rough water. Since occurred after application of the carbofuran granules, a surface layer of soil may have been formed which trapped granules below it and acted as a barrier to upGtard diffusion of carbofuran. The soil in Field 3 was "rolled" before application and this may have helped to retain the carbofuran granules in the surface layer. Carbofuran granules are stable in soil under low moisture conditions (Harris et al., 1988) which existed in Fields 1 and 2 (approximately 18% soil moisture) prior to flooding. It is unlikely that 50% or more of the carbofuran in Fields 1 and 2 would have degraded within six to 10 days after application, An alternative explanation is that some of the carbofuran was unavailable .for sampling because granules had moved below the 7.6 , cm sampling depth during or after appl,ication, before the 'fields were flooded .
Carbofuran mass recovered in paddy water was considerably less than the mass recovered in soil throughout the study for all fields. In Field 3, the mass recovered in water 0 d after flooding was relatively high compared with Fields 1 and 2 (Table l l ) , reflecting the maximum concentrations found in runoff and paddy water in Field 3 , 1 d after flooding. By 70 d after flooding the mass recovered in paddy water was less than 1% of the total mass applied, for all fields. The total mass of carbofuran in soil and water of the bottom paddies of the fields 0 d after flooding ranged from 34 to 132% of the mass applied. Seventy d after flooding the total mass of carbofuran recovered from soil and water ranged from 18 to 89% of the mass

Table 1 1 . Carbofuran mass and percent of applied carbofuran recovered from s o i l and water i n bottom paddies of rice f ields. Total mass recovered from s o i l and water as percent of carbofuran mass applied.
so1 L WATER TOTAL
$ of % of % OF kg applied kg applied A P P L I E D ~
0 Days after f looding Field 1 0.62 44 0.083 6 50
Field 2 0.47 32 0.036 2 34
Field 3 0.97 logb 0.200 23 1 32b
70 Days after f looding Field 1 0.29 21 0.011 0.8 22
Field 2 0.26 18 0.006 0.4 18
F i e l d 3 0.78 88 0.008 0.9 89
a Total mass of carbofuran applied to bottom paddies of Fields 1, 2 and 3 was 1 . 4 1 , 1.47 and 0.89 kg, respectively.
Recoveries of carbofuran mass i n paddy s o i l over 100% were due to variable dis t r ibut ion of granules i n s o i l and extrapolation of sample mass to the entire treated area.
37

applied. The average mass of carbofuran in paddy water alone on any day during the study did not exceed 27% of the mass applied. The majority of the carbofuran mass incorporated into the soil remained there throughout the study with relatively small amounts diffusing out into the water and transported off-field.
Carbofuran has a relatively high water solubility, 291 mg L- at 10°C to 700
mg L-' at 2 5 O C (Bowman and Sans, 1985; Kuhr and Dorough, 1976) , and
I
adsorption in clay loam soil is relatively low, Kd ,0.25 t o 2.22 mL g- '
(Felsot and Wilson, 1980; Kumari et al., 1988). This suggests that carbofuran may partition to a great extent into the water component. This was not seen when carbofuran was soil-incorporated. The mass recovered in paddy soil was five or more times the mass recovered in water, 0 d after flooding (Table 11). The mass in water decreased over time until the mass in soil was up to 98 times greater than the mass in wslter, by 70 d after flooding. The low levels of carbofuran in water may have been due in part to the general downward percolation of water through the soil, leaving transfer of oarbofurah upward to the slower process of diffusion. As rice plants developed, uptake of carbofuran through their roots may also have reduced the movement upward. Additionally, concentrations in paddy water were affeoted by dilution from irrigation water and off-field transport. Siddaramappa and Seiber (1979) reported increased persistence in soil and lower concentrations in standing water, in a laboratory model ecosystem, when carbofuran was applied as a solution injected to a depth of three cm below the soil surface vs. application directly into dater.
coNcLusIoNs A total of 1.72, 5.40 and 11.03% of carbofuran applied to three commercial rice fields was discharged in runoff water within 80 d after flooding the fields.
Several factors indicated that carbofuran residues discharged from rice fields in runoff water were the sole major source of carbofuran mass found in agricultural drains and the Sacramento River in 1987 and 1988. A
compar ison of the p o t e n t i a l mass o f c a r b o f u r a n d i s c h a r g e d f r o m r i ce and s u g a r beet f i e l d s i n Colusa, Glenn and Yolo Coun t i e s from A p r i l t h r o u g h
J u l y , 1988 i n d i c a t e d t h a t r i ce r u n o f f water c o n t r i b u t e d a n e l e v e n - f o l d g r e a t e r mass t o a g r i c u l t u r a l d r a i n water than d i d s u g a r beet r u n o f f . A d d i t i o n a l l y , p e a k c o n c e n t r a t i o n s o f c a r b o f u r a n were detected i n a g r i c u l t u r a l d ra in water from A p r i l t o t h e f i r s t h a l f o f May when v e r y l i t t l e c a r b o f u r a n was a p p l i e d t o s u g a r beet f i e lds . C o n c e n t r a t i o n s o f
c a r b o f u r a n i n s e v e r a l a g r i c u l t u r a l d r a i n s i n d i c a t e d that m a j o r s o u r c e s of r e s i d u e s were n o r t h o f Yolo County where most of t h e c a r b o f u r a n u s e is i n
rice f ie lds .
Maximum c o n c e n t r a t i o n s o f c a r b o f u r a n i n p a d d y s o i l r a n g e d f r o m 0.50 t o 0.80
mg kg- ' and occu r red w i th in 11 t o 20 d a f t e r f l o o d i n g . F i n a l
c o n c e n t r a t i o n s , a t t h e close of t h e s t u d y , r a n g e d from 0.15 t o 0.57 mg kg-' . D i s s i p a t i o n h a l f - l i v e s f o r c a r b o f u r a n i n c o r p o r a t e d i n t o p a d d y so i l were 58 and 43 d after f l o o d i n g f o r F i e l d s 1 a n d 2 , r e s p e c t i v e l y . D i s s i p a t i o n of c a r b o f u r a n from s o i l was n o t s i g n i f i c a n t i n F i e l d 3 d u r i n g t h e 7 0 d sampl ing
p e r i o d .
Maximum c o n c e n t r a t i o n s of ca rbofu ran i n paddy water ranged from 24.5 t o 38.2
pg L-' a n d o c c u r r e d w i t h i n 1 t o 2 8 d after f l o o d i n g . C o n c e n t r a t i o n s r a n g e d
from 0 . 7 t o 1.7 pg L-l by the end of t h e s tudy. Paddy water d i s s i p a t i o n h a l f - l i v e s f o r c a r b o f u r a n were 22, 26 and 18 d after f l o o d i n g for F i e l d s 1 ,
2 and 3, r e s p e c t i v e l y .
The mass o f c a r b o f u r a n r e c o v e r e d from paddy s o i l on t h e first d a y f i e l d s were f looded r anged from 32 t o l o g $ o f t h e mass a p p l i e d . Low i n i t i a l c a r b o f u r a n mass found in paddy soils o f F i e l d s 1 and 2 may h a v e i n f l u e n c e d
d i s s i p a t i o n i n t h e 7 . 6 cm deep zone sampled. This was r e f l e c t e d i n t h e r e d u c e d t o t a l mass o f c a r b o f u r a n d i s c h a r g e d i n r u n o f f water f r o m F i e l d s 1
and 2 when compared with F i e l d 3. The ma jo r i ty o f ca rbo fu ran mass i n c o r p o r a t e d i n t o t he s o i l remained there wi th no more than 27% of the mass appl ied found in paddy water on any s ing le day t h roughou t t he s tudy . Although a direct comparison w i t h o t h e r a p p l i c a t i o n m e t h o d s was n o t made,
39

results indicate that the amount of carbofuran released into paddy water is
reduced when carbofuran is soil-incorporated. Consequently, the mass released off-field i n runoff water may also be reduced. I t should be noted that incorporation may increase persistence i n s o i l and water, thereby affecting the leaching potential of carbofuran.

REFERENCES
Ahmad, N., D.D. Walgenbach, and G.R. Sutter. technical carbofuran and a granular formulation insecticide use history. Bull. Environ. Contam.
1979. Degradation rates of i.n four soils with known Toxicol. 23:572-574.
Begg, E.L. 1968. Soil Survey of Glenn County, Ca Gov. Print. Office, Washington, DC.
lifornia. USDA-SCS. U.S.
Bowman, B.T. and W.W. Sans. 1985. Effect of temperature on the water solubility of insecticides. J . Environ. Sci. Health B 20(6):625-631.
California Department of Food and Agriculture (CDFA). 1987. Monthly Summary of Pesticide Use Reports, by County. Information Services Branch. Sacramento, CA.
California Department of Food and Agriculture (CDFA). 1988. Draft: 1989 Program to prevent off-site movement of pesticides from California rice fields. Environmental Hazards Assessment Program Report. Calif. Dept. of Food and Agric., Sacramento, CA.
Caro, J . H . , H . P . Freeman, D.E. Clotfelty, B.C. Turner, and W.M. Edwards. 1973. Dissipation of soil-incorporated carbofuran in the field. J. Agr. Food Chem. 21(6):1010-1015.
Deuel, L. E. , Jr , , J . D. Price, F .T. Turner, and K .w. Bt-own 1979 Persistence of carbofuran and its metabolites, 3-keto and 3-hydroxy carbofuran, under flooded rice culture. J. Environ. Qual. 8(1):23-26.
Felsot, A. and J. Wilson. 1980. Adsorption of carbofuran and movement on soil thin layers. Bull. Environ. Contam. Toxicol. 24:778-782.
Getzin, L.W. 1973. Persistence and degradation of carbofuran in soil. Environ. Entomol. 2(3):461-467.
Haith, D.A. 1987. Extreme event analysis of pesticide loads to surface waters. J. Water Pollut. Control Fed. 59(5) :284-288.
Harris, C.R., R.A. Chapman, J . H . Tolman, P. Moy, K. Henning, and C. Harris. 1988. A comparison of the persistence in a clay loam of single and repeated annual applications of seven granular insecticides used for corn rootworm control. J. Environ. Sci , Health B 23( 1 ) : 1-32.
Hulsing, H . 1967. Measurement of peak discharge at dams by indirect method. Chapter A5. In Techniques of water-resources investigations of the United States Geological Survey. (Book 3 Application of Hydraulics),
Kuhr, R.J. and H.W. Dorough. 1976. Carbamate insecticides: chemistry, biochemistry and toxicology. CRC Press, Cleveland, OH.
Kumari , K. , R. P . Singh, and S .K. Saxena. 1988, Movement of carbofuran (nematicide) in soil columns. Ecotoxicol. Environ. Saf. 16:36-44.

McGill, R . R . 1982. Low applied water on rice. Northern District Report. Calif. Dept. of Water Resources.
Miles, J.R., C . M . Tu, and C.R. Harris. 1981. A 1.aboratot-y study of the persistence of carbofuran and its 3-hydoxy and 3-keto metabolites in sterile and natural mineral and organic soils. J. Environ. Sci. Health B 16(9):409-417.
Ou, L.-T., D.H. Gancarz, W.B. Wheeler, P.S.C. Rao, and J.M. Davidson. 1982. Influence of soil temperature and soil moisture on degradation and metabolism of carbofuran in soils, J. Environ. Qual. 11(2):293-298.
Ross, L. J., R . J. Sava, and R . J . Oshima. 1984. Environmental fate of selected herbicides (thiobencarb and molinate) under field conditions. Environmental Hazards Assessment Program Report. Calif. Dept. of Food and Agric., Sacramento, CA.
SAS Institute. 1988. SAS procedures guide. SAS Inst., Cary, NC.
Seiber, J.N., M.P. Catahan, and C.R. Barril. 1978. Loss of carbofuran from rice paddy water: Chemical and physical factors. J. Environ. Sci. Health B 13(2) :131-148.
Siddaramappa, A. and J.N. Seiber. 1979. Persistence of carbofuran in flooded rice soils and water, Prog. Wat. Tech. 11(6):103-111.
Siddaramappa, R., A.C. Tirol, J . N . Seiber, E.A. Heinrichs, and I. Watanabe. 1978. The degradation of carbofuran in paddy water and flooded soil of untreated and retreated rice fields. J. Environ. Sci. Health B 13(4):369- 380.
Spencer, W.F., M.M. Cliath, J.W. Blair, and R.A. LeMert, 1985. Transport of pesticides from'irrigated fields in surface runoff and tile drain waters. U.S. Dept. Agric. Conservation Research Report 31, 76p.
Taylor, A.W J.H. Caro, H.P. Freeman, and B.C. Turner. 1985. Sampling and variance 'in measurements of trifluralin disappearance from a field s o i i . p . 25-35. In D.A. Kurtz (ed.) Trace residue analysis: Chemometric estimations of amount uncertainty and error. Am, Chem. SOC. Symposium Series No. 284,

APPENDIX I.
California Department of Fish and Game laboratory methods for analysis of carbofuran in agricultural drain water samples, 1988.

California Department of F i s h and Game laboratory methods for analysis of carbofuran i n agricultural drain water sampl.es, 1988.
The methylene chloride extracts of carbofuran from the water samples were dried w i t h granular sodium sulfate to near dryness. Petroleum ether was added and the methylene chloride was evaporated. The petroleum ether concentrate was adjusted to a suitable volume for analysis u s i n g a Varian Aerograph Model 3700 gas chromatograph w i t h the fol.lowing conditions:
Column: 6% U L - 1 , length: 183 cm I.D. : 2mm Detector Temperature: 25OoC Injector Temperature: 2 1 O o C Column Temperature : 15OoC Carrier Gas: N2 Carrier Flow: 40 ml/min Detector : TSD Detection L i m i t : 1 pg/liter carbofuran
1-1

APPENDIX 11.
Split sample results for carbofuran in rice paddy soil and water.

Split sample results f o r carbofuran in rice paddy soil and water from California Analytical Laboratories (CAL) (primary l a b o r a t o r y ) and the California Department of Food and Agriculture (CDFA) laboratory (quality control laboratory).
Soil (mg k g - ’ )
Difference C AL CDFA CAL-CDFA
0.72 0.63 0.09 0.41 0.47 -0.06 0.24 0.24 0.00 0.27 0.23 0.04 0.34 0.34 0.00 0.22 0.21 0.01
Difference CAL CDFA CAL-CDFA
12.6 8.3
10.2 7 . 6 5.8 4.7 8.3 9.0 1.4 2.5 1.4
14.3 6 .4 8.8 3.7 2.2 2.5 1.2 2.8 0.2 1.3 0.4
-1 .7 1.9 ’ .4 3.9 3.6 2.2 7.: 6.2 1.2 1.2 1 . O
~- ~~ ~ ~~ ~ ~
Results for Paired t-Tests of carbofuran soil and water samples. a
No. of Observations Mean Standard Error t Prob. > It1
6 11
0.014 (mg kg- ’ ) 2.6 (pg L-1 )
0.019 (mg k g - ? ) 0 . 8 (pg L-‘) 0.720 3.4 0.504 0.01
a Test conducted using SAS Means procedure. SAS Procedures Guide. 1988. SAS Institute, Cary, NC.
11-1

APPENDIX 111.
Part A . Data for calculations of water volume released and carbofuran mass discharged from r ice f ie lds i n Colusa and Glenn Counties, CA, 1988.
Part B . Daily volume of water released, percent of t o t a l volume released, daily mass of carbofuran discharged and percent of t o t a l mass discharged f o r three r ice f ie lds i n Colusa and Glenn Counties, CA, 1988.

Part A . Data for calculations of water volume released and carbofuran mass discharged from rice fields in Colusa and Glenn Counties, CA, 1988. Water volume released ( L ) was the product of flow rate ( L / , h ) and period of runoff (h). Carbofuran mass discharged (kg) was the product of water volume (L) and concentration (kg/L). Concentrations below the detection limit (0.5 X 1E-9 kg/L) were assumed to equal 0 . 4 X 1E-9 kg/L.
Days Runoff Period Water Carbofuran Carbofuran Sample After Flow of Vo 1 ume Concentra- Mass Date Flood- Rate Runoff Released t i o n Discharged 1988 ing ( L/h 1 ( h ) ( L ) ( kg/L 1 (kg)
4 - 26 4 - 26 5 - 09 5 - 09 5 - 22 5 - 22 5 - 23 5 - 23 5 - 23 5 - 24 5 - 24 5 - 24 5 - 25 5 - 25 5 - 28 5 - 28 5 - 29 5 - 29 5 - 29 5 - 30 5 - 30 5 - 30 5 - 31 5 - 31 5 - 31 5 - 31 6 - 01 6 - 01 6 - 01 6 - 02 6 - 04 6 - 05 6 - 05 6 - 05 6 - 05 6 - 05 6 - 06 6 - 06 6 - 06
0 0
13 13 26 26 27 27 27 28 28 28 29 29 32 32 33 33 33 34 34 34 35 35 35 35 36 36 36 37 39 40 40 40 40 40 41 41 41
135581.32 13.00 1762557.12 .0000000037 .0065215 45873.38 7.00 321113.65 .0000000072 .0023120
128445.46 4.25 545893.20 .0000000052 .0028386 128445.46 1.50 192668.19 .0000000034 .0006551 23446.39 3.00 70339.18 .0000000211 .0014842 23446.39 7.50 175847.95 .0000000139 .0024443 16310.53 2.25 36698.70 .0000000139 .0005101 16310.53 12.25 199804.05 .0000000096 ,0019181 16310.53 9.50 154950.08 .0000000167 .0025877 16310 53 2.50 40776.34 .0000000167 .0006810 16310.53 12.00 195726.41 .0000000084 .0016441 16310.53 9.50 154950.08 .0000000139 .0021538 16310.53 2.25 36698.70 .0000000139 .0005101 6116.45 10.75 65751.84 .0000000142 .0009337
97863.21 6.25 611645.04 .0000000124 .0075844 97863.21 9.75 954166.26 .0000000023 .0021946 16310.53 2.50 40776.34 .0000000023 .0000938 16310.53 12.00 195726.41 .0000000026 .0005089 16310.53 9.50 154950.08 .0000000032 .0004958 19368.76 2.75 53264.09 .0000000032 .0001704 19368.76 12.00 232425.12 .0000000016 .0003719 19368.76 9.25 179161.03 .0000000026 .0004658 13252.31 2.50 33130.77 .0000000026 .0000861 13252.31 12.00 159027.71 .0000000033 .0005248 13252.31 3.00 39756.93 .0000000043 .0001710 45873.38 6.50 298176.96 .0000000043 .0012822 16310.53 2.50 40776.34 .0000000043 .0001753 16310.53 12.25 199804.05 .0000000023 .0004595 16310.53 9.25 150872.44 .0000000026 ,0003923 6116.45 10.00 61164.50 .0000000026 .0001590 8155.27 10.00 81552.67 .0000000029 .0002365
25485.21 3.25 82826.93 .0000000029 .0002402 25485.21 6.75 172025.17 .0000000024 .0004129 74416.81 5.50 409292.47 .0000000024 .0009823 74416.81 5.00 372084.07 .0000000009 .0003349
125387.23 3.50 438855.32 .0000000009 .0003950 161066.53 3.50 563732.85 .0000000009 .0005074 161066.53 18.25 2939464.12 .0000000004 .0011758 161066.53 2.25 362399.69 . 0000000005 .0001812
111-1

Sample Date 1988
6 - 07 6 - 07 6 - 08 6 - 08 6 - 09 6 - 09 6 - 10 6 - 10 6 - 11 6 - 11 6 - 12 6 - 12 6 - 13 6 - 13 6 - 14 6 - 14 6 - 15 6 - 15 6 - 15 6 - 16 6 - 16 6 - 17 6 - 17 6 - 18 6 - 18 6 - 19 6 - 20 6 - 20 6 - 21 6 - 21 6 - 22 6 - 22 6 - 23 6 - 23 6 - 24 6 - 24 6 - 25 6 - 25 6 - 26 6 - 26 6 - 27 6 - 28 6 - 28 6 - 29 6 - 30 7 - 01
Days Runoff After Flow
Flood- Rate i ng
42 42 43 43 44 44 45 45 46 46 47 47 48 48 49 49 50 50 50 51 51 52 52 53 53 54 55 55 56 56 57 57 58 58 59 59 60 60 61 61 62 63 63 64 65 66
( L/h 1
161066 53 161066.53 133542.50 133542.50 133542.50 133542.50 150872.44 150872.44 149853.03 149853.03 124367.82 124367.82 87669.12 87669.12 70339.18 70339.18 70339.18 22426.98 22426.98 16310.53 16310.53 8155.27 8155.27
15291.13 15291.13 2038.82 1019.41 1019.41 6116.45 6116.45
19368.76 19368.76 49951.01 49951.01 93785.57 93785.57
127426.05 127426.05 118251.37 118251.37 101940.84 101940.84 101940.84 101940.84 101940.84 110096.11
Period of
Runoff (h)
21.75 2.25
22.25 1.75
23.25 0.75
23.75 0.25
22.50 1.50
22.75 1.25
22.25 1.75
21.75 2.25 8.00
13.50 2.50
21.75 2.25
21.50 2.50
21.25 2.75
24.00 9.50
.14.50 21.75 2.25
22.25 1.75
22.25 1.75
22.50 1.50
22.25 1.75
22.00 2.00
24.00 23.00 1.00
24.00 24.00 24.00
water Vo 1 ume Released
(L)
3503196.97 362399.69
2971320.63 233699.38
3104863.13 100156.88
3583220.53 37718.11
3371693.28 224779.55
2829368.01 155459.78
1950637.97 153420.96
1529877.16 158263.15 562713.44 302764.29 56067.46
354754.12 36698.70
175338.24 20388.17
324936.43 42050.60 48931.60 9684.38
14781.42 133032.80 13762.01
430954.90 33895.33
1111410.01 87414.27
2110175.39 140678.36
2835229.61 222995.59
2601530.24 236502.75
2446580.16 2344639.32 101940.84
2446580.16 2446580.16 2642306.57
Carbofuran Concentra-
t ion ( kg/L)
.0000000005
.0000000005
. 0 0 0 0 0 0 0 0 0 5
. 0 0 0 0 0 0 0 0 0 8
.0000000008
.0000000004
.0000000004
.0000000004
.0000000004
.0000000004
.0000000004
.0000000009
.0000000009
.0000000004
.0000000004
.0000000008
. 0000000008
.0000000008
.0000000017
.0000000017
.0000000022
.0000000022
.0000000054
.0000000054
.0000000041
.0000000041
.0000000041
.0000000048
.0000000048 ,0000000020 .0000000020 .0000000021 .0000000021 .0000000011 .0000000011 .0000000007 .0000000007 .0000000006 .0000000006 .0000000010 .0000000010 .0000000010 .0000000006 .0000000006 .00000000G6 .0000000006
Carbofuran Mass
Discharged ( k g )
.0017516
.0001812
.0014857
.0001870 ,0024839 ,0000401 .0014333 .0000151 .0013487 .0000899 .0011317 .0001399 .0017556 .0000614 .0006120 .0001266 .0004502 .0002422 ,0000953 .0006031 ,0000807 .0003857 ,0001101 .0017547 .0001724 .0002006 .0000397 .0000710 .0006386 .0000275 .0008619 .0000712 .0023340 .0000962 .0023212 .0000985 .0019847 .0001338 .0015609 .0002365 .0024466 .0023446 .0000612 .0014679 .0014679 .0015854
111-2

7 - 02 7 - 02 7 - 03 7 - 04 7 - 05 7 - 06 7 - 06 7 - 07
67 117231.97 22.75 67 117231.97 1.25 68 118251.37 24.00 69 127426.05 24.00 70 135581.32 24.00 71 142717.18 10.00 71 142717.18 14.00 72 150872.44 24.00
2667027.23 . 0 0 0 0 0 0 0 0 1 146539.96 . 0 0 0 0 0 0 0 0 1 2838032.99 ,000000001 3058225.20 . 0 0 0 0 0 0 0 0 1 3253951.61 . 0 0 0 0 0 0 0 0 1 1427171.76 . 0 0 0 0 0 0 0 0 1 1998040.46 . 0 0 0 0 0 0 0 0 1 3620938.64 . 0 0 0 0 0 0 0 0 1
.0016002
. 0 0 0 0 7 3 3
.0014190
.0015291
.0016270
.0007136 ,0019980 ,0036209
Days Runoff Period Water Carbofuran Carbofuran Sample After Flow of Vo 1 ume Concentra- Mass
Date Flood- Rate Runoff Released t ion Discharged 1988 i ng ( L / h 1 (h1 (L) ( kg/L 1 ( k g )
4 - 18 4 - 18 4 - 18 4 - 18 4 - 19 4 - 19 4 - 19 4 - 19 4 - 19 4 - 20 4 - 20 4 - 20 4 - 20 4 - 21 4 - 21 4 - 21 4 - 21 4 - 22 4 - 22 4 - 22 4 - 22 4 - 23 4 - 23 4 - 23 4 - 23
0 0 0 0 1 1 1 1 1 2 2 2 2 3 3 3 3 4 4 4 4 5 5 5 5
16310.53 11.00 179415.88 .0000000052 63203.32 1.75 110605.81 .0000000052 63203.32 6.25 395020.76 .0000000213 63203.32 5.00 316016.60 .0000000067 133542.50 4.75 634326.88 .0000000067 133542.50 7.25 968183.13 .0000000085 175338.24 3.25 569849.30 .0000000085 175338.24 4.50 789022.10 .0000000068 175338.24 4.25 745187.54 .0000000060 153930.67 5.00 769653.34 .0000000060 153930.67 8.50 1308410.68 .0000000085 153930.67 4 . 0 0 615722.67 .0000000077 153930.67 6.50 1000549.34 .0000000088 56067.46 2.25 126151.79 .0000000088 56067.46 10.50 588708.35 .0000000059 56067.46 5.50 308371.04 .0000000068 56067.46 5.75 322387.91 .0000000071 56067.46 2.75 154185.52 .0000000071 56067.46 9.25 518624.02 .0000000065 56067.46 5.00 280337.31 .0000000099 56067.46 7.00 392472.23 .0000000073 73397.40 2.50 183493.51 .0000000073 73397.40 10.00 733974.05 .0000000066 73397.40 5.00 366987.02 .0000000060 73397.40 6.50 477083.13 .0000000067
0.000933 0.000575 0.008414 0.002117 0.004250 0.008230 0.004844 0.005365 0.004471 0.004618 0.011121 0.004741 0.008805 0.001110 0.003473 0.002097 0.002289 0.001095 0.003371 0.002775 0.002865 0.001340 0.004844 0.002202 0.003196
111-3

Sample Date 1988
4 - 24 4 - 24 4 - 24 4 - 24 4 - 25 4 - 25 4 - 25 4 - 25 4 - 26 4 - 26 4 - 26 4 - 26 4 - 26 4 - 27 4 - 27 4 - 27 4 - 27 4 - 28 5 - 11 5 - 11 5 - 12 5 - 12 5 - 12 5 - 12 5 - 13 5 - 13 5 - 13 5 - 14 5 - 14 5 - 14 5 - 15 5 - 15 5 - 18 5 - 18 5 - 18 5 - 19 5 - 19 5 - 19 5 - 20 5 - 20 5 - 20 5 - 21
Days After Flood-
i ng
6 6 6 6 7 7 7 7 8 8 8 8 8 9 9 9 9 10 23 23 24 24 24 24 25 25 25 26 26 26 27 27 30 30 30 31 31 31 32 32 32 33
Runoff Flow Rate
( L/h 1
91746.76 91746.76 91746.76 91746.76 91746.76 91746.76 91746.76 91746.76 91746.76 91746.76 14271.72 14271.72 14271.72 22426.98 22426.98 22426.98 22426.98 22426.98 94804.98 94804.98 94804.98 94804.98 152911.26 152911.26 104999.07 104999.07 104999.07 87669.12 87669.12 87669.12 18349.35 18349.35 10194.08 10194.08 26504.62 41795.74 41795.74 41795.74 55048.05 55048.05 55048.05 94804.98
(continued)
Period of
Runoff ( h )
2.25 9.75 5.25 6.75 3.25 8.75 4.75 7.25 3.00 4.50 5.50 4.75 6.25 3.00 9.00 4.25 7.75 8.50 7.50
10.00 2.25 5.75 6.25 9.75 2.00 12.00 10.00 2.25 12.25 9.50 2.75 9.25 4.25 2.75 4 .OO 2.75 11.75 9.50 2.75 11.75 9.50 2.25
Water Volume Released
(L)
206430.20 894530.87 481670.47 619290.60 298176.96 802784.11 435797.09 665163.98 275240.27 412860.40 78494.45 67790.66 89198.24 67280.95 201842.86 95314.69 173809.13 190629.37 711037.36 948049.81 213311.21 545128.64 955695.38 1490884.78 209998.13 1259988.78 1049990.65 197255.53 1073946.75 832856.66 50460.72 169731.50 43324.86 28033.73 106018.47 114938.30 491l00.00 397059.57 151382.15 646814.63 522956.51 213311.21
Carbofuran Concentra-
t ion ( kg/L 1
.0000000067
.0000000054
. 0 0 0 0 0 0 0 0 5 1
.0000000048 ,0000000048 .0000000055 .0000000030 .0000000032 .0000000032 .0000000049 .0000000049 . 0 0 0 0 0 0 0 0 3 0 .0000000044 . 0 0 0 0 0 0 0 0 4 4 .0000000043 .0000000044 .0000000057 .0000000057 .0000000164 .0000000147 . 0 0 0 0 0 0 0 1 4 7 .0000000114 .0000000114 .0000000328 .0000000328 .0000000256 .0000000300 .0000000300 .0000000328 .0000000187 .0000000187 .0000000142 .0000000121 .0000000041 .0000000041 .0000000041 .0000000048 .0000000045 .0000000045 .0000000017 .0000000027 .0000000027
Carbofuran Mass
Discharged ( k g )
0.001383 0.004830 0.002457 0 . 0 0 2 9 7 3 0.001431 0.004415 0.001307 0.002129 0.000881 0.002023 0.000385 0.000203 0.000392 0.000296 0.000868 0.000419 0.000991 0.001087 0.011661 0.013936 0.003136 0.006214 0.010895 0.048901 0.006888 0.032256 0.031500 0.005918 0.035225 0.015574 0.000944 0.002410 0.000524 0.000115 0.000435 0.000471 0.002357 0.001787 0.000681 0.001100 0.001412 0.000576
1114

(continued)
Sample Date 1988
5 - 21 5 - 21 5 - 22 5 - 22 5 - 22 5 - 23 5 - 23 5 - 23 5 - 24 5 - 24 5 - 24 5 - 25 5 - 25 5 - 25 5 - 26 5 - 27 5 - 30 5 - 30 5 - 31 5 - 31 6 - 01 6 - 01 6 - 02 6 - 02 6 - 03 6 - 03 6 - 04 6 - 04 6 - 05 6 - 05 6 - 06 6 - 06 6 - 07 6 - 07 6 - 08 6 - 08 6 - 09 6 - 10 6 - 10 6 - 11 6 - 11 6 - 12
Days Runoff Af ter Flow
Flood- Rate i ng
33 33 34 34 34 35 35 35 36 36 36 37 37 37 38 39 42 42 43 43 44 44 45 45 46 46 47 47 48 4 8 49 49 50 50 51 51 52 53 53 54 54 55
( L / h 1
94804.98 94804.98 106018.47 106018.47 106018 47 106018.47 106018.47 106018.47 106018.47 106018.47 106018.47 94804.98 94804.98 94804.98 72378.00 45873.38 8155.27 8155.27 22426.98 22426.98 61164.50 61164.50 94804.98 94804.98 100921.43 100921.43 97863.21 97863.21 66261.55 66261.55 66261.55 66261.55 78494.45 78494.45 87669.12 87669.12 81552.67 87669.12 87669.12 81552.67 81552.67 81552.67
P e r i o d of
Runoff ( h )
12.25 9.50 2.25 12.00 9.75 2.25 12.00 9.75 2.50 12.25 9.25 2.25 17.75 4.00 24.00 8.00 12 .oo 3.00 20.75 3.25
21.00 3.00 21.25 2.75 21.75 2.25 22.25 1.75 22.50 1.50 21.75 2.25 21.75 2.25 23.00 1.00 24.00 23.25 0.75 22.50 1.50 22.00
Water Volume
Released (L)
1161361.02 900647.32 238541.57 1272221.68 1033680.12 238541.57 1272221.68 1033680.12 265046.15 1298726.30
213311.21 1682788.42 379219.92 1737071.91 366987.02 97863.21 24465.80 465359.93 72887.70
1284454.58 183493.51 2014605.85 260713.70 2195041.14 227073.22 2177456.34 171260.61 1490884.78 99392.32
1441188.63 149088 48 1707254.22 176612.51 2016389.82 87669.12
1957264.13 2038307.10 65751.84
1834935.12 122329.01 1794158.78
9130670.88
C a r b o f u r a n Concentra-
t ion ( kg/L)
.0000000024
. 0 0 0 0 0 0 0 0 3 9
.00000000?9
.0000000027
.0000000019
.0000000019
.0000000013
.0000000032
.00000000?2
.0000000014
.0000000014
.0000000014
.0000000015
.0000000012
.0000000012
.0000000012
. 0 0 0 0 0 0 0 0 5 0
.0000000013
.0000000013
. 0000000014
. 0 0 0 0 0 0 0 0 1 4
.0000000010
.0000000010
.0000000012
.0000000012
.0000000016
.0000000016
.0000000014
.0000000014
.0000000013
.0000000013
.0000000008
.0000000008
.0000000006
.0000000006
.0000000010
.0000000010
.0000000006
.0000000004
.0000000004
.0000000004
.0000000004
C a r b o f u r a n Mass
Discharged ( k g )
.002787?
.0035125 ,0009303 . r3034350 .0019640 .0004532 .0016539 .0033078 .0008481 ,0018182 .0013729 .0002986 .0025242 .0004551 .0020845 .0004404 .0004893 .0000318 .0006050 .0001020 .0017982 .0001835 .0020146 .0003129 ,0026340 .0003633 .0034839 .0002398 .0020872 .0001292 .0018735 .0001193 .0013658 .0001060 .0012098 .0000877 .0019573 .0012230 .0000263 .0007340 .0000489 .0007177
111-5

Sample Date 1988
6 - 12 6 - 13 6 - 13 6 - 14 6 - 15 6 - 15 6 - 16 6 - 17 6 - 18 6 - 18 6 - 19 6 - 20 6 - 21 6 - 21 6 - 22 6 - 23 6 - 24 6 - 25 6 - 25 6 - 26 6 - 27 6 - 28 6 - 28 6 - 29 6 - 30 7 - 01 7 - 02 7 - 03 7 - 03 7 - 04 7 - 05 7 - 06 7 - 07
Days After Flood-
i ng
55 55 55 57 58 58 59 60 61 61 62 63 64 64 65 66 67 68 68 69 70 71 71 72 73 74 75 76 76 77 7 8 79 8 0
Runoff Flow Rate
( L/h 1
81552.67 66261 55 66261.55 48931. GO 48931.60 48931.60
38737.52 22426.98 22426.98 22426.98 38737.52 38737.52 38737.52 35679.29 35679.29 38737.52 43834.56 43834.56 48931.60 51989.83 43834.56 43834.56 40776.34 31601.66 43834.56 54028.65 69319.77 69319.77 81552.67 87669.12 87669.12 87669.12
54028.65
P e r i o d of
Runoff ( h )
2 .oo 21.75 2.25 24.00 9.75 14.25 24.00 24.00 10.00 14 00 24.00 24.00 22.00 2.00 24.00 24.00 24.00 10.75 13.25 24.00 24.00 23.50 0.50 24.00 24.00 24.00 24.00 23.00 1.00 24.00 24.00 24.00 24.00
Water Volume
Released (L)
163105.34 1441188.63 149088.48 11743S8.48 477083.13 697275.35 1296687.48 929700.46 224269.85 313977.79 538247.64 929700.46 852225.42 77475.04 856303.06 856303.06 929700.46 471221.53 580807.94 1174358.48 1247755.88 1030112.19 21917.28 978632.06 758439.85 1052029.47 1296687.48 1594354.74 69319.77
1957264.13 2104058.94 2104058.94 2104058.94
Carbofuran Concentra-
t ion ( kg/5 1
. 0 0 0 0 0 0 0 0 0 c
. 0 0 0 0 0 0 0 0 0 4
. 0 0 0 0 0 0 0 0 0 4
.000000000~
. 0 0 0 0 0 0 0 0 0 4
. 0 0 0 0 0 0 0 0 0 7
. 0 0 0 0 0 0 0 0 0 7
.0000000007
.0000000007
.0000000015
.0000000015
.0000000015
.0000000015
. 0 0 0 0 0 0 0 0 1 0
.0000000010
. 0 0 0 0 0 0 0 0 1 0
. 0 0 0 0 0 0 0 0 1 0
.0000000010
.0000000014
. 0000000014
.0000000014
.0000000014
.0000000016
.0000000016
.0000000016
.0000000016
.0000000016
.0000000016
.0000000006
.0000000006
.0000000006
.0000000006
. 0 0 0 0 0 0 0 0 0 6
Carbofuran 'a s s
3ischarged ( k g )
.00006S2
.0005765
. 0 0 0 0 5 9 6
.000469-1
.0001908
.0004881
.0009077
.0006508
.0001570
.0004710
.0008074
.0013946
.0012783
.0000775
.0008563
.0008563
.0009297
.0004712
.0008131
.0016441
.0017469
.0014422
.0000351
.0015658
.0012135
.0016832
.0020747 ,0025510 .0000416 .0011744 .0012624 .0012624 .0012624
111-6

Sample Date 1988
4 - 19 4 - 19 4 - 20 4 - 20 4 - 20 4 - 20 4 - 21 4 - 21 4 - 21 4 - 21 4 - 22 4 - 22 4 - 22 4 - 22 4 - 23 4 - 23 4 - 23 4 - 23 4 - 24 4 - 24 4 - 24 4 - 24 4 - 25 4 - 25 4 - 25 4 - 25 4 - 26 4 - 26 4 - 26 4 - 26 4 - 27 4 - 27 4 - 27 4 - 27 4 - 28 4 - 28 4 - 28 4 - 28 4 - 29 5 - 18 5 - 19 5 - 19 5 - 19
Days Runoff After Flow Flood- Rate
i ng
1 1 2 2 2 2 3 3 3 3 4 4 4 4 5 5 5 5 6 6 6 6 7 7 7 7 8 8 8 8 9 9 9 9
10 10 10 10 11 30 31 31 31
(L/h 1
50970.42 50970.42 71358.59 71358.59 71358.59 71358.59 91746.76 91746.76 91746.76 91746.76 98882.61 98882.61 98882.61 98882.61 117231.97 117231.97 117231.97 117231.97 107037.88 107037.88 107037.88 107037.88 83591.49 83591.49 83591.49 83591.49 62183.91 62183.91
62183.91 60145.10 60145.10 60145.10 60145.10 47912.19 47912.19 47912.19 47912.19 12232.90 273201.45 244658.02 244658.02 244658.02
62183.91
Period of
Runoff ( h )
2.00 4.50 3.75 9.50 4.50 6.25 2.50 8.75 5.20 7.25 2.75
10.50 4.75 6.00 2.50 9.50 5.00 7 .OO 2.00 9.50 5.25 7.25 2.00 9.75 5.75 6.50 2.50 9.50 5.25 6.75 2.00 8.75 4.75 8.50 1.50 10.00 4.25 8.25 6.00 7.50 2.00 11.75 10.25
Water Volume Released
(L)
101.940.84 229366.89 267594.71 677906.59 321113.65 445991.17 229366.89 802784.11 477083.13 665163.98 271927.19 1-038267.46 469692.42 593295.69 293079.91 1.113703.68 586159.83 820623.76 214075.76 1.016859.88 561948.88 776024.64 167182.98
480651.06 543344.68 155459.78 590747.17 326465.54 419741.41 120290.19 526269.59 285689.20 511233.31 71868.29 479121.95 203626.83 395275.61 73397.40
2049010.88 489316.03 2874731.69 2507744.66
815017.02
Carbofuran Concencra-
t ion ( k g / L 1
. 0 0 0 0 0 0 0 2 7 1
. 0 0 0 0 0 0 0 2 0 9
. 0 0 0 0 0 0 0 2 0 9
. 0 0 0 0 0 0 0 2 3 0
.0000000106
.0000000089
.0000000089
.0000000148
.0000000062
.0000000080
.0000000080
.0000000163
.0000000152
.0000000162
.0000000162
.000000014G
. 0 0 0 0 0 0 0 1 3 2
.0000000140
.0000000140
.0000000089
.0000000059
.0000000064
.0000000064
.0000000109
.0000000102
.0000000069
.0000000069
.0000000058
.0000000088
.0000000095
.0000000095
.0000000070
.0000000052
.0000000032
.0000000032
.0000000058
.0000000075
.0000000070
.0000000070
.0000000073
.0000000073
.0000000060
.0000000052
Carbofurdn Mass
Discharged ( k g )
0.002763 0.004794 0.005593 0.015592 0.003404 0.003969 0.002041 0.011881 0.002958 0.005321 0.002175 0.016924 0.007139 0.009611 0.004748 0.016260 0.007737 0.011489 0.002997 0.009050 0.003315 0.004967 0.001070 0.008884 0.004903 0.003749 0.001073, 0.003426 0.002873 0.003988 0.001143 0.003684 0.001486 0.001636 0.000230 0.002779 0.001527 0.002767 0.000514 0.014958 0.003572 0.017248 0.013040

Sample Date 1988
5 - 20 5 - 20 5 - 20 5 - 20 5 - 20 5 - 21 5 - 21 5 - 21 5 - 21 5 - 22 5 - 22 5 - 22 5 - 22 5 - 23 5 - 23 5 - 23 5 - 23 5 - 24 5 - 24 5 - 24 5 - 24 5 - 24 5 - 25 5 - 25 5 - 25 5 - 25 5 - 26 5 - 26 5 - 26 5 - 26 5 - 27 5 - 27 5 - 27 5 - 28 5 - 28 5 - 28 5 - 28 5 - 28 5 - 29 5 - 29 5 - 29 5 - 29
Days After
i ng
32 32 32 32 32 33 33 33 33 34 34 34 34 35 35 35 35 36 36 36 36 36 37 37 37 37 38 38 38 38 39 39 39 40 40 40 40 40 41 41 41 41
Flood-
Runoff Flow Rate
( L/h 1
244658.02 244658.02 466889.05 466889.05 411840.99 383297.56 383297.56 370045.25 370045 25 383297.56 383297.56 28543.44 28543.44 69319.77 69319.77 99902.02 99902.02 116212.56 116212.56 181454.70 181454.70 175338.24 155969.49 155969.49 155969.49 155969.49 155969.49 155969.49 202862.27 202862.27 146794.81 146794.81 146794.81 146794.81 146794.81 937855.73 937855.73 993923.19 830817.85 830817.85 705430.61 705430.61
Period of
Runoff ( h )
2.00 5.00 7.50 1.00 8.50 2.25 9.75 2.00 10.00 1.75 5.25 6.25 10.75 1.25 10.75 1.50 10.50 1.75 6.25 6.50 2.50 7.00 3.25 4.75 7.00 9.00 3.00 5.50 6.75 8.75 3.25 11.75 9.00 3.00 5.50 6.50 2.50 6.50 2.25 9.75 8.00 4.00
Water Volume Released
(L)
489316.03 1223290.08 3501667.85 466889.05 3500648.45 862419.51 3737151.19 740090.50 3700452.49 670770.73 2012312.18 178396.47 306841.93 86649.71 745187.54 149853.03 1048971.24 203371.98 726328.48 1179455.52 453636.74 1227367.71 506900.83 740855.05 1091786.40 1403725.37 467908.46 857832.17 1369320.33 1775044.88 477083.13 1724839.01 1321153.29 440384.43 807371.45 6096062.23 2344639.32 6460500.73 1869340.15 8100474.00 5643444.90 2821722.45
Carbofuran Concentra-
t ion ( k g / L 1
.0000000052
.0000000063
.0000000063
. 0 0 0 0 0 0 0 0 6 2
.0000000062
.0000000062
.0000000053
.0000000053
.0000000087
.0000000087
.0000000068
.0000000068
.0000000053
.0000000053
.0000000045
. 0 0 0 0 0 0 0 0 4 5
. 0 0 0 0 0 0 0 0 5 5
.0000000055
.0000000066
.0000000066
.0000000050
. 0 0 0 0 0 0 0 0 5 0
.0000000050
.0000000035
.0000000035
.0000000050
.0000000050
.0000000028
.0000000028
.0000000037
.0000000037
.0000000021
.0000000029
.0000000029
.0000000037
.0000000037
.0000000014
.0000000014
.0000000014
. 0000000010
.0000000010
.0000000021
Carbofuran Mass
Discharged ( k g )
0.002544 0,007707 0.022061 0.002895 0.021704 0.005347 0.019807 0.003922 0.032194 0.005836 0.013684 0.001213 0.001626 0.000459 0.003353 0.000674 0.005769 0.001119 0.004794 0.007784 0.002268 0.006137 0.002535 0.002593 0.003821 0.007019 0.002340 0. @O2402 0.003834 0.006568 0.001765 0.003622 0.003831 0.001277 0.002987 0.022555 0.003282 0.009045 0.002617 0.008100 0.005643 0.005926
111-8

Sample Date 1988
5 - 30 5 - 30 5 - 30 5 - 31 6 - 03 6 - 04 6 - 04 6 - 04 6 - 04 6 - 05 6 - 05 6 - 06 6 - 0 6 6 - 06 6 - 07 6 - 07 6 - 08 6 - 08 6 - 09 6 - 09 6 - 10 6 - 10 6 - 11
Days After Flood-
i n g
42 42 42 43 46 47 47 47 47 48 48 49 49 49 50 50 51 51 52 52 53 53 54
Runoff Flow Rate
( L / h 1
575965.75 496451.89 496451.89 162085.94 28543.44 69319.77 69319.77 88688.53 88688.53 97863.21 97863.21 97863.21 297667.25 297667.25 308880.75 308880.75 286453.76 286453.76 223250.44 223250 -44 190629.37 190629.37 190629.37
Period of
Runoff ( h )
7.50 12.50 4.00 17.00 7.50 2.25 5.75 14.75 1.25 23.75 0.25 9.00 13.75 1.25 21.75 2.25 21.75 2.25 22.50 1.50 22.50 1.50 15.00
Water Vo 1 ume Released
(L)
4319743.09 6205648.63 1985807.56 2755460.91 214075.76 155969.49 398588.68 1308155.83 110860.66 2324251.15 24465.80 880768.86 4092924.73 372084.07 6718156.21 694981.68 6230369.29 644520.96 5023134.89 334875.66 4289160.84 285944.06 2859440.56
Carbofurac Concentre-
t ion ( kg/5 1
.0000000021
.0000000021
.0000000029
.0000000029
. 0 0 0 0 0 0 0 0 3 ?
. 0 0 0 0 0 0 0 0 3 3
. 0 0 0 0 0 0 0 0 2 1
. 0 0 0 0 0 0 0 0 2 1
.0000000011
. 0 0 0 0 0 0 0 0 1 1 , 0 0 0 0 0 0 0 0 1 0 ,0000000010 . 0 0 0 0 0 0 0 0 1 0 .0000000008 .0000000008 .0000000008 ,0000000008 .0000000016 .0000000016 .0000000007 .0000000007 . 0000000010 .0000000010
Carbofuran .v.a s s
Discharged (kg)
O.OO9O7I. 0.013032 0.005759 0.007991 0.000706 0.000515 0.000837 0.002747 0.000122 0.002557 0.000024 0.000881 0.004093 0.000298 0.005375 0.000556 0.004984 0.001031 0.008037 0.000234 0.003002 0.000286 0.002859
111-9

Part B. Daily volume of water released, percent of total volume released, daily mass of carbofuran discharged and percent of total mass discharged for three rice fields in Colusa and Glenn Counties, CA, 1988.
+
05 - 23 127 1 391452.83 I 0.491 0.005015901 5.22
06 - 02 137 I 61164.50 1 0.081 0.00015903] 0.17
06 - 07 142 I 3865596.65 I 4.811 0.001932801 2.01
06 - 08 143 I 3205020.01 I 3.991 0.001672621 1.74

111-1 1

2838032.99
I
3.53 0.00179742 1.87
111-1 2

111-1 3

Carbofuran Mass 1 Runoff Water Volume 1 Discharged
05 - 3 1 143 I 538247.64 I 0.541 0.000707011 0.16
06 - 0 1 144 1 1467948.10 I 1.471 0 .001981731 0 .45
0 6 - 05 ( 4 8 I 1590277.10 I 1.591 0 .00221645[ 0 .5c
0 6 - 06 149 I 1590277.10 I 1,591 0.001992821 0 .45
111-1 4

I
06 - 1 2 155 I 1957264 .131 1 .961 0 .000782911 0 .18
111-1 5

929700.461
I
i 0.93 0 . 0 0 0 9 2 9 7 0 0.21
07 - 0 1 174 I 1052029.47 I 1.051 0.001683251 0.38
111-1 6
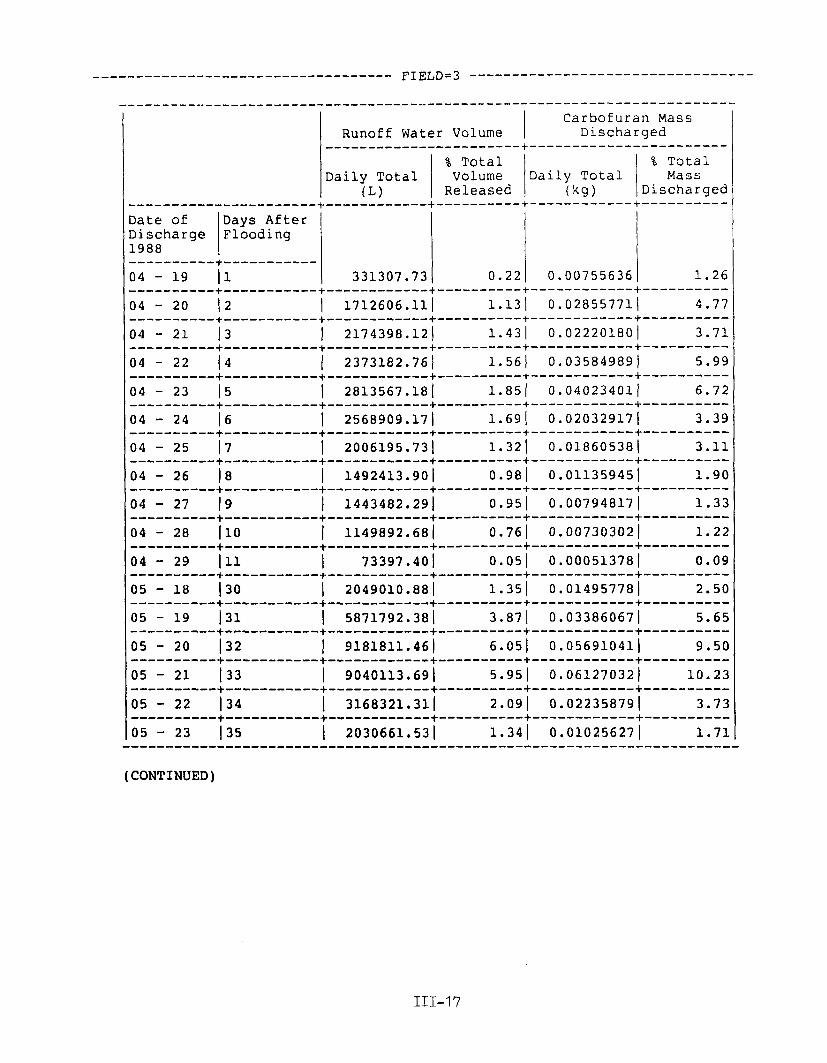
.+
331307.73
% Total % T o t a l
Released Discharged 1 Mass
0.22 0.00755636 1.26
111-1 7

Date of Days After Discharge Flooding 1 9 8 8
0 5 - 2 4 I 3 6 3 7 9 0 1 6 0 . 4 3 ----------+-----------
3 .69
105 - 3 1 143 I 2755460.91 I 1 .811 0 .007990841 1 .33
( 0 6 - 0 8 1 5 1 I 6874890.25 I 4 . 5 3 1 0 . 0 0 6 0 1 5 5 3 j 1.oc
111-1 8

APPENDIX IV.
Concentrations of carbofuran in runoff water from three sugar beet f i e lds , Colusa County, C A , 1988.

Standard F i e l d Date Time Samp1.e 1 Sample 2 Average Deviation
ug L - l
4 5/25/88 0630 28.1 44 .7 1045 24.0 30.1 1230 4 1 . 9 2 1 . 6
5/26/88 0630 1 7 . 6 14 .7 1035 13.0 11.8 24.8
5 5/27/88 0730 0 .8 0.8 1245 3.6 3.0 1820 1.8 1.9
5/28/88 07 15 ND ND 1240 ND ND 1840 ND ND 1.2
11.6
1 . 1
6 6/4/88 1 goo 117.0 118.0 6/5/88 0800 63.0 80.2
1250 177.0 200.0 1845 188.0 184 .O
6/6/88 0720 112.0 103.0 134.2 48.9
’ Carbofuran not detected (detection limit 0.5 ug L-’); averages were calculated u s i n g a value of 0 .4 ug L- ’ for N D s .
IV-1
APPENDIX V.
Part A. Calculations of carbofuran potential discharge values for rice fields in Colusa, Glenn and Yolo Counties, CA, 1988.
Part B. Calculations of carbofuran potential discharge values for sugar beet fields in Colusa, Glenn and Yolo Counties, CA, 1988.

Part A. Calculations of carbofuran potential discharge values f o r rice f i e l d s in Colusa, Glenn and Yolo Counties, CA, 1988.
Carbofuran Discharged
Carbofuran Total Carbofuran Applied Applied to Rice
Field from Fielda t o Field in 3 Counties b
1 0.0962 2 0.4448 3 0.5989
5.59 8.24 5.43
7618.62 7618.62 7618.62
CalculationsC
(Fraction of applied carbofuran discharged in runoff water from field x total carbofuran (kg) in 3 counties = potential discharge (kg))
Field 1: (0.0962 kg f 5.59 kg) x (7618.62 kg) = 131.11 kg
Field 2: (0.4448 kg i 8.24 kg) X (7618.62 kg) = 411.25 kg
Field 3: (0.5989 kg + 5.43 kg) X (7618.62 kg) = 840.29 kg
- X 460.88 kg
SD i362.48 kg
a Refer to Appendix I. Data from Agricultural Commissioners in Colusa, Glenn, and Yolo Counties, CA . Refer to Materials and Methods Section for description of calculations.
v-I

Part B. Calculations of carbofuran potential discharge values for suga r beet f i e l d s in Colusa, Glenn and Yolo Counties, CA, 1988.
Total Average Volume of Carbofuran Carbofuran Runoff Applied to Concentration Water Carbofuran Carbofuran Sugar Beet in Runoff Discharged Discharged Applied Fields in
Field Watera from Field from Field' to Field 3 Counties e
4 24.8 14,000,000 0.35 20.64 967.26 5 1.2 40,000,000 0.05 68.04 967.26 6 134.2 97,000,000 13.02 119.75 967.26
Calculations
(Fraction of applied carbofuran discharged in runoff water from field x total carbofuran (kg) in 3 counties = potential discharge (kg))
f
- X 40.76 kg
SD k56.32 kg
a Refer t o Appendix IV. An average volume of water was calculated from measurements of runoff from sugar beet fields (Spencer et al., 1985): Average runoff volume for a single irrigation = 250,000 L ha-'; Assume four irrigations occurred between April and June, 1988 (4 x 250,000 L ha-' = 1,000,000 L h a ' ) . Fields 4, 5 and 6 were 14, 40 and 97 ha, respectively. Carbofuran discharged from sugar beet fields was calculated as the product of C
average concentration in runoff (ug L- ' ) and volume of water discharged (L) , then units were converted from pg to kg. Carbofuran applied to sugar beet fields was estimated from application rates and hectarage information obtained from growers.
e Data from Agricultural Commissioners in Colusa, Glenn, and Yolo Counties, CA Refer to Materials and Methods Section for description of calculations.
v-2

Appendix VI.
Carbofuran concentration and mass in paddy soil and water from three rice fields in Colusa and Glenn Counties, CA, 1988.

Carbofuran concentration and mass in rice paddy soil and u a t e r .
1 0 1 1 0 2 1 0 3 1 1 1 1 1 2 1 1 3 1 2 1 1 2 2 1 2 3 1 3 1 1 3 2 1 3 3 1 6 1 1 6 2 1 6 3 1 8 1 1 8 2 1 8 3 1 12 1 1 12 2 1 12 3 1 16 1 1 16 2 1 16 3 1 20 1 1 20 2 1 20 3 1 24 1 1 24 2 1 24 3 1 28 1 1 28 2 1 28 3 1 36 1 1 36 2 1 36 3 1 44 1 1 44 2 1 44 3 1 52 1 1 52 2 1 52 3 .............................
(Continued)
0.15 0 . 1 6 0 0 2 0.78 0.83210 0.44 0.46939
--C -- -- -- -- --
0.17 0.18136 0.24 0.25603 0.30 0.32004 -- -- -- -- -- -- 0.25 0.26670 0.75 0.80010 0.33 0.35204 -- -- -- -- -- -- 0.43 0.45872 0.38 0.40538 0.70 0.74676 -- -- -- -- -- -- 0.31 0.33071 0.51 0.54407 0.33 0.39472 -- -- -- -- -- -- 0.25 0.26670 0.55 0.58674 0.05 0.05334 0.29 0.30937 0.23 0.24536 0.20 0.21336 0.17 0 18136 0.29 0.30937 0.63 0.67208 0.15 0.16002 0.13 0.13868 0.22 0.23470 .__---------------
12.1 0 .014157 12.1 0 .014157 8.6 O.Ol0062
24.1 0.026992 1 6 . 7 0 . 0 1 8 7 0 4 22.3 0.024976 17.8 0.013350 16.6 0.012450 15.2 0.011400 1 6 . 7 0 .014863 17 .O 0.015130 15.6 0.013884 12.4 0.014632 10.0 0.011800 10.4 0.012272 10.2 0.012546 10.0 0.012300 9.9 0.012177 6.1 0.011224 6.1 0.011224 5.4 0.009936 7.3 0.011023 8.9 0.013439 6.4 0.009664 37.6 0.036848 39.3 0,038514 37.7 0.036946 10.2 0.006936 16.2 0.011016 15.9 0.010812 15.8 0.006952 32.8 0.014432 24.5 0.010780 7.5 0.003150 6.2 0.002604 6.8 0.002856 1.2 0.001476 1.7 0.002091 1.4 0.001722 3.8 0.002470 6.8 0.004420 8.3 0.005395 ....................
VI-I

Days a f t e r Soi 1 Soi 1 Water Water
1 60 1 60 1 60 1 70 1 70 1 70 1 80 1 80 1 80 2 0 2 0 2 0 2 1 2 1 2 1 2 2 2 2 2 2 2 4 2 4 2 4 2 6 2 6 2 6 2 8 2 8 2 8 2 11 2 11 2 11 2 16 2 16 2 16 2 20 2 20 2 20 2 24 2 24 2 24 2 28 2 28 2 28 2 36 2 36 2 36 --------------
(Continued)
1 0.14 0.14935 1.6 0.002256 2 0.23 0.24536 3.0 0.004230 3 0.20 0.21336 2.4 0.003384 1 0.24 0.25603 0.6 0.001044 2 0.21 0.22403 1.2 0.002088 3 0.18 0.19202 1.1 0.001914 1 0.14 0.14935 1.5 0.002160 2 0.14 0.14935 1.4 0.002016 3 0.17 0.18136 0.8 0.001152 1 0.22 0.21458 10.1 0.013231 2 0.75 0.73152 10.5 0.013755 3 0.79 0.77053 8.9 0.011659 1 -- -- 10.2 0.016524 2 -- -- 7.4 0.011988 3 -- -- 8.1 0.013122 1 0.35 0.34138 7.7 0.014861 2 0.43 0.41940 7.6 0.014668 3 0.49 0.47793 7.0 0.013510 1 -- 6.8 0.011764 2 -- -- 6.5 0.011245 3 -- -- 7.6 0.013148 1 0.65 0.63398 3.8 0.006232 2 0.59 0.57546 4.4 0,007216 3 0.65 0.63398 4.5 0.007380 1 -- -- 5.4 0.009180 2 -- -- 4.9 0.008330 3 -- -- 4.4 0.007480 1 0.59 0.57546 6.8 0.009792 2 0.45 0.43891 6.6 0.009504 3 1.10 1.07290 8.0 0.01.1520 1 -- -- 20.8 0.019344 2 -- -- 14.6 0.013578 3 11.1 0.010323 1 0.86 0,83881 7.3 0.009563 2 0.49 0.47793 5.5 0 007205 3 1.06 1.03388 5.1 0.006681 1 8.8 0.012408 2 -- -- 14.7 0.020727 3 -- -- 15.2 0.021432 1 0.36 0.35113 27.8 0.017792 2 0.70 0.68275 21.3 0.013632 3 0.48 0.46817 25.2 0.016128 1 0.05 0.04877 3.0 0 003870 2 0.68 0.66324 3.8 0.004902 3 0.43 0.41940 1.9 0.002451
--
-- --
-- --
....................................................
VI-2

Days a f t e r Soi 1 Soi 1 w a t e r Water
2 2 2 2 2 2 2 2 2 2 2 2 2 2 2 3 3 3 3 3 3 3 3 3 3 3 3 3 3 3 3 3 3 3 3 3 3 3 3 3 3 3 3 3 3 3 3 3
44 44 44 52 52 52 60 60 60 70 70 70 80 80 80 0 0 0 1 1 1 2 2 2 4 4 4 6 6 6 8 8 8
11 11 11 16 16 16 20 20 20 24 24 24 28 28 28
1 2 3 1 2 3 1 2 3 1 2 3 1 2 3 1 2 3 1 2 3 1 2 3 1 2 3 1 2 3 1 2 3 1 2 3 1 2 3 1 2 3 1 2 3 1 2 3
0.47 0.24 0.14 0.18 0.17 0.29 0.09 0.20 0.23 0.13 0.34 0.51 0.19 0 .15 0.22 0.44 0.50 1.18 -- -- -- 0.50 0.37 0.63 -- -- --
0.27 0.49 0.15 -- -- -- 1.02 0.71 0.63 -- -- -- 0.65 0.55 0.57 -- -- -- 0.41 0.36 0.48
0.45042 0.23409 0.13655 0.17556 0.16581 0.28285 0.08778 0.19507 0.22433 0.12680 0.33162 0.49743 0.18532 0.14630 0.21458 0.44257 0.50292 1 18689 -- -- -- 0.50292 0.37216 0.63368 -- --
0.27158 0.49286 0.15088
--
-- -- 1.02596 0.71415 0.63368
--
-- -- --
0.65380 0.55321 0.57333 -- -- 0.41239 0.36210 0.48280
--
-- 1 . 3 0 . 8 0 . 9 1.3 0.8 2.6 2.8 2.3 1.0 1.1 1.2 0.4 1.0 0.7
27.6 22.0 18.3 23.9 25.7 24.0 12.2 16.7 15.7 20.7 13.5 10.6 6.6 6.6 5.4 6.8 6.2 8.7 8.6 8.9 6.6
11.3 11.5 11.5 5.3 5.5 5.6
14.6 9.7
12.5 9.3
11 . G 11.4
0 . 0 0 2 2 7 5 O . O O 1 4 O O 0 . 0 0 1 5 7 5 0.002275 0 . 0 0 1 4 0 0 0.003952 0.004256 0.003496 0.001860 0.002046 0.002232 0.000832 0.002080 0.001456 0.046092 0.036740 0.030561 0.043498 0.046774 0.043680 0.023912 0.032732 0.030772 0.041400 0.027000 0.021200 0.013530 0.013530 0.01l070 0.013124 0.011966 0.016791 0.018232 0.018868 0 .OH992 0.027459 0.027945 0.027945 0.012720 0.013200 0.013440 0.031098 0.020661 0.026625 0.018135 0.022620 0.022230
--
VI-3

Days a € ter Soi 1 Soi 1 water Water
3 36 1 0.43 0 . 4 3 2 5 1 8 . 0 0 . 0 1 2 6 4 0 3 36 2 0 . 2 5 0 .25146 6 .0 O.OO9480 3 36 3 0.62 0 . 6 2 3 6 2 5 . 2 0 . 0 0 8 2 1 6 3 44 1 0.90 0 . 9 0 5 2 6 3 4 4 2 0.27 0.27158 4 . 2 0 . 0 0 5 2 5 0 3 4 4 3 0.37 0 . 3 7 2 1 6 4 . 7 0 , 0 0 5 8 7 5 3 5 2 1 0.65 0 . 6 5 3 8 0 I. . 4 0 . 0 0 1 8 2 0 3 5 2 2 0.35 0 . 3 5 2 0 4 1 . 6 0 .002080 3 5 2 3 0.31 0.31181 1.8 0 . 0 0 2 3 4 0 3 60 1 0.42 0 . 4 2 2 4 5 5 . 6 0 .007000 3 60 2 0 .38 0 . 3 8 2 2 2 4 . 2 0 , 0 0 5 2 5 0 3 6 0 3 0.36 0 .36210 4 .7 0 .005875 3 70 1 0.58 0 . 5 8 3 3 9 2 . 1 0 . 0 0 1 7 8 5 3 70 2 0 .43 0 . 4 3 2 5 1 1.1 O.OO0935 3 7 0 3 0.69 0 . 6 9 4 0 3 1 . 8 O.OO1530
-- --
.................................................................. a .
b.
Calculations for carbofuran mass in paddy soil were based upon border areas of 1.3, 0.8 and 1.4 ha f o r Fields 1, 2 and 3, respectively.
Calculations for carbofuran mass in paddy water were based upon entire paddy areas of 6.5, 2.8 and 5.3 ha for Fields 1, 2 and 3, respectively.
C . Sample not taken.
VI-4