of kalyanpura watershed, bhilwara, rajasthanfes.org.in/studies/3.pdfit is located in the district of...
TRANSCRIPT
of Kalyanpura Watershed, Bhilwara, Rajasthan
Anais Daverat
STUDIES

Registered under the Societies Registration Act XXI 1860, the Foundation for Ecological Security was set up in 2001 to reinforce the massive and critical task of ecological restoration in the country.
The crux of our efforts lies in locating forests and other natural resources within the prevailing economic, social and ecological dynamics in rural landscapes and in intertwining principles of conservation and local self governance for the protection of the natural surroundings and improvement in the living conditions of the poor.
By working on systemic issues that can bring about a multiplier change, we strive for a future where the local communities determine and move towards desirable land use that is based on principles of conservation and social justice.
A REPORT ON LANDSCAPE MANAGEMENT OF KALYANPURA
WATERSHED,BHILWARA,RAJASTHAN
by Anais Daverat – ISTOM- 2007
FOUNDATION FOR ECOLOGICAL SECURITY (FES)
Introduction Chapter-1
1.a. Area profile, Topography and Watershed Details
The studied area, Kalyanpura Watershed, which lies within the Mej river
catchments, is situated between 75˚ 09’ to 75˚15 ‘ E longitude and 25˚16’ 40” to
25˚ 23’40 ” N latitude. It is then divided into 11 Micro-Watersheds.
It is characterized with an undulated topography ranging from a maximum height
of 510 m above MSL (Mean Sea Level) to a minimum of 330 m below the MSL,
and extends over a total area of 5175 ha.
It is located in the district of Bhilwara, in Mandalgarh tehsil. 16 villages come into
the watershed boundaries. These are: Jassuji ka Khera, Keriya, Nathji ka Khera,
Amli, Devipura, Salampura, Chawandiya, Bakhatpura, Devgarh, Takhatji Ka
Khera, Dhudaji Ka Khera, Madhopuriya, Rajpura, Jhanjola, Achlaji ka Khera and
Mala ka Khera.
1.b. Climate and Rainfall
The watershed area, falling in the semi-arid region, has an average annual
rainfall of 700 mm, which is below the Tehsil averages. Thus, we can qualify it as
a drought prone area, receiving a low average rainfall, and very dependant on
the monsoon rainfalls: When a depression reaches the area, it gets abundant
rains; otherwise, it is subject to a prolonged drought. The monsoon depressions
can be said to be the single factor that controls the distribution of rainfall,
affecting both irrigation & agriculture. Prolonged breaks in monsoons are likely to
occur during the mid-monsoon month, i.e. August. When a long break occurs
during July at the beginning of the cropping season, its effect on the growing
crops is quite harmful.
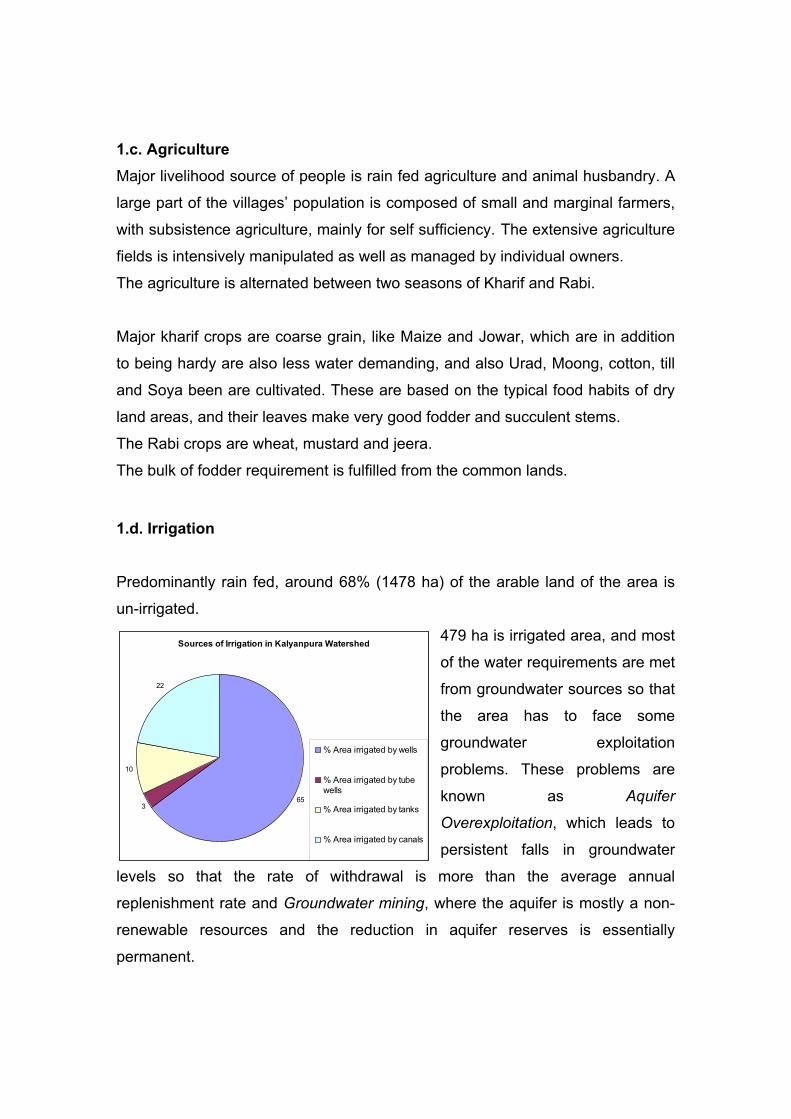
Sources of Irrigation in Kalyanpura Watershed
653
10
22
% Area irrigated by wells
% Area irrigated by tubewells
% Area irrigated by tanks
% Area irrigated by canals
1.c. Agriculture Major livelihood source of people is rain fed agriculture and animal husbandry. A
large part of the villages’ population is composed of small and marginal farmers,
with subsistence agriculture, mainly for self sufficiency. The extensive agriculture
fields is intensively manipulated as well as managed by individual owners.
The agriculture is alternated between two seasons of Kharif and Rabi.
Major kharif crops are coarse grain, like Maize and Jowar, which are in addition
to being hardy are also less water demanding, and also Urad, Moong, cotton, till
and Soya been are cultivated. These are based on the typical food habits of dry
land areas, and their leaves make very good fodder and succulent stems.
The Rabi crops are wheat, mustard and jeera.
The bulk of fodder requirement is fulfilled from the common lands.
1.d. Irrigation
Predominantly rain fed, around 68% (1478 ha) of the arable land of the area is
un-irrigated.
479 ha is irrigated area, and most
of the water requirements are met
from groundwater sources so that
the area has to face some
groundwater exploitation
problems. These problems are
known as Aquifer
Overexploitation, which leads to
persistent falls in groundwater
levels so that the rate of withdrawal is more than the average annual
replenishment rate and Groundwater mining, where the aquifer is mostly a non-
renewable resources and the reduction in aquifer reserves is essentially
permanent.
As a consequence, irrigation is not sufficient & the water balance is precarious.
The agricultural potential of these dry tracts can be increased in the near future
only by adopting a suitable package of practices aimed at the optimum utilization
of available moisture potential through improved soil-and-water management by
combining both strategies of “Planned exploitation and depletion” and “Planned
exploitation and recovery” in this project of Kalyanpura watershed management.
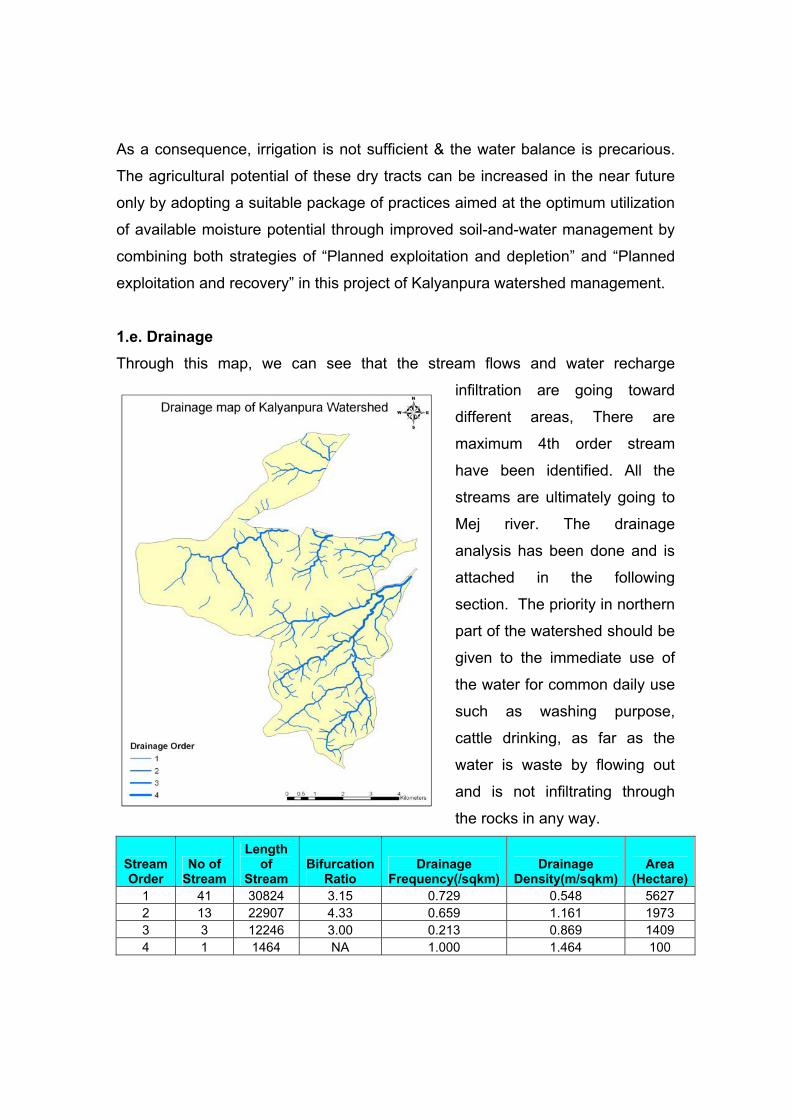
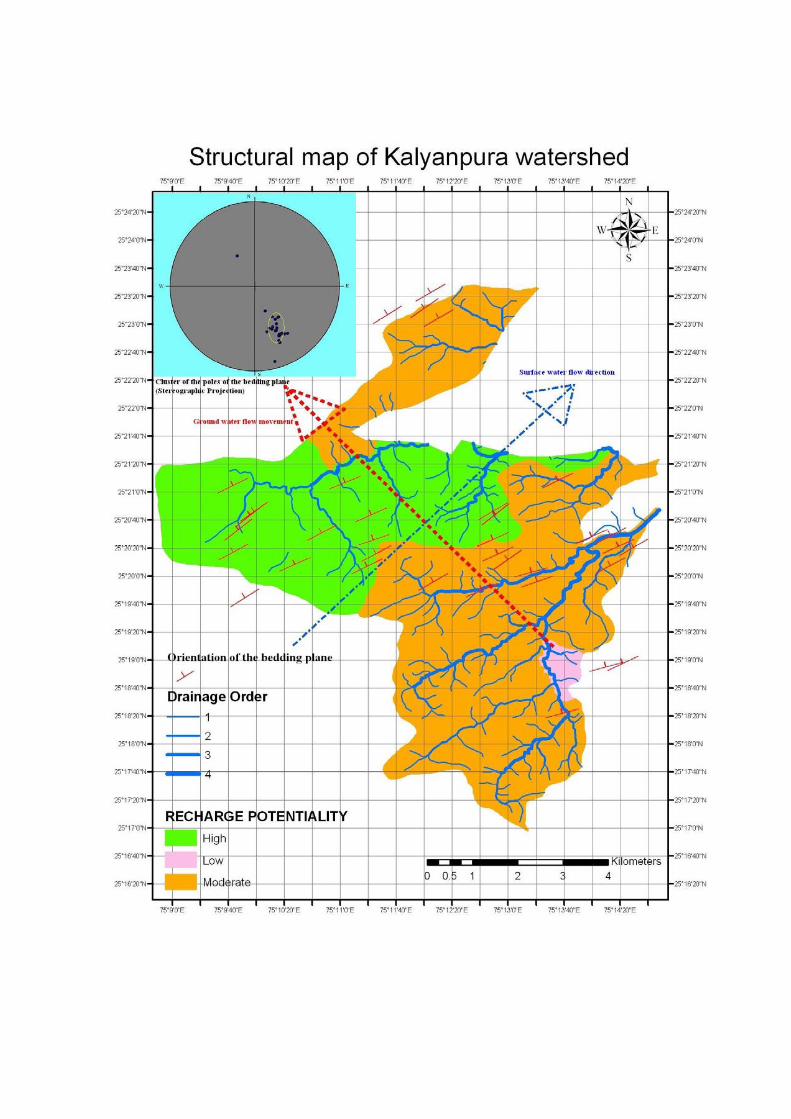
1.e. Drainage Through this map, we can see that the stream flows and water recharge
infiltration are going toward
different areas, There are
maximum 4th order stream
have been identified. All the
streams are ultimately going to
Mej river. The drainage
analysis has been done and is
attached in the following
section. The priority in northern
part of the watershed should be
given to the immediate use of
the water for common daily use
such as washing purpose,
cattle drinking, as far as the
water is waste by flowing out
and is not infiltrating through
the rocks in any way.
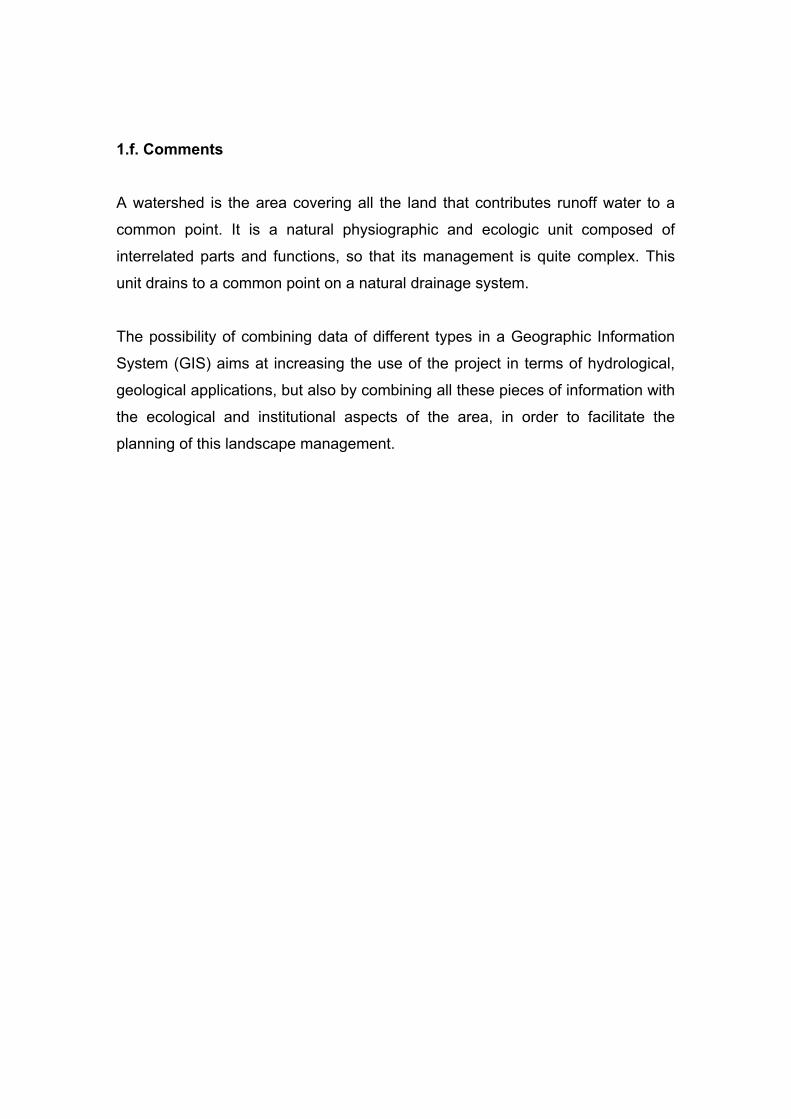
StreamOrder
No of Stream
Lengthof
StreamBifurcation
RatioDrainage
Frequency(/sqkm)Drainage
Density(m/sqkm) Area
(Hectare)1 41 30824 3.15 0.729 0.548 5627 2 13 22907 4.33 0.659 1.161 1973 3 3 12246 3.00 0.213 0.869 1409 4 1 1464 NA 1.000 1.464 100
1.f. Comments
A watershed is the area covering all the land that contributes runoff water to a
common point. It is a natural physiographic and ecologic unit composed of
interrelated parts and functions, so that its management is quite complex. This
unit drains to a common point on a natural drainage system.
The possibility of combining data of different types in a Geographic Information
System (GIS) aims at increasing the use of the project in terms of hydrological,
geological applications, but also by combining all these pieces of information with
the ecological and institutional aspects of the area, in order to facilitate the
planning of this landscape management.
Institutional processes operated in Landscape ManagementKalyanpura Watershed Chapter-2
For simplifying the systems and procedures are divided into the following
stages/sections: The Panchayat shall implement the projects under the overall
supervision and guidance of the PIA (Panchayat Samiti –Mandalgarh), therefore
the systems and procedures which are part of the MoU between the PMC and
the PIA shall be applicable to the Panchayat for the implementation of
Kalyanpura watershed.
Planning stage:
1. Community mobilization and preparation of a comprehensive community
based watershed development plans: The involvement of the community at
the level of planning and implementation is crucial for the realization of
ownership of the community to the project activities and the regenerated
resources. To ensure that the access of the community to decision making
and resources we need to organize community at the habitation level as
village institutions (to be recognized as sub committees for the concerned
Panchayat), which federate at the level of the Panchayat and thereby
support the Panchayat in the implementation of the project. These
habitation level institutions will prepare the organize meeting at habitation
level for mapping the community needs and arrive at the village
developments plans which clubbed at the level of watershed will form the
watershed development plans.
2. Decision-making: The process of strengthening of the Panchayat should be
initiated at the level of decision-making at the Panchayat and habitation level
with effective participation of all caste and class. For this monthly meeting at
the habitation level and quarterly meetings at Panchayat level are to be
organized to review the progress of work, resolve conflicts and plans for
future. Annual meetings for sharing of the works at the Panchayat samiti
level need to be organized to generate wider acceptance and garner support
for the work at block and district level.
Assessment of the Change in the Kalyanpura Watershed area: An
Ecological Characterization - This provides a detailed description of
landscape-level ecological conditions of the Kalyanpura watershed, analyzes
and evaluates land use and land cover, hydrology and biological diversity.
Applying principles of landscape ecology to assess the cumulative effects of
human development activities on natural resources is the central concept of
this report. Several indicators of landscape ecological integrity will be
evaluated. They include: (1) forest and native vegetation loss, (2) forest
patch pattern, (3) stream-edge habitat condition, (4) water quality and
quantity in the streams, (5) stability of stream hydrology, (6) balanced native
populations of animals and natural areas. A synthesis of findings from the
study as well as recommendations for improving ecological conditions in the
Kalyanpura Watershed will also be provided. .
Implementation stage: Base documents:
a. No Objection and land ownership: Before carrying out any physical
construction work a No Objection Certificate is to be obtained from the
owner of the land, if the construction is carried out on Private land, and
from the appropriate Government authority, if the construction is done
on public land.
b. In case of Private land, proof of ownership of land, like a copy of Land
Patta or authentication from any government authority, must be
obtained and kept for verification.
c. An undertaking shall be obtained from the owner of the Private land
and the group that the project shall not be responsible for any liability
whatsoever arising out of the construction of water-harvesting
structures.
Methodology & Analysis Procedure of Landscape Management with the data in GIS. Chapter-3
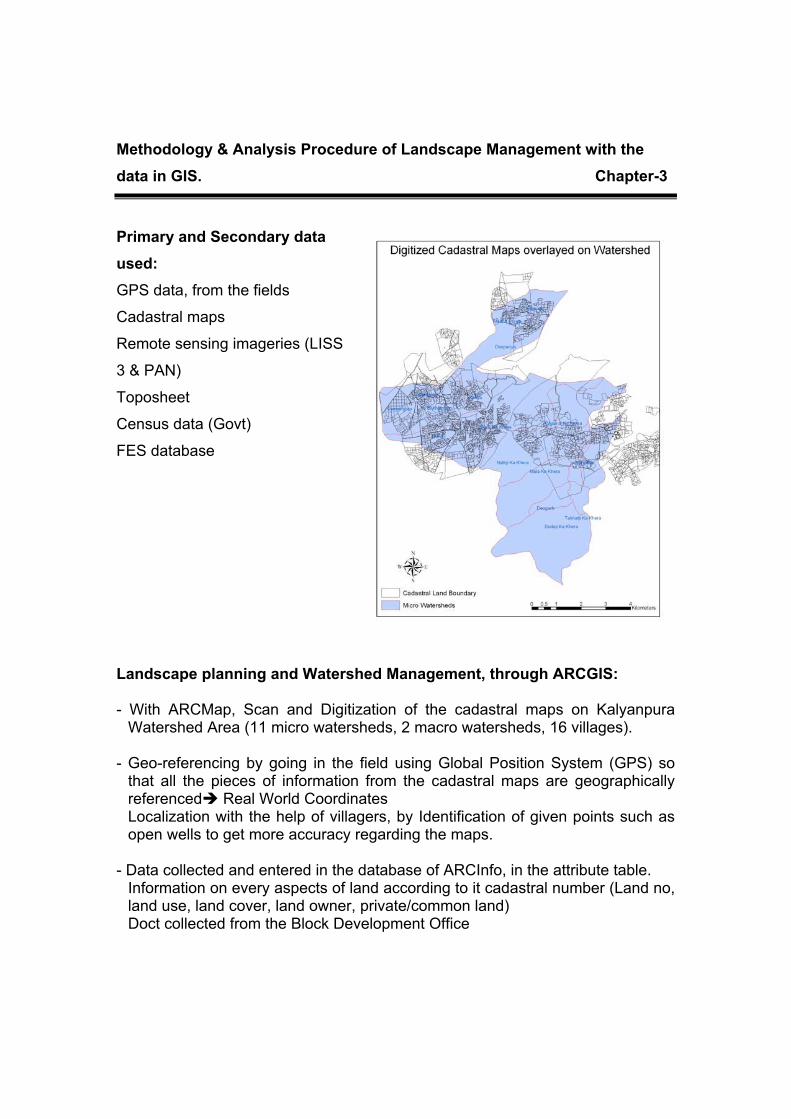
Primary and Secondary data used:GPS data, from the fields
Cadastral maps
Remote sensing imageries (LISS
3 & PAN)
Toposheet
Census data (Govt)
FES database
Landscape planning and Watershed Management, through ARCGIS:
- With ARCMap, Scan and Digitization of the cadastral maps on Kalyanpura Watershed Area (11 micro watersheds, 2 macro watersheds, 16 villages).
- Geo-referencing by going in the field using Global Position System (GPS) so that all the pieces of information from the cadastral maps are geographically referenced� Real World Coordinates Localization with the help of villagers, by Identification of given points such as open wells to get more accuracy regarding the maps.
- Data collected and entered in the database of ARCInfo, in the attribute table. Information on every aspects of land according to it cadastral number (Land no, land use, land cover, land owner, private/common land) Doct collected from the Block Development Office
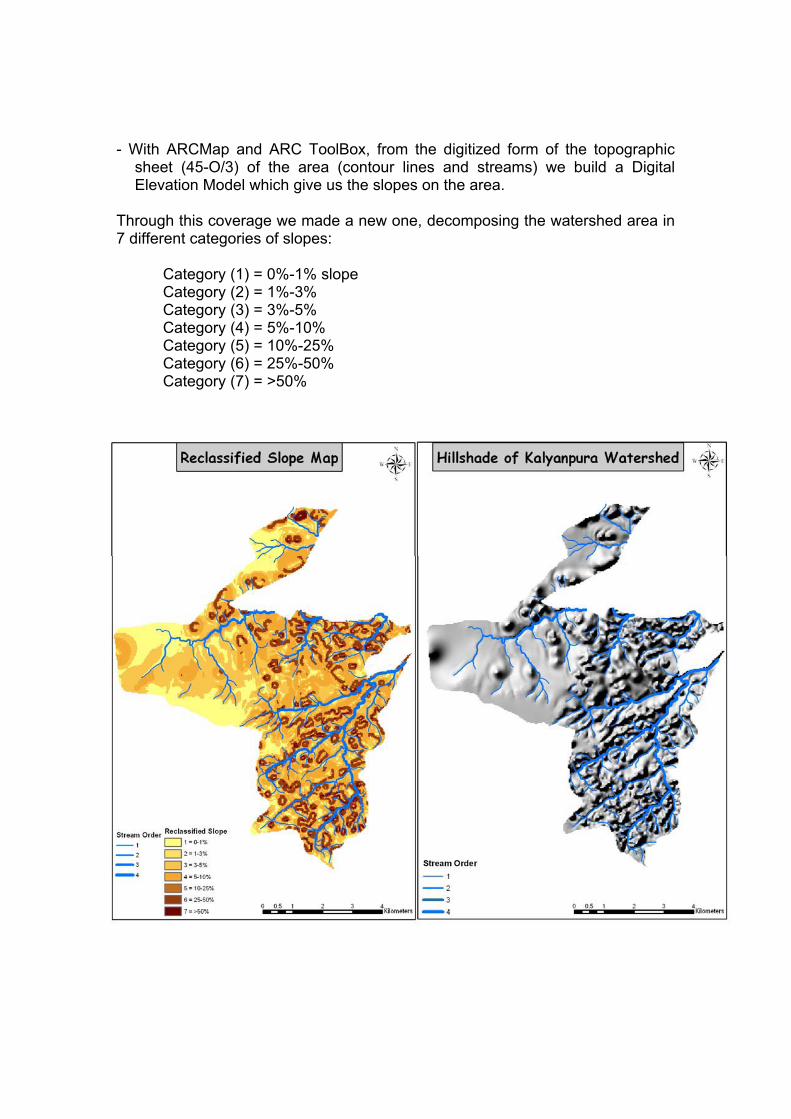
- With ARCMap and ARC ToolBox, from the digitized form of the topographic sheet (45-O/3) of the area (contour lines and streams) we build a Digital Elevation Model which give us the slopes on the area.
Through this coverage we made a new one, decomposing the watershed area in 7 different categories of slopes:
Category (1) = 0%-1% slope Category (2) = 1%-3%Category (3) = 3%-5%Category (4) = 5%-10% Category (5) = 10%-25% Category (6) = 25%-50% Category (7) = >50%
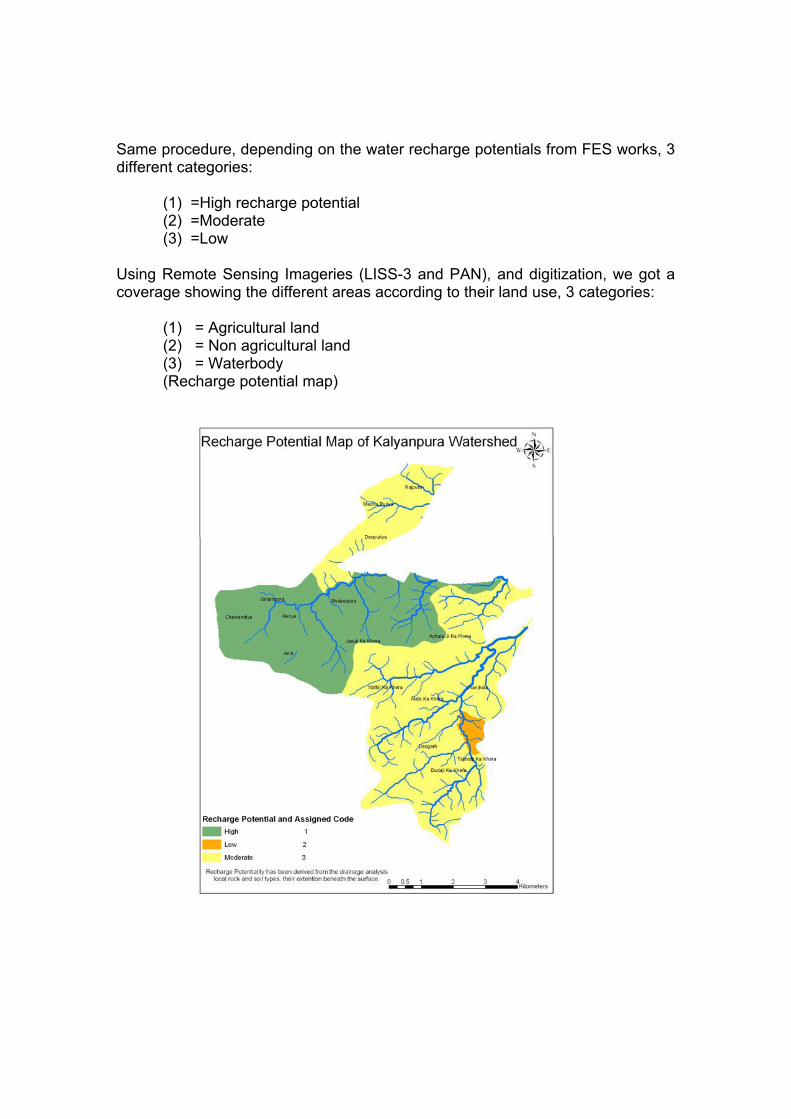
Same procedure, depending on the water recharge potentials from FES works, 3 different categories:
(1) =High recharge potential (2) =Moderate (3) =Low
Using Remote Sensing Imageries (LISS-3 and PAN), and digitization, we got a coverage showing the different areas according to their land use, 3 categories:
(1) = Agricultural land (2) = Non agricultural land (3) = Waterbody (Recharge potential map)
Combination of each coverage, giving a new coverage (land use combined with slope and then combine with recharging potential)�60 different combinations for this coverage.
Creation of new fields in the attribute table, referring to some codes identifying every different polygon regarding their combinations
Example: (1) for Agricultural, without any combination
(12) for Agricultural land and a slope between 1-3%, 1st combination
�20 combinations (3 categories of land use*7 categories of slope, minus one impossible scenario of 35-50%slope on a water body)
(1203) for Agricultural land, slope between 1-3% and Low recharge potential, 2nd combination
�20*3 categories of recharge potential = 60 combinations
Regarding these 60 combinations, particular types of interventions are being defined.
As the area has simultaneously been digitized in its cadastral form, we can then easily identify who are the people concerned, which we have to address and advise them on the kind of interventions which should be done to improve the use of land, regarding the watershed development activities
In addition to these geo-hydrological aspects, ecological and institutional aspects have to be considered as well, so that a greater number of interventions will be defined.
Land use & Land cover and their uses in Landscape Management Chapter-4
Definition of Land use and Land cover
Land use is the human modification of natural environment or wilderness into
built environment such as fields, pastures, and settlements. More recent
significant effects of land use include urban sprawl, soil erosion, soil degradation,
salinization, and desertification.
The land use is mainly divided into:
- Cultivation area,
- Culturable waste land
- Non cultivation area
- Forest land
Sometimes these categories might be more precise, so we can find them as :
- Forests
- Land put to non-agricultural uses
- Barren & non-culturable land
- Permanent pastures & other grazing lands
- Miscellaneous tree crops & groves, not included in the net area sown
- Culturable waste
- Fallow land, other than current fallows
- Current fallows
- Net area sown
Land use and land management practices have a major impact on natural
resources including water, soil, nutrients, plants and animals. Land use
information can be used to develop solutions for natural resource management
issues such as salinity and water quality. For instance, water bodies in a region
that has been deforested or having erosion will have different water quality than
those in areas that are forested.
As a consequence of absence of any land use planning, the result has often
been misery for large segments of the local population and destruction of
valuable ecosystems. Such narrow approaches should be replaced by a
technique for the planning and management of land resources that is integrated
and holistic and where land users are central. This will ensure the long-term
quality of the land for human use, the prevention or resolution of social conflicts
related to land use, and the conservation of ecosystems of high biodiversity
value.
Land cover is the physical material at the surface of the earth. Land covers
include grass, asphalt, trees, bare ground, water, etc. There are two primary
methods for capturing information on land cover: field survey and through
analysis of remotely sensed imagery.
Land cover is distinct from land use despite the two terms often being used
interchangeably. Land use is a description of how people utilize the land and
socio-economic activity - urban and agricultural land uses are two of the most
commonly recognized high-level classes of use. At any one point or place, there
may be multiple and alternate land uses, the specification of which may have a
political dimension.
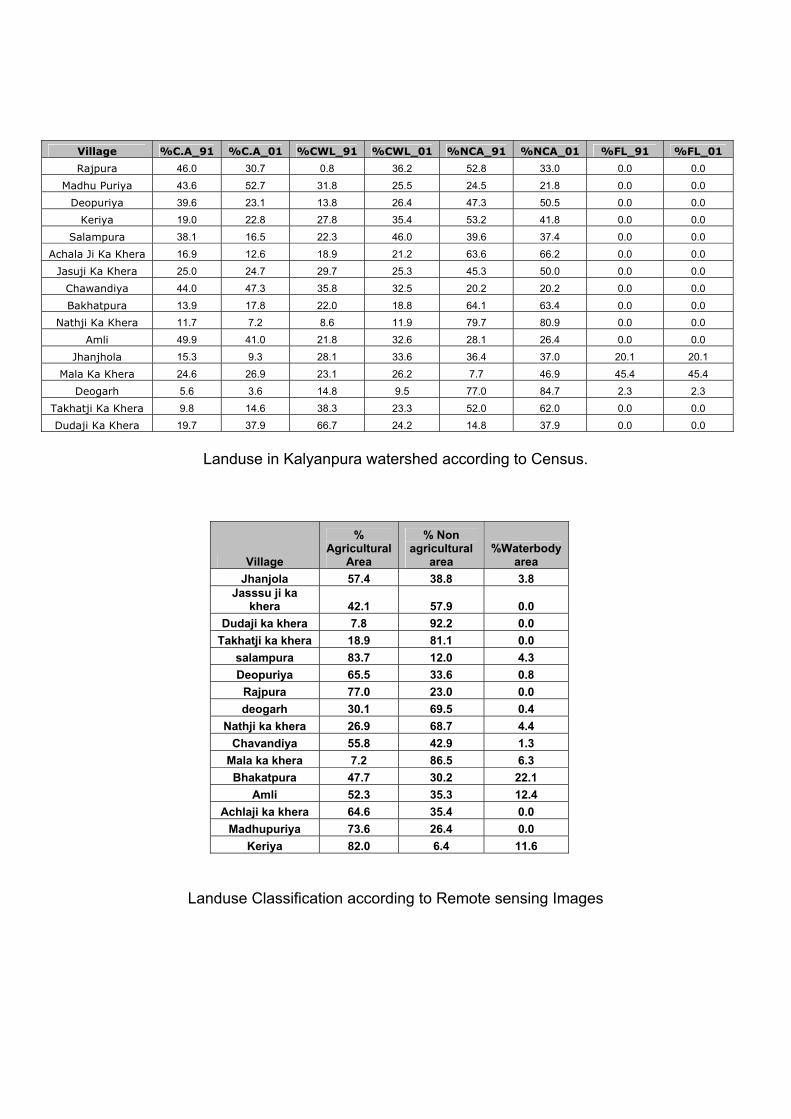
Land use pattern in Kalyanpura watershed
On the following maps and graphs, land use pattern is divided into the main
categories: Cultivation area / Non cultivation area / Culturable Waste land / Water
body / Forest.
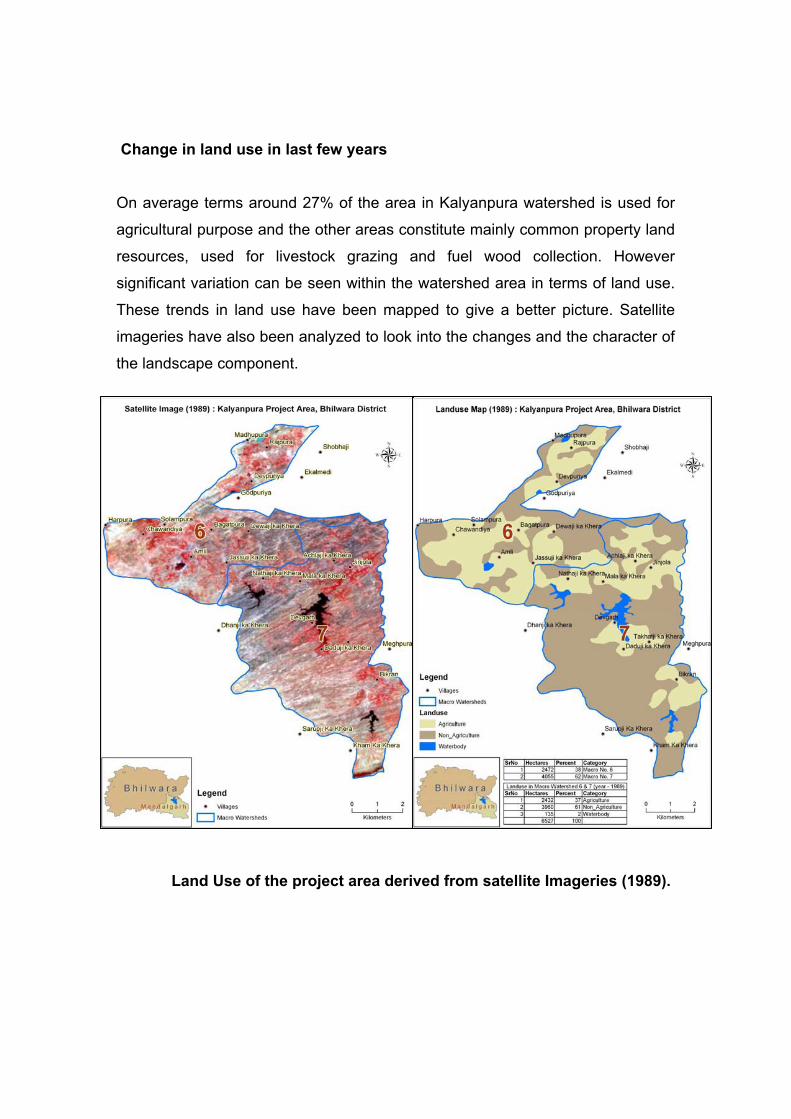
Change in land use in last few years
On average terms around 27% of the area in Kalyanpura watershed is used for
agricultural purpose and the other areas constitute mainly common property land
resources, used for livestock grazing and fuel wood collection. However
significant variation can be seen within the watershed area in terms of land use.
These trends in land use have been mapped to give a better picture. Satellite
imageries have also been analyzed to look into the changes and the character of
the landscape component.
Land Use of the project area derived from satellite Imageries (1989).
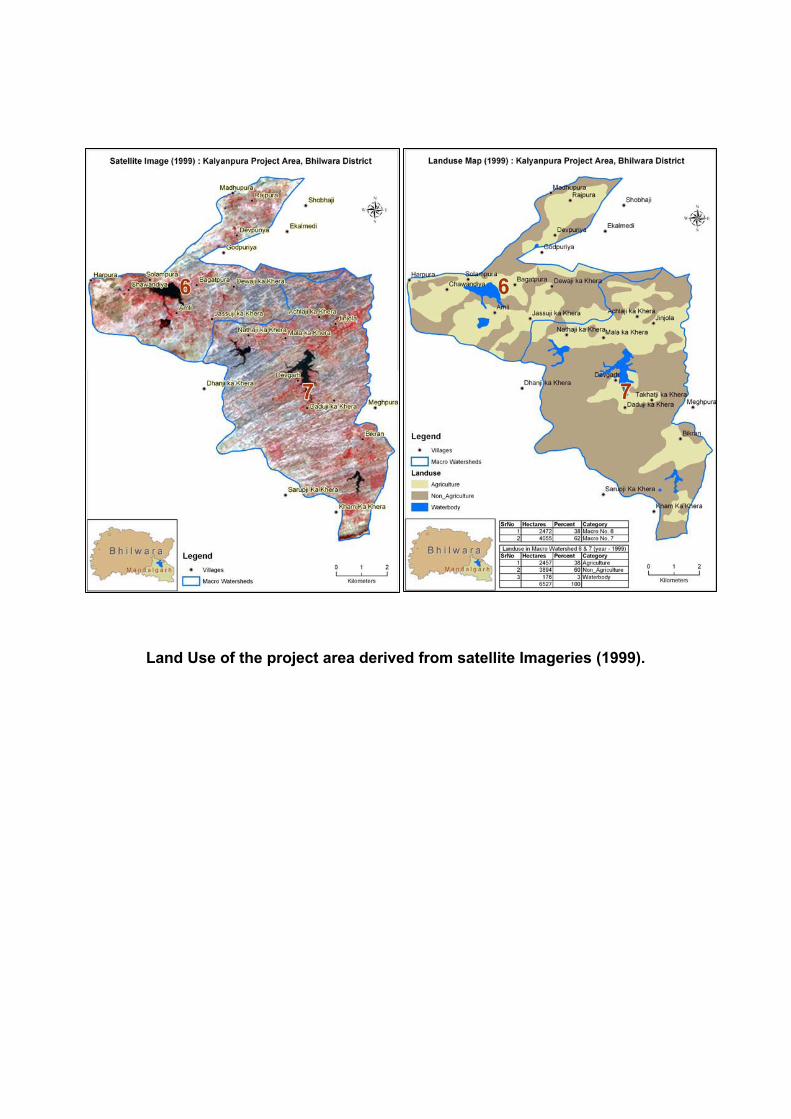
Land Use of the project area derived from satellite Imageries (1999).
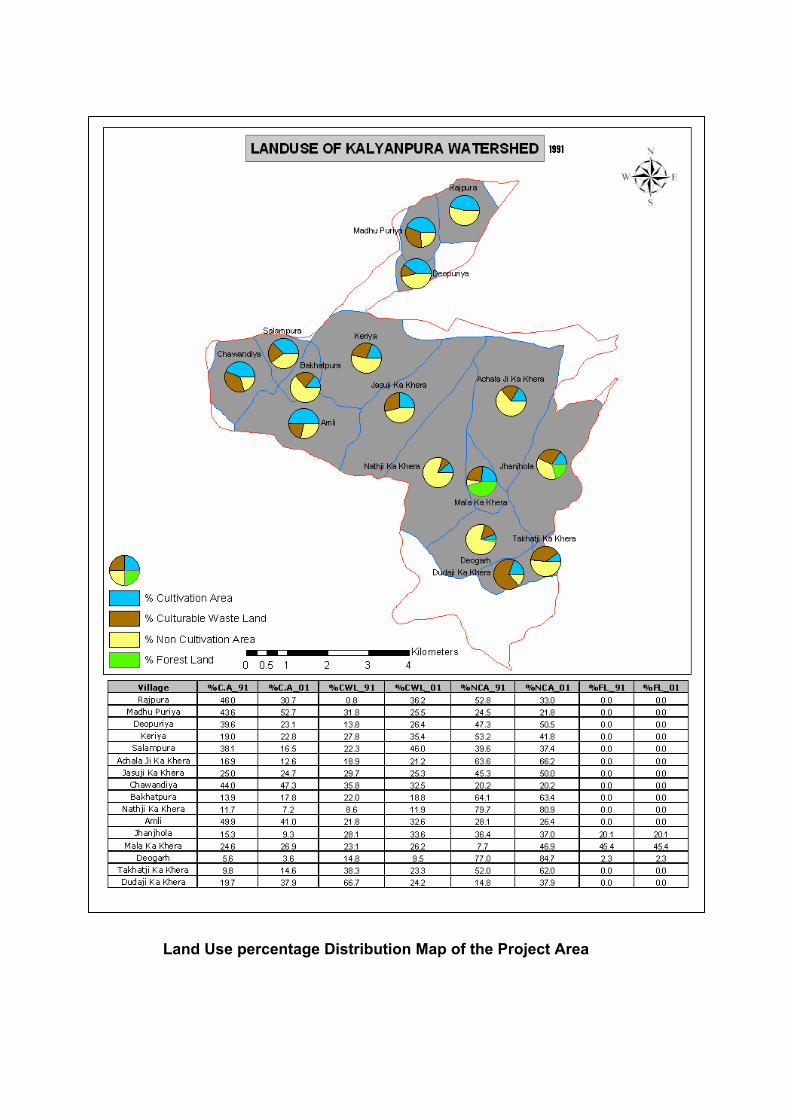
Land Use percentage Distribution Map of the Project Area
Geology and its uses in Landscape Management Chapter-5
Geology is the branch of sciences which deals with the processes of formation
and evolution of earth and its different systems through time.
The geology of Kalyanpura watershed represents the structure in term of the
rocks, minerals, and physical aspect of the soil in this area.
Rock types, Soil types and Stratigraphy
This is a part of the sedimentary basin with evidences of minor and low grade
metamorphism (Upper Vindhyan Super Group around the age of late proterozoic
and early Cambrian). The area consisting of the shale, slate, phyllite and
quartzite with minor inclusions of local quartz veins which resemblance the
Bhander group. General trend of the bedding planes and foliations along NE-SW
direction, dipping towards NW with lots of local variations. Due to structural
disturbances and physical processes operated on the area, the rocks are highly
fractured and these fractures extended up to a greater depth (as observed in
different open wells).
Water resources and its Distribution (surface and subsurface)
Water resources are divisible into 2 distinct categories : the surface-water
resources & the ground-water resources. Each of these categories is a part of
the earth's water circulatory system, called the hydrologic cycle, and is derived
from rainfall in the case of Kalyanpura watershed area. These 2 categories are
interdependent and frequently the loss of one is the gain of the other.
The rainfall which comes upon the land is the ultimate source for both the
categories of water resources and can be then dispersed in several ways. A
sizeable portion is intercepted by the vegetal cover or temporarily detained in
surface depressions. Most of it is later lost through evaporation. When the
available interception or the depression storage are completely exhausted and
when the rainfall intensity at the soil surface exceeds the infiltration capacity of
the soils, the overland flow begins and reaches a stream channel which is called
surface run-off.
Through the fractures in the rocks, there is a phenomenon of percolation of the
water which gives to the area a good capacity of water recharging.
The compaction of shale and slate does not leave any porous spaces within the
rock but enormous fractures through out the area made the path to move water
drops towards the ground water table. Therefore it may not hold water within the
rock itself due to absence of pore spaces but it can hold water in the
interconnected fracture zones for the upper unconfined aquifer. Simultaneously,
water can also percolate to a greater depth through these fractures in many
places to recharge the deeper confined and semi confined aquifer slowly.
Ecology and its uses in Landscape Management Chapter-5
Vegetation & Species
Species diversity: The flora and fauna are particularly endemic to the arid regions
and are specially adapted biologically to survive in the dry, waterless regions.
Although Dhok or Dhokara (Anogeissus pendula) is the predominant species for
Mandalgarh Tehsiland is thus being present in the Kalyanpura watershed area,
the predominant species of the area are Acacia leucophloea (Arunja/Ronj),
Acacia catechu (Khair), Acacia nilotica (Desi babool), and Azadiracta indica
(Neem). The area has also got a shrub cover, which largely comprises of Casia
auriculata (Puad). The area is characterized by the grass species Aristda
species, signifying depleted water table and a state of degradation.
Ecosystems of the area and interactions with the landscape
These ecosystems can be broadly classified into 2 categories:
- Natural Ecosystem:
- Terrestrial Ecosystem = Forest, Grassland - Aquatic Ecosystem = Fresh water, Lentic ie standing water like ponds/lakes/Reservoirs), Lotic ie running water of non perennial rivers
- Man-engineered Ecosystems:
- Cropland ecosystem:
- Farmland ecosystem
- Agro forestry /Orchard ecosystem
The natural ecosystem of Mandalgarh area have been reduced to a few isolated
pockets, like gorge, reserve forest, banni (forest ecosystem) or sacred grooves,
community owned and protected grazing plots, numerous water bodies such as
ponds, pools, lakes and dams.
They are constantly prone to severe manipulation and interference by human
and livestock population. The other important component in the landscape is the
extensive agriculture fields which is intensively manipulated as well as managed
by individual owners.
However there exists a general spatial, functional, temporal and complex
interdependence among these ecosystems. Most of the forest land / Banni
(forest ecosystem), gorge (Lotic ecosystem) and community owned and
protected plots (Protected & Managed grassland ecosystems) are found in upper
ridges of the hill ranges, while other ecosystem like ponds/lakes /reservoirs
(Lentic ecosystems), agricultural land orchards (cropland ecosystem) occurs in
the low lying flat land or valleys in the area.
Though the forests are highly degraded, they provide such benefits to local
people as fuel wood, fodder, fruits apart from ecological services like interception
of surface run-off, etc. Thus ensuring moisture conservation, ground water
recharge, alleviation of moisture cutting & loss, and minimizing siltation in the
reservoirs in the down streams. As a cascading effect the water availability in
streams, ponds & agriculture fields is enhanced and prolonged. During
precipitation and storm, some of nutrients reach the valley area through the
flowing water. Consequently, the fertility of agriculture land is increased, which in
turn pushes up the agricultural land productivity.
Output of Integrated and Analyzed Data Chapter-6
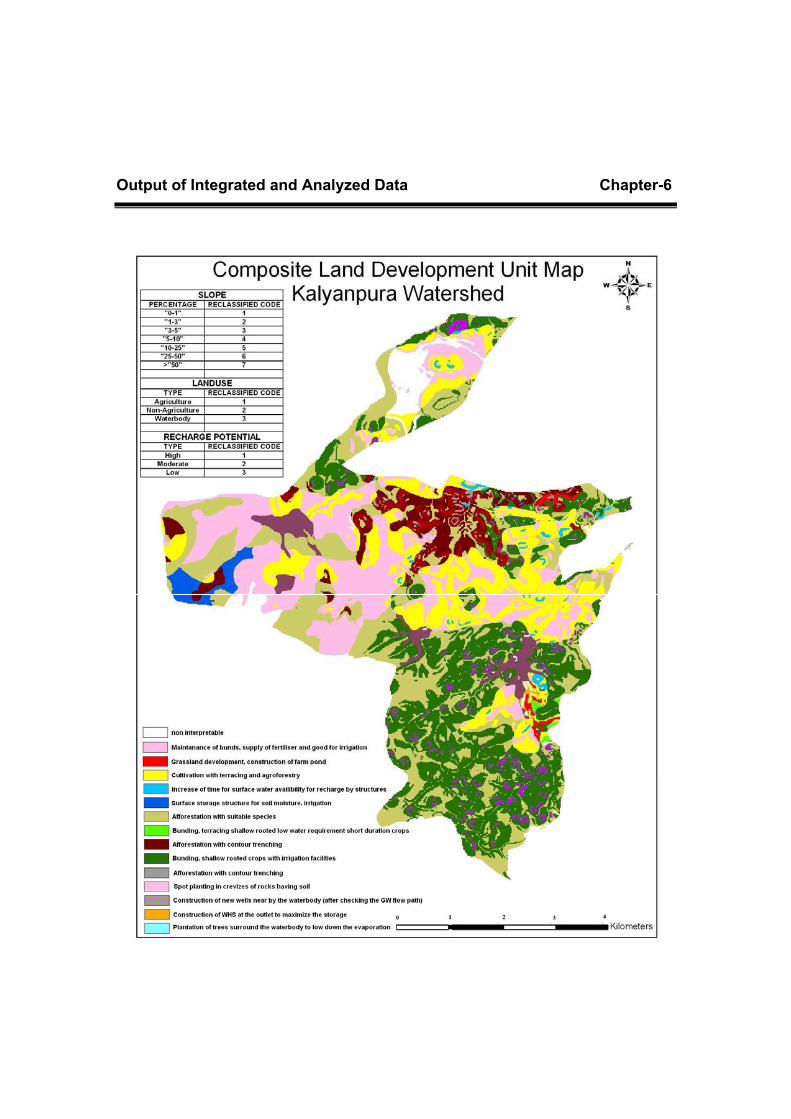
These 2 maps are highlighting the different zones where specific conservation
measures should be implemented after analysis of the land, given its land use
and its geo-hydrology (slope and water recharge potential).
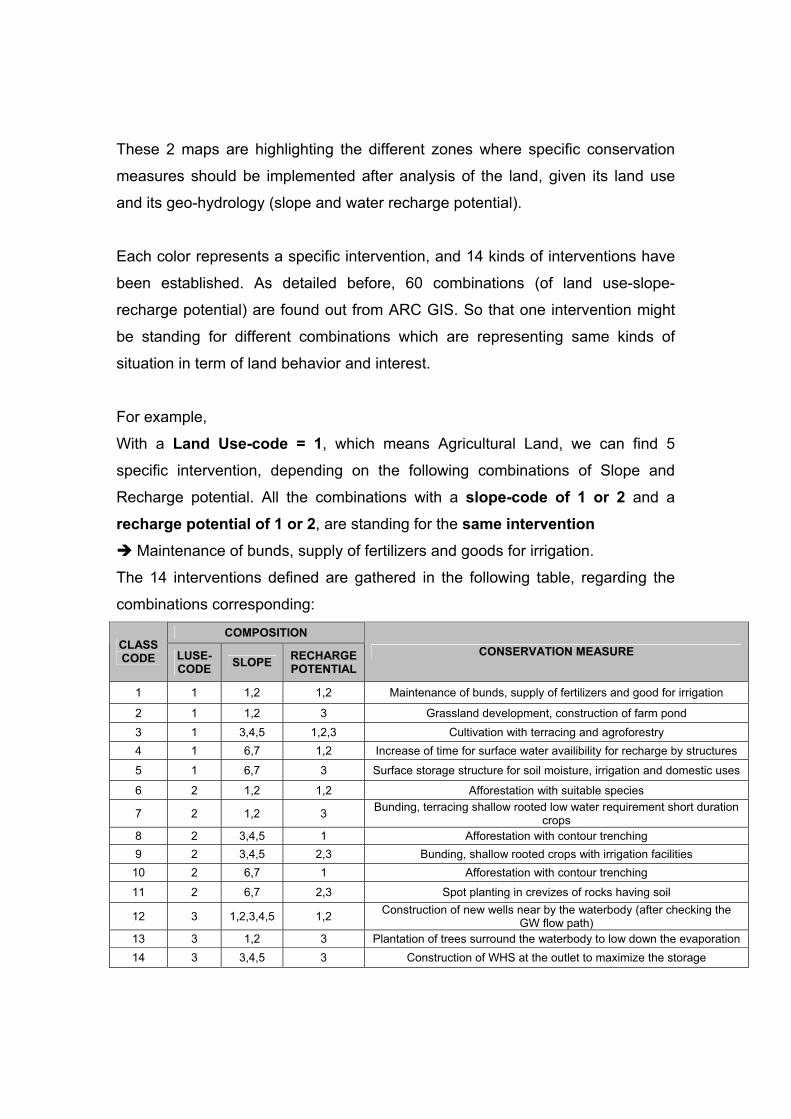
Each color represents a specific intervention, and 14 kinds of interventions have
been established. As detailed before, 60 combinations (of land use-slope-
recharge potential) are found out from ARC GIS. So that one intervention might
be standing for different combinations which are representing same kinds of
situation in term of land behavior and interest.
For example,
With a Land Use-code = 1, which means Agricultural Land, we can find 5
specific intervention, depending on the following combinations of Slope and
Recharge potential. All the combinations with a slope-code of 1 or 2 and a
recharge potential of 1 or 2, are standing for the same intervention�Maintenance of bunds, supply of fertilizers and goods for irrigation.
The 14 interventions defined are gathered in the following table, regarding the
combinations corresponding:
COMPOSITION CLASS CODE LUSE-
CODE SLOPE RECHARGE POTENTIAL
CONSERVATION MEASURE
1 1 1,2 1,2 Maintenance of bunds, supply of fertilizers and good for irrigation
2 1 1,2 3 Grassland development, construction of farm pond 3 1 3,4,5 1,2,3 Cultivation with terracing and agroforestry 4 1 6,7 1,2 Increase of time for surface water availibility for recharge by structures
5 1 6,7 3 Surface storage structure for soil moisture, irrigation and domestic uses
6 2 1,2 1,2 Afforestation with suitable species
7 2 1,2 3 Bunding, terracing shallow rooted low water requirement short duration crops
8 2 3,4,5 1 Afforestation with contour trenching 9 2 3,4,5 2,3 Bunding, shallow rooted crops with irrigation facilities 10 2 6,7 1 Afforestation with contour trenching
11 2 6,7 2,3 Spot planting in crevizes of rocks having soil
12 3 1,2,3,4,5 1,2 Construction of new wells near by the waterbody (after checking the GW flow path)
13 3 1,2 3 Plantation of trees surround the waterbody to low down the evaporation 14 3 3,4,5 3 Construction of WHS at the outlet to maximize the storage
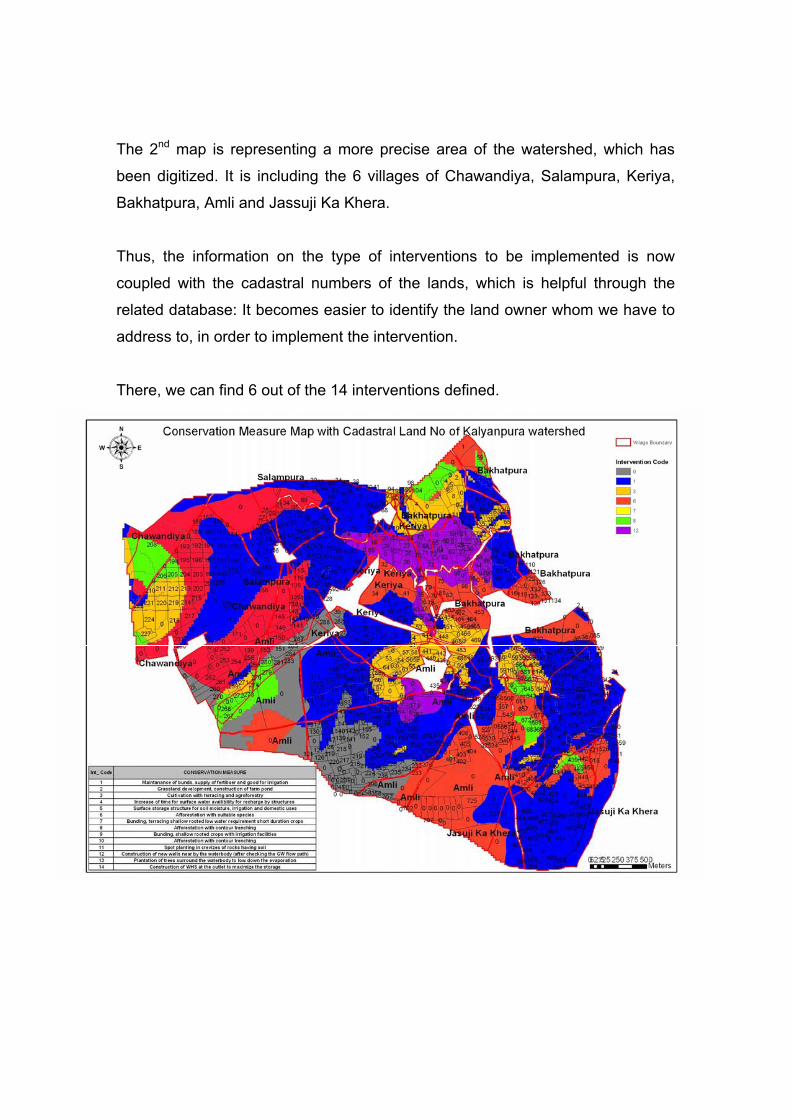
The 2nd map is representing a more precise area of the watershed, which has
been digitized. It is including the 6 villages of Chawandiya, Salampura, Keriya,
Bakhatpura, Amli and Jassuji Ka Khera.
Thus, the information on the type of interventions to be implemented is now
coupled with the cadastral numbers of the lands, which is helpful through the
related database: It becomes easier to identify the land owner whom we have to
address to, in order to implement the intervention.
There, we can find 6 out of the 14 interventions defined.
Problems faced during work:
- Much time was required to travel the distance from Bhilwara to the watershed area so that we could not collect in a day as much data as we would like, as far as it was taking also some time to identify enough precise and interesting points corresponding on the map and in the field.
- Digitized cadastral maps need some reprocessing:Rectifications in the geo referencing, because there are some problems of
correspondence between villages boundaries or roads.
- Confusions for some cadastral numbers, some lands’ numbers are confused, some numbers are missing, or in some cases several different numbers are standing for a single land.
- Categories between land cover and land use from the Patawari data are not clear. Moreover the problem related to language (hindi writing) makes it more difficult.
- Problems related to the capacity of the computer which was insufficient for software such as ARC MAP, which really slow down the work, and required very much patience!
References:
� Detailed Project Report of Kalyanpura watershed from Fondation for
Ecological Security.
� Watershed Development Policy Challenges & Recommendations, The
India Context by Wilson, V., 1 Amezaga J., 1 Gosain, A., 2 Gupta, R.3and
Saigal, S, August, 2003
� “Preparing the Next Generation of Watershed Management Programmes”
11th - 13th September, 2003, Kathmandu, Nepal
� Map India Conference 2003, GIS development.net, Ashish Pandey, V.M
Chowdary, B.C Mal and P.P Dabral
Websites:
� www.Krishiworld.com
� envfor.nic.in/unccd/chap-3.pdf
� www.indianchild.com/panchayats_system_india.htm
� www.google.co.in
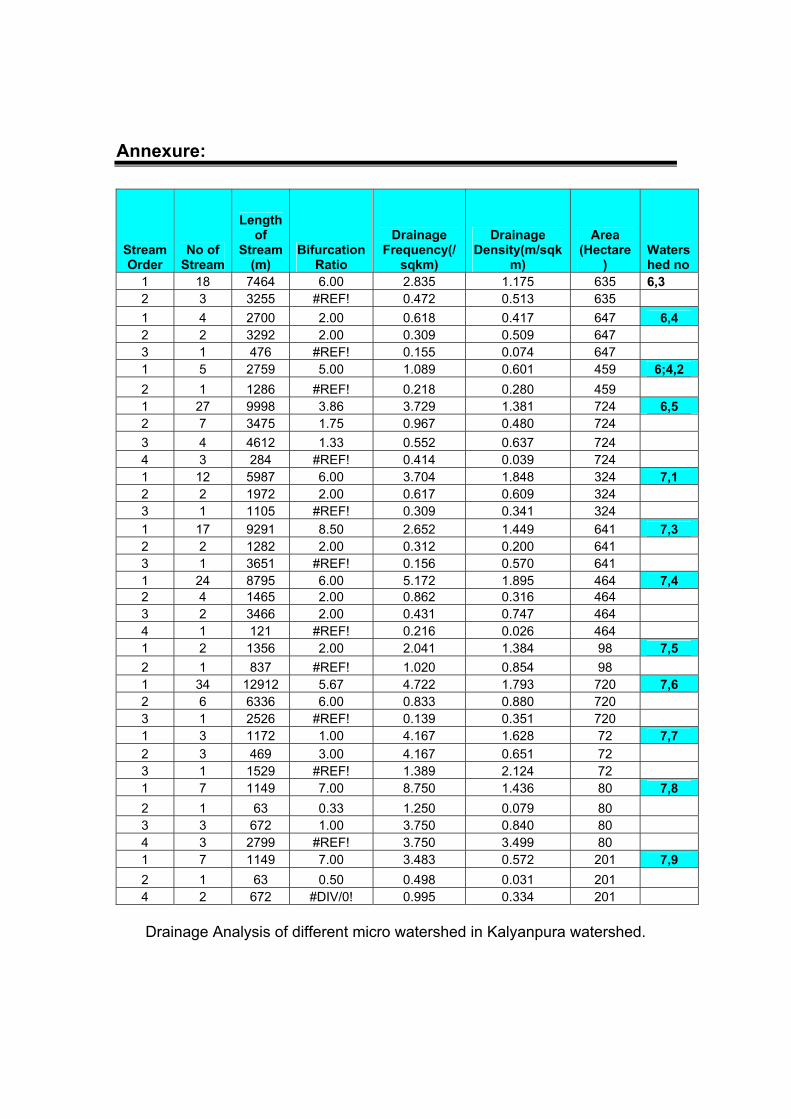
Annexure:
StreamOrder
No of Stream
Lengthof
Stream(m)
Bifurcation Ratio
Drainage Frequency(/
sqkm)
Drainage Density(m/sqk
m)
Area(Hectare
)Watershed no
1 18 7464 6.00 2.835 1.175 635 6,32 3 3255 #REF! 0.472 0.513 635 1 4 2700 2.00 0.618 0.417 647 6,42 2 3292 2.00 0.309 0.509 647 3 1 476 #REF! 0.155 0.074 647 1 5 2759 5.00 1.089 0.601 459 6;4,22 1 1286 #REF! 0.218 0.280 459 1 27 9998 3.86 3.729 1.381 724 6,52 7 3475 1.75 0.967 0.480 724 3 4 4612 1.33 0.552 0.637 724 4 3 284 #REF! 0.414 0.039 724 1 12 5987 6.00 3.704 1.848 324 7,12 2 1972 2.00 0.617 0.609 324 3 1 1105 #REF! 0.309 0.341 324 1 17 9291 8.50 2.652 1.449 641 7,32 2 1282 2.00 0.312 0.200 641 3 1 3651 #REF! 0.156 0.570 641 1 24 8795 6.00 5.172 1.895 464 7,42 4 1465 2.00 0.862 0.316 464 3 2 3466 2.00 0.431 0.747 464 4 1 121 #REF! 0.216 0.026 464 1 2 1356 2.00 2.041 1.384 98 7,52 1 837 #REF! 1.020 0.854 98 1 34 12912 5.67 4.722 1.793 720 7,62 6 6336 6.00 0.833 0.880 720 3 1 2526 #REF! 0.139 0.351 720 1 3 1172 1.00 4.167 1.628 72 7,72 3 469 3.00 4.167 0.651 72 3 1 1529 #REF! 1.389 2.124 72 1 7 1149 7.00 8.750 1.436 80 7,82 1 63 0.33 1.250 0.079 80 3 3 672 1.00 3.750 0.840 80 4 3 2799 #REF! 3.750 3.499 80 1 7 1149 7.00 3.483 0.572 201 7,92 1 63 0.50 0.498 0.031 201 4 2 672 #DIV/0! 0.995 0.334 201
Drainage Analysis of different micro watershed in Kalyanpura watershed.
Village %C.A_91 %C.A_01 %CWL_91 %CWL_01 %NCA_91 %NCA_01 %FL_91 %FL_01
Rajpura 46.0 30.7 0.8 36.2 52.8 33.0 0.0 0.0
Madhu Puriya 43.6 52.7 31.8 25.5 24.5 21.8 0.0 0.0
Deopuriya 39.6 23.1 13.8 26.4 47.3 50.5 0.0 0.0
Keriya 19.0 22.8 27.8 35.4 53.2 41.8 0.0 0.0
Salampura 38.1 16.5 22.3 46.0 39.6 37.4 0.0 0.0
Achala Ji Ka Khera 16.9 12.6 18.9 21.2 63.6 66.2 0.0 0.0
Jasuji Ka Khera 25.0 24.7 29.7 25.3 45.3 50.0 0.0 0.0
Chawandiya 44.0 47.3 35.8 32.5 20.2 20.2 0.0 0.0
Bakhatpura 13.9 17.8 22.0 18.8 64.1 63.4 0.0 0.0
Nathji Ka Khera 11.7 7.2 8.6 11.9 79.7 80.9 0.0 0.0
Amli 49.9 41.0 21.8 32.6 28.1 26.4 0.0 0.0
Jhanjhola 15.3 9.3 28.1 33.6 36.4 37.0 20.1 20.1
Mala Ka Khera 24.6 26.9 23.1 26.2 7.7 46.9 45.4 45.4
Deogarh 5.6 3.6 14.8 9.5 77.0 84.7 2.3 2.3
Takhatji Ka Khera 9.8 14.6 38.3 23.3 52.0 62.0 0.0 0.0
Dudaji Ka Khera 19.7 37.9 66.7 24.2 14.8 37.9 0.0 0.0
Landuse in Kalyanpura watershed according to Census.
Village
%Agricultural
Area
% Non agricultural
area %Waterbody
area Jhanjola 57.4 38.8 3.8
Jasssu ji ka khera 42.1 57.9 0.0
Dudaji ka khera 7.8 92.2 0.0 Takhatji ka khera 18.9 81.1 0.0
salampura 83.7 12.0 4.3 Deopuriya 65.5 33.6 0.8
Rajpura 77.0 23.0 0.0 deogarh 30.1 69.5 0.4
Nathji ka khera 26.9 68.7 4.4 Chavandiya 55.8 42.9 1.3
Mala ka khera 7.2 86.5 6.3 Bhakatpura 47.7 30.2 22.1
Amli 52.3 35.3 12.4 Achlaji ka khera 64.6 35.4 0.0
Madhupuriya 73.6 26.4 0.0 Keriya 82.0 6.4 11.6
Landuse Classification according to Remote sensing Images
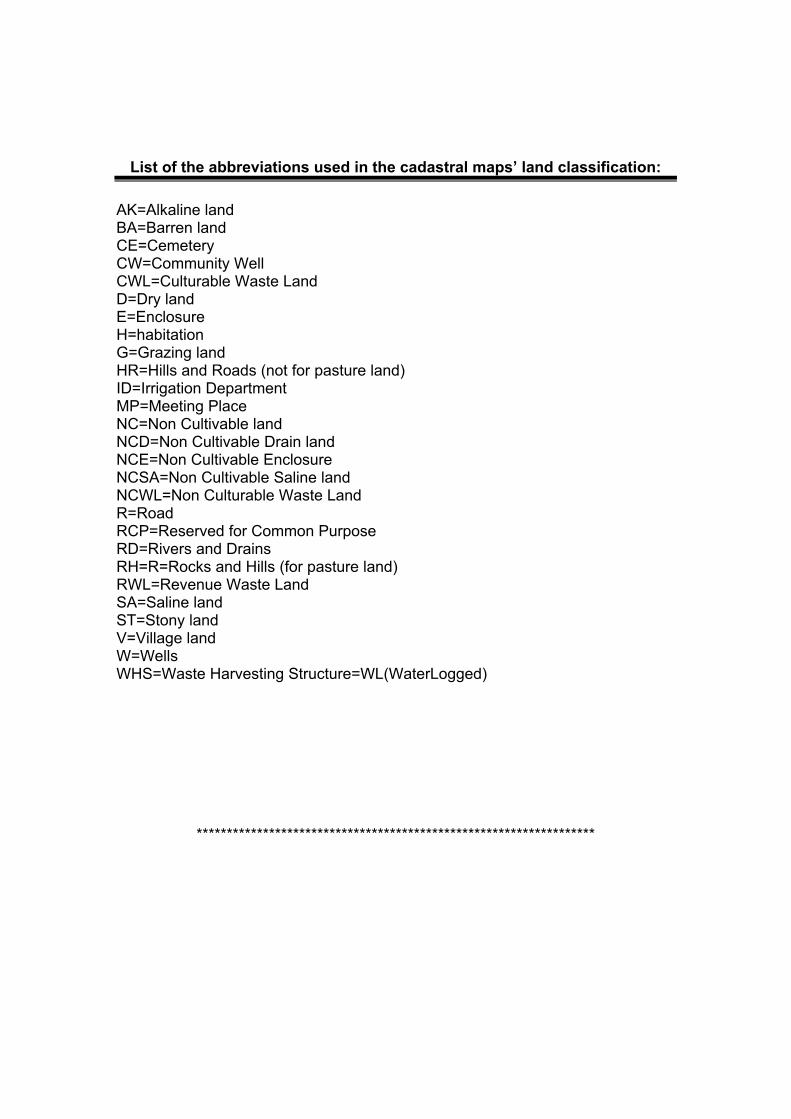
List of the abbreviations used in the cadastral maps’ land classification:
AK=Alkaline land BA=Barren land CE=Cemetery CW=Community Well CWL=Culturable Waste Land D=Dry land E=Enclosure H=habitationG=Grazing landHR=Hills and Roads (not for pasture land) ID=Irrigation Department MP=Meeting Place NC=Non Cultivable land NCD=Non Cultivable Drain land NCE=Non Cultivable Enclosure NCSA=Non Cultivable Saline land NCWL=Non Culturable Waste Land R=RoadRCP=Reserved for Common Purpose RD=Rivers and Drains RH=R=Rocks and Hills (for pasture land) RWL=Revenue Waste Land SA=Saline land ST=Stony land V=Village land W=WellsWHS=Waste Harvesting Structure=WL(WaterLogged)
******************************************************************

The views expressed in this document are solely of the authors and do not necessarily reflect the views of FES.
Maps are not to scale. Maps and associated data have been used only for representative purposes and do not, in any manner, imply the expression of any opinion whatsoever concerning the legal or constitutional status of any State, district or administrative boundary.
Reproduction and dissemination of material in this publication for educational or other non commercial purposes is authorized without prior written permission from the copyright holders, provided the source is fully acknowledged.

PB No. 29, Anand – 388001, Gujarat, INDIA. Phone: +91 (2692) 261402, 261238, 261239
Fax: +91 (2692) 262087 Email: [email protected]://iasc2011.fes.org.in/