odot/fhwa stewardship oversight committee meeting gary bowling (odot) and tim rogers (fhwa) may 29,...
TRANSCRIPT

ODOT/FHWA Stewardship Oversight Committee Meeting
Gary Bowling (ODOT) and Tim Rogers (FHWA)
May 29, 2012
Bridge Program Performance Measure Overview

Bridge Program Area
FHWA Lead – Tim Rogers ODOT Lead – Bruce Johnson “Bridge” Performance and Compliance
Indicators address the following: Performance Indicators1 &2: Bridge
Condition Compliance Indicators 3 thru 5: Bridge
Inspection Performance Indicators 6 & 7: Bridge
Maintenance

Bridge Condition Performance Indicators
1. Percent of NHS bridges rated structurally and functionally deficient as measured by deck area
2. Percent of Non-NHS bridges rated structurally and functionally deficient as measured by deck area
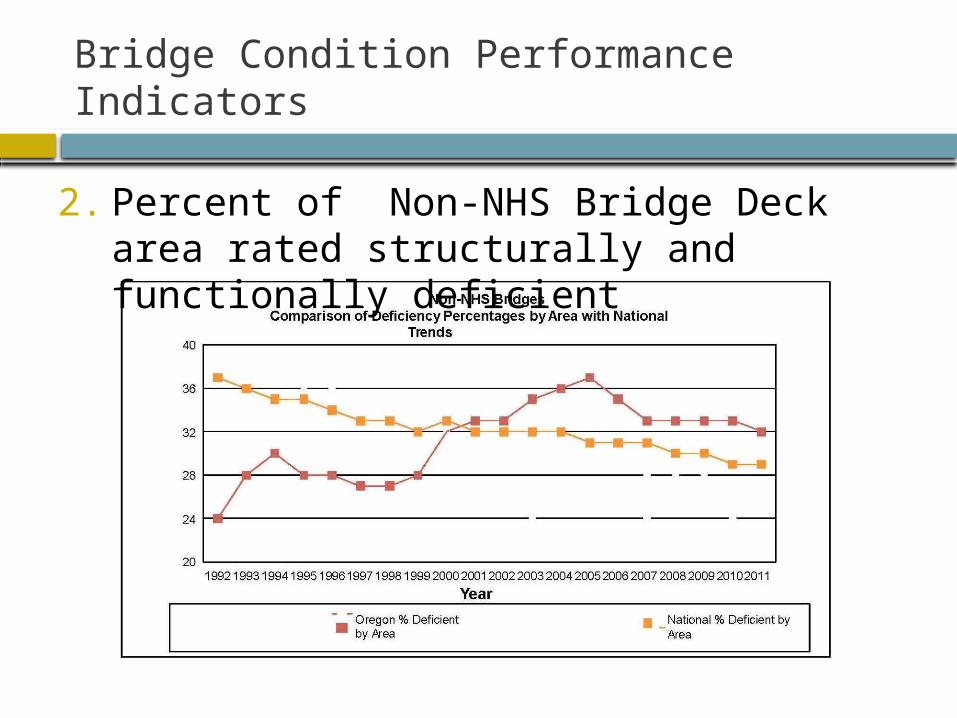
Structurally Deficient = Structural Components are in “Poor” or worse condition or the “Structural Evaluation” or “Waterway Adequacy” is intolerable.
Functionally Deficient = Deck geometry, load carrying capacity, clearance, or approach roadway alignment no longer meets the criteria for the system.

Bridge Condition Performance Indicators
1. Percent of NHS Bridge Deck area rated structurally and functionally deficient
Bridge Condition Performance Indicators
2. Percent of Non-NHS Bridge Deck area rated structurally and functionally deficient
Bridge Inspection Program Compliance Indicators
3. Percent of routine bridge inspections completed within the established bridge inspection cycle
24 month inspection cycle
4. Percent of fracture critical bridge inspections completed within the established bridge inspection cycle
24 month inspection cycle
5. Percent of underwater bridge inspections completed within the established bridge inspection cycle
60 month inspection cycle
Bridge Inspection Program Compliance Indicators
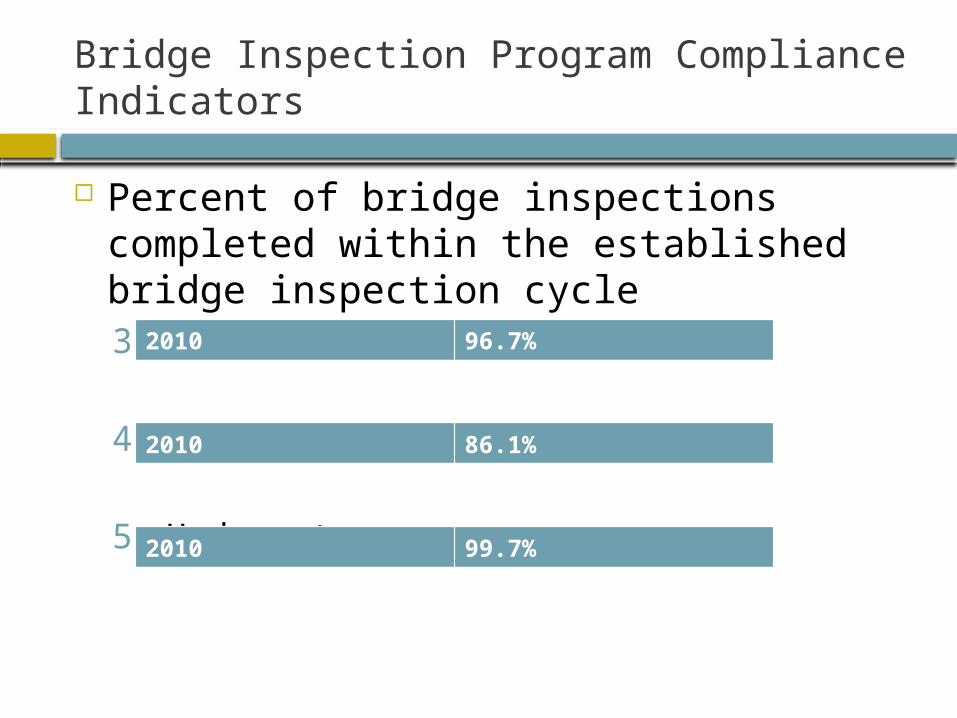
Percent of bridge inspections completed within the established bridge inspection cycle3. Routine Inspections
4. Fracture Critical
5. Underwater
2010 96.7%
2010 86.1%
2010 99.7%

Bridge Maintenance Performance Indicators
6. Number of “urgent” maintenance recommendations not resolved after 12 months
Needs to be repaired ASAP to address a specific traffic safety concern.
Structural component rated in Poor Condition
7. Number of “critical” maintenance recommendations not resolved after 12 months
Needs to be repaired to prevent structure from being load posted.
Structural Component rated in Serious Condition
Bridge Maintenance Performance Indicators
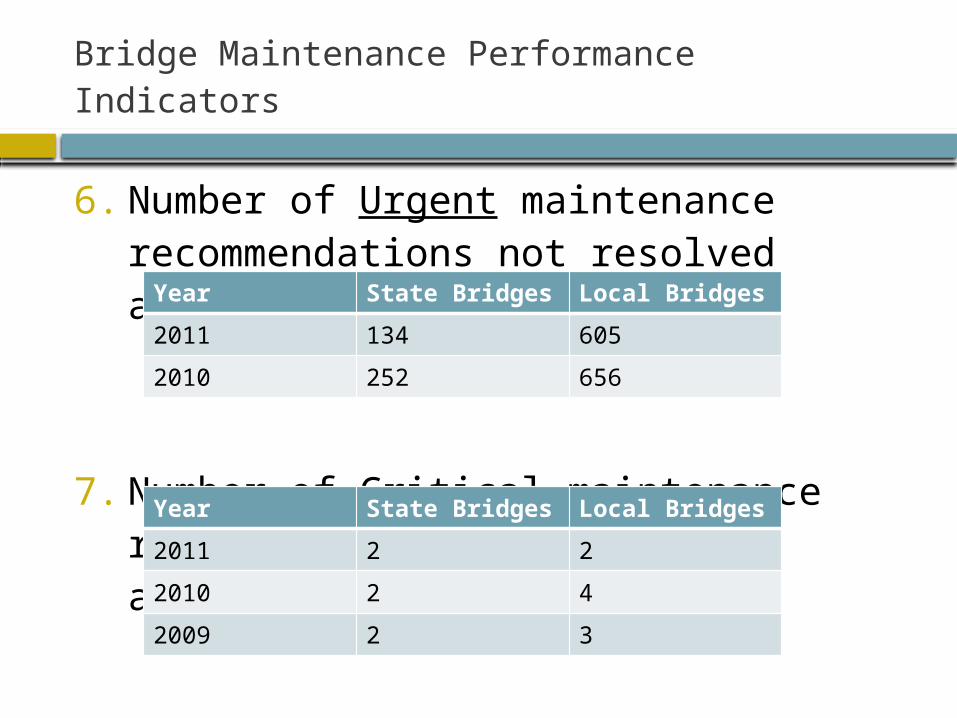
6. Number of Urgent maintenance recommendations not resolved after 12 months
7. Number of Critical maintenance recommendations not resolved after 12 months
Year State Bridges Local Bridges
2011 134 605
2010 252 656
Year State Bridges Local Bridges
2011 2 2
2010 2 4
2009 2 3

Future Changes to Bridge Program Performance Indicators?
Bridge Inspection Program Compliance Indicators Incorporate the results of the annual National Bridge
Inspection Program (NBIP) compliance reviews: % of NBIP Metrics in Satisfactory Performance Level % of NBIP Metrics in Actively Improving Performance Level % of NBIP Metrics in Unsatisfactory Performance Level
Delete the following:3. Percent of routine bridge inspections completed within
the established bridge inspection cycle4. Percent of fracture critical bridge inspections completed
within the established bridge inspection cycle5. Percent of underwater bridge inspections completed
within the established bridge inspection cycle
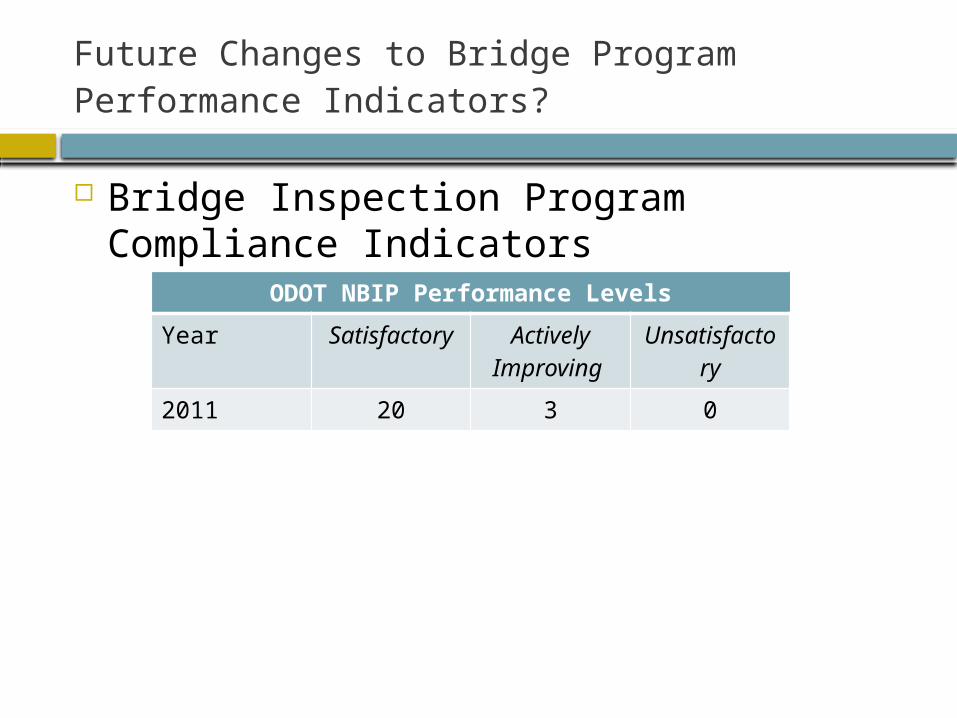
Future Changes to Bridge Program Performance Indicators?
Bridge Inspection Program Compliance Indicators
ODOT NBIP Performance Levels
Year Satisfactory
Actively Improving
Unsatisfactory
2011 20 3 0
Bridge Program Performance Measure Overview
Questions?