ocular hemodynamics during induced ocular hypertension in man
TRANSCRIPT

OCULAR HEMODYNAMICS DURING INDUCED OCULAR HYPERTENSION IN MAN
MILTON BEST, M.D., AND HIDENAO TOYOFUKU, M.D. New York, New York
When ocular hypertension is induced in experimental animals, fiuorescein angiog-raphy demonstrates that this markedly decreases the velocity of blood flow in the retina and choroid, especially as diastolic pressure is approached within the eye.1·2 Ernest and Potts3 reported, however, that the choroidal vasculature was more susceptible than the retinal circulation to elevated intraocular pressure. Further, Swietliczko and David2
report that the peripapillary choroid and optic disk vessels, in particular, demonstrate a marked susceptibility to ocular hypertension. At levels of intraocular pressure that were equal to or exceeded diastolic pressure, the peripapillary choroid remained ischémie while the remainder of the choroid fluor-esced.
Fiuorescein angiographie studies in man reveal a similar differential susceptibility of the retinal and choroidal circulations to elevated intraocular pressures.4"8 Small elevations of intraocular poressure delay peak fluorescence in the peripapillary choroid to a significantly greater extent than in the retinal circulation.7 At levels of intraocular pressure just below systolic ophthalmic artery pressure, fiuorescein proceeds slowly through the retinal arteries and capillaries while the choroidal vasculature does not fluoresce.4"6 Although these studies demonstrate that the choroid is more susceptible to elevated intraocular pressure, they have not quantitated the hemodynamic effects of changes in intraocular pressure in man. In
From the Department of Ophthalmology, New York Medical College, Center for Chronic Disease, and the Bird S. Coler Hospital, Welfare Island, New York. This study was supported by Public Health Service Grants HE13660-0S and 69-869 from the American Heart Association.
Reprint requests to Milton Best, M.D., New York Medical College, Center for Chronic Disease, New York, New York 10017.
view of the increasing evidence that alterations in ocular blood flow are of great importance in the pathogenesis of glaucomatous optic atrophy, this investigation was undertaken to study the quantitative effects of elevated intraocular pressure on retinal and choroidal blood flow in man.
MATERIALS AND METHODS
Nine normotensive subjects with normal ocular examinations were selected for study. They ranged in age from 21 to 60 years. Routine fiuorescein angiography was performed on each patient after intravenous injection of 5 ml of 10% fiuorescein. On three or four successive days, fiuorescein angiography was repeated on each patient at three preselected elevated levels of intraocular pressure.
An automatic suction ophthalmodyna-mometer was used to increase intraocular pressure to the desired level.8 On each visit, intraocular pressure was measured by appla-nation tonometry and the pupil was dilated with 10% phenylephrine and 2% cyclopento-late HC1. The temporal conjunctiva was then anesthetized with a cotton-tipped applicator soaked with proparacaine HC1. A suction cup was applied to the anesthetized area and held in place by creating a small amount of suction with the ophthalmodynamometer. The disk was visualized through the Zeiss fundus camera and the amount of suction required to produce diastolic pulsation and systolic collapse of the central retinal artery was determined. These values were converted to intraocular pressure using previously established calibration charts for the suction cup used in this study.9
Introacular pressure was then established at 40, 60, or 80 mm Hg by creating an appropriate amount of suction. While intraocular pressure was maintained at this level, flu-
932
VOL. 74, NO. 5 OCULAR HEMODYNAMICS 933
orescein was injected and angiograms were recorded over a one- to two-minute period. At the termination of angiography, the suction cup was removed and intraocular pressure was immediately measured to assure that no ocular hypertensive response had occurred to the cycloplegic agent.
The timing and sequence of filling in the fundus vasculature was determined at each level of intraocular pressure. The earliest appearance of dye in the central retinal artery and in the major temporal retinal veins was noted and the difference between these represented the retinal transit time. The same retinal vein was used for this measurement in each angiography series. Retinal venous filling time was calculated from the first appearance of dye in the major temporal veins to full fluorescence of these veins.
The difference in timing of the first appearance of dye in the choroidal vasculature and in the central retinal artery was termed the choroidal delay. A negative number indicated that fluorescence occurred in the cho-roid prior to the central retinal artery. Transit time through the choroidal circulation was estimated by noting the earliest appearance of dye in the choroid and the time of peak background fluorescence. In most patients, the earliest appearance of dye in the choroid occurred in a mottled pattern that is characteristic of early choriocapillaris fluorescence. In some patients a distinct choroidal arterial phase could be seen and this was used as the point of initial choroidal fluorescence. The difference in timing between this early appearance of dye in the choroid and peak background choroidal fluorescence was used as an indication of choroidal transit time.
RESULTS
Table 1 lists the results of angiography in each patient. Table 2 lists the mean values and standard errors of the critieria described above at each intraocular pressure studied.
At normal levels of intraocular pressure, dye first appeared in the choroidal vascula
ture prior to or simultaneously with its appearance in the central retinal artery in eight of the nine patients. In most patients, full choroidal fluorescence coincided with late venous fluorescence, and, therefore, choroidal transit time, as defined in this study, was considerably longer than retinal transit time.
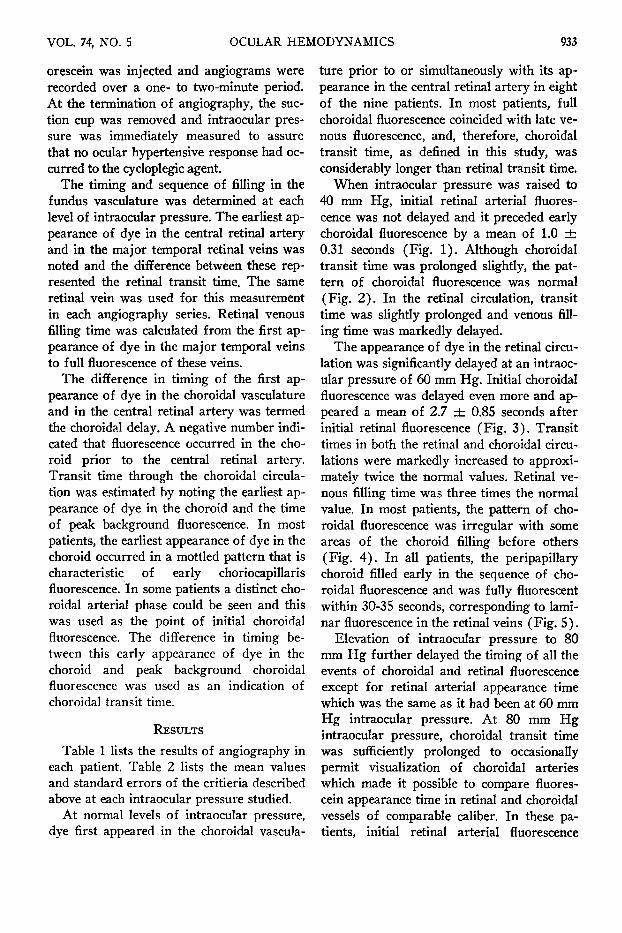
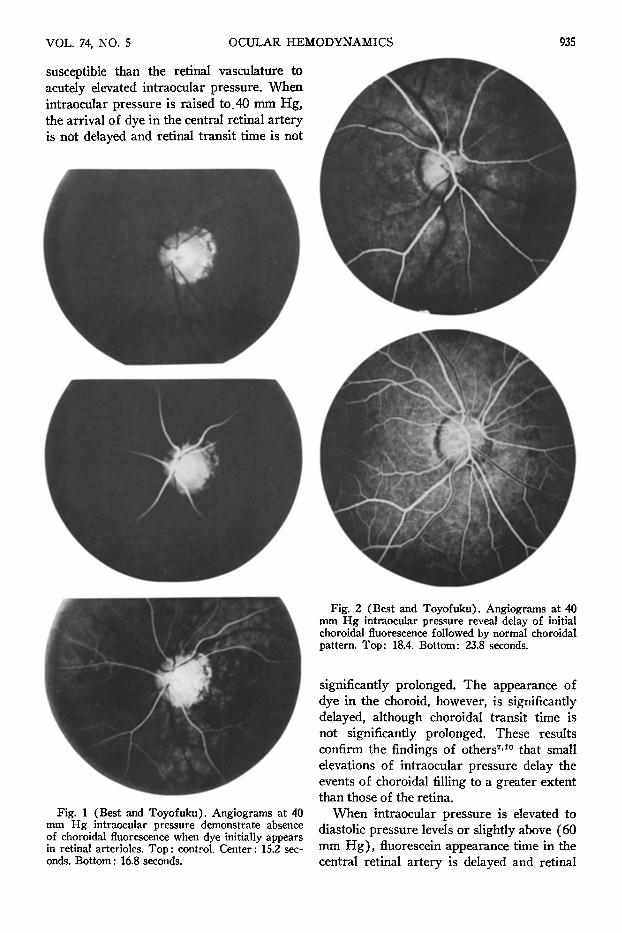
When intraocular pressure was raised to 40 mm Hg, initial retinal arterial fluorescence was not delayed and it preceded early choroidal fluorescence by a mean of 1.0 ± 0.31 seconds (Fig. 1). Although choroidal transit time was prolonged slightly, the pattern of choroidal fluorescence was normal (Fig. 2 ) . In the retinal circulation, transit time was slightly prolonged and venous filling time was markedly delayed.
The appearance of dye in the retinal circulation was significantly delayed at an intraocular pressure of 60 mm Hg. Initial choroidal fluorescence was delayed even more and appeared a mean of 2.7 ± 0.85 seconds after initial retinal fluorescence (Fig. 3) . Transit times in both the retinal and choroidal circulations were markedly increased to approximately twice the normal values. Retinal venous filling time was three times the normal value. In most patients, the pattern of choroidal fluorescence was irregular with some areas of the choroid filling before others (Fig. 4) . In all patients, the peripapillary choroid filled early in the sequence of choroidal fluorescence and was fully fluorescent within 30-35 seconds, corresponding to laminar fluorescence in the retinal veins (Fig. 5).
Elevation of intraocular pressure to 80 mm Hg further delayed the timing of all the events of choroidal and retinal fluorescence except for retinal arterial appearance time which was the same as it had been at 60 mm Hg intraocular pressure. At 80 mm Hg intraocular pressure, choroidal transit time was sufficiently prolonged to occasionally permit visualization of choroidal arteries which made it possible to compare fluores-cein appearance time in retinal and choroidal vessels of comparable caliber. In these patients, initial retinal arterial fluorescence

934 AMERICAN JOURNAL OF OPHTHALMOLOGY NOVEMBER, 1972
TABLE 1 RESULTS OF FLUORESCEIN ANGIOGRAPHY*
Case No. and Age in Years
1. 45
2. 24
3. 24
4. 60
5. 42
6. 26
7. 24
8. 21
9. 30
Systemic Blood
Pressure (in mm Hg)
120/80
126/72
124/88
126/84
132/88
110/80
116/66
150/80
118/70
Ophthalmic Artery
Pressure (in mm Hg)
92/52
96/48
92/58
104/58
108/60
88/50
90/47
110/57
91/48
Intraocular Pressure
(in mm Hg)
15 40 60 80 15 40 60 80 15 40 80 13 40 60 80 20 40 60 20 40 60 11 40 60 16 40 60 12 40 60
Arterial Appear
ance
13.8 13.4 17.7 21.0 16.5 19.0 18.4 18.0 15.0 17.2 18.7 15.8 15.8 18.4 19.0 20.2 17.1 21.5 11.9 12.3 18.4 16.2 19.0 20.1 17.0 11.8 18.9 11.5 14.0 17.0
Retina
Early Venous
Appearance
16.1 18.0 24.8 35.8 18.6 21.6 23.3 28.3 18.2 19.3 31.0 18.4 19.0 24.5 25.2 24.2 22.5 27.8 14.2 14.9 36.2 19.0 22.6 28.2 20.0 16.4 27.8 13.9 18.1 24.1
Late Venous Filling
21.5 26.0 41.8 64.1 22.7 25.6 27.7 36.4 24.6 30.0 53.5 21.8 24.5 34.0 40.0 36.2 44.0 47.2 18.1 20.9 61.1 23.5 30.8 58.7 26.4 27.8 51.3 19.4 24.0 37.2
Choroid
Initial Fluores
cence
13.8 15.0 20.5 24.6 16.7 19.4 19.4 21.0 15.0 18.4 21.1 15.1 15.8 20.4 22.6 19.5 17.1 21.5 12.5 13.4 26.2 16.7 19.0 21.2 16.6 13.6 22.0 11.5 16.6 19.7
Maximum Fluores
cence
24.6 28.1 38.6 68.0 22.7 28.0 29.9 33.5 20.6 23.8 38.9 20.2 21.9 31.2 32.6 27.9 24.5 29.3 18.1 21.0 54.7 23.5 27.2 40.0 23.5 22.8 34.0 17.5 29.5 32.8
* Time stated in seconds.
preceded chorodial arterial fluorescence by at least 2.5 seconds (Figs. 6-A and B) . The choriocapillaris subsequently filled in a splotchy pattern, initially in the vicinity of the disk (Fig. 6-C). In all patients, complete fluorescence of the peripapillary choroid oc
curred when laminar fluorescence was visible in the retinal veins (Fig. 6-D).
DISCUSSION
This study indicates that in the normal human eye the choroidal circulation is more
Intraocular Pressure
(in mm Hg)
15.2±1.05 40 60 80
Appearance Time
15.3+0.89 15.5+0.92 18.8+0.50 19.2+0.64
TABLE 2 SUMMARY OF OCULAR HEMODYNAMICS*
Retina
Transit Time
2.8+0.22 3.6 + 0.37 8.3 + 1.43
10.9 + 1.82
Venous Filling Time
5.7+0.86 9.0 + 1.76
17.8+3.04 18.7+4.6
Choroid
Delay
-0 .2+0.14 1.0 + 0.31 2.7+0.85 3.2+0.29
Transit Time
6.78+0.66 8.7 +0.90
14.9 ±2.35 20.9 ±7.67
* Time stated in seconds.
VOL. 74, NO. 5 OCULAR HEMODYNAMICS
susceptible than the retinal vasculature to acutely elevated intraocular pressure. When intraocular pressure is raised to.40 mm Hg, the arrival of dye in the central retinal artery is not delayed and retinal transit time is not
Fig. 2 (Best and Toyofuku). Angiograms at 40 mm Hg intraocular pressure reveal delay of initial choroidal fluorescence followed by normal choroidal pattern. Top: 18.4. Bottom: 23.8 seconds.
Fig. 1 (Best and Toyofuku). Angiograms at 40 mm Hg intraocular pressure demonstrate absence of choroidal fluorescence when dye initially appears in retinal arterioles. Top : control. Center : 15.2 seconds. Bottom : 16.8 seconds.
significantly prolonged. The appearance of dye in the choroid, however, is significantly delayed, although choroidal transit time is not significantly prolonged. These results confirm the findings of others7'10 that small elevations of intraocular pressure delay the events of choroidal filling to a greater extent than those of the retina.
When intraocular pressure is elevated to diastolic pressure levels or slightly above (60 mm Hg) , fluorescein appearance time in the central retinal artery is delayed and retinal
935

936 AMERICAN JOURNAL OF OPHTHALMOLOGY NOVEMBER, 1972
transit time is prolonged significantly. Similar but more marked effects are produced in the choroid. At this level of intraocular pressure, the early pattern of choroidal fluores-
Fig. 3 (Best and Toyofuku). Angiograms at 60 mm Hg intraocular pressure reveal a delay in choroidal fluorescence so that dye appears in retinal arterioles (Top: 18.0 seconds) before initial choroidal fluorescence (Bottom: 20.2 seconds).
77m T^
Fig. 4 (Best and Toyofuku). Angiograms at 60 mm Hg intraocular pressure demonstrate an irregular pattern of early choroidal fluorescence followed by diffuse choroidal filling. Top: 26.6 seconds. Center: 29.6 seconds. Bottom: 42.3 seconds.

VOL. 74, NO. 5 OCULAR HEMODYNAMICS 937
cence is irregular but the peripapillary choroid is completely fluorescent within 35 seconds. At levels of intraocular pressure as high as 80 mm Hg, when choroidal circulation is markedly slowed, peripapillary choroidal fluorescence is well advanced while other scattered areas of choroid contain no dye. These results demonstrate that the peripapillary choroidal capillaries are perfused at a relatively high pressure. Since the peripapillary choroid supplies blood to the pre-
Fig. S (Best and Toyofuku). Angiograms at 60 mm Hg demonstrate that peripapillary choroid fills early in sequence of choroidal fluorescence (Top: 22.1 seconds) and is fully fluorescent in early retinal venous phase (Bottom: 25.7 seconds).
laminar portion of the optic nerve,2-4 it would appear that nourishment to the optic nerve head can be maintained over a wide range of intraocular pressures in the normal eye.
Similar angiographie studies6'11·12 in patients with glaucomatous damage to the optic nerve have demonstrated defects in perfusion of the peripapillary choroid at 60 mm Hg intraocular pressure and higher. These areas of choroidal nonfluorescence are sharply outlined and are located adjacent to the disk margin. Similar defects in peripapillary choroidal fluorescence have not been found in normal eyes in previous studies4"8
or in the present study at intraocular pressures as high as 80 mm Hg. It is possible that these perfusion defects in the peripapillary choroid in glaucomatous eyes result from the development of a mechanism that shunts blood away from the peripapillary choroid at elevated intraocular pressures. A possible pathway for such a shunt has been demonstrated by silicone injection studies in monkeys which demonstrate retrograde branches from the short posterior ciliary arteries and peripapillary choroid to the network of vessels in the pia mater.14'15 If a similar shunt pathway exists in man, it might be activated by chronic ocular hypertension.
The present study also demonstrates that, in man, the effect of actuely elevated intraocular pressure on the ocular circulation differs in a number of important ways from that previously described in the monkey eye.2
In man and in the monkey, at normal intraocular pressures, fluorescein appears in the choroid prior to its appearance in the central retinal artery. When introacular pressure is elevated to 40 mm Hg or higher in the human eye, the appearance of dye in the choroidal circulation is delayed to a much greater extent than in the central retinal artery. At diastolic pressure levels, for example, fluorescence of the central retinal artery occurs a mean of 2.7 seconds before dye appears in the choroid. In the monkey eye, similar intraocular pressure levels delay initial fluorescence in the retinal circulation to a

938 AMERICAN JOURNAL OF OPHTHALMOLOGY NOVEMBER, 1972
Fig. 6 (Best and Toyofuku). Angiograms at 80 mm Hg intraocular pressure reveal a marked delay in choroidal fluorescence which permits visualization of a choroidal arterial phase. Dye initially appears in retinal arterioles (Top left: 21.0 seconds) well before its appearance in choroidal vessels of comparable caliber (Top right: 23.9 seconds). Initial fluorescence of the choriocapillaris occurs in a splotchy pattern near the disk (Bottom left: 35.8 seconds). Complete fluorescence of the peripapillary choroid occurs when laminar flow is visible in the retinal veins (Bottom right : 47.5 seconds).
greater extent than in the choroid, so that at diastolic pressure levels choroidal fluorescence precedes retinal fluorescence by a mean of 1.5 seconds. In addition, in monkey eyes the peripapillary choroid is markedly susceptible to acutely elevated intraocular pressure in comparison to the remainder of the choroid. When intraocular pressure is elevated to 40 mm Hg or higher in these eyes,
fluorescein angiography demonstrates a crescent or ring of ischémie choroid adjacent to or surrounding the disk. In the normal human eye, however, a similar area of juxta-papillary ischémie choroid was not demonstrated in this study at intraocular pressures as high as 80 mm Hg.
The differences in the effect of elevated intraocular pressure on hemodynamics in

VOL. 74, NO. S OCULAR HEMODYNAMICS 939
human and monkey eyes cannot be explained on the basis of different ophthalmic artery blood pressures, since ophthalmodynamom-etry has shown that diastolic and systolic pressure levels are similar in the two species. The ischémie ring of peripapillary choroid found in monkey eyes at elevated levels of intraocular pressure has been attributed to an "all or none" closure of major choroidal feeding vessels to the peripapillary tissue.2
This could result from the activation of shunt pathways of relatively low resistance from the ciliary vasculature to the pial network of vessels.14'15 In the normal human eye, similar shunt pathways are apparently not readily available so that acutely elevated intraocular pressure does not produce juxta-papillary choroidal ischemia.
SUMMARY
The effects of induced ocular hypertension on. ocular hemodynamics were studied in normal subjects by performing fluorescein angiography at intraocular pressures of 15, 40, 60 and 80 mm Hg. Although the velocity of blood flow is reduced in both the choroidal and retinal circulations by elevated intraocular pressure, fluorescein appearance time is dealyed to a greater extent in the choroid than the retina. The most marked effects occur when intraocular pressure exceeds diastolic ophthalmic artery blood pressure, resulting in irregular or splotchy patterns of early choroidal fluorescence.
In contrast to previous descriptions in monkey eyes, the present study demonstrates that in the normal human eye, the peripapillary choroidal capillaries are perfused at a relatively high pressure and fluoresce completely at intraocular pressures as high as 80 mm Hg.
R E F E R E N C E S 1. Dollery, C. T., Henkind, P., Kohner, E. M.,
and Paterson, J. W. : Effect of raised intraocular pressure on retinal and choroidal circulation. Invest. Ophth. 7:191, 1968.
2. Swietliczko, I., and David, N. J. : Fluorescein angiography in experimental ocular hypertension. Am. J. Ophth. 70:351, 1970.
3. Ernest, J. T., and Potts, A. M. : Pathophysiol-ogy of the distal portion of the optic nerve. II. Vascular relationships. Am. J. Ophth. 66:380, 1968.
4. Blumenthal, M., Gitter, K. A., Best, M., and Galin, M. A. : Fluorescein angiography during induced ocular hypertension in humans. Am. J. Ophth. 69:39, 1970.
5. Blumenthal, M., Best, M., Gitter, K. A., and Galin, M. A. : Studies in ocular circulation. An analysis of the effect of induced ocular hypertension on retinal and choroidal blood flow in humans. Am. J. Ophth. 71:819, 1971.
6. Best, M., Galin, M. A., Toyofuku, H., and Blumenthal, M. : Differential fluorescein angiography of the ocular fundus. Ann. Ophth. 4:189, 1972.
7. Rosen, E. S. and Boyd, T. A. S. : New method of assessing choroidal ischemia in open angle glaucoma and ocular hypertension. Am. J. Ophth. 70: 912, 1970.
8. Galin, M. A., Baras, I., and Best, M. : Suction ophthalmodynamometry. Tr. Am. Acad. Ophth. Otolaryng. 73:335, 1969.
9. Galin, M. A., Baras, I., and Cavero, R. : Ophthalmodynamometry using suction. Arch. Ophth. 81:494, 1969.
10. Spaeth, G. L. : Fluorescein angiography in the diagnosis and management of patients suspected of having glaucoma. Read before the Spring meeting of the Association for Research in Vision and Ophthalmology, Sarasota, April 28, 1971.
11. Blumenthal, M., Best, M., Galin, M. A. and Toyofuku, H. : Peripapillary choroidal circulation in glaucoma. Arch. Ophth. 8:31, 1971.
12. Best, M., Blumenthal, M., Galin, M. A., and Toyofuku, H. : Fluorescein angiography during induced ocular hypertension in glaucoma. Brit. J. Ophth. 56:6, 1972.
13. Hayreh, S. S. : Pathogenesis of visual field defects. Role of the ciliary circulation. Brit. J. Ophth. 54:289, 1970.
14. Anderson, D. R. : Vascular supply to the optic nerve of primates. Arch. Ophth. 70:341, 1971.
15. Hayreh, S. S. : Blood supply of the optic nerve head and its role in optic atrophy, glaucoma, and oedema of the optic disc. Brit. J. Ophth. 53 : 721, 1969.